effect of financial risks on market ... public manufacturing companies in kenya and to establish the...
TRANSCRIPT
© Bwari, Oluoch ISSN 2412-0294 2011
http://www.ijssit.com Vol III Issue III, May 2017
ISSN 2412-0294
EFFECT OF FINANCIAL RISKS ON MARKET PERFORMANCE OF PUBLIC
MANUFACTURING COMPANIES IN KENYA
1* Martha Bwari Agura
Jomo Kenyatta University of Agriculture and Technology
2** Dr. Oluoch J. Oluoch
Jomo Kenyatta University of Agriculture and Technology
ABSTRACT
Financial risk management of public manufacturing companies listed in Kenya is considered by
researchers as a yard stick for determining failure or success of these institutions. Across the
manufacturing industry, the most prominent area that erodes the mass of their profit is risk
management. The study aimed at studying the effect of financial risks on market performance of
public manufacturing companies in Kenya. Its specific objectives included: Determining the
effects of default risk on the market performance of public manufacturing companies in Kenya;
to evaluate the effects of interest rate risk on the market performance of public manufacturing
companies in Kenya; to find out the effects of foreign exchange risk on the market performance
of public manufacturing companies in Kenya and to establish the effects of liquidity risk on the
market performance of public manufacturing companies in Kenya. The study adopted the
descriptive survey within manufacturing companies at the Nairobi Securities Exchange from
January 2008 to December 2016. In sampling and sampling design, a purposive sampling
technique was employed. Secondary data which included quarterly interest and exchange rates
from the Central Bank of Kenya, bad debts expenses expunged from financial statements of these
companies, quarterly cash balances and share prices were collected to determine the market
performance of these companies. The study employed a modified capital asset pricing model to
determine the effect of financial risks on market performance of these companies. SPSS and
Microsoft Excel were used in the processing of data and the information generated was
presented in the form tables. The study found that default rate risk, the credit rate risk and the
exchange rate risk had negative significant effects on market performance of manufacturing
companies in Kenya. On the other hand, the interest rate risk was found to have a positive
significant effect on market performance of manufacturing companies in Kenya.
Keywords: Financial Risks, Market Performance, Default Risk, Liquidity Risk, Exchange Rate
Risk, Interest Rate risk
© Bwari, Oluoch ISSN 2412-0294 2012
1.0 Introduction
The amount of risk in the financial system can
be thought of as the combined impact of the
different types of financial and economic
risks. To maintain the stability of the whole
financial system, it is important to ensure
continuous operations of key financial
markets, so that manufacturing firms and other
firms can have access to funding when
necessary. Several manufacturing firms have
either collapsed and or are facing near
collapse because of badly functioned financial
risks. Thus, their activities have reduced
because of their response to the perceived risk
making profits and returns to suffer. This has
led not only to liquidity and credit shortages
and a significance loss of public confidence in
the manufacturing sector but also the entire
financial system and the economy.
Poor management of financial risks, by
manufacturing companies, leads to
accumulation of claims from the clients hence
leading to increased losses and hence poor
market performance (Magezi, 2003). Financial
Risk management activities are affected by the
risk behavior of managers and the
administrators of companies. A vibrant risk
management framework can help
organizations to reduce their exposure to
financial risks, and enhance their market
performance (Iqbal and Mirakhor, 2007).
Further; it is argued that the selection of
financial risk tools tends to be associated with
the company’s calculative culture the
measurable attitudes that senior decision
makers display towards the use of financial
risk management models. While some
financial risk functions focus on extensive risk
measurement and risk based performance
management, others focus instead on
qualitative discourse and the mobilization of
expert opinions about emerging risk issues
(Mikes and Kaplan, 2014).
Financial risk can be used like an umbrella
term for many types of risk associated with
financing, including financial transactions that
include company loans in risk of default.
Jorion and Khoury (1996) illustrates that
financial risk arises from possible losses in
financial markets due to movements in
financial variables. It is usually associated
with leverage with the risk that obligations
and liabilities cannot be met with current
assets. The focus of this study used the term
financial risks to broadly cover default risk,
interest rate risk, foreign exchange risk and
liquidity risk. Financial risk may be caused by
variation in interest rates, currency exchange
rates, variation in market prices, default risk
and liquidity gap that affect the cash flows and
therefore its market performance and overall
affect the competitive ability of the
manufacturing companies. The Basel
committee defines credit risk as the potential
that a bank borrower or counterparty will fail
to meet its obligations in accordance with the
agreed terms (Basel committee, 2003).
Liquidity Risk arises due to insufficient
liquidity for normal operating requirements
reducing the ability of banks to meet its
liabilities when they fall due. Foreign
exchange risk can be defined as the risk of
loss when a bank in a foreign exchange
transaction pays the currency it sold but does
not receive the currency it bought. Foreign
exchange risk failures can arise from
counterparty default, operational problems,
market liquidity constraints and other factors.

© Bwari, Oluoch ISSN 2412-0294 2013
Market risk is the risk originating in
instruments and assets traded in well-defined
markets. (Brunnermeier and Pedersen, 2007)
Managing risk is part of every company’s
strategic and operational activities, and
analyzing risks is an important aspect of a
manager’s job. Risk management is the
process of monitoring risks and taking steps to
minimize their impact (Eichhorn, 2004).
Financial risk management is the task of
monitoring financial risks and managing their
impact. It is a sub-discipline of the wider
function of risk management and an
application of modern financial theory and
practice. Financial risk management falls
within the financial function of an
organization and is a reflection of the
changing nature of this function over time.
Traditionally, the financial function has been
seen in terms of financial reporting and
control. The modern approach is to consider
the financial function in terms of financial
policy and financial decision making. This
includes the management of the firm’s
operational, business and economic risks
(Moles, 2013)
Organizations that have financial risk
exposure have a possibility of loss but also an
opportunity for gain or profit. Financial risks
exposure may provide strategic or competitive
benefits to companies that critically analyze
their market performance. The main reasons
for managing financial risk are the same as
those for implementing a risk management, as
financial risk is a subcategory of the
company’s risks. One of the main objectives is
to reduce the volatility of earnings or cash
flows due to financial risk exposure (Dhanini
et al., 2007). The reduction enables the firm to
perform better forecasts (Drogt & Goldberg,
2008). Furthermore, this assures that sufficient
funds are available for investment and
dividends. Another argument for managing
financial risk is to avoid financial distress and
the costs connected with it (Triantis, 2000;
Drogt & Goldberg, 2008).
1.1 Statement of the Problem
The manufacturing sector in Kenya has been
ranked the second after agriculture in terms of
its contribution to GDP. In line with Kenya
Vision 2030, the manufacturing sector as one
of the key drivers for realizing a sustained
annual GDP growth of 10 per cent. The
manufacturing sector has high, yet untapped
potential to contribute to employment and
GDP growth. Compared to the agriculture
sector, which is greatly limited by land size,
the manufacturing sector has high potential in
employment creation and poverty alleviation
since it is less affected by land size (Bigsten et
al., 2010). The manufacturing sector in Kenya
however, faces some challenges that affect its
growth. According to KNBS report (2016) the
manufacturing sector in Kenya grew at 3.5%
in 2015 and 3.2% in 2014, contributing 10.3%
to Gross Domestic Product (GDP) (KNBS,
2016). On average, however, manufacturing
has been growing at a slower rate than the
economy, which expanded by 5.6% in 2015.
This implies that the share of manufacturing in
GDP has been reducing over time. Thus, it can
be argued that Kenya is going through
premature deindustrialization in a context
where manufacturing and industry are still
relatively under-developed. Kenya seems to
have ‘peaked’ at a point much lower than in
much of Asia.
© Bwari, Oluoch ISSN 2412-0294 2014
Financial risk has been termed among the
main factors affecting the growth of
manufacturing companies in Kenya. The risks
exposure in the Kenyan market include;
default risk, interest risk, credit risk and
market risk, Foreign exchange, Shape,
Volatility, Sector, Liquidity, Inflation risks
(Korir, 2010). The ever-rising inflation rates,
fluctuation of interest rate and exchange rate
in Kenya have been major factor to retardant
growth in the manufacturing industry in
Kenya. Various studies have been conducted
on risk management and its impact to
performance of business entities in Kenya.
Oluwafemi et al., (2014) did a study on risk
management and financial performance of
banks in Nigeria. The study focused on the
association of risk management practices and
bank financial performance in Nigeria.
Matthijs (2012) on the other hand conducted a
research on the financial performance and risk
profile of sustainable firms. The study
attempts to shed light on the prime question
why companies and investors commit
resources to sustainability efforts. Mohamad
et al., (2014) also did a study on Inverse
relationship of financial risk and performance
in commercial banks in Tanzania. The study
aimed to examine the simultaneous influence
of the financial risks and financial
performance of commercial banks in
Tanzania. Studies in Kenya have only focused
on risk management practices of firms in
general without being specific on the financial
risk management practices of manufacturing
industry.
In summary, there is lack of clarity as to how
default, interest rate, foreign exchange rate
and liquidity risks affect the market
performance of manufacturing companies in
Kenya. This study therefore aimed at filling
this gap by conducting a thorough study on
the effects of financial risks on the market
performance of manufacturing firms in Kenya.
1.2 Study Objectives
The overall objective of this study was to
determine the effect of financial risks on the
market performance of public manufacturing
companies in Kenya. The Specific Objectives
were to;
i. Determine the effect of default risk on
the market performance of public
manufacturing companies in Kenya.
ii. Evaluate the effect of interest rate risk
on the market performance of public
manufacturing companies in Kenya.
iii. Find out the effect of foreign exchange
rate risk on the market performance of
public manufacturing companies in
Kenya.
iv. Establish the effect of liquidity risk on
the market performance of public
manufacturing companies in Kenya.
1.3 Research Hypothesis
H01 - Default risk has no significant effect on
the market performance of public
manufacturing companies in Kenya.
H02 – Interest rate risk has no significant
effect on the market performance of public
manufacturing companies in Kenya.
H03– Foreign exchange risk has no significant
effect on the market performance of public
manufacturing companies in Kenya.
© Bwari, Oluoch ISSN 2412-0294 2015
H04– Liquidity risk has no significant effect on
the market performance of public
manufacturing companies in Kenya.
2.0 LITERATURE REVIEW
To understand the effects of financial risks on
market performance of public manufacturing
companies in Kenya, the study adopted two
theories to build up the theoretical literature;
2.1 Financial Distress Theory
Financial distress in enterprises has long been
an issue of concern to governments and the
investing public. Corporate financial
performance can deteriorate for several
reasons and in the extreme, may cause
companies to go bankrupt or be subject to
acquisition by other firms. Corporate
bankruptcies have significant adverse
consequences for an economy since investors
and creditors suffer considerable financial loss
(Ahsan et al., 2013).
2.2 The Random Walk Theory
The random walk hypothesis was postulated
by Fama (1965) which denoted that successive
values of a share are independent of each
other being random; and caused by changes in
stock information. Fama (1965) opined that a
random walk arises within the stochastic
model when the environment is such that the
evolution of an investor tastes and the process
generating new information combine to
produce equilibria in which return
distributions repeat themselves through time.
This argument seems to suggest that the more
random the price of a share, there is greater
evidence that available information about the
stock in the market has affected investor
perception, and buying and selling attitudes.
This indicates that higher levels of
randomness of stock prices evidences market
efficiency.
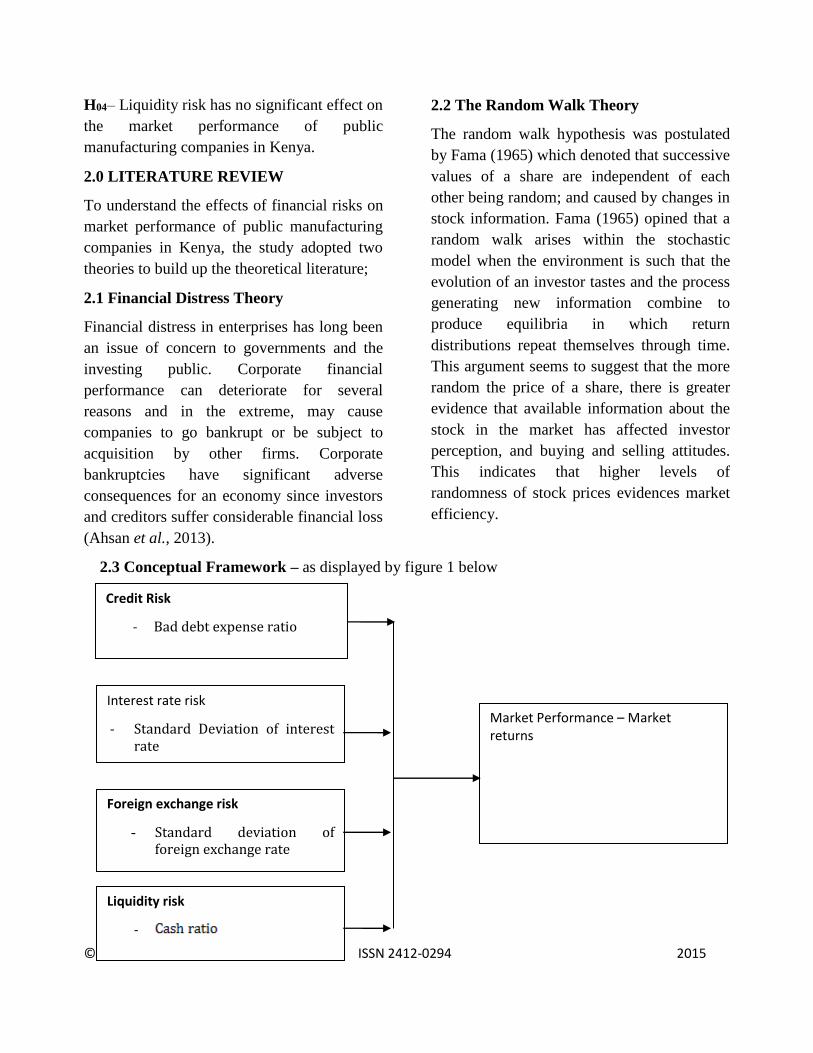
2.3 Conceptual Framework – as displayed by figure 1 below
Credit Risk
- Bad debt expense ratio
Market Performance – Market returns
Interest rate risk
- Standard Deviation of interest rate
Foreign exchange risk
- Standard deviation of foreign exchange rate
Liquidity risk
-

© Bwari, Oluoch ISSN 2412-0294 2016
3.0 Research Methodology
This study adopted a descriptive survey
research design. Descriptive design is the best
research in identifying phenomena in relation
to what, when, who, where and how in a study;
which is the phenomenon in this study. The
population of this study was all manufacturing
companies listed in Nairobi Securities
Exchange from January, 2008 to December
2016. The study preferred manufacturing
companies because they were not regulated by
any government or private organ and therefore
my findings could not be as a result of any
undue influence. A census survey of all the 10
firms was used to meet the data requirements
for hypothesis tests in this study. These
included Baumann company ltd, B.O.C.
Kenya, British American Tobacco, Carbacid
Investment Ltd, East African breweries,
Eveready East Africa, Kenya Orchards Ltd,
Mumias sugar Company, Unga group and
Flame tree group holdings. The study relied on
secondary data to assess the effect financial
risks on market performance of public
manufacturing companies in Kenya. The NSE-
20 share index was deemed appropriate for the
study. The secondary data entailed the
quarterly interest rates from the central bank of
Kenya, the quarterly exchange rates from
January 2008 to December 2016 from the
central bank of Kenya, the quarterly bad debt
expense from January 2008 to December 2016
from the financial statements of manufacturing
companies listed in Nairobi Securities
Exchange, and the quarterly share prices from
January 2008 to December 2016 from the
Nairobi Securities Exchange. The study
therefore employed a modified capital asset
pricing model which is an expression of
relative risk based on the variability of returns
of manufacturing companies being analyzed.
This model represents a potentially important
step forward in finance used to estimate a
stock’s required rate of return. CAPM assumes
investors prefer lower risk to higher risk when
facing a specific expected rate of return. A
modified version was developed which
includes two additional premiums that aids in
estimating the required rate of return. The
following equations will be used in guiding the
study. The model was specified in equation (i)
Where:
FRI stood for Financial Risk Indicators. These
indicators included Default Risk, Interest Rate
Risk, Foreign Exchange Risk, and Liquidity
Risk.
was the required return on stock, a variable
that was used to measure the market
performance of manufacturing companies in
Kenya. This is computed as reflected in
equation (ii)
Default Rate risk was a financial risk indicator
which is described as the chance that
companies or individuals will be unable to
meet the required payments on their debt
obligations. The Bad Debt ratio identified it.
Interest Rate Risk was also another financial
risk indicator. The study captured the effect of
interest rate as a measure of financial risk
because a change in interest rate could lead to a
mismatch between interest paid on deposit and

© Bwari, Oluoch ISSN 2412-0294 2017
the interest received on loans. The study
employed a 3-quarter moving standard
deviation and can be illustrated as in equation
(iv)
---------------------- (iv)
Foreign Exchange Risk is the risk of change in
the company`s future economic value due to
adverse foreign exchange rate movements. The
study arrived to the foreign exchange risk from
the 3-quarter moving standard deviation of
quarter Ksh/$ exchange rate from January 2008
to December 2016 as illustrated in equation (v)
(v)
Liquidity risk was considered as the risk that a
manufacturing company may be unable to meet
short term financial demands. . The study
measured liquidity risk on the cash ratio. This
is specified in equation (vi).
The study also considered the market risk and
the risk-free rate as shown in equations vii and
viii below.
----------- (vii)
-------------------- (viii)
A multiple regression model that relates the
dependent variable to the independent variables
was used. The model specified was used to
generate the coefficients to be tested using t-
statistics at 95% confidence interval. F-ration
was used alongside R2 to test the goodness of
fit of the model to data.
4.0 RESEARCH FINDINGS AND
DISCUSION
4.1 Findings of Descriptive Statistics
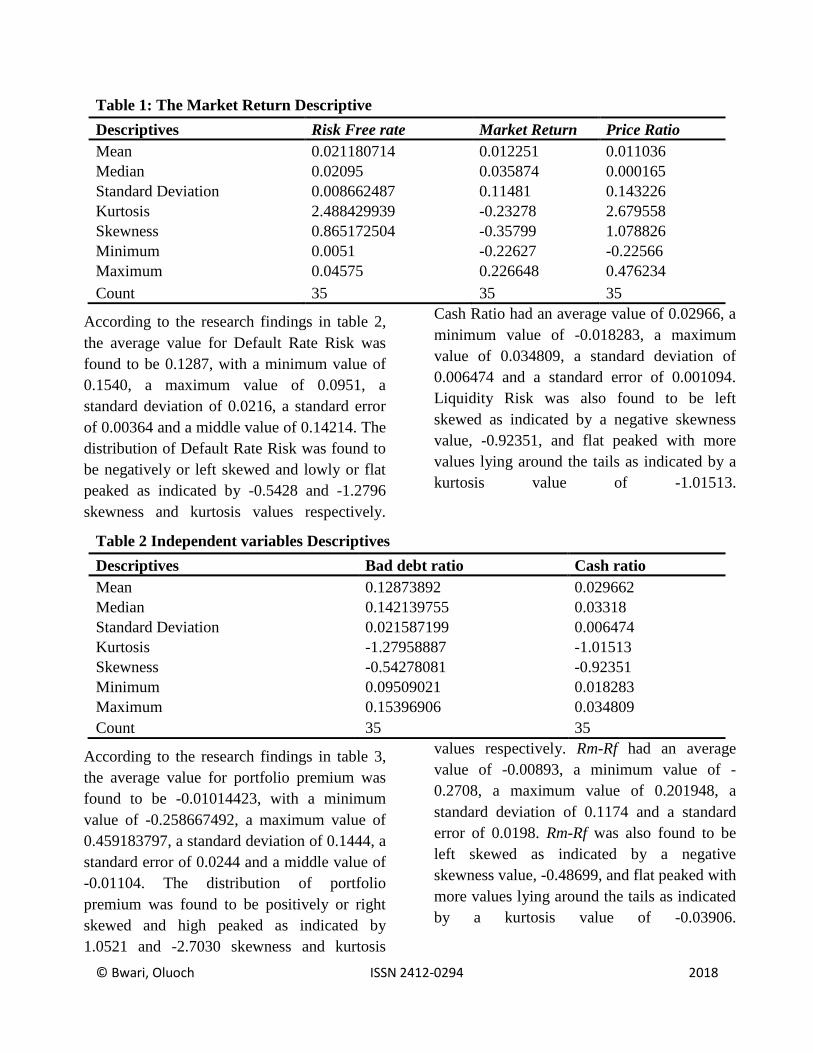
According to the research findings in table 1,
the average risk free was 0.0212, with a
minimum value of 0.0051, a maximum value
of 0.04575, a standard deviation of 0.0087 and
a standard error of 0.0015. The distribution of
risk free was found to be right skewed and
highly peaked as indicated by 0.8651 and
2.4884 skewness and kurtosis values
respectively. Market return had an average
value of 0.0123, a minimum value of -0.22627,
a maximum value of 0.226648, a standard
deviation of 0.11481 and a standard error of
0.0194. Market return was also found to be left
skewed as indicated by a negative skewness
value, -0.35799, and flat peaked with more
values lying around the tails as indicated by a
kurtosis value of -0.23278. Finally, for the PR,
the average value was found to be 0.01104
with the lowest value being -0.22566, the
highest value being 0.476234 leading to a small
range of 0.701896, a standard deviation of
0.1432, a middle value of 0.000165 and a
standard error of 0.02421. The distribution of
PR was found to be right skewed and highly
peaked as indicated by 1.0788 and 2.6800
skewness and kurtosis values respectively.
© Bwari, Oluoch ISSN 2412-0294 2018
Table 1: The Market Return Descriptive
Descriptives Risk Free rate Market Return Price Ratio
Mean 0.021180714 0.012251 0.011036
Median 0.02095 0.035874 0.000165
Standard Deviation 0.008662487 0.11481 0.143226
Kurtosis 2.488429939 -0.23278 2.679558
Skewness 0.865172504 -0.35799 1.078826
Minimum 0.0051 -0.22627 -0.22566
Maximum 0.04575 0.226648 0.476234
Count 35 35 35
According to the research findings in table 2,
the average value for Default Rate Risk was
found to be 0.1287, with a minimum value of
0.1540, a maximum value of 0.0951, a
standard deviation of 0.0216, a standard error
of 0.00364 and a middle value of 0.14214. The
distribution of Default Rate Risk was found to
be negatively or left skewed and lowly or flat
peaked as indicated by -0.5428 and -1.2796
skewness and kurtosis values respectively.
Cash Ratio had an average value of 0.02966, a
minimum value of -0.018283, a maximum
value of 0.034809, a standard deviation of
0.006474 and a standard error of 0.001094.
Liquidity Risk was also found to be left
skewed as indicated by a negative skewness
value, -0.92351, and flat peaked with more
values lying around the tails as indicated by a
kurtosis value of -1.01513.
Table 2 Independent variables Descriptives
Descriptives Bad debt ratio Cash ratio
Mean 0.12873892 0.029662
Median 0.142139755 0.03318
Standard Deviation 0.021587199 0.006474
Kurtosis -1.27958887 -1.01513
Skewness -0.54278081 -0.92351
Minimum 0.09509021 0.018283
Maximum 0.15396906 0.034809
Count 35 35
According to the research findings in table 3,
the average value for portfolio premium was
found to be -0.01014423, with a minimum
value of -0.258667492, a maximum value of
0.459183797, a standard deviation of 0.1444, a
standard error of 0.0244 and a middle value of
-0.01104. The distribution of portfolio
premium was found to be positively or right
skewed and high peaked as indicated by
1.0521 and -2.7030 skewness and kurtosis
values respectively. Rm-Rf had an average
value of -0.00893, a minimum value of -
0.2708, a maximum value of 0.201948, a
standard deviation of 0.1174 and a standard
error of 0.0198. Rm-Rf was also found to be
left skewed as indicated by a negative
skewness value, -0.48699, and flat peaked with
more values lying around the tails as indicated
by a kurtosis value of -0.03906.

© Bwari, Oluoch ISSN 2412-0294 2019
Table 3 Premium Descriptives
Descriptives Rp-Rf Rm-Rf
Mean -0.01014423 -0.00893
Median -0.011042942 0.014399
Standard Deviation 0.144357142 0.117372
Kurtosis 2.70295017 -0.03906
Skewness 1.052095064 -0.48699
Minimum -0.258667492 -0.27077
Maximum 0.459183797 0.201948
Count 35 35
According to the research findings in table 4,
the average value for Standard deviation of the
exchange rates was found to be -2.3459, with a
minimum value of 0.170141, a maximum
value of 7.134284, a standard deviation of
2.088877, and a standard error of 0.353085
and a middle value of 1.420332. The most
common value of Standard deviation of the
exchange rates was found to be 0.751683 and
the distribution was found to be positively or
right skewed and high peaked as indicated by
1.0990 and 0.0624 skewness and kurtosis
values respectively. Standard deviations of the
Interest rates had an average value of 0.5917, a
minimum value of 0.0265, a maximum value
of 2.5446, a standard deviation of 0.6514 and a
standard error of 0.1101. Standard deviations
of the Interest rates were found to be positively
or right skewed and high peaked as indicated
by 1.9970 and 3.5848 skewness and kurtosis
values respectively.
Table 4 Price Descriptives for Exchange rate and Interest rate volatility
Descriptives
Standard deviation
exchange rates
Standard deviation
interest rates
Mean 2.345852 0.591665
Median 1.420332 0.342977
Standard Deviation 2.088877 0.651426
Kurtosis 0.062393 3.584794
Skewness 1.098953 1.996994
Minimum 0.170141 0.026458
Maximum 7.134284 2.544648
Count 35 35
4.2 Financial Risks and Market Performance
4.2.1 Default Rate risk and market
performance
A multiple linear regression was performed
with Market Performance (Market returns) as
the dependent variable and Default Rate Risk
and market premium (Rm-Rf as the predictor
variables. The first output in table 5 was the
model summary which informed about fitness
of the model. The findings indicated that,
55.4850% of variation of the dependent
variable (Market performance) was explained
by the predictor variables, R2= 0.581034498;
adjusted R2 = 0.554849154. An ANOVA was
used to determine whether the model was

© Bwari, Oluoch ISSN 2412-0294 2020
significant in predicting the dependent variable.
Table 6 indicated that at 0.05 level of
significance the model significantly predicted
Market Performance, F (2, 32) =22.1893;
p=9.01E-07which is less than 0.05. The third
output on table 7, was the Coefficients of
Multiple Determinations of the Variables. This
showed which independent variables were
individually significant predictors of the
dependent variable. From table 4.5c, Rm-Rf
variables was found to be a significant predictor
of the market performance as indicated by a
significant p-value of 0.000000531 at 95%
confidence level (p=0.000000531<0.05).
However, Default Rate Risk was found to be a
non-significant predictor as indicated by an
insignificant p-value 0.184164
(p=0.184164>0.05). The predicted regression
model was given as follows:
Portfolio Premium = 0.133006366 +
0.889129424(Rm-Rf) - 1.050269534(DRR)
From the model, 0.133006366 is the value of
market performance holding all the other
variables zero. A one unit change in Rm-Rf
would change the value of market performance
by 0.889129424 and finally holding all other
factors constant, a one unit change in Default
Rate Risk, would change the value of market
performance by -1.050269534.this could
therefore indicate that Default rate risk holding
all other influencing factors constant may not
have a major effect on market performance.
The findings are illustrated in tables 5, 6, and 7.
Table 5 Model summary of Default risk and market performance
Regression Statistics
Multiple R 0.762256189
R Square 0.581034498
Adjusted R Square 0.554849154
Standard Error 0.096314545
Observations 35
Table 6 ANOVA Table for Default risk and market performance
df SS MS F Significance F
Regression 2 0.411678 0.205839 22.1893 9.01E-07
Residual 32 0.296848 0.009276
Total 34 0.708525
Table 7 Coefficients of Multiple Determinations of the Variables
Coefficients
Standard
Error t Stat P-value
Lower
95%
Upper
95%
Intercept 0.133006366 0.100756 1.320082 0.196173 -0.07223 0.33824
Rm-Rf 0.889129424 0.142311 6.247807 5.31E-07 0.599252 1.179007
BDR -1.05026953 0.77376 -1.35736 0.184164 -2.62637 0.525829

© Bwari, Oluoch ISSN 2412-0294 2021
4.2.2 Liquidity Risk and market
performance
A multiple linear regression was performed
with Market Performance (Market returns) as
the dependent variable and Rm-Rf and
Liquidity Risk as the predictor variables. The
findings in table 8 indicated that, approximately
19.8% of the variation in the dependent variable
(Market performance) was explained by the
predictor variables, R2= 0.2451; adjusted R2 =
0.1979. Following the model summary is the
analysis of variance (ANOVA) which was used
to determine whether the model was significant
in predicting the dependent variable Table 9
indicated that at 0.05 level of significance the
model significantly predicted Market
Performance, F (2, 32) =5.1950; p=0.011123
which is less than 0.05. The ANOVA is the
followed by the Coefficients of Multiple
Determinations table. This showed which
independent variables were individually
significant predictors of the dependent variable.
From table 10, Rm-Rf and credit risk variables
were found to be significant predictors of
market performance, t= 11.8509; p=0.009064;
CI [-0.13949, 0.156722] and t= -2.72484;
p=0.01034; CI [-111.884, -16.1633],
respectively at 95% confidence level. The
predicted regression model was given as
follows:
Portfolio Premium = 2.5268 + 0.8617(Rm-Rf) -
64.0235(CR)
From the model, 2.5268 is the value of market
performance holding all the other variables
zero. A one unit change in Rm-Rf would
change the value of market performance by
0.8617 and finally holding all other factors
constant, a one unit change in Liquidity, would
change the value of market performance by -
64.0235.
Table 8 Model summary of Liquidity Risk and market performance
Regression Statistics
Multiple R 0.495077725
R Square 0.245101954
Adjusted R Square 0.197920826
Standard Error 0.766733388
Observations 35
Table 9 ANOVA for Liquidity Risk and market performance
df SS MS F Significance F
Regression 2 6.107974 3.053987 5.194915 0.011123
Residual 32 18.81216 0.58788
Total 34 24.92014
Table 10 ANOVA for Liquidity Risk and market performance
Coefficients
Standard
Error t Stat P-value
Lower
95%
Upper
95%
Intercept 2.526822061 0.80555 3.136766 0.003652 0.88597 4.167674
Rm-Rf 0.861675281 0.07271 11.8509 0.009064 -0.13949 0.156722
CR -64.0235457 23.49623 -2.72484 0.01034 -111.884 -16.1633
© Bwari, Oluoch ISSN 2412-0294 2022
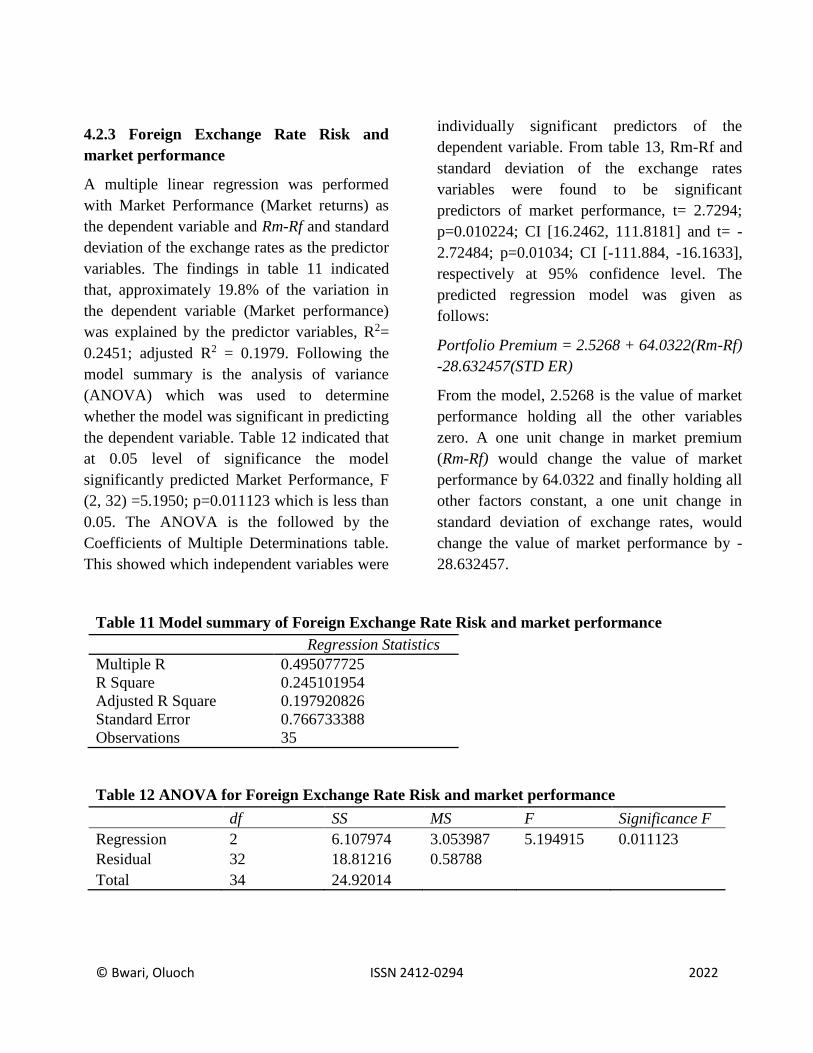
4.2.3 Foreign Exchange Rate Risk and
market performance
A multiple linear regression was performed
with Market Performance (Market returns) as
the dependent variable and Rm-Rf and standard
deviation of the exchange rates as the predictor
variables. The findings in table 11 indicated
that, approximately 19.8% of the variation in
the dependent variable (Market performance)
was explained by the predictor variables, R2=
0.2451; adjusted R2 = 0.1979. Following the
model summary is the analysis of variance
(ANOVA) which was used to determine
whether the model was significant in predicting
the dependent variable. Table 12 indicated that
at 0.05 level of significance the model
significantly predicted Market Performance, F
(2, 32) =5.1950; p=0.011123 which is less than
0.05. The ANOVA is the followed by the
Coefficients of Multiple Determinations table.
This showed which independent variables were
individually significant predictors of the
dependent variable. From table 13, Rm-Rf and
standard deviation of the exchange rates
variables were found to be significant
predictors of market performance, t= 2.7294;
p=0.010224; CI [16.2462, 111.8181] and t= -
2.72484; p=0.01034; CI [-111.884, -16.1633],
respectively at 95% confidence level. The
predicted regression model was given as
follows:
Portfolio Premium = 2.5268 + 64.0322(Rm-Rf)
-28.632457(STD ER)
From the model, 2.5268 is the value of market
performance holding all the other variables
zero. A one unit change in market premium
(Rm-Rf) would change the value of market
performance by 64.0322 and finally holding all
other factors constant, a one unit change in
standard deviation of exchange rates, would
change the value of market performance by -
28.632457.
Table 11 Model summary of Foreign Exchange Rate Risk and market performance
Regression Statistics
Multiple R 0.495077725
R Square 0.245101954
Adjusted R Square 0.197920826
Standard Error 0.766733388
Observations 35
Table 12 ANOVA for Foreign Exchange Rate Risk and market performance
df SS MS F Significance F
Regression 2 6.107974 3.053987 5.194915 0.011123
Residual 32 18.81216 0.58788
Total 34 24.92014

© Bwari, Oluoch ISSN 2412-0294 2023
Table 13 Coefficients of Multiple Determinations of the Variables
Coefficients
Standard
Error t Stat P-value
Lower
95% Upper 95%
Intercept 2.526822061 0.80555 3.136766 0.003652 0.88597 4.167674
Rm-Rf 64.0321624 23.45976 2.7294 0.010224 16.24619 111.818135
Std er -28.632457 6.061049 -4.72484 0.01034 -111.884 -16.1633
4.2.4 Interest Rate Risk and Market
Performance
A multiple linear regression was performed with
Market Performance (Market returns) as the
dependent variable and Rm-Rf and Standard
deviation of interest rates as the predictor
variables. The findings in table 14 indicated that,
approximately 85.7% of the variation in the
dependent variable (Market performance) was
explained by the predictor variables, R2=
0.865016; adjusted R2 = 0.856579. Following
the model summary is the analysis of variance
(ANOVA) which was used to determine whether
the model was significant in predicting the
dependent variable. Table 15 indicated that at
0.05 level of significance the model significantly
predicted Market Performance, F (2, 32)
=5.1950; p=1.21E-14 which is less than 0.05.
The ANOVA is the followed by the Coefficients
of Multiple Determinations table. This showed
which independent variables were individually
significant predictors of the dependent variable.
From table 16, Rm-Rf and Standard deviation of
interest rates variables were found to be
significant predictors of market performance, t=
2.888841; p=0.006884; CI [0.022724, 0.131392]
and t= 13.72889; p=5.84E-15; CI [1.00162,
1.350618], respectively at 95% confidence level.
The predicted regression model was given as
follows:
Portfolio Premium = -0.22663+ 0.077058(Rm-
Rf) + 1.176119(SD IR)
From the model, -0.22663 is the value of market
performance holding all the other variables zero.
A one unit change in Rm-Rf would change the
value of market performance by 0.077058 and
finally holding all other factors constant, a one
unit change in Standard deviation of interest
rates would change the value of market
performance by 1.176119.
Table 14 Model summary of Interest Rate Risk and Market Performance
Regression Statistics
Multiple R 0.930062
R Square 0.865016
Adjusted R Square 0.856579
Standard Error 0.324222
Observations 35

© Bwari, Oluoch ISSN 2412-0294 2024
Table 15 ANOVA Table for Interest Rate Risk and Market Performance
df SS MS F
Significance
F
Regression 2 21.55631 10.77815 102.5323 1.21E-14
Residual 32 3.363829 0.10512
Total 34 24.92014
Table 16 Coefficients of Multiple Determinations of the Variables
Coefficients
Standard
Error t Stat P-value
Lower
95.0%
Upper
95.0%
Intercept -0.22663 0.094109 -2.40817 0.021968 -0.41833 -0.03494
Rm-Rf 0.077058 0.026674 2.888841 0.006884 0.022724 0.131392
Sd ir 1.176119 0.085667 13.72889 5.84E-15 1.00162 1.350618
5.0 SUMMARY
5.1 Effect of Default Risk on Market
performance.
Default is a key aspect of every company's life.
This study provides a simple explanation of the
connection between default risk and market
returns that does not appeal to market
mispricing and is in fact consistent with the
risk-return trade-off. The analysis on the effect
of default risk and market performance
highlighted a complex relationship between
default probabilities and market returns. Given
that the analysis can obtain these two quantities
explicitly within a plausible model of the
default process, the study indicated the
implications of the model and then compared
them with the empirical evidence. The study
investigated the relationship between market
returns and default probabilities with the help
of a calibrated numerical example of the
modified CAPM model. The main objective is
to highlight the role of the bargaining power
coefficient and of the liquidation cost
coefficient in determining how default
probability and market returns are related to
each other. The second objective of the study
was to set to establish whether Liquidity Risk
affects the market performance of the
manufacturing companies in Kenya. The
findings revealed that liquidity risk had a
significant negative effect on the market
performance of manufacturing companies in
Kenya both in the short run and in the long run.
This implied that manufacturing companies
increased exposure to Liquidity risk reduces
market returns. It may result by the fact that
health of a manufacturing company’s loan
portfolio may be reflected by changes in
liquidity risk and affect the market
performance of manufacturing companies. On
the other hand, A multiple linear regression
was performed with Market Performance
(Market returns) as the dependent variable and
Rm-Rf and liquidity as the predictor variables.
The findings indicated that, approximately
19.8% of the variation in the dependent
variable (Market performance) was explained
by the predictor variables. The analysis of
variance (ANOVA) which was used to
determine whether the model was significant in
predicting the dependent variable indicated that

© Bwari, Oluoch ISSN 2412-0294 2025
at 0.05 level of significance the model
significantly predicted Market Performance, F
(2, 32) =5.1950; p=0.011123 which is less than
0.05. The ANOVA was the followed by the
Coefficients of Multiple Determinations which
showed which independent variables were
individually significant predictors of the
dependent variable. The Rm-Rf and cash ratio
variables were found to be significant
predictors of market performance. From the
model, 2.5268 is the value of market
performance holding all the other variables
zero. A one unit change in Rm-Rf would
change the value of market performance by
0.8617 and finally holding all other factors
constant, a one unit change in cash ratio, would
change the value of market performance by -
64.0235.
5.2 Effect of Exchange Rate Risk on Market
performance.
A multiple linear regression was performed
with Market Performance (Market returns) as
the dependent variable and Rm-Rf and standard
deviation of the exchange rates as the predictor
variables. The indicated that, approximately
19.8% of the variation in the dependent
variable (Market performance) was explained
by the predictor variables, R2= 0.2451; adjusted
R2 = 0.1979. Following the model summary is
the analysis of variance (ANOVA) which was
used to determine whether the model was
significant in predicting the dependent variable
the findings indicated that at 0.05 level of
significance the model significantly predicted
Market Performance. The Coefficients of
Multiple Determinations then followed the
ANOVA. This showed which independent
variables were individually significant
predictors of the dependent variable. Rm-Rf
and standard deviation of the exchange rates
variables were found to be significant
predictors of market performance, t= 2.7294;
p=0.010224; CI [16.2462, 111.8181] and t= -
2.72484; p=0.01034; CI [-111.884, -16.1633],
respectively at 95% confidence level. From the
Regression model, 2.5268 is the value of
market performance holding all the other
variables zero. A one unit change in Rm-Rf
would change the value of market performance
by 64.0322 and finally holding all other factors
constant, a one unit change in standard
deviation of exchange rates, would change the
value of market performance by -28.632457
5.3 Effect of Interest Rate Risk on Market
performance.
A modified Capital Asset Pricing Model was
used in a form of a multiple linear regression
which was performed with Market
Performance (Market returns) as the dependent
variable and Rm-Rf and Standard deviation of
interest rates as the predictor variables. The
findings indicated that, approximately 85.7%
of the variation in the dependent variable
(Market performance) was explained by the
predictor variables, R2= 0.865016; adjusted R2
= 0.856579. Following the model summary is
the analysis of variance (ANOVA) which was
used to determine whether the model was
significant in predicting the dependent variable
the analysis indicted that at 0.05 level of
significance the model significantly predicted
Market Performance, F (2, 32) =5.1950;
p=1.21E-14 which is less than 0.05. The
Coefficients of Multiple Determinations then
followed the ANOVA. This showed which
independent variables were individually
significant predictors of the dependent variable.
Rm-Rf and Standard deviation of interest rates

© Bwari, Oluoch ISSN 2412-0294 2026
variables were found to be significant
predictors of market performance, t= 2.888841;
p=0.006884; CI [0.022724, 0.131392] and t=
13.72889; p=5.84E-15; CI [1.00162,
1.350618], respectively at 95% confidence
level. From the model, -0.22663 is the value of
market performance holding all the other
variables zero. A one unit change in Rm-Rf
would change the value of market performance
by 0.077058 and finally holding all other
factors constant, a one unit change in Standard
deviation of interest rates would change the
value of market performance by 1.176119.
5.4 CONCLUSIONS
5.4.1 Effect of Default Risk on Market
performance.
The study investigated the effect of default risk
on the market performance of manufacturing
companies in Kenya. Default risk is a financial
risk indicator which is described as the chance
that companies will be unable to meet the
required payments on their debt obligations.
This was determined by a bad debt ratio. A
higher default rate ratio shows that a company
is not doing very well both financially and its
market performance. Although considerable
research effort has been put toward modeling
default risk for valuing company debts and
derivative products written on it, little attention
has been paid to the effects of default risk on
market returns. The results concluded that,
independently of whether the default spread
can explain, predict, or otherwise relate to
Market returns, such a relation cannot be
attributed to the effects that default risk may
have on equities.
5.4.2 Effect of Credit Risk on Market
performance
The study also investigated the effect of credit
risk on the market performance for
manufacturing companies. A sound credit risk
management framework is crucial for
manufacturing companies so as to enhance
profitability and guarantee survival. The key
principles in credit risk management process
are sequenced as follows: establishment of a
clear structure, allocation of responsibility,
processes have to be prioritized and
disciplined, responsibilities should be clearly
communicated and accountability assigned.
Effect of Exchange Rate Risk on Market
performance the relative degree of importance
of the factors, improving the pricing of default
risk, screening out bad loan applicants and
calculating any reserve needed to meet
expected future loan losses. A regression
analysis was conducted in the form of a
modified capital asset pricing model and the
results indicated a negative significant effect
between credit ration and market performance.
5.4.3 Effect of Exchange Risk on Market
performance
Exchange rate risk movement in Kenya has
been variable with periods of rapid
depreciation of the domestic currency Kenya
Shilling, which adversely affect the Kenyan
economy. The results indicated a practical
relevance in foreign exchange rate risk
management that lies in the fact that, even
though there are a number of techniques such
as balance sheet hedging, use of derivatives,
leading and lagging almost others available to
manage foreign exchange risk in most
developed countries, these measures tend to be
rather too sophisticated and difficult to
© Bwari, Oluoch ISSN 2412-0294 2027
implement in developing countries like Kenya
with less developed financial systems. The
study concluded also that exchange rate risk
does not directly affect manufacturing
companies and this could be probably because
most of these companies do not depend on
foreign trade to perform their functions. From
these results therefore, the study concluded that
exchange rates had a negative significant effect
on market performance.
5.4.4 Effect of Interest Rate Risk on Market
performance
The study investigated the effects of interest
rate on market performance. The study
postulates that interest rates are an everyday
part of business. In most cases companies pay
interest on money they borrow, and when they
have extra cash, they receive interest when they
place that cash in a safe investment.
Manufacturing Companies also charge interest
when their customers buy goods and services
on credit from them. A rise or fall in interest
rates affects these business activities as well as
the buying habits of the company's customers.
The results also concludes that interest rates
were related to the amount of money floating
through the economic system, When
companies lend out or gives out goods on
credit, they charge a high rate of interest that
reflects its scarcity value. High interest rates
make it more expensive for companies to
borrow money to finance their operations,
payroll and purchases. High rates also
eventually discourage consumers from buying
because of the expense involved, which chokes
off economic activity. Due to the major effect
that interest rates have for market performance
of manufacturing companies, the study
concluded that interest rates have a positive
significant effect on market performance of
manufacturing companies.
REFERENCES
Aabo, T. Jochen, K. & Giovanna, Z. (2011) Founder family influence and foreign exchange risk
management, International Journal of Managerial Finance, 7 (1)38 – 67
Ahmed, A. & Nauman, A. (2012). Liquidity risk and performance of banking system, Journal of Financial
Regulation, and Compliance, 20 (2)182 – 195
Ahsan, H., Borhan, M., Uddin, B. & Ainul, I. (2013) Financial distress, earnings management, and
market pricing of accruals during the global financial crisis, Managerial Finance, 39(2) 155 –
180
Aigbe, A., Anna, D. & Laurence, J. (2014) Influence of financial distress on foreign exchange
exposure, American Journal of Business, 29 (3/4)223 – 236
Almas, H. and Masoomeh, R. (2016). Labour Productivity in Kenyan Manufacturing and Service
Industries. IZA Discussion Paper No. 9923
Basel Committee on Bank Supervision, BCBS (2003). Overview of the new basel capital accord.
Technical report, Basel Committee on Bank Supervision, CH-4002 Basel, Switzerland.
Consultative Document.
Brunnermeier, M. &Pedersen, L. (2007). Market Liquidity and Funding Liquidity. The Review of
Financial Studies, forthcoming.

© Bwari, Oluoch ISSN 2412-0294 2028
Charitou, A., Lambertides, N. & Trigeorgis, L. (2007), Earnings behavior of financially distressed firms:
the role of institutional ownership, Abacus, 43 (3)271-96.
Chikafumi, N. (2016) Exchange rate risks in a small open economy, Journal of Financial Economic
Policy, 8 (3)348 – 363
Chong, L., Xiao-Jun, C. & Siow-Hooi, T. (2014) Determinants of corporate foreign exchange risk
hedging, Managerial Finance, 40 (2)176 – 188
Chordia, T.,Avanindhar, S. & Anshuman, V. (2001). Trading activity and expected stock returns, Journal
of Financial Economics 59(3)32.
Chu‐Sheng, T. (2010) Foreign exchange risk and risk exposure in the Japanese stock market, Managerial
Finance, 36 (6)511 - 524
Connaway, S. & Powell, R. (2010).Basic Research methods for librarian. California: Greenwood
Publishing group.
Dhanani, A., Fifield, S., Helliar, C., & Stevenson, L. (2007). Why UK companies hedge interest rate risk.
Studies in Economics and Finance, 24(1), 72-90.
Dhanani, A., Suzanne, F., Christine, H. & Lorna, S. (2008) The management of interest rate risk:
evidence from UK companies", Journal of Applied Accounting Research, 9 (1)52 - 70
Dhanani, A., Suzanne, F., Christine, Helliar, L. & Stevenson, J. (2007) Why UK companies hedge interest
rate risk, Studies in Economics and Finance, 24(1)72 – 90
Dobbins, R. Witt, S. (1979) Some Implications of the Efficient Market Hypothesis, Managerial Finance, 5
(1).65 – 79
Drakos, K. (2001): Interest rate risk and bank common stock returns: Evidence from the Greek Banking
sector. Working Paper. London Guildhall University.
Drehmann, M. & Nikolaou, K. (2009). Funding liquidity risk: definition and measurement, ECB Working
Paper No. 1024
Drogt, E. & Goldberg, S., (2008). Managing Foreign Exchange Risk. Journal of Corporate Accounting
and Finance (Wiley), 19(2), 49-57.
Eichhorn, J. (2004). Managing Risk: Contingency Planning, Southern Economic Journal, 40:353-363.
Erkki, K. Laitinen, M. (2005) Survival Analysis and Financial Distress Prediction: Finnish
Evidence, Review of Accounting and Finance, 4 (4)76 - 90
Fama, E. (1998) Market Efficiency, Long-term Returns, and Behavioral Finance, Journal of Financial
Economics
Fama, E., (1991). Efficient Capital Markets: II, Journal of Finance
Fama, Eugene (1970), Efficient Capital Markets: A Review of Theory and Empirical Work, Journal of
Finance, 25, 383-417.
Fatemi, A., & Glaum, M. (2000). Risk management practices of German firms. Managerial Finance,
26(3), 1-17.

© Bwari, Oluoch ISSN 2412-0294 2029
Genanew, B., Reza, H. &Chowdhury, A. (2016) Analysis of default behavior of borrowers under Islamic
versus conventional banking, Review of Behavioral Finance, 8(2)156 - 173
Gerdin, A. (1997).On productivity and growth in Kenya, Ekonomiska Studier 72. PhD Thesis at
Department of Economics, Göteborg University, Sweden.
Goodhart, C. (2008), Liquidity risk management in Financial Stability Review, Banque de France.
Gordon, M. J. (1971): Towards a Theory of Financial Distress. In: The Journal of Finance, 26(2), 347-
356.
Griffin, M., and Lemmon, M. (2002). Book-to-market equity, distress risk and stock returns, Journal of
Finance 57, 2317{2336.
Hakkarainen, A. EeroKasanen, VesaPuttonen, (2007) Foreign Exchange Risk Management: Evidence
from Finland, Managerial Finance, 23 (7)25 – 44
Hendel, I. (1996): Competition under Financial Distress. In: The Journal of Industrial Economics, 54(3),
309-324.
Ibrahim, O. & Tezer, Y. (2017) A Theoretical Approach to Financial Distress Prediction
Modeling, Managerial Finance, 43 (2)42 – 70
Ismal, R. (2010). The management of liquidity risk in Islamic Banks: the case of Indonesia (Doctoral
dissertation, Durham University).
Iqbal Z. & Mirakhor A. (2007). An Introduction to Islamic Finance: Theory and Practice, 2nd Edition
Jeffrey E. &Jarrett, S. (2010) Efficient markets hypothesis and daily variation in small Pacific‐basin stock
markets, Management Research Review, 33(12).1128 - 1139
Jenkinson, N. (2008). Strengthening regimes for controlling liquidity risk, Euro Money Conference on
Liquidity and Funding Risk Management, Bank of England, London, 9
Jorion, P., & Khoury, S. (1996), Financial Risk Management: Domestic and International Dimensions.
Cambridge, Massachusetts: Blackwell Publishers.
Joshua, A. (2005) Managing foreign exchange risk among Ghanaian firms, The Journal of Risk Finance,
6 (4)306 – 318
Karsten, P. (2011) Discontinued German life insurance portfolios: rules‐in‐use, interest rate risk, and
Solvency II, Journal of Financial Regulation and Compliance, 19 (2)117 - 138
Keiichi, K. & Hitoshi, T. (2010). Expected return, liquidity risk, and contrarian strategy: evidence from
the Tokyo Stock Exchange, Managerial Finance, 36(8)655 - 679
Khushbu, A. Yogesh, M. (2014) Default risk modelling using macroeconomic variables, Journal of Indian
Business Research, 6 (4)270 - 285
Kim, H.,Liow, Q. & Huang, K. (2006) Interest rate risk and time‐varying excess returns for Asian
property stocks, Journal of Property Investment & Finance, 24 (3)188 - 210
Kothari, R. (2014). Research methodology: Methods & techniques. New Delhi: New Age International
(P) Limited.

© Bwari, Oluoch ISSN 2412-0294 2030
Laura, B., Román, F., Cristóbal, G. & Gloria, M. S. (2009). Determinants of interest rate exposure of
Spanish banking industry. WP-EC 2009-07
Lubos, P. & Stambaugh, R (2002). Liquidity Risk and Expected Stock Returns. Journal of Finance
55:2017-2069.
Magezi, J. (2003). A New Framework for Measuring the Credit Risk of a Portfolio. Institute for Monetary
and Economic Studies (IMES), 1-45.
Maria, V. & Yuhang, X. (2004) Default Risk in Equity Returns: The Journal of Finance, 59(2) 2004
Mathur, I (1985) Managing Foreign Exchange Risks: Strategy Considerations, Managerial Finance, 11
(2)7 – 11
Matthijs, V. (2012). The Financial Performance and Risk Profile of Sustainable Firms. Copenhagen
Business School. Department of Finance.
Mazin, A. Janabi, J. (2006) Foreign‐exchange trading risk management with value at risk: Case analysis
of the Moroccan market, The Journal of Risk Finance, 7 (3)273 – 291
Meekings, A., Povey, S. & Neely, A. (2009), Performance plumbing: installing performance management
systems to deliver lasting value, Measuring Business Excellence journal, 13(3)13-19
Mikes, A. & Kaplan, R. (2014). Towards a contingency. Theory of Enterprise Risk Management. Working
Paper 13-063.
Mohamad, A., Amin, M., Nur, A., Sanusi, S., Kusairi, Z. & Mohamed, A. (2014). Inverse relationship of
financial risk and performance in commercial banks in Tanzania. Investment Management and
Financial Innovations, 2(4)2014.
Moles, P. (2013) Financial risk management; Sources of Financial Risk and Risk Assessment. Edinburgh
business School. Oxford university Press
Mugenda, M., & Mugenda, G. (2009). Research Methods quantitative and qualitative approaches.
Kenya; African Centre for technology studies (ACTS) Press.
Oluwafemi, A., Akeke, N., Adebisi, O. & Oladunjoye, O. (2014).Risk Management and Financial
Performance of Banks in Nigeria. European Journal of Business and Management. ISSN 2222-
1905. 6(31): 336-342
Opler, T., Titman, S. (1994): Financial Distress and Corporate Performance. In: The Journal of Finance,
49(3), 1015-1040.
Orodho, J. (2009) Techniques of Writing Research Proposals and Reports in Education, Masda
Publishers
Pindado, J., Luis, R. & Chabela de la, T. 2008. Estimating Financial Distress Likelihood, Journal of
Business Research 61:995-1003
Poorman, F. & Blake, J. (2005), Measuring and Modeling Liquidity Risk: New Ideas and Metrics,
Financial Managers Society Inc. White Paper

© Bwari, Oluoch ISSN 2412-0294 2031
Priyanka, J. Vishal, V. & Ankur, R. (2013) A study on weak form of market efficiency during the period of
global financial crisis in the form of random walk on Indian capital market, Journal of Advances
in Management Research, 10 (1)122 - 138
Rami, Z. & Gary, G. (2007) Does ownership affect a firm's performance and default risk in
Jordan? Corporate Governance: The international journal of business in society, 7 (1)66 - 82
Rosner, R. (2003), Earnings manipulation in failing firms, Contemporary Accounting Research, 20:361-
408.
Samuelson, P. (1965) Proof that Properly Anticipated Prices Fluctuate Randomly, Industrial
Management Review, Spring 6: 41-49.
Sekaran, U. (2003). Research method for business: A skill building approach, 4th edition, John Wiley &
Sons.
Shruti, S. &Swati, S. (2016) Exchange rate interest rate linkages in India: an empirical
investigation, Journal of Financial Economic Policy, 8 (4)443 – 457
Simplice, A. (2013). Post-crisis bank liquidity risk management disclosure, Qualitative Research in
Financial Markets 5 (1)65 – 84.
Smith, K. (2004). Voluntarily reporting performance measures to the public, a test of accounting reports
from US Cities. International Public Management Journal, 7(1), 19 - 38
Talat, A. & Atia, A. (2011). Corporate derivatives and foreign exchange risk management: A case study
of non‐financial firms of Pakistan, The Journal of Risk Finance, 12 (5)409 - 420
Triantis, A. (2000). Real options and corporate risk management. Journal of Applied Corporate Finance,
13(2), 64-73.
Tsung-ming, Y. (2017) Governance, Risk Taking and Default Risk during the Financial Crisis: The
Evidence of Japanese Regional Banks, Corporate Governance: The International Journal of
Business in Society, 17 (2)257-280
Tybout, J. (2000). Manufacturing firms in developing countries: How well do they do, and why? Journal
of Economic Literature 38:11-44.
Willi, S. & Christian, R. (2015), Escape Routes from Sovereign Default Risk in the Euro Area, in William
A. Barnett, Fred Jawadi (ed.) Monetary Policy in the Context of the Financial Crisis: New
Challenges and Lessons International Symposia in Economic Theory and Econometrics, 24:163 -
193
Zubeiru, S., Kofi, A. Osei, C. & Adjasi, D. (2007) Foreign exchange risk exposure of listed companies in
Ghana, The Journal of Risk Finance, 8 (4)380 – 393
Zarruk, R. & Jeff, M. (1992). Optimal Bank Interest Margin Under Capital Regulation and Deposit
Insurance. Journal of Financial and Quantitative Analysis, 27(1)143-149.