effect of fertilizer source on nitrate leaching,...
TRANSCRIPT

EFFECT OF FERTILIZER SOURCE ON NITRATE LEACHING, PLANT WATER CONSUMPTION, AND TURF AND ORNAMENTAL QUALITY
By
SUBHRAJIT K. SAHA
A THESIS PRESENTED TO THE GRADUATE SCHOOL OF THE UNIVERSITY OF FLORIDA IN PARTIAL FULFILLMENT
OF THE REQUIREMENTS FOR THE DEGREE OF MASTER OF SCIENCE
UNIVERSITY OF FLORIDA
2004

ACKNOWLEDGMENTS
I express my deep gratitude to Dr. Laurie E. Trenholm (cochair of my supervisory
committee) for her excellent guidance and assistance during the course of my graduate
work. I would like to thank my other cochair (Dr. J. Bryan Unruh) for his advice,
support, and inspiration. I sincerely appreciate my external committee member (Dr. Jerry
Sartain) for his help and suggestions. I also would like to thank my two other committee
members (Dr. Rick Schoellhorn and Dr. Tim Broschat) for their assistance. Dr.
Schoellhorn’s friendliness always inspired me and Dr. Broschat always helped me with
his valuable inputs.
I gratefully acknowledge Florida Yards and Neighborhoods (FYN) and Florida
Department of Environmental Protection (FDEP) for partial funding of this research. I
would like to thank Brian Owens for technical support of my study and for his valuable
suggestions. I thank Joon Lee, Shirley Anderson, Mark Warner, Ty Twist and Brian
Hinote for their help in my research.
I extend warm thanks to Prof. N. Roychowdhury and Dr. Shilpi Roychowdhury,
Prof. N.P. Koley and Biva Koley for their inspiration and advice. I am grateful to
Samiran Sinha, Dr. Suman and Debjani Mazumder, Dr. Kajal and Suparna Biswas for
their love and friendship. I am deeply grateful to my parents (Mr. S.N. Saha and Mrs.
Aloka Saha) for their love and moral support. I extend my gratitude to my brother-in-law
(Major S.K. Saha); my sister (Mrs. Indrani Saha), and my nieces (Sanjana and Nilanjana)
for their love and encouragement.
ii

TABLE OF CONTENTS Page ACKNOWLEDGMENTS .................................................................................................. ii
LIST OF TABLES...............................................................................................................v
LIST OF FIGURES .......................................................................................................... vii
ABSTRACT..................................................................................................................... viii
CHAPTER 1 INTRODUCTION ........................................................................................................1
Environmental Concern ................................................................................................1 Plant Materials ..............................................................................................................3
St. Augustinegrass .................................................................................................3 Ornamental Plants .................................................................................................4
Multispectral Reflectance (MSR) Measurement ..........................................................6 Water.............................................................................................................................7 Nitrogen ........................................................................................................................8
2 MATERIALS AND METHODS ...............................................................................10
3 EFFECT OF FERTILIZER SOURCE ON NITRATE LEACHING AND ST. AUGUSTINEGRASS TURF QUALITY...................................................................15
Introduction.................................................................................................................15 Materials and Methods ...............................................................................................18 Results and Discussion ...............................................................................................22
Multispectral Reflectance....................................................................................22 Visual Quality, Color, and Density .....................................................................22 Thatch Accumulation ..........................................................................................23 Shoot and Root Growth .......................................................................................23 Nitrate Leaching by Concentration (mg L-1) .......................................................24 Nitrate Leaching by Volume (mg) ......................................................................25 Leaf Tissue Nutrient ............................................................................................25
Conclusions.................................................................................................................26
iii

4 EFFECT OF FERTILIZER SOURCE ON NITRATE LEACHING AND ORNAMENTAL PLANT QUALITY........................................................................33
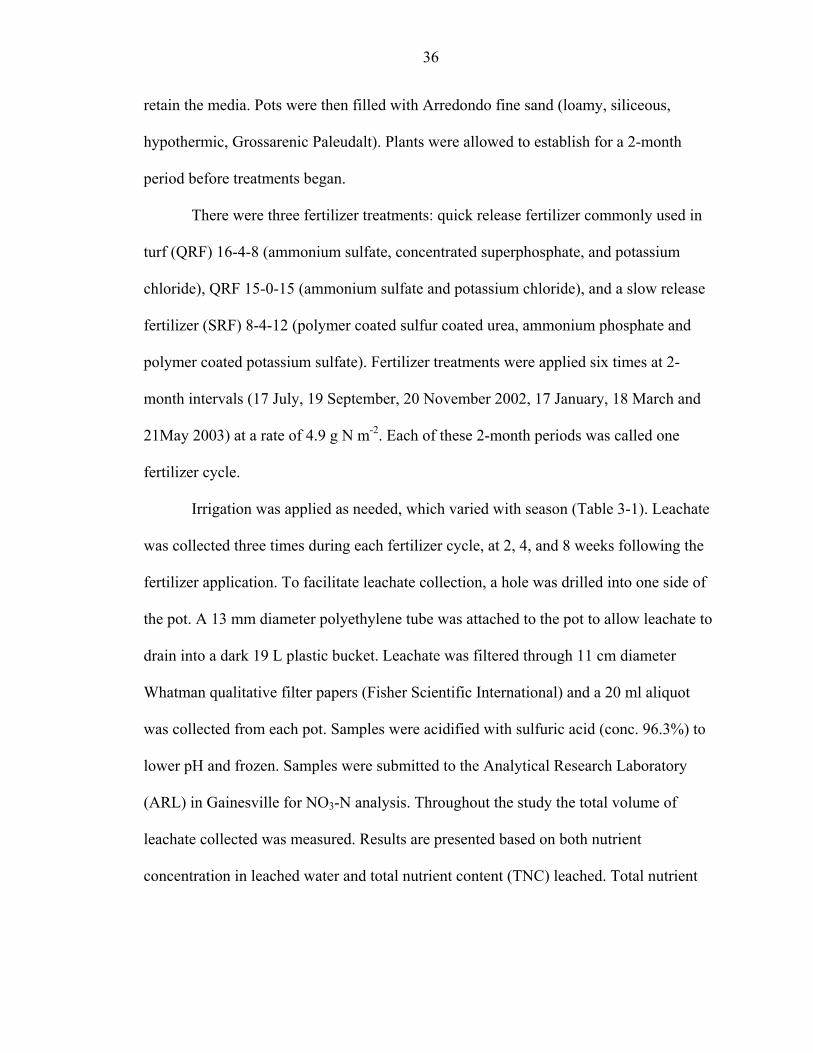
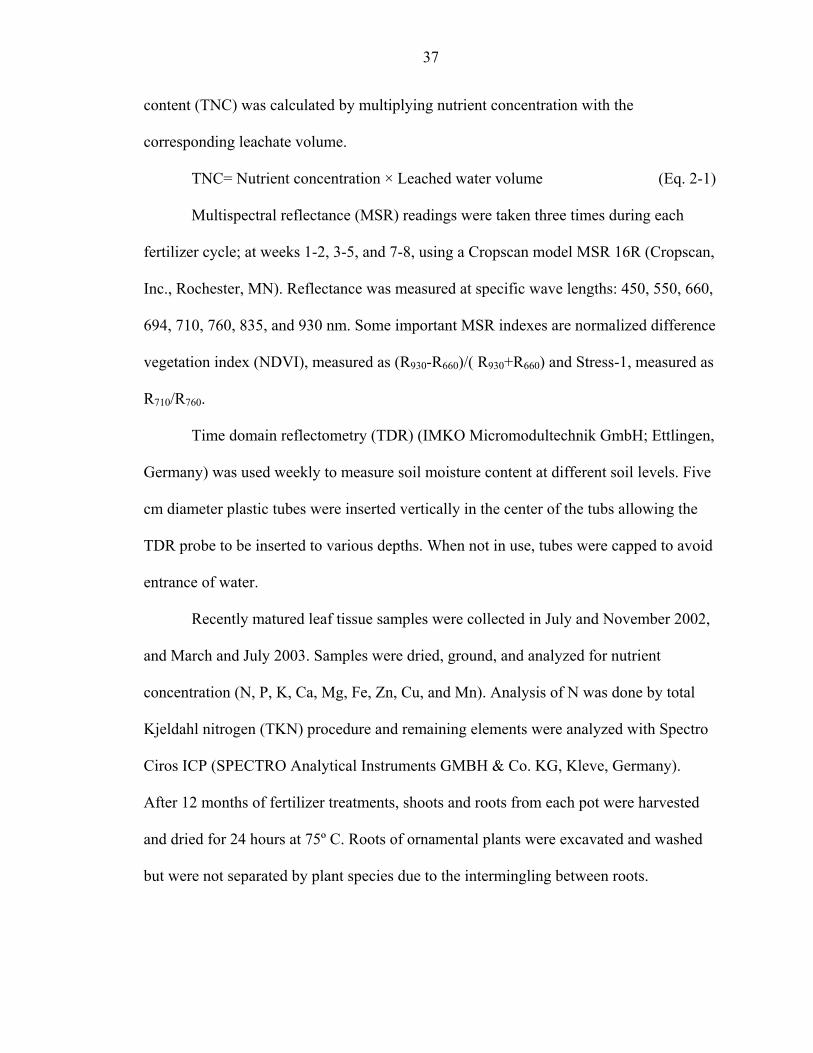
Introduction.................................................................................................................33 Materials and Methods ...............................................................................................35 Results and Discussion ...............................................................................................38
Multispectral Reflectance....................................................................................38 Shoot and Root Growth .......................................................................................39 Nitrate Leaching (mg L-1)....................................................................................40 Leaf Tissue Nutrient ............................................................................................40
Conclusions.................................................................................................................41 5 WATER CONSUMPTION IN TURF AND ORNAMENTALS...............................46
Introduction.................................................................................................................46 Materials and Methods ...............................................................................................48 Results and Discussion ...............................................................................................51
Comparison of Water Consumption by Turf and Ornamentals...........................51 Effect of Fertilizer on Water Consumption of Turf and Ornamentals ................52 Water Use Efficiency (WUE)..............................................................................53 Correlation between Shoots, Roots, and Soil Moisture with Water Use.............54 Change in Soil Moisture Content during Seven Days with No Irrigation...........54
Conclusions.................................................................................................................55 6 CONCLUSIONS ........................................................................................................63
LIST OF REFERENCES...................................................................................................64
BIOGRAPHICAL SKETCH .............................................................................................69
iv

LIST OF TABLES
Table page 3-1. Multispectral reflectance values in turfgrass throughout the fertilizer cycle. ............27
3-2. Turfgrass visual quality in response to fertilizer sources. ..........................................28
3-3. Turf thatch, shoot and root weight in response to fertilizer treatments. .....................28
3-4. Nitrate leaching (mg L-1) from turf and ornamentals in response to fertilizer treatments. ................................................................................................................29
3-5. Nitrate leaching (mg) from turf and ornamentals in response to fertilizer treatments. ................................................................................................................30
3-6. Turf leaf tissue nutrient concentration (ppm) in response to fertilizer treatments. ....30
4-1. Multispectral reflectance values in ornamentals throughout the fertilizer cycle........42
4-2. Comparison of shoot weight of Allamanda cathartica pruned in October. ................43
4-3. Ornamental shoot dry weight (g) in response to fertilizer treatments. .......................43
4-4. Cumulative ornamental root dry weight (g) in response to fertilizer treatments........44
4-5. Nitrate leaching (mg L-1) from ornamentals in response to fertilizer treatments. ......44
4-6. Ornamental leaf tissue nutrient concentration (ppm) in response to fertilizer treatments. ................................................................................................................45
5-1. Irrigation schedule (L) in 6 fertilizer cycles. ..............................................................56
5-2. Average temperature (ºC) in the green house during the study..................................56
5-3. Effects of fertilizer source on water consumption (L) of turf in 6 fertilizer cycles....56
5-4. Effects of fertilizer source on water consumption (L) of ornamentals in 6 fertilizer cycles. .......................................................................................................................57
5-5.Water use efficiency (WUE) of turf measured (g L-1) during summer and over the year. ..........................................................................................................................57
v

5-6. Water use efficiency (WUE) of ornamentals measured (g L-1) during summer and over the year. ............................................................................................................58
5-7. Comparison of water use efficiency (WUE) between turf and ornamentals measured (g L-1) during summer and over the year. ...............................................59
5-8. Correlation between water use and soil moisture, shoot, and root volume. ...............59
vi

LIST OF FIGURES
Figure page 3-1. Nitrate (mg L-1) leaching between turf and ornamentals............................................31
3-2. Nitrate (mg L-1) leaching from turf and ornamentals in six fertilizer cycles..............31
3-3. Nitrate leaching (mg L-1) from different fertilizers averaged from both turf and ornamentals. .............................................................................................................32
5-1. Water consumption (L) in turf and ornamentals in 6 fertilizer cycles........................60
5-2. Change in soil moisture (%) in turf and ornamental pots in a period of 7 days without irrigation......................................................................................................61
5-3. Change in soil moisture (%) in turf and ornamenta pots in a period of 7 days without irrigation at the lower 20 cm. ......................................................................61
5-4. Change in soil moisture in turf and ornamental pots in a period of 7 days without irrigation at the upper 20 cm. ...................................................................................62
vii

Abstract of Thesis Presented to the Graduate School
of the University of Florida in Partial Fulfillment of the Requirements for the Degree of Master of Science
EFFECT OF FERTILIZER SOURCE ON NITRATE LEACHING, PLANT WATER CONSUMPTION, AND TURF AND ORNAMENTAL QUALITY
By
Subhrajit K. Saha
May 2004
Cochair: Laurie E. Trenholm Cochair: J. Bryan Unruh Major Department: Environmental Horticulture
Due to increasing concern over potential pollution of Florida’s water resources
from fertilization of home lawns, statewide research is being conducted to verify different
aspects of turfgrass Best Management Practices. The objectives of this study were to
evaluate differences in plant quality, water consumption, and fertilizer leaching between
turfgrass and landscape plants in response to different fertilizer formulations.
The experiment was performed in a climate-controlled greenhouse at the G.C. Horn
Turfgrass Field Laboratory at the University of Florida in Gainesville. ‘Floratam’ St.
Augustinegrass (Stenotaphrum secundatum [Walt.] Kuntze.) was compared to a mix of
common Florida ornamentals including Canna (Canna generalis), Nandina (Nandina
domestica ), Ligustrum (Ligustrum japonicum), and Allamanda (Allamanda cathartica).
All plants were grown in 300 L plastic pots in Arredondo fine sand. There were three
fertilizer treatments (quick release fertilizers (QRF) 16-4-8 and 15-0-15, and slow release
viii

fertilizer (SRF) 8-4-12) applied at 4.9 g nitrogen (N) m-2 every other month. This
2-month period is referred to as a fertilizer cycle, of which there were six. Water was
applied as required and turfgrass pots were mowed weekly. Leachate was collected at 15,
30, and 60 d after fertilizer application; and was analyzed for nitrate (NO3-N) content.
Experimental design was a randomized complete block design with four replications.
Visual quality ratings and time domain reflectometry (TDR) data were collected weekly.
Multispectral reflectance (MSR) readings were taken three times during each fertilizer
cycle. Results indicate that turf was more responsive than ornamentals to fertilizer
treatment. Best turfgrass responses were found with the quick release treatments during
the first 2 weeks after fertilizer application. Quick release fertilizers produced greater
biomass than the slow release fertilizer in turf and Allamanda. Average of all six fertilizer
cycles showed ornamentals consumed 38% more water than turf. Mean NO3-N
concentration in leachates was significantly higher in ornamentals than in turf. These
results may have implications in future research on nutrition, irrigation, and
environmental management of an urban landscape.
ix

CHAPTER 1 INTRODUCTION
Environmental Concern
Water is vital to the introduction and existence of life on earth. Total water
resources of the world include both surface and groundwater. About 97% of the world’s
fresh water is groundwater (Hornsby 1999), which is the source of most of the world’s
drinking water. As the earth’s population grows, keeping sufficient amounts of
nonpolluted water available is a primary environmental concern.
In 1990, the Florida Department of Environmental Protection (FDEP) reported
that the average daily withdrawal of groundwater in Florida was over 17 billion L. This
supplied drinking water to 90% of the more than 14 million residents of Florida (Florida
Dept. of Environmental Protection 2003). Consequently, when groundwater becomes
contaminated, it directly affects human health.
Improper application of fertilizers and pest-management chemicals can cause
ground and surface water pollution from percolation and runoff of surplus nutrients and
chemicals. Among the nutrients, NO3-N is considered to be one of the most important
water pollutants today (Petrovic 1990); and a high intake of nitrates is known to be
hazardous to human health (Hornsby 1999).
There are many instances of NO3-N pollution in different parts of the world. In a
groundwater study at Kalpitiya peninsula of Sri Lanka, Liyanage et al. (2000) observed
that groundwater quality was negatively impacted by indiscriminate use of nitrogenous
fertilizer. The United States Environmental Protection Agency (EPA) limit for NO3-N in
1

2
drinking water is 10 mg L-1, which was sometimes exceeded by 100-150%. Liyanage et
al. (2000) observed that high NO3-N in drinking water caused abnormal methemoglobin
concentration (>2%) in a high percentage of Sri Lankan infants. Nitrate is converted to
nitrite (NO2-N), which combines with hemoglobin to form toxic methemoglobin. This
decreases the ability of blood to carry oxygen, causing the syndrome known as
methemoglobinemia, also called "blue baby syndrome" (The Nitrate Elimination Co., Inc.
2001).
Several valuable aquifers have been polluted by human activity in the
southeastern US (Hornsby 1999). This is mainly because most of Florida has a high water
table and sandy soils that render the groundwater vulnerable to contaminants. The
maximum amount of pollutant a water body can receive and still meet water quality
standards is calculated by Total Maximum Daily Loads (TMDL). The EPA issued
regulations in 1985 and 1992 that implement section 303(d) of the Clean Water Act
[Section 303(d) of the Clean Water Act (EPA)]. Water can be treated to remove
contaminants, but considering the huge cost involved, the best protection is prevention
(Hornsby 1999).
In residential areas, turfgrass is often considered to be a major contributor to non-
point source pollution and is alleged to provide a significant source of NO3-N in ground
waters. Research has shown that fertilizer management is a factor in reducing non-point
source pollution (Gross et al. 1990), which has led to the development of Best
Management Practices (BMPs) (Trenholm et. al. 2002). Best Management Practices are
guidelines for implementation of environmentally sound agronomic practices to reduce
potential contamination of ground or surface water due to commercial lawn care
3
practices. These BMPs were developed by regulatory, academic, and industry
professionals and are intended to preserve Florida’s water resources. While BMPs have
been developed for commercial and residential lawns and landscapes in Florida, there is a
lack of research data regarding many issues related to green industry horticultural
practices. Research is currently underway throughout the state to verify and refine these
BMPs.
Plant Materials
St. Augustinegrass
St. Augustinegrass (Stenotaphrum secundatum [Walt] Kuntze) is one of the most
popular turfgrasses for home lawns in Florida. St. Augustinegrass is believed to be native
to the coast of the Gulf of Mexico and the Mediterranean region and thus performs best in
well drained, sandy soils of urban areas of subtropical coastal Florida (Trenholm et al.
2000a). St. Augustinegrass is commonly used in Florida residential lawns (Erickson et al.
2001) and is popular in the gulf coast of Mississippi, Louisiana and Texas (Christians
1998). This coarse-textured, stoloniferous grass is from the Paniceae tribe (Turgeon
1991). It can be identified by its collar, which is broad, continuous, and smooth
(Christians 1998).
St. Augustinegrass prefers moderate cultural practices with a fertility requirement
ranging from 10 to 30 g N m-2 yr-1 (Trenholm et al., 2002). In some regions, regular
irrigation is needed due to poor drought tolerance (Christians 1998). In contrast, Sifers
and Beard (1999) observed that ‘Floratam’ St. Augustinegrass survived 158 days of
summer drought while retaining excellent green color. Peacock and Dudeck (1984)
observed that stomata of St. Augustinegrass are not protected by a wax coating; and have
high evapotranspiration (ET) under both drought and non-drought conditions. In another

4
study, Kim and Beard (1988) noticed that ‘Texas Common’ St. Augustinegrass exhibited
a medium to low ET rate (5.8 mm d-1), which was attributed to low canopy resistance. It
also had a wider leaf blade, and medium vertical leaf extension rate. Compared to five
other warm season grasses (common bermudagrass, ‘Tifway’ hybrid bermudagrass,
centipedegrass, ‘Meyer’ zoysiagrass, and ‘Emerald’ zoysiagrass), Bowman et al. (2002)
found that ‘Raleigh’ St. Augustinegrass produced the highest amount of leaf tissue and
almost double the root mass compared to the other species. They concluded that the
higher root mass might increase the ability of St. Augustinegrass to absorb nitrate from
the soil.
St. Augustinegrass also is more shade tolerant than many other turfgrass species,
although there is a wide range of shade tolerance within the species (Trenholm 2002).
Peacock and Dudeck (1981) noticed that shade did not affect stolon length, total
chlorophyll content, or leaf weight in six cultivars of St. Augustinegrass.
Ornamental Plants
Canna generalis L. ‘Brandywine’, Ligustrum japonicum Thunb ‘Lake Tresca’,
Nandina domestica Thunb ‘Harbor Dwarf ’and Allamanda cathartica L. are four
ornamental plants commonly grown in Florida. Little research has been done on these
plants when grown separately; and no study has evaluated them as part of a mixed
vegetation landscape. Irrigation requirements and fertility regimes of these plants are not
well understood either.
Ligustrum japonicum, or Japanese privet, belongs to the Oleaceae family (Gilman
and Watson 1993). This evergreen shrub has simple leaves that are ovate to elliptic in
shape, flowers that are fragrant with four united white petals, and fruits that are blue-
black drupe-like berries (Midcap et al. 1991). Flowering seasons are late winter through

5
early spring, mid spring, and late spring through early summer. This plant can achieve
heights of 1.2 to 2.4 meters (StandardOut, Inc. 2003). Ligustrum japonocum is tolerant of
the diverse soils of Florida. Gilman and Yeager (1990) noticed that L. japonocum
receiving soluble granular fertilizers were larger than control plants and plants receiving
30 g N m-2 yr-1 were larger than the plants receiving 15 g N m-2 yr-1. They observed no
growth difference due to fertilizer types. Similarly, Stratton et al. (2001) noticed that N
content in plant and root mass of Ligustrum ibolium did not differ with N source.
Allamanda cathartica, or golden trumpet, belongs to the Apocynaceae family
(Black 2002). This evergreen, vine-like shrub has simple, elliptic-oblong leaves that are
generally 10 to15 cm long (Black 2002). It flowers in summer, producing funnel-shaped
flowers with bright yellow rounded petals. It exudes milky sap when any part of the plant
is broken (Haynes et al. 2001). It can be propagated from cuttings and seed and has
medicinal values, but all parts of the plant are poisonous if ingested (StandardOut, Inc.
2003). No research on fertility regimes of Allamanda has been documented.
Nandina domestica or dwarf nandina belongs to the Berberidaceae family
(StandardOut, Inc. 2003). This evergreen to semi-deciduous shrub has red fall colors with
compound and spirally arranged leaves. It has six petaled white flowers, which are born
in panicles (Black 2002). Flowering time is late spring to early summer. Height can
reach 1.2 to1.8 meters (StandardOut, Inc. 2003). No comparative fertility study of
Nandina has been documented.
Canna generalis belongs to the Cannaceae family (StandardOut, Inc. 2003). This
perennial plant flowers throughout the year in its native habitat. In tropical and
subtropical areas, height of cannas range from 75 cm to 300 cm, while in temperate

6
regions, cannas rarely exceed 120 to 180 cm height (Tjia and Black 1991). Simple leaves
are alternate to spirally arranged and are ovate to elliptic-lanceolate in shape (Black
2002). The leaves may be pure green, greenish blue, coppery to purplish, ruby, or green
with white stripes (Tjia and Black 1991). Flower colors are magenta, red, scarlet, orange,
red-orange, gold, or bright yellow. Canna may be propagated by rhizomes or seed
(StandardOut, Inc. 2003).
Multispectral Reflectance (MSR) Measurement
To assess the growth or compare treatment responses, qualitative responses are
commonly used in turfgrass research, where quality might be expressed by visual and
functional characteristics (Turgeon 1991). These are often described as the combination
of shoot density, color, and growth habit (Beard, 1973). Multispectral radiometry
provides a reliable method for qualitative comparison of turfgrass at various wavelengths
(Trenholm et al. 1999). It has been shown to discriminate between stressed and non-
stressed vegetation (Carter 1993; Carter and Miller 1994). Plants acquire energy for
physiological activities by absorbing sunlight. Light is either reflected or absorbed by the
plant, based largely on the condition of the leaf surfaces and overall health of the plant.
Multispectral radiometry measures the reflected light and can be used to infer crop
condition or fertility status. Measurements at the visible and near infrared (NIR) regions
of the spectrum can be useful for determining plant response to treatments. Multispectral
reflectance measurements can detect changes in leaf chlorophyll concentration (Carter
1993; Carter and Miller 1994; Trenholm et al. 2000b). Use of spectral reflectance
measurements are increasing in turfgrass research.

7
Water
Water is the most important constituent of plant cells and controls plant growth
and development (Salisbury and Ross 1999; Taiz and Zeigler 2002). Loss of water
through evaporation from soil and transpiration from the plant represents the total amount
of water lost, which is known as evapotranspitration (ET) (Turgeon 1991).
Evapotranspiration is important in irrigation management because crop yield is often
directly related to the amount of water lost through ET during the cropping season
(Bronson et al. 2001).Total water use (TWU) is the sum of (ET) and the water trapped in
plant cells for growth and development, which is an insignificant amount. The rate of ET
depends on different factors. Environmental influences include humidity (Nonami and
Boyer 1990), wind speed and soil moisture (Beard 2002). Morphological factors include
pubescence and degree of cuticular wax (Peacock and Dudeck 1984).
Total water use can be correlated to soil moisture content. In a controlled
environment, plants grown in containers reflect changes in soil moisture content with
changes in water uptake and ET. Water requirements vary between crops and turfgrass
species. It is recommended that turf be irrigated on an “as needed basis” (Trenholm et. al.
2003). The frequency with which water is needed will vary based on season, temperature,
soil type, grass species, and presence of shade. Difference in root anatomy (Klepper
1990) is one of the factors that require greater frequency of irrigation in turf than in
shrubs.
The relationship between nitrogen and water is also very important. Nitrogen rate
influenced ET in Kentucky bluegrass (Ebdon et al. 1999), however the effects of N
source on ET are not well understood. Feldhake et al. (1983, 1984) observed that
Kentucky bluegrass grown under a deficient N level had lower ET. Similarly, ET

8
increased with increasing N levels in a mixed sward of orchardgrass, creeping red fescue,
and bromegrass (Krogman 1967). Heckathorn et al. (1997) reported that drought stress
decreased leaf nitrogen content, which in turn reduced photosynthetic capacity in prairie
grasses.
Nitrogen
Nitrogen is one of the main elemental constituents of plant cells (Salisbury and
Ross 1999).To meet commercial yield requirements, nitrogen (N) is supplied in the form
of fertilizers. Among all essential nutrients supplied by fertilizer, N is required in the
greatest quantity (Bowman et al. 2002) and thus is applied to crops in the largest quantity
(Snyder et al. 1984). Nitrogen is available to plants in different forms including nitrate
(NO3) and ammonium (NH4) (Bowman et al. 2002). The fate of N fertilizers is important
for both turf management and environmental quality. While applied fertilizers nourish the
plant, improper or excess application of nitrogenous fertilizer can result in leaching of
nitrate. Leaching of nutrients is both a loss to crops and a threat to ground water quality
(Hornsby 1999; Gross et al.1990).
Nitrate is considered one of the most damaging ground water contaminants (Pye
et al. 1983). In residential areas with a large percentage of turfgrass, turf fertilization has
been proposed as a significant contributor of nitrates to ground water (Flipse et al. 1984).
However, in contrast, research has shown that properly managed and fertilized turf is not
a significant source of groundwater contamination (Erickson et al. 2001; Gross et al.
1990; Snyder et al. 1984). Nutrient leaching from turf is nominal due to the thick densely
matted root and shoot system (Gross et al. 1990).
Intensive research has been done on turf, while little work has been done on other
landscape plants to determine fertility regime, water use, and the potential for

9
environmental impact. The traditional Florida landscape is comprised of both turf and
ornamentals (Knox 1991). Due to this coexistence, all plants species often receive similar
fertilization and irrigation, although no studies have been conducted to determine the
effects of turf fertilizer on ornamental plants or the effects of ornamental fertilizers on
turfgrass.
In a study between St. Augustinegrass and a mixed landscape, Erickson et al.
(2001) observed that significantly greater amounts of nitrate were leached from
ornamentals (1.46 mg L-1) than from turf (<0.2 mg L-1) when water soluble N was
applied. More than 30% of the fertilizer N was leached from the ornamentals and < 2%
from turf. However, little or no information is available on the fate of fertilizer sources
applied to both turf and ornamentals. The objectives of this study were a) to evaluate
responses of turfgrass and ornamentals to fertilizer sources, b) to evaluate the potential
for environmental impairment resulting from fertilizer sources, and c) to compare water
use in turf and ornamentals in response to fertilizer sources.

CHAPTER 2 MATERIALS AND METHODS
The experiment was performed in a climate-controlled greenhouse at the G.C.
Horn Memorial Turfgrass Field Laboratory at the University of Florida in Gainesville. St.
Augustinegrass var. Floratam (Stenotaphrum secundatum [Walt.]Kuntze) and a
combination of ornamentals that included Canna generalis L. var. Brandywine,
Ligustrum japonicum Thunb var. Lake Tresca, Nandina domestica Thunb var. Harbor
Dwarf and Allamanda cathartica L. were established in large plastic pots in May 2002.
The pots measured 0.8 m diameter by 0.4 m tall with a volume of 300 L. Mature St.
Augustinegrass sod was harvested from the research field and landscape plants grown in
2.8 L containers were acquired from a retail nursery.
Pots were placed on reinforced metal tables in the greenhouse. Five cm of gravel
was placed at the bottom of the pots and was covered with a mesh cloth to prevent soil
migration into the gravel layer. Pots were then filled with Arredondo fine sand (pH 6.5)
(loamy, siliceous, hypothermic, Grossarenic Paleudalt). Arredondo fine sand has high P
content; Mehlich I extracted P content in this media is 200 ppm. Plants were allowed to
establish for a 2-month period before fertilizer treatments started.
There were three fertilizer treatments: quick release fertilizer (QRF) 16-4-8
(ammonium sulfate, concentrated superphosphate, and potassium chloride), QRF 15-0-15
(ammonium sulfate and potassium chloride), and a slow release fertilizer (SRF) 8-4-12
(polymer coated sulfur coated urea, ammonium phosphate, and polymer coated potassium
sulfate). Fertilizer treatments were applied six times at 2-month intervals (17 July, 19
10

11
September, 20 November 2002, 17 January, 18 March, and 21 May 2003) at a rate of
4.9 g N m-2 to both turf and ornamentals and each of these 2-month periods was called
one fertilizer cycle.
Leachate was collected three times during each fertilizer cycle, at 2, 4, and 8
weeks after the fertilizer application. To facilitate leachate collection, a hole was drilled
into one side of the pot. A 13 mm diameter polyethylene tube was attached to the pot to
allow leachate to drain into a dark 19 L plastic bucket. Leachate was filtered through 11
cm diameter Whatman qualitative filter papers (Fisher Scientific International) and
collected in 20 ml aliquots per pot. Samples were acidified with sulfuric acid (conc.
96.3%) to lower pH and frozen. Samples were submitted to the Analytical Research
Laboratory (ARL) in Gainesville for NO3-N analysis. Throughout the study the volume
of total leachate collected was measured. Results are presented based on both nutrient
concentration in leached water (mg L-1) and total nutrient content (TNC) leached (mg).
Total nutrient content (TNC) was calculated by multiplying nutrient concentration by the
corresponding leachate volume.
TNC= Nutrient concentration × Leached water volume (Eq. 2-1)
Irrigation was applied uniformly to both turf and ornamentals as needed over the course
of the year. Irrigation schedules varied with season, but the rate of irrigation was the
same for both turf and ornamentals (Table 5-1). Total Water Use values were derived
from equation 2-2.
Total Water Use (TWU) = WF+ (IW1+WU1) + (IW2+WU2) + (IW3+WU3)
(Eq. 2-2)
WF = water applied with fertilizer, which was 4L in all fertilizer cycles. IW1 = Water applied before first leaching event, excluding WF
12
IW2 = Water applied between first and second leaching event IW3 = Water applied between second and third leaching event WUn= WAn-WLn, n = leaching event number (n=1, 2, 3) WAn = water applied to a pot on a leaching event WLn = water leached from a pot on a leaching event In this study, Water use efficiency (WUE) was measured by per unit volume of
root mass WUER, shoot mass WUES, and total of root and shoot mass WUET. Data were
analyzed to find the overall water use efficiency over the year and during fertilizer cycle
six (May-July).
Turf visual quality ratings were taken weekly on a scale of 1 to 9, with 9 being
best, 1 being worst and 6 being acceptable. Multispectral reflectance (MSR) readings
were taken three times during each fertilizer cycle; at weeks 1-2, 3-5, and 7-8, using a
Cropscan model MSR 16R (CROPSCAN, Inc., Rochester, MN). Reflectance is measured
at specific wave lengths: 450, 550, 660, 694, 710, 760, 835, and 930 nm. Some important
MSR indexes are normalized difference vegetation index (NDVI), measured as (R930-
R660)/( R930+R660) and Stress-1, measured as R710/R760.
Time domain reflectometry (TDR) (IMKO Micromodultechnik GmbH; Ettlingen,
Germany) was used weekly to measure soil moisture content at different soil levels. Five
cm diameter plastic tubes were inserted vertically in the center of the pots allowing the
TDR probe to be inserted to various depths. When not in use, tubes were capped to avoid
entrance of water. During the last fertilizer cycle, no water was applied for a period of
seven days to measure the change of soil moisture in both turf and ornamental pots.
To determine thatch accumulation, three 25.5 cm2 cores were collected from each
turf pot during the first week of May. Shoots and roots were removed from the collected
plugs, dried for 48 hours at 72° C, and weighed to measure the thatch. Dried thatch was

13
ashed in a muffle furnace (450° C for 5 hours) and organic material weight was
determined.
Recently matured leaf tissue samples were collected in July and November 2002,
and March and July 2003. Samples were dried, ground, and analyzed for nutrient
concentration (N, P, K, Ca, Mg, Fe, Zn, Cu and Mn). Analysis of N was done by total
Kjeldahl nitrogen (TKN) procedure and the remaining elements were analyzed with
Spectro Ciros ICP (SPECTRO Analytical Instruments GMBH & Co. KG, Kleve,
Germany). After 12 months of fertilizer treatments, shoots and roots from each pot were
harvested and dried for 24 hours at 75º C. Roots of ornamental plants were excavated and
washed, but were not separated by plant species due to the intermingling of roots.
Turf was mowed every week with scissors to maintain a height of 9 cm and
clippings were removed. During the summer, turf leaf blade length was measured prior to
mowing. Cypress mulch was applied to the soil surface to a depth of 2.5 cm. A
micronutrient blend (STEP, The Scotts Company) was applied at a rate of 6.7 g m-2
during September 2002 to both turf and ornamentals. To control a minor infestation of
armyworm (Spodoptera spp.) in turf, 8% Bifenthrin was applied at a rate of 4g L-1.
Ligustrum were treated with 2% insecticidal oil during November to control scale
(Hemiberlesia lataniae) infestation. Allamanda was pruned in October to a height of 45
cm and dried shoot weight was collected. Greenhouse temperature was monitored using a
Hobo temperature data logger (Onset Computer Corp; Bourne, MA) (Table 5-2) and light
intensity at different canopy levels was measured weekly with Li-COR 250 (LI-COR,
Inc. Lincoln, NE).

14
Experimental design was a randomized complete block with four replications.
Data were analyzed with the SAS analytical program to determine treatment differences
at the 0.05 significance level and means were separated with Fisher’s LSD and Waller-
Duncan test (SAS institute, Inc. 2003). Websites cited in this thesis were last verified by
the author on November17, 2003.

CHAPTER 3 EFFECT OF FERTILIZER SOURCE ON NITRATE LEACHING AND ST.
AUGUSTINEGRASS TURF QUALITY
Introduction
St. Augustinegrass (Stenotaphrum secundatum [Walt.]Kuntze) is one of the most
popular turfgrasses for home lawns in Florida. This grass is commonly used in Florida
residential lawns (Erickson et al. 2001) and is popular on the gulf coast of Mississippi,
Louisiana, and Texas (Christians 1998). St. Augustinegrass is believed to be native to the
coast of the Gulf of Mexico and the Mediterranean region and thus performs well in
sandy, well-drained Florida soils (Trenholm et al. 2000a). Due to its poor cold tolerance
(Turgeon 1991) St. Augustinegrass is not used in the northern U.S. (Christians 1998).
This coarse textured, stoloniferous grass is from the Paniceae tribe (Turgeon
1991) and can be identified by its collar, which is broad, continuous, and smooth
(Christians 1998). St. Augustinegrass is more shade tolerant than many other warm
season turfgrass species, although there is a wide range of shade tolerance within the
species (Trenholm et al. 2002). Peacock and Dudeck (1981) noticed shade did not affect
the length of stolons, total chlorophyll content, nor leaf weight in six cultivars of St.
Augustinegrass.
To assess the growth, or to compare treatment responses, qualitative responses are
commonly used in turfgrass research, where quality might be expressed by visual and
functional characteristics (Turgeon 1991). These are often described as the combination
15

16
of shoot density, color, and growth habit (Beard 1973). Multispectral radiometry (MSR)
may be used to quantify these subjective values and provides a reliable method for
comparison of turf response to treatments (Trenholm et al. 1999). Plants use varying
amount of light at different wavelengths for physiological processes. Some of the light is
assimilated for those use, while some is reflected off the leaf surface. Measurement of the
amount of light reflected at various wavelengths can be correlated with crop health,
chlorophyll content, fertility, and stress (Carter 1993; Carter and Miller 1994; Trenholm
et al. 2000b).
When irrigating St. Augestinegrass, it is recommended that water be applied on an
“as needed basis” (Trenholm et al. 2003). In some regions, St. Augestinegrass requires
regular irrigation because of its poor drought tolerance (Christians 1998). However, in a
drought resistance study, Sifers and Beard (1999) observed that ‘Floratam’ St.
Augustinegrass survived 158 days of summer drought and retained excellent green color.
Peacock and Dudeck (1984) observed that stomata of St. Augustinegrass are not
protected by a wax coating and therefore have high ET under both drought and non-
drought conditions. In another study, Kim and Beard (1988) noted that St.
Augustinegrass exhibited a medium to low ET rate of 5.8 mm d-1, which was attributed to
low canopy resistance, wider leaf blades, and moderate vertical leaf extension rate.
St. Augustinegrass prefers moderate cultural practices (Cisar et al. 1992) with a
fertility requirement of 10 to 30 g N m-2 yr-1 (Trenholm et al., 2002). University of Florida
recommendations for St. Augustinegrass fertilization vary, depending on location in the
state. In northern Florida, 10-20 g N m-2 yr-1 is recommended, while in central and south

17
Florida 10-25 g N m-2 yr-1 and 20-30 g N m-2 yr-1, respectively, are recommended
(Trenholm et al. 2002).
In residential areas, turfgrass is often cited as a major contributor to non-point
source pollution, which may lead to elevated levels of NO3-N in ground waters. Nitrate
has the potential to contaminate groundwater (Petrovic 1990) if not carefully applied, and
its application to lawns has led to controversy regarding turfgrass use. While some claim
that turf use should be minimized to avoid pollution, research has shown that properly
applied fertilizer will be assimilated by the grass (Snyder et al. 1984; Erickson et al.
2001) and that proper fertilizer management is a factor in reducing non-point source
pollution (Gross et al. 1990). Proper fertilizer application includes using appropriate
rates, optimal timing, and applying the correct amount of water after fertilizing.
Research has shown that the application of controlled release fertilizers to turf
reduces fertilizer leaching (Killian et al. 1966). Concentration of NO3-N in leachate from
turfgrass was found to be dependent on N source, with higher amounts in quick release
products. Brown et al.(1982) observed nitrate losses of 8.6 to 21.9% in golf course greens
(bermudagrass, perennial ryegrass, Kentucky bluegrass, tall fescue, and creeping
bentgrass) fertilized with ammonium nitrate .When slow release sources such as
isobutylidene diurea (IBDU) and ureaformaldehyde (UF) were used, only 0.2 to 1.6%
nitrate was leached. Sulfur coated urea (SCU) is often found in turf fertilizers and it is
less likely to leach (Allen 1971). The mechanism of N release from SCU is by water
penetration through micropores and imperfections in the fertilizer coating; release rate is
therefore directly affected by the coating thickness and quality (Sartain 2001).

18
The traditional Florida landscape is comprised of both turf and ornamentals
(Knox 1991). Due to this coexistence, all plants species often receive similar fertilization
and irrigation. While research has been done on the fertility of turf and its effect on
environmental quality, little information is available on the effects of turf fertilizer
formulations on ornamental plants or the effects of ornamental fertilizer formulations on
turfgrass. In a nutrient management study comparing St. Augustinegrass (Stenotaphrum
secundatum [Walt.] Kuntze) and a mixed landscape planting, Erickson et al. (2001)
observed that a greater amount of NO3-N was leached from ornamentals (1.46 mg L-1) in
comparison to turf (<0.2 mg L-1). More than 30% of the applied N was leached from the
ornamentals and less than 2% from the turfgrass.
The Florida Green Industries Best Management Practices (BMPs) were developed
in 2002, along with an outreach program, to provide education on fertilizer management
to the landscape maintenance industries of Florida. Due to lack of information regarding
effects of fertilizer source on turf vs. ornamentals, the objectives of this study were a) to
evaluate responses of turfgrass and ornamentals to fertilizer sources and b) to evaluate the
potential for environmental impairment resulting from fertilizer sources.
Materials and Methods
The experiment was performed in a climate-controlled greenhouse at the G.C.
Horn Memorial Turfgrass Field Laboratory at the University of Florida in Gainesville. St.
Augustinegrass var. Floratam (Stenotaphrum secundatum [Walt.]Kuntze) and a
combination of ornamentals that included Canna generalis L. var. Brandywine,
Ligustrum japonicum Thunb. var. Lake Tresca, Nandina domestica Thunb. var. Harbor
Dwarf, and Allamanda cathartica L. were established in large plastic pots in May 2002.
The pots measured 0.8 m diameter by 0.4 m tall with a volume of 300 L. Mature St.

19
Augustinegrass sod was harvested from the research field of the G.C. Horn Memorial
Turfgrass Field Laboratory and landscape plants grown in 2.8 L containers were acquired
from a retail nursery.
Pots were placed on reinforced metal tables in the greenhouse. Five cm of gravel
was placed at the bottom of the pots, and a mesh cloth was placed over the gravel to
retain the media. Pots were then filled with Arredondo fine sand (loamy, siliceous,
hypothermic, Grossarenic Paleudalt). Plants were allowed to establish for a 2-month
period before treatments began.
There were three fertilizer treatments: quick release fertilizer (QRF) 16-4-8
(ammonium sulfate, concentrated superphosphate, and potassium chloride), QRF 15-0-15
(ammonium sulfate and potassium chloride), and a slow release fertilizer (SRF) 8-4-12
(polymer coated sulfur coated urea, ammonium phosphate, and polymer coated potassium
sulfate). Fertilizer treatments were applied six times at 2-month intervals (17 July, 19
September, 20 November 2002, 17 January, 18 March and 21May 2003) at a rate of 4.9 g
N m-2 to both turf and ornamentals and each of these 2-month periods is considered one
fertilizer cycle.
Leachate was collected three times during each fertilizer cycle, at 2, 4, and 8
weeks following the fertilizer application. To facilitate leachate collection, a hole was
drilled into one side of the pot. A 13 mm diameter polyethylene tube was attached to the
pot to allow leachate to drain into a dark 19 L plastic bucket. Leachate was filtered
through 11 cm diameter Whatman qualitative filter papers (Fisher Scientific
International) and collected in 20 ml aliquots per pot. Samples were acidified with
sulfuric acid (conc. 96.3%) to lower pH and frozen. Samples were submitted to the

20
Analytical Research Laboratory (ARL) in Gainesville for NO3-N analysis. Throughout
the study the volume of total leachate collected was measured. Results are presented
based on both nutrient concentration in leached water (mg L-1) and total nutrient content
(TNC) leached (mg) over the fertilizer cycle. Total nutrient content (TNC) was calculated
by multiplying nutrient concentration with the corresponding leachate volume.
TNC= Nutrient concentration × Leached water volume (Eq. 2-1)
Irrigation was applied uniformly to both turf and ornamentals as needed over the course
of the year.
Turf visual quality ratings were taken weekly on a scale of 1 to 9, with 9 being
best, 1 being worst and 6 being acceptable turf quality. Multispectral reflectance (MSR)
readings were taken three times during each fertilizer cycle; at weeks 1-2,3-5, and 7-8,
using a Cropscan model MSR 16R (CROPSCAN, Inc., Rochester, MN). Reflectance was
measured at specific wave lengths: 450, 550, 660, 694, 710, 760, 835, and 930 nm. Some
important MSR indices are normalized difference vegetation index (NDVI), measured as
(R930-R660)/( R930+R660) and Stress-1, measured as R710/R760.
Time domain reflectometry (TDR) (IMKO Micromodultechnik GmbH; Ettlingen,
Germany) was used weekly to measure soil moisture content at different soil levels. Five
cm diameter plastic tubes were inserted vertically in the center of the pots allowing the
TDR probe to be inserted to various depths. When not in use, tubes were capped to avoid
entrance of water. During the last fertilizer cycle, no water was applied for a period of
seven days to measure the change of soil moisture in both turf and ornamentals.
To determine thatch accumulation, three 25.5 cm2 cores were collected from each
turf pot during the first week of May. Shoots and roots were removed from the collected
21
plugs, dried for 48 hours at 72° C, and weighed to measure the thatch. Dried thatch was
ashed in a muffle furnace (450° C for 5 hours) and organic material weight was
determined.
Recently matured leaf tissue samples were collected in July and November 2002,
and March and July 2003. Samples were dried, ground, and analyzed for nutrient
concentration (N, P, K, Ca, Mg, Fe, Zn, Cu and Mn). Analysis of N was done by total
Kjeldahl nitrogen (TKN) procedure and the remaining elements were analyzed with
Spectro Ciros ICP (SPECTRO Analytical Instruments GMBH & Co. KG, Kleve,
Germany). After 12 months of fertilizer treatments, shoots and roots from each pot were
harvested and dried for 24 hours at 75º C. Roots of ornamental plants were excavated and
washed but were not separated by plant species due to the intermingling of roots.
Turf was mowed every week with scissors to maintain a height of 9 cm and
clippings were removed. During the summer, turf leaf blade length was measured prior to
mowing. Cypress mulch was applied to ornamentals at a thickness of 2.5 cm. A
micronutrient blend (STEP, The Scotts Company) was applied at a rate of 6.7 g m-2
during September 2002 to both turf and ornamentals. To control a minor infestation of
armyworm (Spodoptera spp.) in turf, 8% Bifenthrin was applied at a rate of 4g L-1.
Ligustrum were treated with a 2% insecticidal oil during November to control scale
(Hemiberlesia lataniae) infestation. Greenhouse temperature was monitored using a
Hobo temperature data logger (Onset Computer Corp; Bourne, MA) (Table 3-2) and light
intensity at different canopy levels was measured weekly with Li-COR 250 (LI-COR,
Inc. Lincoln, NE).

22
Experimental design was a randomized complete block with four replications.
Data were analyzed with the SAS analytical program to determine treatment differences
at the 0.05 significance level and means were separated with Fisher’s LSD and Waller-
Duncan (SAS institute, Inc. 2003). Websites cited in this thesis were last verified by the
author on November17, 2003.
Results and Discussion
Multispectral Reflectance
Multispectral reflectance (MSR) values in the first two week period were
optimized with QRF treatments (Table 3-1). At week 3-5, wavelengths 450 and 710 nm
and Stress-1 index had better responses from QRF 15-0-15 than from SRF 8-4-12.
The results observed during the first two weeks are likely due to differences in the
rate of N release. Both quick release fertilizers released N faster than SRF, resulting in
better turf vigor and quality in the first two weeks following application. After two
weeks, the rate of N release from QRFs presumably decreased and no differences were
found during weeks 3-5 at wavelengths 550, 660, and 694 nm (Table 3-1). No differences
in MSR values were noted during the last two weeks of the fertilizer cycle (data not
shown). The availability of N has an impact on shoot growth (Turgeon 1991) and total
chlorophyll content, can be detected by MSR (Carter 1993; Carter and Miller 1994;
Trenholm et al. 2000a).
Visual Quality, Color, and Density
Similar to the MSR data, higher visual quality scores in the first two weeks
following fertilizer applications were obtained with QRF treatments (Table 3-2). At week
3, QRF 15-0-15 treated turf had better quality than 8-4-12 treated turf, but no differences
were found in color and density due to different fertilizer formulations. Beyond three

23
weeks after fertilizer application, no differences in color, quality, and density were noted
(data not shown). Again, faster initial release of N from the QRFs resulted in better turf
quality, color, and density and a gradual decrease in N release reduced turf quality, color,
and density in the later part of the fertilizer cycle. Similar results were noticed by
Trenholm et al. (2001), who observed that N influenced visual quality and color in two
ecotypes of seashore paspalum (Paspalum vaginatum Swartz).
Thatch Accumulation
Measurement of thatch weight showed differences due to fertilizer treatments
(Table 3-3). Thatch accumulation was 38% and 16% greater for 15-0-15 and 16-4-8,
respectively, than SRF 8-4-12. This is probably due to the difference in N release rate.
Faster release of N from QRFs has been associated with increased thatch accumulation in
bermudagrass (Sartain 1985). Since equal amounts of N were supplied by both fertilizers,
perhaps there was an individual or cumulative effect of P and K on thatch accumulation.
In previous studies, Sartain (1992) observed a reduction in growth and uptake of N by
bermudagrass during the warm season growth period when additional P was added. This
was attributed to the competition of H2PO4 and NO3-N uptake with the addition of P,
resulting in less uptake of N and less growth. Since 16-4-8 contains P and 15-0-15 does
not, it might be inferred that P might has a competiitve influence on thatch accumulation.
Shoot and Root Growth
Greater shoot mass (24%) was observed in QRF treated turfgrass compared to
SRF (Table 3-3), due to the faster rate of N release from the QRFs. In annual ryegrass
(Lolium multifloram Lam) plant biomass increased with N concentration in nutrient
solutions. Sagi et al.(1997). No differences were found in root mass due to fertilizer
treatments (Table 3-3).

24
Nitrate Leaching by Concentration (mg L-1)
Nitrate concentration in leached water was higher in ornamentals than in turf
(Figure 3-1; Figure 3-2; Table 3-4). Differences were found on day 15 and day 60 and
with the average of all three leachate events (Figure 3-1).
16-4-8 QRF leached less NO3-N from turf than from ornamentals. Differences
were noticed on day 15, day 60 and with the average of all three leachate events (Table 3-
4). There were no differences in leaching between plant type with 8-4-12 and 15-0-15
treatments. Differences in NO3-N leaching were found between turf and ornamentals in
fertilizer cycle 2 (Sep-Nov), cycle 4 (Jan-Mar) and cycle 5 (Mar-May) and with the
average of all three cycles (Figure 3-2). In all of these cases, nitrate concentration in the
leachate from turf was lower than from ornamentals (Figure3-2). In a study in south
Florida, Erickson et al. (2001) observed that a greater amount of NO3-N was leached
from ornamentals (1.46mg L-1) in comparison to turf (<0.2 mg L-1). More than 30% of
the applied N was leached from the ornamentals and < 2% from the turfgrass.
Averaged over both plant treatments, the most NO3-N was leached from QRF 16-
4-8 and the least from 8-4-12 (P-value 0.07), (Figure 3-3). This is most likely due to the
slow release nature of 8-4-12, which allowed plants to take up nutrients over a longer
period of time resulting less leaching. Turf treated with quick release 16-4-8 produced
higher NO3-N concentration than 15-0-15. In previous studies, Sartain (1992) observed a
reduction in uptake of N by bermudagrass during the warm season growth period when
additional P was added, which was explained by the competition of H2PO4 and NO3-N
for uptake. Addition of P resulted in less uptake of N, which could account for
differences seen here between QRF treatments.

25
Nitrate Leaching by Volume (mg)
Average NO3-N leaching results showed that turf leached 2.9 mg and ornamentals
leached 4.3 mg in a fertilizer cycle. Turf leached 32% less NO3-N than ornamentals and
was most likely due to the differences in root anatomy between turfgrass and ornamentals
(Klepper 1990). The dense, intermingled, fibrous root network of turf was more efficient
in taking up the nutrients than the ornamentals.
There were differences between plant treatments over time for total NO3-N
leached from QRF 16-4-8 (Table 3-5). Turf leached less on day 15 and when averaged
over all leaching events. There were no differences over time in the other two fertilizer
treatments.
Both by concentration and by total volume, turf leached less NO3-N than
ornamentals. This may be due to the intermingled fibrous, root network found in turf
(Turgeon 1991), which filters nutrients more effectively than ornamentals. When treated
with QRF 16-4-8, ornamentals leached more NO3-N than turf, but no differences were
found with QRF 15-0-15 and SRF 8-4-12.This was probably due to the difference in rate
of N release between fertilizers and difference in root anatomy between plant types. Turf
roots were more efficient in taking up the NO3-N as it was released at faster rate from the
applied 16-4-8.
Leaf Tissue Nutrient
Turf leaf tissue nutrient analysis showed no differences in total Kjeldahl nitrogen
(TKN) between different fertilizer treatments (Table 3-6). This was probably due to the
application of nitrogen at the same rates. Similar results were also found for all other
nutrients, none of them showed significant difference due to fertilizer treatments (Table
3-6).

26
Conclusions
This research provides information about the effect of two quick release turf
fertilizers and one slow release palm fertilizer on turf and their effects on environmental
quality. Multispectral reflectance and visual quality results showed that QRFs resulted in
better quality turf for the first two weeks following fertilizer application. Less biomass
production (thatch and shoot weight) was observed in SRF treated turf. No difference was
noticed in leaf nutrient contents due to fertilizer treatments. Turf leached less NO3-N than
ornamentals.16-4-8 QRF leached more nitrate than SRF 8-4-12. Overall results indicate
that both QRFs 15-0-15 produced better plant quality, while 15-0-15 and SRF 8-4-12 had
a reduction in nitrate leachate.
This enclosed container research provides preliminary data upon which in situ
research may be modeled. Results obtained in this research may vary in an actual
landscape setting due to root growth and branching habits, differences in ET rate in an
open environment, and other variables that would be present in an uncontrolled
environment. Further research is required to verify how nutrient release rate affects turf
and ornamental quality and nitrate leaching in an urban landscape.

Table 3-1. Multispectral reflectance values in turfgrass throughout the fertilizer cycle.
27
WV (nm)
450 550 660 694 710 NDVI Stress -1
16-4-8 (QRF)
3.71 az 7.80 a 3.71 a 4.99 a 9.63 a 0.86 a 0.24 a
15-0-15 (QRF)
3.76 a 7.83 a 3.82 a 5.07 a 9.71 a 0.86 a 0.24 a
Weeks 0-2
Fertili-zer
8-4-12 (SRF)
5.18 b 10.33 b 6.06 b 7.54 b 13.51 b 0.79 b 0.33 b
P-value 0.0002 0.0018 <0.0001 <0.0001 <0.0004 <0.0001 <0.0001
Anova
CV
30.7 31.1 35.4 33.4 33.5 4.9 19.4
15-0-15 (QRF)
4.04 a
7.34 a 4.25 a 5.79 a 8.67 a 0.837 a 0.27 a
16-4-8 (QRF)
4.80 ab 8.79 a 4.82 a 6.11 a 11.15 ab 0.832 a 0.29 ab
Weeks 3-5
Fertili-
zer
8-4-12 (SRF)
6.42 b 9.89 a 6.34 a 7.58 a 12.59 b 0.774 a 0.37 b
P-value
0.08 NS NS NS 0.06 NS 0.03
Anova
CV
39.7 NS NS NS 29 NS 22.6
z Means followed by the same letter do not differ significantly at the 0.05 probability level. Means are averaged over 6 fertilizer cycles.

28
Table 3-2. Turfgrass visual quality in response to fertilizer sources. Weeks Fertilizer Quality Color Density
15-0-15 (QRF) 7.1 az 7.2 a 7.1 a 16-4-8 (QRF) 7.0 a 7.1 a 7.0 a 8-4-12 (SRF) 6.6 b 6.6 b 6.6 b
P-value <0.0001 0.005 0.0002
Week 1
Anova CV 0.96 2.5 0.93 15-0-15 (QRF) 7.5 a 7.5 a 7.4 a 16-4-8 (QRF) 7.4 a 7.4 a 7.3 a 8-4-12 (SRF) 7.0 b 7.0 b 7.0 b
P-value 0.002 <0.0001 0.0014
Week 2
Anova CV 1.4 0.8 1.2 15-0-15 (QRF) 7.0 a 7.0 a 6.9 a 16-4-8 (QRF) 6.9 ab 6.9 a 6.8 a 8-4-12 (SRF) 6.7 b 6.7 a 6.7 a
P-value 0.03 0.12 0.12
Week 3
Anova CV 1.68 1.98 1.74 z Means followed by the same letter do not differ significantly at the 0.05 probability level. Means are averaged over 6 fertilizer cycles. Table 3-3. Turf thatch, shoot and root weight in response to fertilizer treatments.
Fertilizer
Mean thatch dry weight (g cm-²)
Mean shoot dry weight
(g)
Mean root dry weight
(g) 15-0-15 (QRF)
0.150 a z 1082.46 a 161.83 a
16-4-8 (QRF) 0.126 b 1069.96 a 168.25 a 8-4-12 (SRF) 0.108 c 867.59 b 140.68 a
Anova P=0.0011 P=0.048 NS CV 6.44 10.48 NS
z Means followed by the same letter do not differ significantly at the 0.05 probability level.

29
Table 3-4. Nitrate leaching (mg L-1) from turf and ornamentalsz in response to fertilizer treatments.
Fertilizer
Plant
Day 15 Day 30 Day 60 Average
Turf 0.16 by 0.14 a 0.11 b 0.14 b
Ornamentals 0.66 a 0.60 a 0.28 a 0.52 a
P-value 0.01 NS 0.006 0.002
16-4-8
(QRF)
Anova CV 172.2 NS 104.4 121.5
Turf 0.30 a 0.19 a 0.11 a 0.21 a
Ornamentals 0.40 a 0.24 a 0.28 a 0.26 a
15-0-15
(QRF)
P-value NS NS NS NS
Turf 0.13 a 0.10 a 0.10 a 0.11 a
Ornamentals 0.28 a 0.23 a 0.17 a 0.23 a
8-4-12
(QRF)
P-value NS NS NS NS
z Ornamentals included Canna generalis L. var. Brandywine, Ligustrum japonicum Thunb. var. Lake Tresca, Nandina domestica Thunb. var. Harbor Dwarf, and Allamanda cathartica L. y Means followed by the same letter do not differ significantly at the 0.05 probability level. P> 0.05 is non significant (NS). Means are averaged over six fertilizer cycles.

30
Table 3-5. Nitrate leaching (mg) from turf and ornamentalsz in response to fertilizer treatments.
Fertilizer Plant Day 15 Day 30 Day 60 Total
Turf 1.10 by 0.74 a 0.76 a 2.57 b
Ornamentals 2.67 a 1.95 a 1.00 a 5.6 a
P-value 0.009 NS NS 0.01
16-4-8
(QRF)
Anova CV 108.9 NS NS 96.3
Turf 2.20 a 0.90a 0.87 a 3.9 a
Ornamentals 1.85 a 0.94 a 0.61 a 3.4 a
15-0-15
(QRF)
P-value NS NS NS NS
Turf 0.84 a 0.70 a 0.68 a 2.22 a
Ornamentals 1.63 a 1.21 a 1.00 a 3.83 a
8-4-12
(SRF)
P-value NS NS NS NS
z Ornamentals included Canna generalis L. var. Brandywine, Ligustrum japonicum Thunb. var. Lake Tresca, Nandina domestica Thunb. var. Harbor Dwarf, and Allamanda cathartica L. y Means followed by the same letter do not differ significantly at the 0.05 probability level. P> 0.05 is non significant (NS). Means are averaged over 6 fertilizer cycles. Table 3-6. Turf leaf tissue nutrient concentration (ppm) in response to fertilizer
treatments. Fertilizer TKN P K Ca Mg Zn Mn Cu Fe 16-4-8 1070 36.64 151.05 28.05 21.06 0.19 0.22 0 0.06
15-0-15 1120 29.1 134.65 26.42 17.63 0.16 0.2 0 0.14 8-4-12 840 34.64 162.7 24.94 21.61 0.24 0.36 0.0012 0.19
Average 1010 33.46 149.45 26.47 20.1 0.196 0.26 0.0004 0.13 P-value NS NS NS NS NS NS NS NS NS
P> 0.05 is non significant (NS). Means are averaged from leaf tissue collections taken throughout the year.

31
0.190.14
0.110.15
0.44
0.35
0.2
0.33
0
0.1
0.2
0.3
0.4
0.5
Leac
hed
Nitr
ate
(mg/
L)
Turf Ornamentals
Day 15 Day 30 Day 60 Avg.
a aabaab b
Figure 3-1. Nitrate (mg L-1) leaching between turf and ornamentalsz.
z Ornamentals included Canna generalis L. var. Brandywine, Ligustrum japonicum Thunb. var. Lake Tresca, Nandina domestica Thunb. var. Harbor Dwarf, and Allamanda cathartica L. Bars with the same letter are not different at the 0.05 probability level. Means are averaged over 6 fertilizer cycles.
0.39
0.44
0.33
0.22
0.020.12 0.09
0.17
0.29
0.15
0.310.35
0.27 0.29
0
0.1
0.2
0.3
0.4
0.5
Leac
hed
Nitr
ate
(mg/
L)
Turf OrnamentalsCy-6Cy-5Cy-4Cy-3Cy-2Cy-1 Avg.
baaaaaa aa a babb
Figure 3-2. Nitrate (mg L-1) leaching from turf and ornamentalsz in six fertilizer cycles.
z Ornamentals included Canna generalis L. var. Brandywine, Ligustrum japonicum Thunb. var. Lake Tresca, Nandina domestica Thunb. var. Harbor Dwarf, and Allamanda cathartica L. Bars with the same letter are not different at the 0.05 probability level. Means are average of 3 leachate collections per fertilizer cycle.

32
0.33
0.24
0.17
0
0.1
0.2
0.3
0.4
Leac
hed
Nitr
ate
(mg/
L)
16-4-815-0-158--4-12
baba
Figure 3-3. Nitrate leaching (mg L-1) from different fertilizers averaged from both turf and ornamentalsz.
z Ornamentals included Canna generalis L. var. Brandywine, Ligustrum japonicum Thunb. var. Lake Tresca, Nandina domestica Thunb. var. Harbor Dwarf, and Allamanda cathartica L. Bars with the same letter are not different at the 0.05 probability level. Means are averaged over six fertilizer cycles.
CHAPTER 4 EFFECT OF FERTILIZER SOURCE ON NITRATE LEACHING AND
ORNAMENTAL PLANT QUALITY
Introduction
Canna generalis L. var. Brandywine, Ligustrum japonicum Thunb. var. Lake
Tresca, Nandina domestica Thunb. var. Harbor Dwarf, and Allamanda cathartica L. are
landscape ornamentals commonly grown in Florida. Canna generalis, a perennial
flowering plant found in the tropics and subtropics, belongs to the Cannaceae family (Tjia
and Black 1991). Ligustrum japonicum, an evergreen woody shrub with fragrant white
flowers and berrylike fruits, belongs to the Oleaceae family (Midcap et al. 1991).
Nandina domestica, a semi-deciduous shrub, that turns red in the fall, belongs to the
Berberidaceae family (Black 2002). Allamanda cathartica is a vine-like shrub with bright
yellow flowers and it belongs to the Apocynaceae family (Black 2002). Little research
has been done on these plants when grown separately and the author is not aware of
studies that have evaluated these plants as part of a mixed vegetation landscape. Irrigation
requirements and fertility regimes and comparative quality measurement of these plants
are not well understood either.
It is known that improper application of nitrogen fertilizer can lead to leaching
which is a major source of ground water pollution (Hornsby 2003). Nitrate (NO3-N) has a
tendency to leach in sandy soils (Petrovic 1990); and because the water table in many
parts of Florida is close to the soil surface, the combination of sandy soil and shallow
water table might potentially cause water pollution from urban horticultural activities.
33

34
Nitrate contamination of Florida’s ground and surface waters is a serious issue and has
recently been the topic of much research.
Impairment of environmental quality not only depends on fertilizer concentration,
but also on fertilizer type. Broschat (1995) observed that NO3-N leaching from container
grown plants was greater when soluble fertilizer was applied. The nutrient loss from SRF
was one half the amount lost from QRF. He concluded that the use of slow or controlled
release fertilizers on container grown plants can minimize leaching losses. The potential
for NO3-N leaching from SRF also depends on application frequency. Cox (1993) found
that a single large dose of SRF applied to container-grown Marigold (Tagetes erecta L.),
leached more NO3-N than two split doses. However, little information is available to
quantify N leaching from the whole landscape (Erickson 2001).
From an economic perspective, quality of the plant is also of great importance.
One of the methods for measuring crop health and quality is light reflectance with a
multispectral radiometer. Multispectral radiometry provides a reliable method for
qualitative comparison of plants (Trenholm et al. 1999). Plants get the energy by
absorbing sunlight for its physiological activities. Partial sunlight is absorbed by the plant
from the total sunlight coming into the plant canopy. Some light, however is reflected,
depending on the crop condition. This instrument measures the reflected part of the
visible and near infrared (NIR) regions of the light spectrum; and the region most
affected by stresses of various kinds (CROPSCAN, Inc. 2003). Multispectral radiometry
can discriminate between stressed and non-stressed vegetation (Carter 1993 Carter and
Miller 1994). Multispectral reflectance measurements can detect the changes in leaf
chlorophyll concentration (Carter 1993; Carter and Miller 1994; Trenholm et al. 2000b)

35
and can be used in turfgrass and agronomic crop research. Reflectance measurements can
be conveniently used in turf research, where the crop canopy is uniform, allowing
virtually no transmittance as would occur in many plant species. Little research has been
done to evaluate the effectiveness of MSR to measure ornamental plant health and
quality. In ornamental plants, woody shoots, flowers, and fruits lack chlorophyll and are
not uniformly distributed, which may affect results of MSR.
The traditional landscape comprises both turf and ornamentals, which often
receive the same fertilization regime (Knox 1991). While intensive research has been
done on the fertility of turf and its effect on environmental quality, little is known about
nutrient management of urban landscape ornamentals and their potential role in
environmental pollution. Because information is lacking on the effect of fertilizer source
applied to ornamentals, the objectives of this study were to evaluate responses of
landscape plants to fertilizers and to evaluate the potential for environmental impairment
resulting from fertilization of landscape plants.
Materials and Methods
The experiment was performed in a climate-controlled greenhouse at the G.C.
Horn Memorial Turfgrass Field Laboratory at the University of Florida in Gainesville. A
combination of ornamentals including Canna generalis L. var. Brandywine, Ligustrum
japonicum Thunb. var. Lake Tresca, Nandina domestica Thunb.var Harbor Dwarf and
Allamanda cathartica L. were established in large plastic pots in May 2002. The pots
measured 0.8 m diameter by 0.4 m tall and had a volume of 300 L. Landscape plants
grown in 2.8 L containers were acquired from a retail nursery for use in this study.
Pots were placed on reinforced metal tables in the greenhouse. Five cm of gravel
was placed at the bottom of the pots, and with a mesh cloth was placed over the gravel to
36
retain the media. Pots were then filled with Arredondo fine sand (loamy, siliceous,
hypothermic, Grossarenic Paleudalt). Plants were allowed to establish for a 2-month
period before treatments began.
There were three fertilizer treatments: quick release fertilizer commonly used in
turf (QRF) 16-4-8 (ammonium sulfate, concentrated superphosphate, and potassium
chloride), QRF 15-0-15 (ammonium sulfate and potassium chloride), and a slow release
fertilizer (SRF) 8-4-12 (polymer coated sulfur coated urea, ammonium phosphate and
polymer coated potassium sulfate). Fertilizer treatments were applied six times at 2-
month intervals (17 July, 19 September, 20 November 2002, 17 January, 18 March and
21May 2003) at a rate of 4.9 g N m-2. Each of these 2-month periods was called one
fertilizer cycle.
Irrigation was applied as needed, which varied with season (Table 3-1). Leachate
was collected three times during each fertilizer cycle, at 2, 4, and 8 weeks following the
fertilizer application. To facilitate leachate collection, a hole was drilled into one side of
the pot. A 13 mm diameter polyethylene tube was attached to the pot to allow leachate to
drain into a dark 19 L plastic bucket. Leachate was filtered through 11 cm diameter
Whatman qualitative filter papers (Fisher Scientific International) and a 20 ml aliquot
was collected from each pot. Samples were acidified with sulfuric acid (conc. 96.3%) to
lower pH and frozen. Samples were submitted to the Analytical Research Laboratory
(ARL) in Gainesville for NO3-N analysis. Throughout the study the total volume of
leachate collected was measured. Results are presented based on both nutrient
concentration in leached water and total nutrient content (TNC) leached. Total nutrient
37
content (TNC) was calculated by multiplying nutrient concentration with the
corresponding leachate volume.
TNC= Nutrient concentration × Leached water volume (Eq. 2-1)
Multispectral reflectance (MSR) readings were taken three times during each
fertilizer cycle; at weeks 1-2, 3-5, and 7-8, using a Cropscan model MSR 16R (Cropscan,
Inc., Rochester, MN). Reflectance was measured at specific wave lengths: 450, 550, 660,
694, 710, 760, 835, and 930 nm. Some important MSR indexes are normalized difference
vegetation index (NDVI), measured as (R930-R660)/( R930+R660) and Stress-1, measured as
R710/R760.
Time domain reflectometry (TDR) (IMKO Micromodultechnik GmbH; Ettlingen,
Germany) was used weekly to measure soil moisture content at different soil levels. Five
cm diameter plastic tubes were inserted vertically in the center of the tubs allowing the
TDR probe to be inserted to various depths. When not in use, tubes were capped to avoid
entrance of water.
Recently matured leaf tissue samples were collected in July and November 2002,
and March and July 2003. Samples were dried, ground, and analyzed for nutrient
concentration (N, P, K, Ca, Mg, Fe, Zn, Cu, and Mn). Analysis of N was done by total
Kjeldahl nitrogen (TKN) procedure and remaining elements were analyzed with Spectro
Ciros ICP (SPECTRO Analytical Instruments GMBH & Co. KG, Kleve, Germany).
After 12 months of fertilizer treatments, shoots and roots from each pot were harvested
and dried for 24 hours at 75º C. Roots of ornamental plants were excavated and washed
but were not separated by plant species due to the intermingling between roots.

38
A micronutrient blend (STEP, The Scotts Company) was applied at a rate of 6.7 g
m-2 in September 2002. Ligustrum were treated with a 2% insecticidal oil during
November to control a scale (Hemiberlesia lataniae) infestation. Cypress mulch was
applied to the soil surface to a depth of 2.5 cm. Allamanda was pruned in October to a
height of 45 cm and dried shoot weight was collected. Greenhouse temperature was
monitored using a Hobo temperature data logger (Onset Computer Corp; Bourne, MA)
(Table 5-2) and light intensity at different canopy levels was measured weekly with Li-
COR 250 (LI-COR, Inc. Lincoln, NE).
Experimental design was a randomized complete block model with four
replications. Data were analyzed with the SAS analytical program to determine treatment
differences at the 0.05 significance level and means were separated with Fisher’s LSD
and Waller-Duncan test (SAS institute, Inc. 2003). Websites cited in this thesis were last
verified by the author on November17, 2003.
Results and Discussion
Multispectral Reflectance
Multispectral reflectance results from the first two week period show that there
were differences due to fertilizer treatments in Stress-1 index, with best responses from
QRF 15-0-15 (Table 4-1). Results from weeks 3-5 indicate that growth index NDVI had
better responses with QRF 15-0-15 than SRF 8-4-12. In the last two weeks of the
fertilizer cycle, treatment differences were observed at wavelengths 550 and 710 nm. At
all these wavelengths, SRF 8-4-12 had better responses than QRF 16-4-8.
For the first five weeks, better responses from QRF may be due in part to the
faster rate of N release by the QRF, which encouraged foliar growth and may have
increased the total chlorophyll content. Increased chlorophyll has been shown to affect

39
MSR results (Carter 1993; Carter and Miller 1994; Trenholm et al. 2000b). Unlike 15-0-
15, the slower rate of N release by SRF 8-4-12 would have less impact on foliar growth
during weeks 0-5. At the end of the fertilizer cycle, however, better results were obtained
from SRF 8-4-12, because N release was still occurring. Because, SRF 8-4-12 contains
sulfur coated urea, plant roots can assimilate N for a longer period of time (Yeager and
Gilman 1991), allowing better plant growth and vigor. Better response from QRF 15-0-15
than from 16-4-8 may be due to the influence of P. Sartain (1992) observed a reduction in
growth and uptake of N by bermudagrass (Cynodon dactylon x C. transvaalensis) during
the warm season growth period when additional P was added, which was explained by
the competition of H2PO4 and NO3-N for uptake. The addition of P resulted in less uptake
of N and less growth. Since, 16-4-8, contains P and 15-0-15 does not, it can be inferred
that P might have an effect on N uptake, thus impacting plant quality.
Shoot and Root Growth
Allamanda had 33% less shoot mass in SRF treated plants than in either QRF
treatment (Table 4-2). Accumulation of dry matter in QRF treated plants was similar.
These results are directly related to N-release characteristics of the fertilizer treatments.
However, these results contradict findings by Broschat (1995) in Spathyphyllum. In his
work QRF treated plants had lower dry weight than SRF treated plants. Similarly,
Allamanda shoot weight collected at termination again showed higher biomass with QRF
treatments (Table 4-3). In Allamanda, SRF treated plants had a lanky growth habit with
fewer shoots and fewer leaves at the basal part of the shoots. However, this effect was not
noticed in Canna, Nandina, and Ligustrum, which had no shoot weight difference due to
treatments. Cumulative dry shoot weight of all plants at termination resulted in lower
biomass with SRF treatments (Table 4-3). This may have been due to a major portion of

40
shoot mass being contributed from Allamanda plants. There were no differences in root
weight due to fertilizer treatments (Table 4-4).
Nitrate Leaching (mg L-1)
Differences due to fertilizer treatments were found when all leachate events were
averaged (Table 4-5). 15-0-15 QRF and SRF 8-4-12 leached 50% and 56% less NO3-N
16-4-8 QRF. This may be due to the slow release nature of 8-4-12, where plants had more
time to take up the nutrient as it released over a longer period of time. As noted above,
Sartain (1992) observed a reduction in uptake of N by bermudagrass during the warm
season growth period when additional P was added, which was attributed to the
competition of H2PO4 and NO3-N for uptake. No differences were found in volume of
nitrate leached due to fertilizer treatments (Data not shown).
Leaf Tissue Nutrient
Leaf tissue nutrient analysis showed that there were no differences in total
Kjeldahl nitrogen (TKN) between fertilizer treatments for any of the ornamentals (Table
4-6). Similar results were found by Stratton et al. (2001), who noticed N concentration in
the plant did not differ with N source in Ligustrum ibolium. Nitrogen was applied at the
same rate in all three treatments and the difference was only in rate of release, which
might not have an effect on leaf N content.
In Canna, no differences due to the fertilizer treatments were found in leaf
nutrient concentrations other than K (Table 4-6). 8-4-12 SRF treated Canna plants
showed higher leaf K content than QRF treated Canna plants. In Nandina, Ligustrum,
and Allamanda, no differences were found in leaf nutrient contents due to the fertilizer
treatments. Leaf nutrient concentrations varied with species. Canna had the highest P, K,

41
and Mn content, while highest Ca, Mg, Zn, and Cu content was found in Allamanda
leaves and Ligustrum had the highest Fe content.
Conclusions
This research provides information about the effect of two quick release turf
fertilizers and a slow release palm fertilizer on ornamentals and their effects on
environmental quality. Multispectral reflectance results have shown better plant quality in
QRF 15-0-15 treated plants during the first five weeks of evaluation, while SRF 8-4-12
treated plants exhibited the best quality during the later three weeks of the fertilizer cycle.
Greater shoot growth was observed in QRF treated Allamanda plants. Greater
concentration of NO3-N was leached from QRF 16-4-8. Leaf K content was higher in 8-
4-12 treated Canna, but no differences were found with any other nutrients. This
enclosed container research provides preliminary data upon which in situ research may be
modeled. Results obtained in this research may vary in an actual landscape setting due to
root growth and branching habits, differences in ET rate in an open environment, and
other variables that would be present in an uncontrolled environment. Further research is
required to verify how nutrient release rate affects ornamental quality and nitrate leaching
in an urban landscape.

42
Table 4-1. Multispectral reflectance values in ornamentalsz throughout the fertilizer cycle.
Wavelengths (nm) Weeks Fertilizers 550 660 710 NDVI Stress-1
16-4-8 (QRF) 9.38 ay
4.97 a 15.28 a 0.83 a 0.35 ab
15-0-15 (QRF) 7.66 a
4.12 a 13.57 a 0.87 a 0.32 a
0-2
8-4-12 (SRF) 9.43 a
5.00 a 15.98a 0.84 a 0.38 b
P-value NS NS NS NS 0.04
Anova
CV
NS NS NS NS 24.10
16-4-8 (QRF) 8.07 a
3.44 a 12.58 a 0.87 ab 0.32 a
15-0-15 (QRF) 6.26 a 3.38 a
10.46 a 0.90 a 0.30 a
3-5
8-4-12 (SRF) 6.54 a 2.41 a
11.65 a 0.86 b 0.34 a
P-value NS NS NS 0.03
NS Anova
CV
NS NS NS 3.7 NS
16-4-8 (QRF) 12.12 b 6.67 a
18.18 b 0.81 a 0.38 a
15-0-15 (QRF) 9.02 ab 4.18 a
14.56 ab 0.86 a 0.34 a
6-8
8-4-12 (SRF) 8.40 a 4.43 a
12.89 a 0.84 a 0.35 a
P-value 0.05
NS 0.05
NS NS Anova
CV
51.4 NS 45.6 NS NS
z Ornamentals included Canna generalis L. var. Brandywine, Ligustrum japonicum Thunb. var. Lake Tresca, Nandina domestica Thunb. var. Harbor Dwarf, and Allamanda cathartica L. y Means followed by the same letter do not differ significantly at the 0.05 probability level. Means are averaged over 6 fertilizer cycles.
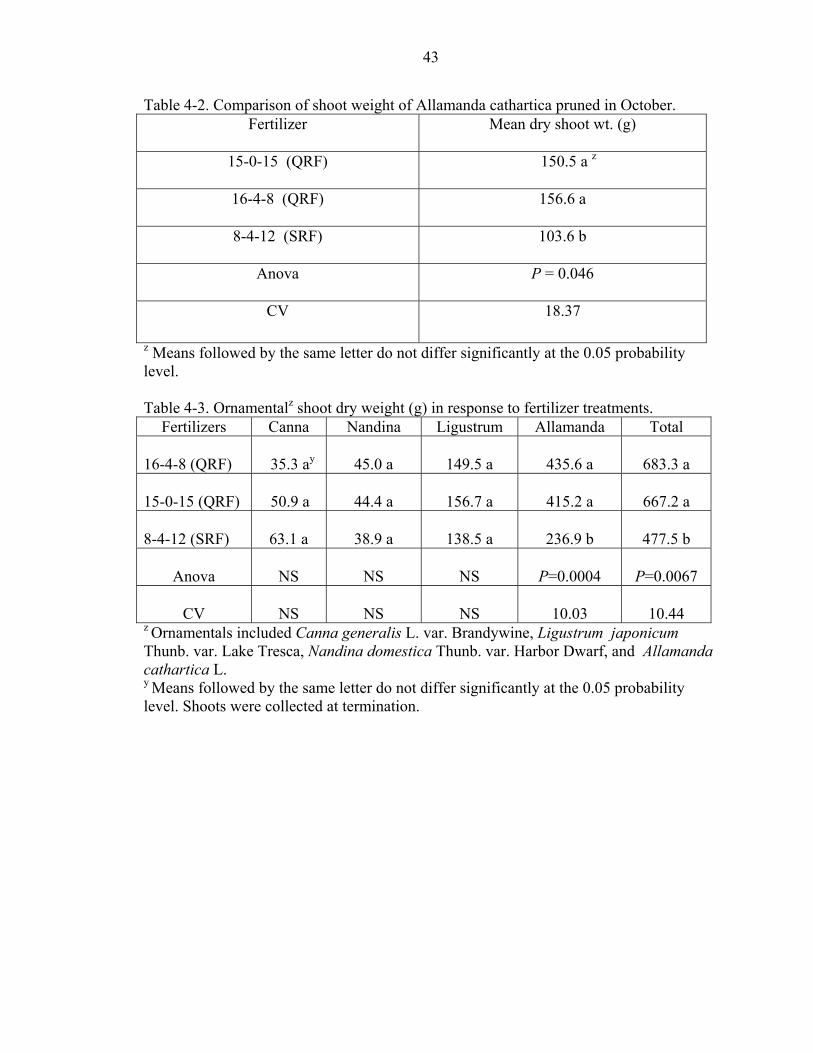
43
Table 4-2. Comparison of shoot weight of Allamanda cathartica pruned in October. Fertilizer
Mean dry shoot wt. (g)
15-0-15 (QRF) 150.5 a z
16-4-8 (QRF) 156.6 a
8-4-12 (SRF) 103.6 b
Anova
P = 0.046
CV 18.37
z Means followed by the same letter do not differ significantly at the 0.05 probability level. Table 4-3. Ornamentalz shoot dry weight (g) in response to fertilizer treatments.
Fertilizers Canna Nandina Ligustrum Allamanda Total
16-4-8 (QRF) 35.3 ay 45.0 a 149.5 a 435.6 a 683.3 a
15-0-15 (QRF) 50.9 a 44.4 a 156.7 a 415.2 a 667.2 a
8-4-12 (SRF) 63.1 a 38.9 a 138.5 a 236.9 b 477.5 b
Anova NS NS NS P=0.0004 P=0.0067
CV NS NS NS 10.03 10.44 z Ornamentals included Canna generalis L. var. Brandywine, Ligustrum japonicum Thunb. var. Lake Tresca, Nandina domestica Thunb. var. Harbor Dwarf, and Allamanda cathartica L. y Means followed by the same letter do not differ significantly at the 0.05 probability level. Shoots were collected at termination.
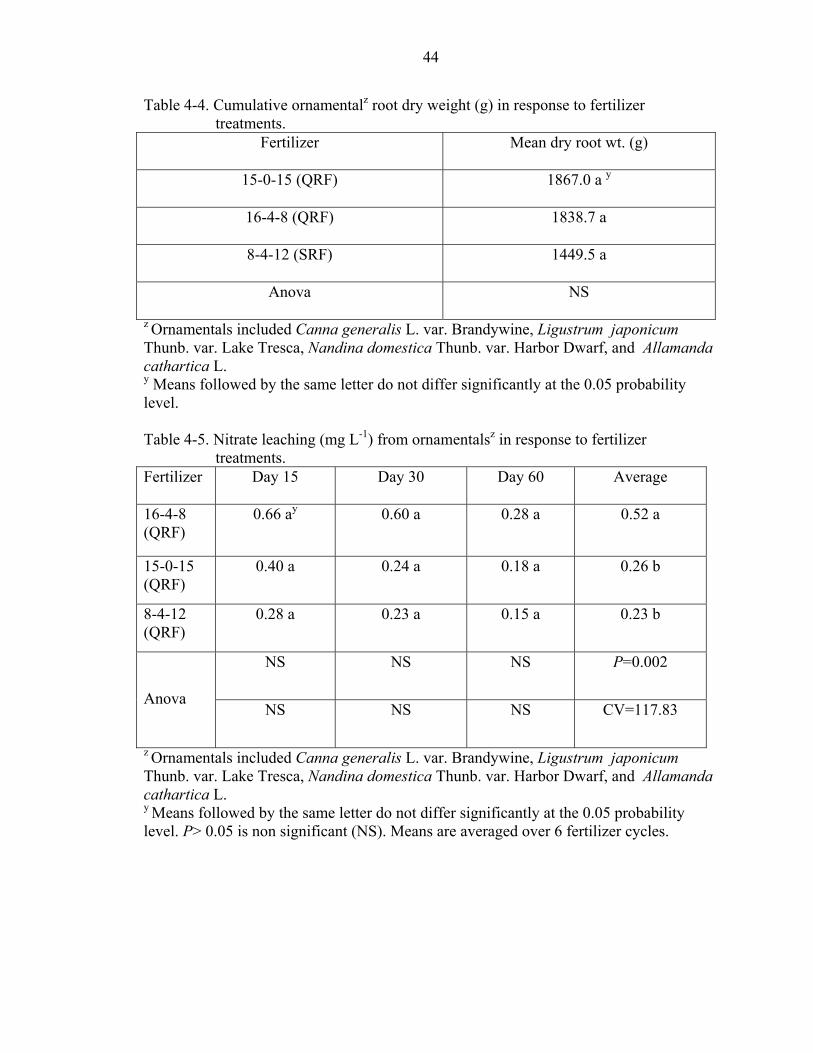
44
Table 4-4. Cumulative ornamentalz root dry weight (g) in response to fertilizer treatments.
Fertilizer
Mean dry root wt. (g)
15-0-15 (QRF) 1867.0 a y
16-4-8 (QRF) 1838.7 a
8-4-12 (SRF) 1449.5 a
Anova
NS
z Ornamentals included Canna generalis L. var. Brandywine, Ligustrum japonicum Thunb. var. Lake Tresca, Nandina domestica Thunb. var. Harbor Dwarf, and Allamanda cathartica L. y Means followed by the same letter do not differ significantly at the 0.05 probability level. Table 4-5. Nitrate leaching (mg L-1) from ornamentalsz in response to fertilizer
treatments. Fertilizer
Day 15 Day 30 Day 60 Average
16-4-8 (QRF)
0.66 ay 0.60 a 0.28 a 0.52 a
15-0-15 (QRF)
0.40 a 0.24 a 0.18 a 0.26 b
8-4-12 (QRF)
0.28 a 0.23 a 0.15 a 0.23 b
NS NS NS P=0.002 Anova
NS NS NS CV=117.83
z Ornamentals included Canna generalis L. var. Brandywine, Ligustrum japonicum Thunb. var. Lake Tresca, Nandina domestica Thunb. var. Harbor Dwarf, and Allamanda cathartica L. y Means followed by the same letter do not differ significantly at the 0.05 probability level. P> 0.05 is non significant (NS). Means are averaged over 6 fertilizer cycles.
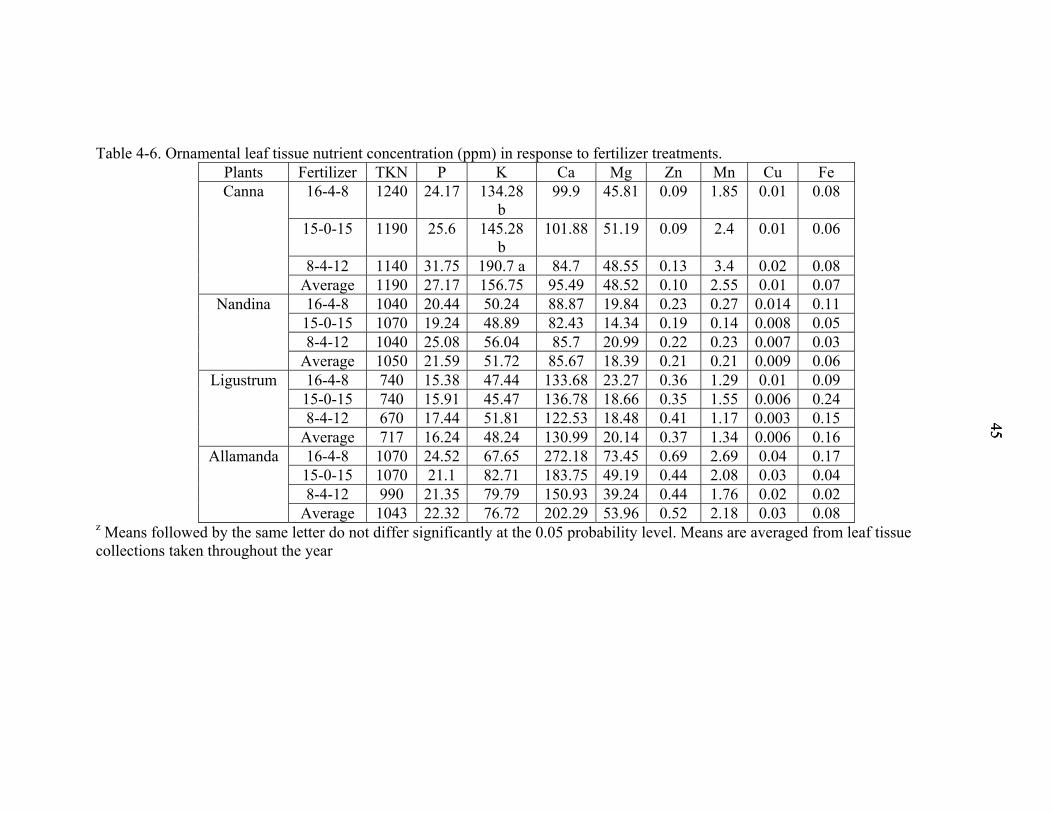
Table 4-6. Ornamental leaf tissue nutrient concentration (ppm) in response to fertilizer treatments.
4545
Plants Fertilizer TKN P K Ca Mg Zn Mn Cu Fe16-4-8 1240 24.17 134.28
b 99.9 45.81 0.09 1.85 0.01 0.08
15-0-15 1190 25.6 145.28b
101.88 51.19 0.09 2.4 0.01 0.06
8-4-12 1140 31.75 190.7 a 84.7 48.55 0.13 3.4 0.02 0.08
Canna
Average 1190 27.17 156.75 95.49 48.52 0.10 2.55 0.01 0.0716-4-8 1040 20.44 50.24 88.87 19.84 0.23 0.27 0.014 0.1115-0-15 1070 19.24 48.89 82.43 14.34 0.19 0.14 0.008 0.058-4-12 1040 25.08 56.04 85.7 20.99 0.22 0.23 0.007 0.03
Nandina
Average 1050 21.59 51.72 85.67 18.39 0.21 0.21 0.009 0.0616-4-8 740 15.38 47.44 133.68 23.27 0.36 1.29 0.01 0.0915-0-15 740 15.91 45.47 136.78 18.66 0.35 1.55 0.006 0.248-4-12 670 17.44 51.81 122.53 18.48 0.41 1.17 0.003 0.15
Ligustrum
Average 717 16.24 48.24 130.99 20.14 0.37 1.34 0.006 0.1616-4-8 1070 24.52 67.65 272.18 73.45 0.69 2.69 0.04 0.1715-0-15 1070 21.1 82.71 183.75 49.19 0.44 2.08 0.03 0.048-4-12 990 21.35 79.79 150.93 39.24 0.44 1.76 0.02 0.02
Allamanda
Average 1043 22.32 76.72 202.29 53.96 0.52 2.18 0.03 0.08z Means followed by the same letter do not differ significantly at the 0.05 probability level. Means are averaged from leaf tissue collections taken throughout the year

CHAPTER 5 WATER CONSUMPTION IN TURF AND ORNAMENTALS
Introduction
Water is the most important constituent of plant cells and it controls plant growth
and development (Salisbury and Ross 1999; Taiz and Zeiger 2002). Loss of water
through evaporation from soil and transpiration from the plant represents the total amount
of water lost, which is known as evapotranspitration (ET) (Turgeon 1991).
Evapotranspiration is an essential physiological process and is greatly affected by
availability of water. ET is important in irrigation management because crop yield is
often directly related to the amount of water lost through ET during the cropping season
(Bronson et al. 2001).
The rate of ET depends on many environmental factors including humidity
(Nonami and Boyer 1990), wind speed, soil moisture (Beard 2002), and shade.
Morphological factors include leaf pubescence and degree of cuticular wax present on the
leaves (Peacock and Dudeck 1984). Plant water consumption may also depend on
anatomical factors such as leaf area index, leaf orientation, and shoot density (Kim and
Beard 1988). Higher turfgrass ET rates were found to be associated with higher amounts
of shoots (Biran et al. 1981; Feldhake et al. 1983; Parr et al. 1984). In contrast lower ET
rates were prevalent with lower shoot growth in bermudagrass (Devitt and Morris 1989)
and St.Augustinegrass (Green et al. 1990). Greater root volume also encourages higher
water uptake. Root systems develop with both downward movement and horizontal
proliferation of branches at any given depth. Root length density (RLD) depends on the
46

47
number of vertical axes, branching history, and elongation rates, which indicate relatively
different root development patterns between monocots such as turf and dicots such as
ornamentals ( Klepper 1990). Plants with more extensive root systems will draw moisture
from a larger volume of soil (Christians 1998).
Total water use (TWU) is the sum of (ET) and the water trapped in plant cells for
growth and development, which is a small amount. Total water use can be correlated with
soil moisture content. In a controlled environment, plants grown in containers might
reflect changes in soil moisture content due to changes in water uptake and ET. In the
landscape, water requirements vary between plant species. Turf should be irrigated on an
as needed basis, which will vary based on season, temperature, soil type, grass species,
and the presence or absence of shade. The frequency or amount of irrigation required by
turf may differ from other plants in the landscape, due largely to differences in root and
shoot mass. Difference in root architecture is one of the factors causing greater frequency
of irrigation in turf than in shrubs. The dense intermingled root system of turf generally
allows it to consume water from the top 15-30 cm of soil at a faster rate than ornamental
roots. The deeper ornamental roots allow shrubs to extract large volumes of water stored
from rainfall and past irrigations, meaning that irrigation frequency may be less for
ornamentals than for turf.
There are different ways to measure water use efficiency. While the differences in
how plant species consume water may result in different irrigation requirements, they do
not necessarily reflect water use efficiency (WUE). Water use efficiency (WUE) can be
defined in many ways, including the ratio of biomass produced per unit of water used or
as the measure of photosynthesis per volume of water consumed. Other methods for
48
measuring WUE are stomatal diffusion and discrimination of carboxylation (Pearcy et al.
1994). Stomatal diffusion suggests that WUE might be expected to increase as stomata
close (Smith and Griffiths 1993). Discrimination of carboxylation suggests that the
degree of carbon isotope discrimination in different plants might be related to WUE
(Farquhar et al. 1982).
Water use efficiency is different for different crops. In a mixed sward of
orchardgrass, creeping red fescue, and bromegrass, Krogman (1967) observed that up to a
certain level of crop growth, factors promoting growth such as N also promotes WUE.
Christians (1998) noted that higher N use might decrease WUE in grasses. However,
limited information is available about the effect of fertilizer source on a plant’s WUE.
Previous research has been done on TWU of turf, while little work has been done
on TWU of landscape plants. The effect of fertilizer formulations on water use in
different plant species also is not well understood. Turf and ornamentals co-exist in a
landscape and may receive similar fertilization and irrigation regimes. The objectives of
this study were to compare total water use by turf and ornamentals and to determine the
effect of fertilizer treatments on water consumption.
Materials and Methods
The experiment was performed in a climate-controlled greenhouse at the G.C.
Horn Memorial Turfgrass Field Laboratory at the University of Florida in Gainesville. St.
Augustinegrass var. Floratam (Stenotaphrum secundatum [Walt.]Kuntze) and a
combination of ornamentals that included Canna generalis L. var. Brandywine,
Ligustrum japonicum Thunb. var. Lake Tresca, Nandina domestica Thunb. var. Harbor
Dwarf, and Allamanda cathartica L. were established in large plastic pots in May 2002.
The pots measured 0.8 m diameter by 0.4 m tall with a volume of 300 L. Mature St.
49
Augustinegrass sod was harvested from the research field of the G.C. Horn Memorial
Turfgrass Field Laboratory and landscape plants grown in 2.8 L containers were acquired
from a retail nursery.
Pots were placed on reinforced metal tables in the greenhouse. Five cm of gravel
was placed at the bottom of the pots, and a mesh cloth was placed over the gravel to
retain the media. Pots were then filled with Arredondo fine sand (loamy, siliceous,
hypothermic, Grossarenic Paleudalt). Arredondo fine sand has high P content; Mehlich I
extracted P content in this media is 200 ppm. Plants were allowed to establish for a 2
month period before treatments began.
There were three fertilizer treatments: quick release fertilizer (QRF) 16-4-8
(ammonium sulfate, concentrated superphosphate, and potassium chloride), QRF 15-0-15
(ammonium sulfate and potassium chloride), and a slow release fertilizer (SRF) 8-4-12
(polymer coated sulfur coated urea, ammonium phosphate and polymer coated potassium
sulfate). Fertilizer treatments were applied six times at 2-month intervals (17 July, 19
September, 20 November 2002, 17 January, 18 March and 21 May 2003) at a rate of
4.9 g N m-2 to both turf and ornamentals and each of these 2-month periods was called
one fertilizer cycle.
Irrigation was applied uniformly to both turf and ornamentals as needed over the
course of the year. Irrigation schedules varied with season, but the rate of irrigation was
the same for both turf and ornamentals (Table 5-1). Total Water Use values were derived
from equation 2-2.
50
Total Water Use (TWU) = WF+ (IW1+WU1) + (IW2+WU2) + (IW3+WU3)
(Eq. 2-2)
WF = water applied with fertilizer, which was 4L in all fertilizer cycles. IW1 = Water applied before first leaching event, excluding WF IW2 = Water applied between first and second leaching event IW3 = Water applied between second and third leaching event WUn= WAn-WLn, n = leaching event number (n=1, 2, 3) WAn = water applied to a pot on a leaching event WLn = water leached from a pot on a leaching event In this study, WUE was measured by per unit volume of root mass WUER, shoot
mass WUES, and total of root and shoot mass WUET. Data were analyzed to find the
overall water use efficiency over the year and during fertilizer cycle 6 (May-July).
Time domain reflectometry (TDR) (IMKO Micromodultechnik GmbH; Ettlingen,
Germany) was used weekly to measure soil moisture content at different soil levels ( 0-20
cm). A 5 cm diameter plastic tube was inserted vertically in the center of each pot
allowing the TDR probe to be inserted to various depths. When not in use, tubes were
capped to avoid entrance of water. During the last fertilizer cycle, no water was applied
for a period of seven days to measure the change of soil moisture in both turf and
ornamentals.
After 12 months of fertilizer treatments, shoots and roots from each pot were
harvested and dried for 24 hours at 75º C. Ornamental roots were excavated and washed
but were not separated by plant species due to the intermingling between roots.
Turf was mowed every week with scissors to maintain a height of 9 cm and
clippings were removed. During the summer, turf leaf blade length was measured prior to
mowing. In the ornamental pots cypress mulch was applied to the soil surface at a depth
of 2.5 cm. A micronutrient blend (STEP, The Scotts Company) was applied at a rate of

51
6.7 g m-2 in September 2002 to both turf and ornamentals. To control a minor infestation
of armyworm (Spodoptera spp.) in the turf, 8% Bifenthrin was applied at a rate of 4g L-1.
Ligustrums were treated with a 2% insecticidal oil during November to control a scale
(Hemiberlesia lataniae) infestation. Greenhouse temperature was monitored using a
Hobo temperature data logger (Onset Computer Corp; Bourne, MA) (Table 5-2) and light
intensity at different canopy levels was measured weekly with Li-COR 250 (LI-COR,
Inc. Lincoln, NE).
Experimental design was a randomized complete block model with four
replications. Data were analyzed with the SAS analytical program to determine treatment
differences at the 0.05 significance level and means were separated with Fisher’s LSD,
Waller-Duncan, and correlation was calculated with Proc GLM (SAS institute, Inc.
2003). Websites cited in this thesis were last verified by the author on November17,
2003.
Results and Discussion
Comparison of Water Consumption by Turf and Ornamentals
In all fertilizer cycles, turf consumed less water than ornamentals (Figure 5-
1).Water use of ornamentals during fertilizer cycles ranged from 11% to 83% more than
turf. Averaged over the year, water consumption of ornamentals was 39% more than turf.
Due to the pot confinement, the ornamentals became root bound, this is logical and
represents greater water uptake due to increased root mass within the containers.
Minimal differences in water use between plant types occurred during the first
cycle (Jul-Sep) after planting. This cycle was part of the establishment period, during
which time ornamentals had less shoot and root mass and therefore used less water than
when mature. Greater differences in water consumption were found in cycles 3 and 4
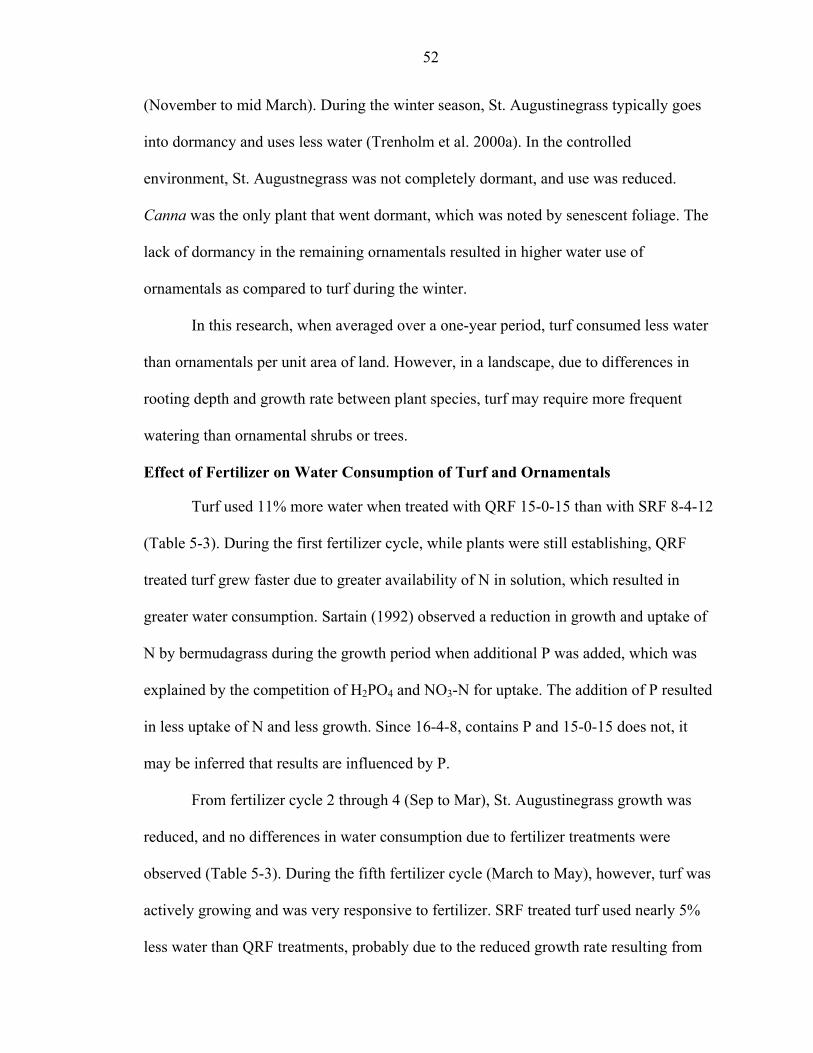
52
(November to mid March). During the winter season, St. Augustinegrass typically goes
into dormancy and uses less water (Trenholm et al. 2000a). In the controlled
environment, St. Augustnegrass was not completely dormant, and use was reduced.
Canna was the only plant that went dormant, which was noted by senescent foliage. The
lack of dormancy in the remaining ornamentals resulted in higher water use of
ornamentals as compared to turf during the winter.
In this research, when averaged over a one-year period, turf consumed less water
than ornamentals per unit area of land. However, in a landscape, due to differences in
rooting depth and growth rate between plant species, turf may require more frequent
watering than ornamental shrubs or trees.
Effect of Fertilizer on Water Consumption of Turf and Ornamentals
Turf used 11% more water when treated with QRF 15-0-15 than with SRF 8-4-12
(Table 5-3). During the first fertilizer cycle, while plants were still establishing, QRF
treated turf grew faster due to greater availability of N in solution, which resulted in
greater water consumption. Sartain (1992) observed a reduction in growth and uptake of
N by bermudagrass during the growth period when additional P was added, which was
explained by the competition of H2PO4 and NO3-N for uptake. The addition of P resulted
in less uptake of N and less growth. Since 16-4-8, contains P and 15-0-15 does not, it
may be inferred that results are influenced by P.
From fertilizer cycle 2 through 4 (Sep to Mar), St. Augustinegrass growth was
reduced, and no differences in water consumption due to fertilizer treatments were
observed (Table 5-3). During the fifth fertilizer cycle (March to May), however, turf was
actively growing and was very responsive to fertilizer. SRF treated turf used nearly 5%
less water than QRF treatments, probably due to the reduced growth rate resulting from

53
SRF as compared to QRF. Leaf length measurements in summer showed that weekly
growth was 3-4 cm in QRF treatments and 1-2 cm in SRF treatment. It is also possible
that turf began active re-growth in March, and QRF treated turf recovered faster due to
more available N for plant growth, thus increasing the water use. In the sixth cycle, (May
to Jul), there was no difference in water consumption between the plant types.
Ornamentals showed variation in water consumption due to different fertilizer
formulations (Table 5-4). SRF 8-4-12 treated plants consumed less water in all cycles
except the first fertilizer cycle (Jul-Sep), In the second fertilizer cycle (Sep-Nov) QRF
15-0-15 and 16-4-8 treated plants consumed 9% and 6% more water, respectively than
those receiving SRF 8-4-12. This suggests that more shoot growth encourages greater ET
and hence, more water consumption. Similar results were observed by Feldhake et al.
(1983) and Biran et al. (1981). In this study, higher total shoot mass was found in QRF
treated ornamental plants (Table 4-3). Plants receiving SRF fertilizer had less shoot mass
and used less water, but in a similar study Broschat (1995) noticed QRFs produced less
biomass than SRFs in Spathyphyllum.
Water Use Efficiency (WUE)
Quick release fertilizer treated turf had higher WUET and WUES in May-July
period (Table 5-5), but no differences were found over the year. Similarly, QRF treated
ornamentals had higher WUES in May-July period (Table 5-6), but no differences were
found over the year.
Water use efficiency by shoots (WUES) was higher in turf than in ornamentals
both in the May-July period and over the entire year (Table 5-7). Opposite results were
noticed with WUER and WUET. Both were higher in ornamentals than in turf during both
the May-July period and over the entire year (Table 5-7).

54
Correlation between Shoots, Roots, and Soil Moisture with Water Use
For turf, TWU was directly correlated to shoot mass, root mass and total mass
(root + shoot) (Table 5-8). Higher water consumption is associated with higher amount of
shoot growth (Parr et al. 1984; Biran et al. 1981). An increase in shoot growth
encourages more leaves and the greater leaf area means a greater number of stomata,
resulting in greater potential for ET. Additionally, an increase in root mass increases the
water uptake capacity of the plant, which can result in more water use.
Results from the last three fertilizer cycles show that TWU was inversely
proportional to soil moisture content (Table 5-8). To support the water use by plants,
water was absorbed from the soil, which was a limited source of moisture. Therefore, the
increase in water consumption by plants resulted in a reduction in the soil moisture
content.
Change in Soil Moisture Content during Seven Days with No Irrigation
A 7-day period of no irrigation in the summer showed differences in soil moisture
content (Fig.5-2). During the first two days of dry down, soil moisture did not differ
between turf and ornamentals. Moreover, from 4 to 7 days, ornamental pots had lower
soil moisture content in comparison to turf. This was probably due to higher root mass in
ornamentals than turf (Table 3-3; Table 4-4), which resulted in greater water use.
Time Domain Reflectometry (TDR) results from the lower 20 cm indicate that
from day 2-7, ornamental pots had less soil moisture content than turf (Fig. 5-3). Results
from the upper 20cm showed no differences between turf and ornamentals (Fig. 5-4) at
any point in time. This is most likely due to the root distribution pattern. Turf roots are
concentrated in the top half of the pot, with less density at greater depths. Ornamental
roots are distributed uniformly throughout the soil profile.

55
Conclusions
This study provides the opportunity to observe differences in total water
consumption in a unit volume of soil, which may be extrapolated to water use by plants
in an urban landscape. Results showed that on an average, ornamentals consumed 39%
more water than turf, which varied from 11% to as high as 83%, depending on the
season. The greatest difference in water consumption was found during winter, when St.
Augustinegrass remained semi-dormant and ornamentals continued to grow.
Both turf and ornamentals consumed less water when treated with SRF and higher
WUE in both turf and ornamentals was found with SRF treatment. In turf, TWU was
directly proportionate to shoot mass and root mass. In ornamentals this relationship was
observed only for shoot mass.
This enclosed container research provides preliminary data upon which in situ
research may be modeled. Results obtained in this research may vary in an actual
landscape setting due to root growth and branching habits, differences in ET rate in an
open environment, and other variables that would be present in an uncontrolled
environment. Further research is required to verify water use efficiency between turf and
ornamentals in an urban landscape.

56
Table 5-1. Irrigation schedule (L) in 6 fertilizer cycles. Fertilizer cycle (FC)
Water applied with fertilizer
(WF)
Water applied before first
leaching event (IW1)
Water applied between first and second leaching
event (IW2)
Water applied between second
and third leaching event (IW3)
1st FC (Jul-Sep)
4 16 12 24
2nd FC (Sep-Nov)
4 16 10 12
3rd FC (Nov-Jan)
4 8 8 12
4th FC (Jan-Mar)
4 8 8 12
5th FC (Mar-May)
4 9 9 38
6th FC (May-Jul)
4 20 20 40
Table 5-2. Average temperature (ºC) in the green house during the study.
2002 2003 Aug Sep Oct Nov Dec Jan Feb Mar Apr May Jun Jul 84.04 84.41 80.1 73.48 71.6 72.46 73.19 72.6 79.61 83.01 86.23 89.02 Table 5-3. Effects of fertilizer source on water consumption (L) of turf in 6 fertilizer
cycles. Frtz. Cycle-1
(Jul-Sep) Cycle-2 (Sep-Nov)
Cycle-3 (Nov-Jan)
Cycle-4 (Jan-Mar)
Cycle-5 (Mar-May)
Cycle-6 (May-Jul)
15-0-15 105.9 a z
88.1 a 70.6 a 68.7 a 116.1 a 136.4 a
16-4-8 101.7 ab 86.4 a 71.7 a 64.8 a 119.3 a 140.3 a
8-4-12 94.1 b 79.2 a 65.2 a 60.1 a 112.4 b 132.1 a
P-value 0.08 NS NS NS 0.009
NS
CV 5.94 NS NS NS 1.77
NS
z Means followed by the same letter do not differ significantly at the 0.05 probability level. P> 0.05 is non significant (NS).

57
Table 5-4. Effects of fertilizer source on water consumption (L) of ornamentalsz in 6 fertilizer cycles.
Frtz. Cycle-1 (Jul-Sep)
Cycle-2 (Sep-Nov)
Cycle-3 (Nov-Jan)
Cycle-4 (Jan-Mar)
Cycle-5 (Mar-May)
Cycle-6 (May-Jul)
15-0-15 116.0 az 126.2 a 110.2 a 124.7 a 166.3 a 181.4 a
16-4-8 113.6 a 122.0 ab 108.2 a 128.5 a 164.5 a 184.5 a
8-4-12 106.5 a 114.9 b 98.2 b 100.4 b 140.7 b 168.0 b
P-value NS 0.025 0.008 0.009 0.043 0.032
CV NS 3.52 3.57 7.66 7.75 9.88
z Ornamentals included Canna generalis L. var. Brandywine, Ligustrum japonicum Thunb. var. Lake Tresca, Nandina domestica Thunb. var. Harbor Dwarf, and Allamanda cathartica L. y Means followed by the same letter do not differ significantly at the 0.05 probability level. P> 0.05 is non significant (NS). Table 5-5.Water use efficiency (WUE) of turf measured (g L-1) during summer and over
the year. Fertilizers WUE CV P-value
8-4-12 6.5 b z
16-4-8 7.6 a
WUE by Shoot
15-0-15 7.9 a
6.63 0.017
8-4-12 1.1a 16-4-8 1.2 a
WUE by Root
15-0-15 1.2 a
NS NS
8-4-12 7.6 b 16-4-8 8.8 a
May-July
WUE by Total mass (Root + Shoot) 15-0-15 9.1 a
5.65 0.01
8-4-12 9.5 a 16-4-8 11.0 a
WUE by Shoot
15-0-15 11.1 a
NS NS
8-4-12 1.5 a 16-4-8 1.7 a
WUE by Root
15-0-15 1.7 a
NS NS
8-4-12 11.1 a 16-4-8 12.7 a
Yearly
WUE by Total mass (Root + Shoot) 15-0-15 12.7 a
NS NS
z Means followed by the same letter do not differ significantly at the 0.05 probability level. P> 0.05 is non significant (NS).

58
Table 5-6. Water use efficiency (WUE) of ornamentalsz measured (g L-1) during summer and over the year.
Fertilizers WUE CV P-value 8-4-12 2.8 b y
16-4-8 3.7 a
WUE by Shoot
15-0-15 3.7 a
11.84 0.037
8-4-12 8.6 a 16-4-8 9.9 a
WUE by Root
15-0-15 10.3 a
NS NS
8-4-12 11.5 a 16-4-8 13.7 a
May-July
WUE by Total mass (Root + Shoot) 15-0-15 13.9 a
NS NS
8-4-12 3.9 a 16-4-8 4.9 a
WUE by Shoot
15-0-15 4.8 a
NS NS
8-4-12 12.1 a 16-4-8 13.4 a
WUE by Root
15-0-15 13.6 a
NS NS
8-4-12 16.0 a 16-4-8 18.4 a
Yearly
WUE by Total mass (Root + Shoot) 15-0-15 18.4 a
NS NS
z Ornamentals included Canna generalis L. var. Brandywine, Ligustrum japonicum Thunb. var. Lake Tresca, Nandina domestica Thunb. var. Harbor Dwarf, and Allamanda cathartica L. y Means followed by the same letter do not differ significantly at the 0.05 probability level. P> 0.05 is non significant (NS).

59
Table 5-7. Comparison of water use efficiency (WUE) between turf and ornamentalsz measured (g L-1) during summer and over the year.
Plant WUE CV P-value Turf 7.4 a y
WUE by Shoot Ornamentals 3.4 b
12.75 <0.0001
Turf 1.1 b WUE by Root Ornamentals 9.6 a
32.1 <0.0001
Turf 8.6 b
May-July
WUE by Total mass (Root +Shoot) Ornamentals 13.0 a
18.2 <0.0001
Turf 10.5 a WUE by Shoot Ornamentals 4.6 b
14.7 <0.0001
Turf 1.6 b WUE by Root Ornamentals 13.0 a
32.9 <0.0001
Turf 12.2 b
Yearly WUE by Total mass (Root +Shoot) Ornamentals 17.6 a
19.3 0.0003
z Ornamentals included Canna generalis L. var. Brandywine, Ligustrum japonicum Thunb. var. Lake Tresca, Nandina domestica Thunb. var. Harbor Dwarf, and Allamanda cathartica L. y Means followed by the same letter do not differ significantly at the 0.05 probability level. P> 0.05 is non significant (NS). Table 5-8. Correlation between water use and soil moisture, shoot, and root volume.
Plants Source of Variation Turf Ornamentals
TWU Shoot
0.72 0.0081
0.71 0.0089
TWU Root
0.68 0.014
NS
TWU Total mass (Root + Shoot)
0.74 0.0054
NS
TWU Soil moisture content
-0.64 <0.0001
* Values greater than 0.64 significant at p= 0.05 and others non-significant (NS).
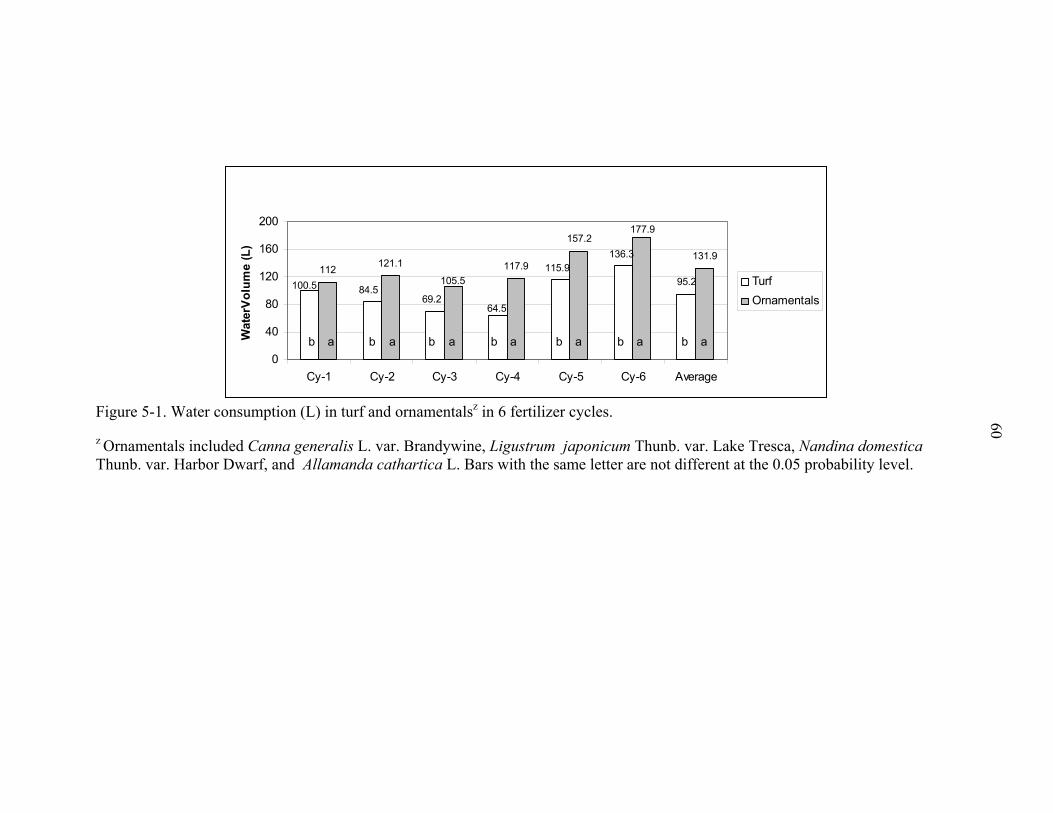
Water consumption by Turf and Ornamentals
95.2112 121.1 117.9
157.2
131.9136.3115.9
64.569.2
84.5100.5
177.9
105.5
0
40
80
120
160
200
Cy-1 Cy-2 Cy-3 Cy-4 Cy-5 Cy-6 Average
Wat
erV
olum
e (L
)
TurfOrnamentals
ab ababab abab ab
Figure 5-1. Water consumption (L) in turf and ornamentalsz in 6 fertilizer cycles. 60
z Ornamentals included Canna generalis L. var. Brandywine, Ligustrum japonicum Thunb. var. Lake Tresca, Nandina domestica Thunb. var. Harbor Dwarf, and Allamanda cathartica L. Bars with the same letter are not different at the 0.05 probability level.

61
17.59
15.28
18.77
16.3617.73
11.4
19.36
18.54
8
12
16
20
24
1 2 4 7
Days
Soi
l moi
stur
e (%
)
Turf Ornamentals
aa
b
b
Figure 5-2. Change in soil moisture (%) in turf and ornamentalz pots in a period of 7 days without irrigation.
z Ornamentals included Canna generalis L. var. Brandywine, Ligustrum japonicum Thunb. var. Lake Tresca, Nandina domestica Thunb. var. Harbor Dwarf, and Allamanda cathartica L. Means followed by the same letter do not differ significantly at the 0.05 probability level.
22.52
20.38
8
12
16
20
24
1 2
Soi
l moi
stur
e (%
)
b
Figure 5-3. Change in soil moisturwithout irrigation at the
z Ornamentals included Canna genThunb. var. Lake Tresca, Nandinacathartica L. Means followed by tprobability level.
a
22.3 21.5819.9718.92
16.4
12.13
4
Days
Turf Ornamentals
aa
b
e (%) in turf and ornamentalz po lower 20 cm.
eralis L. var. Brandywine, Ligu domestica Thunb. var. Harbor Dhe same letter do not differ sign
b
7
ts in a period of 7 days
strum japonicum warf, and Allamanda
ificantly at the 0.05
62
15.24
12.75
16.54
14.16
10.67
13.6
16.2
16.7
8
12
16
20
24
1 2 4 7
Days
Soi
l moi
stur
e (%
)
Turf Ornamentals
Figure 5-4. Change in soil moisture in turf and ornamentalz pots in a period of 7 days without irrigation at the upper 20 cm.
z Ornamentals included Canna generalis L. var. Brandywine, Ligustrum japonicum Thunb. var. Lake Tresca, Nandina domestica Thunb. var. Harbor Dwarf, and Allamanda cathartica L.

CHAPTER 6 CONCLUSIONS
This research looked at 1) the effects of fertilizer sources on turf and ornamentals
2) nitrate leaching and, 3) differences in total water consumption per unit volume of soil
between turf and ornamentals. Both QRFs 15-0-15 and 16-4-8 produced better plant
quality than SRF 8-4-12; however, higher amounts of NO3-N were leached from 16-4-8-
treated plants. The slow release fertilizer (SRF) 8-4-12 leached less NO3-N than the
QRFs but, had reduced plant quality. Higher biomass production was associated with
QRFs. Less NO3-N leached from turf than from ornamentals and turf consumed less
water in the confines of the container environment. Research is needed to verify the
results in the landscape. Due to differences in root growth and distribution in the
landscape, results might vary from those seen in this research. Fertilization frequency
might also influence the results, due to release characteristics of the fertilizer treatments.
With less frequent fertilizer application or higher leaching potential, higher average
quality scores might be obtained with SRF. This controlled environment research
provides preliminary data upon which in situ research may be modeled. Further research
is required to verify how nutrient release rate affects plant quality, nutrient leaching, and
water use in an urban landscape. Increased knowledge of nutrient and water uptake and
use between plant species in the landscape would allow for more efficient fertilization
and water management in the urban landscape.
63

LIST OF REFERENCES
Allen, S.E., C.M. Hunt, and G.L. Terman. 1971. Nitrogen release from sulfur-coated urea, as affected by coating weight, placement, and temperature. Agron. J. 63: 529-533.
Beard, J.B. 2002. Turf management for golf courses. Ann Arbor Press, Inc. Chelsa, MI. Beard, J.B. 1973. Turfgrass: science and culture. Prentice Hall, Englewood Cliffs, NJ. Biran, I., B. Bravado, I. Bushkin-Harav, and E. Rawitz. 1981. Water consumption and
growth rate of 11 turfgrasses as affected by mowing height, irrigation frequency, and soil moisture. Agron. J. 75: 85-90.
Black, R.J. 2002. Florida 4-H Horticulture identification and judging study manual:
ornamentals. Univ. of Fla. Coop. Ext. Serv., 4H PSJ 23. Univ. of Florida, Gainesville, FL.
Bowman, D.C., C.T. Cherney, and T.W. Rufty, Jr. 2002. Fate and transport of nitrogen
applied to six warm season turfgrasses. Crop Sci. 42: 833-841. Bronson, K. F., A. B. Onken, J. W. Keeling, J. D. Booker, and H. A. Torbert. 2001.
Nitrogen response in cotton as affected by tillage system and irrigation level. Soil Sci. Soc. Am. J. 65: 1153-1163.
Broschat, T.K. 1995. Nitrate, phosphate, and potassium leaching from container-grown
plants fertilized by several methods. Hortscience 30(1): 74-77. Brown, K.W., J.C. Thomas, and R.L. Duble. 1982. Nitrogen source effect on nitrate and
ammonium leaching and run off losses from greens. Agron. J. 74: 947-950. Carter, G.A. 1993. Response of leaf spectral reflectance to plant stress. Am. J. Bot. 80:
230-243. Carter, G.A. and R.L. Miller. 1994. Early detection of plant stress by digital imaging
within narrow stress-sensitive wavebands. Remote Sense. Environ. 50: 295-302. Christians, N. 1998. Fundamentals of turfgrass management. Ann Arbor Press, Inc.
Chelsa, MI.
64

65
Cisar, J. L., G. H. Snyder, and G. S. Swanson. 1992. Nitrogen, phosphorus, and potassium fertilization for histosol-grown St. Augustine grass sod. Agron. J. 84: 475-479.
Cox, D.A. 1993. Reducing nitrogen leaching losses from containerized plants: The
effectiveness of controlled release fertilizers. J. Plant. Nutr. 16: 533-545. CROPSCAN, Inc. 2003. Multispectral radiometer. CROPSCAN, Inc. Rochestrer, MN.
Accessed in November, 2003 at www.cropscan.com. Devitt, D.A., and R.L. Morris. 1989. Growth of common bermudagrass as influenced by
plant growth regulators, soil type and nitrogen fertility. J. Environ. Hort. 7: 1-8. Ebdon, J.S., A.M. Petrovic, and R.A. White. 1999. Interaction of nitrogen, phosphorus,
and potassium on evapotranspiration rate and growth of Kentucky bluegrass. Crop Sci. 39: 209-218.
Erickson, J.E., J.L Cisar, J.C. Volin, and G.H. Snyder. 2001. Comparing nitrogen
runoff and leaching and between newly established St. Augustinegrass turf and an alternative residential landscape. Crop Sci.41: 1889-1895.
Farquahar, G.D., M.H. O’Leary, and J.A. Berry. 1982. The relationship between carbon
isotope discrimination and intercellular carbon dioxide concentration. Aust. J. Plant Physiol. 9: 121-137.
Feldhake, C.M., R.E. Danielson, and J.D. Butler. 1983. Turfgrass evapotranspiration I.
Factors influencing rate in urban environment. Agron. J. 75: 824-830. Feldhake, C.M., R.E. Danielson, and J.D. Butler. 1984. Turfgrass evapotranspiration II.
Response to deficit irrigation. Agron. J. 76: 85-89. Flipse, W.J., Jr., B.G. Katz, J.B. Linder, and R. Markel. 1984. Sources of nitrate in
ground water in a sewered housing development. Central Long Island, New York. Ground Water. 32: 418-426.
Florida Dept. of Environmental Protection (FDEP). 2003. Groundwater in Florida. FDEP
Tallahassee, FL. Accessed in November 2003 at http://www.dep.state.fl.us/ water/ groundwater.
Gilman, E.F., and D.G. Watson. 1993. Ligustrum japonicum: Japanese Privet. Univ. of
Fla. Coop. Ext. Serv. ENH-511. Univ. of Florida, Gainesville, FL. Gilman, E.F., and T.H. Yeager. 1990. Fertilizer type and nitrogen rate affects field-grown
laurel oak and Japanese ligustrum. Proc. Fla. State Hort. Soc.103: 370-372.

66
Green, R.L., K.S. Kim, and J.B. Beard. 1990. Effects of flurprimidol, mefluidide, and soil moisture on St. Augustinegrass evapotranspiration rate. HortScience 25: 439-441.
Gross, C.M., J.S. Angle, and M.S. Welterlen. 1990. Nutrient and sediment losses from
turfgrass. J. Environ. Qual.19: 663-668. Haynes J., J. McLaughlin, L. Vasquez, and A. Hunsberger. 2001. Low-maintenance
landscape plants for south Florida. Univ. of Fla. Coop. Ext. Serv., ENH 854. Univ. of Florida, Gainesville, FL.
Heckathorn, S.A., E.H. De Lucia, and R.E. Zielinski. 1997. The contribution of drought-
related decreases in foliar nitrogen concentration to decreases in photosynthetic capacity during and after drought in prairie grasses. Physiol. Plant 101: 173-182.
Hornsby, A.G. 1999. Ground water: the hidden resource. Univ. of Fla. Coop. Ext. Serv.,
SL-48. Univ. of Florida, Gainesville, FL. Killian, K.C., O.J. Attoe, and L.E. Engelbert. 1966. Urea formaldehyde as a slowly
available form of nitrogen for Kentucky bluegrass. Agron. J. 58: 204-206. Kim, K. S., and J.B. Beard. 1988. Comparative turfgrass evapotranspiration rates and
associated plant morphological characteristics. Crop Sci. 28(2): 328-331. Klepper, B. 1990. Irrrigation of agricultural crops-agronomy monograph no. 30.
Madison, WI. Knox, G.W. 1991. Landscape design for water conservation. Univ. of Fla. Coop. Ext.
Serv., ENH-72. Univ. of Florida, Gainesville, FL. Krogman, K.K. 1967. Evapotranspiration by irrigated grass as related to fertilizer. Can. J.
Plant Sci. 47: 281-287. Liyanage, C.E., M.I. Thabrew, and D.S.P. Kuruppuarachchi. 2000. Nitrate pollution in
ground water of Kalpitiya: an evaluation of the content of nitrates in the water and food items cultivated in the area. J. Nat. Sci. Foundation of Sri Lanka. 28(2): 101-112.
Midcap, J.T., R.J. Black, and S.A. Rose. 1991. Ligustrum or Privet. Univ. of Fla.
Coop. Ext. Serv., ENH 45. Univ. of Florida, Gainesville, FL. Nonami, H., and J.S. Boyer. 1990. Primary events regulating stem growth at low water
potentials. Plant Physiol. 94: 1601-1609. Parr, T.W., R.W. Cox, and R.A. Plant. 1984. The effects of cutting height on root
distribution and water use of ryegrass turf. J. Sports Turf Res. Inst. 60: 45-53.
67
Peacock, C. H., and A.E. Dudeck. 1981. Effects of shade on morphological and
physiological parameters of St. Augustinegrass cultivars. p. 493-500. In R.W. Sheard (ed.) proc.4th int. Turfgrass Res. Conf., Guelph, ON, Canada.19-23 July. Int. Turfgrass Soc., and Ontario Agric. Coll., Univ. of Guelph, Guelph, ON.
Peacock, C.H., and A.E. Dudeck. 1984. Physiological responses of St. Augustinegrass to
irrigation scheduling. Agron. J. 76: 275-279. Pearcy, R.W., J. Ehleringer, H.A. Mooney, and P.W. Rundel. 1994. Plant physiological
ecology. Chapman and Hall. London, UK. Petrovic, A.M. 1990. The fate of nitrogenous fertilizers applied to turfgrass. J. Environ
Qual. 19: 1-14. Pye, V.I., R. Patrick, and J. Quarles. 1983. Ground water contamination in the United
States. Univ. of Pennsylvania press, Philadelphia, PA. SAS Institute, Inc. 2003. SAS user’s guide: Statistics, SAS system version 8. SAS
Institute, Inc., Cary, NC. Sagi M, A. Dovrat, T. Kipnis, and H.S. Lips. 1988. Nitrate reductase,
phosphoenolpyruvate carboxylase and glutamine synthetase in annual ryegrass as affected by salinity and nitrogen. J. Plant Nutr. 21: 707-723.
Salisbury, F. B. and C.W. Ross. 1999. Plant physiology. Fourth edition. Brooks/Cole
Pub. Co .Belmont, CA . Sartain, J.B. 1985. Mobility and extractability of phosphorus applied to the surface of
Tifway bermudagrass turf. Soil Crop Sci. Soc. Florida Proc. 39: 47-50. Sartain, J.B. 1992. Phosphorus and zinc influence on bermudagrass growth. Soil Crop
Sci. Soc. Florida Proc. 51: 39-42. Sartain, J.B. 2001. Soil Testing and interpretation for Florida turfgrasses. Univ. of Fla.
Coop. Ext. Serv. SL 181.Univ. of Florida, Gainesville, FL. Sifers I.S. and J.B. Beard. 1999. Drought resistance in warm season grasses. Golf Course
Management 67(9): 67-70. Smith, J.A.C. and H. Griffiths. 1993. Water deficits. Bios Scientific Publishers. Oxford,
UK. Snyder, G.H., B.J. Augustin, and J.M. Davidson. 1984. Moisture sensor-controlled
irrigation for reducing N leaching in bermudagrass turf. Agron. J. 76: 964-969.

68
StandardOut, Inc. 2003. The plants database. StandardOut, Inc. Accessed in November,
2003 at http://plantsdatabase.com. Stratton, M.L., G.L. Good, and A.V. Barker. 2001. The effects of nitrogen source and
concentration on the growth and mineral composition of privet. J. Plant Nutrition. 24 (11): 1745-1772.
Taiz, L., and E. Zeiger. 2002. Plant physiology. Third edition. The Benjamin/Cummings
Publishing Company Inc. Redwood city, CA. Tjia, B., and R.J. Black. 1991. Cannas for Florida landscape. Univ. of Fla. Coop. Ext.
Serv., Circ. 424. Univ. of Florida, Gainesville, FL. The Nitrate Elimination Co., Inc. 2000. Nitrate: Health risks to consumer. The Nitrate
Elimination Co., Inc. Lake Linden, MI. Accessed in November, 2003 at http://www.nitrate.com.
Trenholm, L. E., R.N. Carrow, and R.R. Duncan. 1999. Relationship of multispectral
radiometry data to qualitative data in turfgrass research. Crop Sci. 39: 763-769. Trenholm L.E., R.N. Carrow, and R.R. Duncan. 2001. Wear tolerance, growth, and
quality of seashore paspalum in response to nitrogen and potassium. Hortscience 36(4): 780-783.
Trenholm, L. E., J.L. Cisar, and J.B. Unruh. 2000a. St. Augustinegrass for Florida lawns.
Univ. of Fla. Coop.Ext. Serv., ENH 5. Univ. of Florida, Gainesville, FL. Trenholm, L.E., E.F. Gilman, G.W. Knox, and R.J. Black. 2002. Fertilization and
irrigation needs for Florida lawns and landscapes. Univ. of Fla. Coop. Ext. Serv., ENH 860. Univ. of Florida, Gainesville, FL.
Trenholm, L. E., M.J. Schlossberg, G. Lee, W. Parks, and S.A. Geer. 2000b. An
evaluation of multispectral responses on selected turf grass species. Int. J. Remote Sens. 21(4): 709-721.
Trenholm, L. E., J.B. Unruh, and J.L. Cisar. 2003. Watering your Florida lawn. Univ. of
Fla. Coop. Ext. Serv., ENH 9. Univ. of Florida, Gainesville, FL. Turgeon, A.J. 1991. Turfgrass management. Prentice-Hall, Englewood Cliffs, NJ. Yeager, T.H., and E.F. Gilman. 1991. Fertilization recommendations for trees and shrubs
in home and commercial landscapes. Univ. of Fla. Coop. Ext. Serv., Circ. 948. Univ. of Florida, Gainesville, FL.

BIOGRAPHICAL SKETCH
Subhrajit Saha was born in 1977 in a small Indian city called Kanchrapara. Soon
after his birth, his family moved to another small city named Kalyani, where he spent his
boyhood. He completed his twelve years of education at the Kalyani University
Experimental High School. In 1996, he joined Bidhan Chandra Krishi Viswavidyalaya
(State Agricultural University), where he received his B.Sc. degree in horticulture.
He joined the University of Florida in 2001 and will graduate with a M.S. degree
in environmental horticulture in 2004. Upon graduation he will continue for a Ph.D. at
the University of Florida.
.
69