effect of extraction parameters on polyphenols of caffeinated and decaffeinated · pdf...
TRANSCRIPT

Effect of Extraction Parameters on Polyphenols of
Caffeinated and Decaffeinated Green Tea
by
Sujatha Goud Gudala
A Research Paper Submitted in Partial Fulfillment of the
Requirements for the Master of Science Degree
ill
Food and Nutritional Sciences
Dr. Martin G. Ondrus, Research Advisor
The Graduate School
University of Wisconsin-Stout
August, 2008

11
The Graduate School University of Wisconsin-Stout
Menomonie, WI
Author: Sujatha Goud, Gudala
Title: Effect of Extraction Parameters on Polyphenols of Caffeinated
and Decaffeinated Green Tea
Graduate Degree! Major: MS Food and Nutritional Sciences
Research Advisor: Martin G. Ondrus, Ph.D.
MonthNear: August, 2008
Number of Pages: 98
Style Manual Used: American Psychological Association, 5th edition
ABSTRACT
Green tea is of growing importance due to its health benefits associated with it's
antioxidant contents. The extraction parameters, time and temperature, can influence the
polyphenol and methylxanthine concentrations of green tea, and were investigated in this
study. The purpose of the study was to quantify the polyphenols (catechin, epicatechin,
epigallocatechin, epicatechin gallate, epigallocatechin gallate) and methylxanthines
(caffeine, theobromine and theophylline) in different green teas (Salada®, Celestial
Seasonings®, and Bigelow®) using both caffeinated and decaffeinated forms
manufactured commercially in United States at different extraction times (2, 4, 6, 8, and
10 minutes) and extraction temperatures (80°C, 85°C, 90°C, 95°C, 100°C). This study
also quantified the concentrations at room temperature (24°C) and longer extraction times
(1 hour, 2 hour, 3 hour, 4 hour, 5 hour, 6 hour, 7 hour, 24 hour).

111
For the longer time extraction conditions, the amount ofpolyphenoIs increased
up to 7 hours and then decreased in concentration after 24 hours for all the brands both in
caffeinated and decaffeinated forms. Larger concentrations of polyphenols and
methylxanthines are obtained at a temperature of 100°C and at extraction time of 8-10
minutes (for example, 280 mg/serving for Celestial Seasonings® green tea at 100°C, at
10 minutes). The concentrations of polyphenoIs decreased with a decrease of temperature
at constant times and increased with an increase of time at constant temperatures.
Interestingly Bigelow® decaffeinated green tea had larger amounts of EGCG and total
polyphenol content compared to the caffeinated tea, which was not found in either
Salada® or Celestial Seasonings® green teas.
IV
The Graduate School
University of Wisconsin-Stout
Menomonie, WI
Acknowledgments
I would like to thank the following individuals for their help, contribution, effort,
encouragement in completion of my thesis work. First, I would like to thank Dr. Martin
Ondrus, for his tremendous contribution to my thesis completion by involving in the
laboratory work, development of methods for analysis, encouraging in participation and
presentation of work in conferences. Dr. Cynthia Rohrer, thank you for editing the paper,
for helping in completion of research. Dr. Carolyn Barnhart, thank you for
encouragement, for editing the paper and your support for completion of my thesis work.
I thank the Chemistry department, for providing the laboratory equipment, solutions and
space to carry out the experiments for the research. Chemistry Senior Laboratory
Technician, for sourcing the chemicals, glassware needed for the research. I would like to
thank my family members, without their support I would not have reached my goal. Last
but not least, I would like to thank my friends for their support and encouragement
towards completion of my research.

v TABLE OP CONTENTS
............................................................................................................................... Page
ABSTRACT ii
List of Tables v
1st 0 19ures Vll
Chapter I: Introduction 1
L· fP' ..
Statement ofthe Problem 4
Purpose ofthe Study 5
Assumptions ofthe Study 6
Definition ofTerms 6
Chapter II: Literature Review 8
Chapter III: Methodology 35
Subject Selection and Description 35
Instrumentation 41
Data Analysis 45
Chapter IV: Results and Discussion 46
Chapter V: Conclusion 72
Recommendations 73
References 75
Appendix A: Catechin (C) Standard Curve 81
Appendix B: Epicatechin (EC) Standard Curve 82
Appendix C: Epicatechin gallate (ECG) Standard Curve 83

VI
Appendix D: Epigallocatechin (EGC) Standard Curve 84
Appendix E: Epigallocatechin gallate (EGCG) Standard Curve 85
Appendix F: Caffeine (Cat) Standard Curve 86
Appendix G: Theobromine (Tb) Standard Curve 87
Appendix H: Theophylline (Tp) Standard Curve 88

Vll
List of Tables
Table 1: Polyphenolic Constituents in Green and Black Tea Beverages (% Dry Solids) 27
Table 2: Multi-step extraction of green tea with water at ratio 40 mL: 1 g (Ts=95°C, t= I0 minutes) 28
Table 3: Amount of catechins and caffeine in green tea leaves, variety Fanning Belas ..............................................................................................29
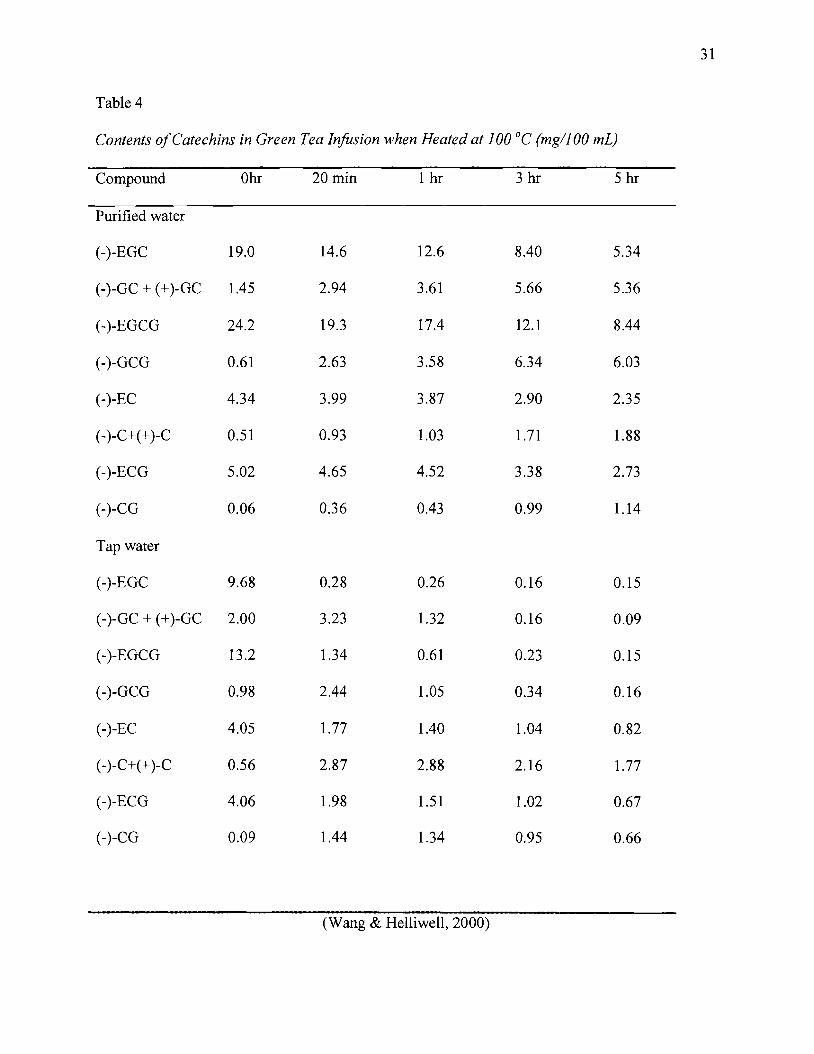
Table 4: Contents of catechins in green tea infusion when heated at 100°C (mg/l00mL) 31
Table 5: Brewing conditions of different brands of green tea 36
Table 6: Individual Solids (mg) Diluted to 25.0 mL to Produce Standard Solutions...... 38
Table 7: Mass (mg) of Individual Solids Diluted to 25.0 mL to Prepare Standard Mixtures 38
Table 8: Concentrations of the Individual Solids (mg/L) 39
Table 9: Concentrations of the Individual Solids in Standards Mixtures (mg/L) 39
Table 10: Average mass (g) of Tea Leaves from the Tea Bags of the Green Teas ...... .41
Table 11: Gradient Separation Conditions (Mobile Phase) .43
Table 12: Concentrations (mg) ofCatechins and Methylxanthines per 250 mL Serving in Salada® Green Tea Samples at Room Temperature 24°C 50
Table 13: Concentrations (mg) ofCatechins and Methylxanthines per 250 mL Serving in Celestial Seasonings® (CS) Green Tea Samples at Room Temperature 24°C 51
Table 14: Concentrations (mg) ofCatechins and Methylxanthines per 250 mL Serving in Bigelow® Green Tea Samples at Room Temperature 24°C 52
Table 15: The Average Concentrations of all t:he Analytes in Salada® Caffeinated Green Tea in mg1250 mL Serving 58
Table 16: The Average Concentrations of all the Analytes in Salada® Decaffeinated Green Tea in mg/250 mL Serving 59
Table 17: The Average Concentrations of all the Analytes in Celestial Seasonings® Caffeinated Green Tea in mg1250 mL Serving 62

Vlll
Table 18: The Average Concentrations of all the Analytes Celestial Seasonings® Decaffeinated Green Tea in mg1250 mL Serving 63
Table 19: The Average Concentrations of all the Analytes in Bigelow® Caffeinated Green Tea in mg! 250 mL Serving 67
Table 20: The Average Concentrations of all the Analytes in Bigelow® Decaffeinated Green Tea in mg1250 mL Serving 68

IX
List of Figures
Figure 1: Diadzein and genistein structures .2
Figure 2: Chemical structure of the isoflavone backbone (3-phenyl-4H-l-benzopyr-4one) 2
Figure 3: Xanthine (3, 7-dihydro-purine-2,6n dione) 7
Figure 4: (+)-Catechin 10
Figure 5: (-)- Catechin (C) 11
Figure 6: (+)-Epicatechin (EC) 11
Figure 7: (-)-Epicatechin (EC) 11
Figure 8: (-)- Epigallocatechin (EGC) 12
Figure 9: (-)-Epicatechin gallate (ECG) 12
Figure 10: (-)- Epigallocatechin gallate (EGCG) 12
Figure 11: Caffeine, theobromine and theophylline Structures 13
Figure 12: Decaffeination process of green tea 16
Figure 13: The effect of orthophosphoric acid in the mobile phase on the separation of catechin, caffeine, and gallic acid. Column: 5 I.l (150x4.6 mm); Detection: 210 mm; Flow rate 1.0 mL/min .21
Figure 14: Commercial green teas used for the study .35
Figure 15: Solvent program curves available for gradient separation .42
Figure 16: Chromatogram of standard mixture .44
Figure 17: Chromatograph of Bige1ow® green tea extracted for 10 minutes with water at 100°C 44
Figure 18: Chromatograph of BigeloW® green tea at 85°C, 2 minutes .45
Figure 19: The concentration of caffeine, epicatechin (EC) and epigallocatechin gallate (EGCG) plotted against the time of extraction of Sa1ada® caffeinated green tea at different extraction temperatures 53
Figure 20: Chromatograph of Celestial Seasonings® caffeinated green tea 54

x
Figure 21: The concentration of total polyphenols plotted against the time of extraction of Celestial Seasonings® caffeinated green tea at extraction temperatures of 100°C, 90°C and 80°C 64
Figure 22: Mean caffeine concentrations (mg/serving) for both caffeinated and decaffeinated forms of Bigelow®, Celestial Seasonings® and Salada® green teas at extraction conditions of 10 minutes at 100°C 69
Figure 23: Mean EGCG concentrations (mg/serving) for both caffeinated and decaffeinate forms of Bigelow®, Celestial Seasonings® and Salada® green teas at highest extraction conditions 70
Figure 24: Mean total polyphenol concentrations (mg/serving) for both caffeinated and decaffeinated forms of Bigelow®, Celestial Seasonings® and Salada® green teas at highest extraction conditions 71

1
Chapter I: Introduction
Tea is mainly divided into three varieties, green, black, and oolong with the variation in the
teas a result of their processing. Black tea is made from leaves that are completely fermented or
oxidized after they have been dried (Pelillo et aI., 2002). Oolong tea is partially fermented and
falls between the black and green tea. Green tea is made from unfermented leaves. The dried
unfermented green tea has green tea catechins, which are more preserved than in partially
fermented oolong tea or fully fermented black tea (Pelillo et aI., 2002). Oxidation of the
catechins in green tea is prevented by inactivation of phenol oxidases while the formation of
dimeric theaflavins and polymeric thearubigins, occurs that impart the black color to black tea.
These theaflavins and thearubigins are due to the phenolase catalyzed oxidation of catechins in
green tea (Friedman et aI., 2005). Of the most popular beverages in the world, green tea is the
one known for its natural antioxidant properties (Chiu, 2006) due to its catechins.
Polyphenols are a group of chemical and natural substances present in beverages (such as
tea, red wine, and grape juice) obtained from plants, fruits, and vegetables (Reznichenko, Amit,
Youdim & Madel, 2005). Flavonoids are polyphenolic compounds that include the subclasses of
flavanones, flavones, isoflavones, flavanols (flavans), flavonols and anthocyanins (Li & Jiang,
2007). The chemical structure of isoflavones (3-phenyl-4H-l-benzopyr-4-one) consists of two
benzene rings with the rings linked to by a heterocyclic pyrane ring (Chen & Anderson, 2002).
One hydroxyl group (-OH) is attached to each benzene ring. The two most important isoflavones
are genistein and daidzein (Figure 1).

2
014 OH
HO HO
Daidzein Genistein
Figure 1. Diadzein and genistein structures
Isoflavone differs from flavones in the position of the phenyl group on the 4H-I
benzopyr-4-one, in isoflavone this occurs at position 3 relative to the oxygen of the ring, and in
flavones the phenyl group is at position 2 (Figure 2).
Phenyl group
4H-Ibenzopyr-4-one
Figure 2. Chemical structure of the isoflavone backbone (3-phenyl-4H-I-benzopyr-4
one)
(Chen & Anderson, 2002)
Generally, flavonoids were considered derivatives of 2-phenylchromone, the parent
compound, which is composed of three phenolic rings and are referred as A-, B-, C-rings (Li &
Jiang, 2007). All of the rings contain varying levels of hydroxylation and methoxylation.
Flavans (Flavanols) are composed of the catechins that are analyzed in this study (Li &
Jiang, 2007). Many of the flavonoid compounds have been shown to have a number of
physiological benefits, mainly in cognitive functions and prevention of memory impairment.

3
Methylxanthines, which include caffeine, theobromine and theophylline, were also analyzed in
this study. Over consumption of caffeine could result in anxiety and insomnia mainly in sensitive
individuals (Lee, Park, Kim & Kim, 2007). Caffeine also has beneficial properties such as the
use by athletes to increase performance before competition. To obtain caffeine-free products, the
decaffeination process has been commercialized. Decaffeination processes like extraction with
dimethyl chloride, ethyl acetate and supercritical C02 have been introduced in commercial
processing. It has been discovered that the decaffeination process may reduce the amount of
polyphenols in tea, so it might not provide the same health benefits as caffeinated green tea.
Green tea is one of the most widely consumed teas (Lee et aI., 2007). Green tea is highly
preferred not only due to its purported health benefits but also due to its aroma and taste. Brewed
green tea contains slightly fruity and greenish aroma notes. It has been proven that most volatile
compounds decrease by the decaffeination process using supercritical CO2 process (Lee et aI.,
2007). Due to the antioxidant properties of its polyphenol content many studies concerning green
tea effects have been targeted at its possible cardiovascular, anti-inflammatory, and
anticarcinogenic effects (Silvia, Orly, Tamar & Moussa, 2004). (-)- Epigallocatechin gallate
(EGCG) is the most abundant and investigated catechin of green tea polyphenols. Among the
catechins of green tea, EGCG is shown to exhibit important anti-cancer properties and also plays
a role in cancer prevention ("New Cancer Research," n.d.). Green tea extract is known for its
cancer-preventive behavior in humans in Japan (Sachiko et aI., 1997). Drinking green tea is
shown to be protective against colon cancer in humans (Suminori, 1992).
The main polyphenols of green tea are flavan-3-0Is (catechins) and their corresponding
gallate compounds, which constitute about one-third of the dry weight of tea leaves (Kia, Chi,
Micheal, Kwong & Chi, 2004). Polyphenols of green tea analyzed in this investigation include

4
catechin (C), epicatechin (EC), epigallocatechin-3 gallate (EGCG), epigallocatechin (EGC),
epicatechins-3-gallate (ECG) and the methylxanthines, caffeine (Cat), theobromine (Tb) and
theophylline (Tp). Depending on the type of raw material, type of varieties, climate and
cultivation, the amount of green tea catechins varies (BonoH, Pelillo, Gallina Toschi & Lecker,
2003). In addition, green tea catechins availability and concentration can also depend on the
technologies applied during extraction, and the preservation process. The green tea catechins
vary depending on the time and temperatures applied during extractions.
The concentrations of catechins and methylxanthines present in the caffeinated and
decaffeinated green teas were quantified by using High Performance Liquid Chromatography
(HPLC). Three commercial brands of green teas, namely Bigelow®, Celestial Seasoning® and
Salada®, were highlighted and tested in this study. The effect of extraction parameters including
time and temperature were observed on the three commercial brands of green tea in both
caffeinated and decaffeinated types.
Statement ofthe Problem
Polyphenols and methylxanthines were investigated in three brands of green tea. Limited
data on the quantifications of polyphenols and methylxanthines are available in the commercial
brands chosen and also quantification of polyphenols at different time and temperature
conditions chosen in both caffeinated and decaffeinated green teas is scarce or minimal.
Commercial brands analyzed included Bigelow®, Celestial Seasoning® and Salada®
caffeinated and decaffeinated green teas. These green teas were tested using reverse-phase HPLC
to quantify the levels of catechin (C), epicatechin (EC), epigallocatechin-3 gallate (EGCG),
epigallocatechin (EGC), epicatechins-3-gallate (ECG) and the methylxanthines caffeine (Cat),
theobromine (Tb), and theophylline (Tp).

5
The study using HPLC was conducted at University of Wisconsin-Stout Chemistry
Department, third floor Jarvis Hall Science Wing from fall 2006 to spring 2007.
Purpose ofthe Study
The purpose of the study was to quantify flavan-3-0Is (C and EC) and their corresponding
gallate compounds (EGC, ECG and EGCG) and methylxanthines (caffeine, theobromine, and
theophylline) by reverse-phase HPLC. The objectives were to:
1) Quantify the concentrations of C, EC, EGC, ECG, EGCG, caffeine, theobromine and
theophylline in Bigelow®, Celestial Seasonings® and Salada® caffeinated and
decaffeinated green teas extracted for different lengths of time (2 minutes, 4
minutes, 6 minutes, 8 minutes, 10 minutes) and at a variety of temperatures
(80°C, 85°C, 90 °C, 95°C, 100°C).
2) Quantify the concentrations of C, EC, EGC, ECG, EGCG, caffeine, theobromine and
theophylline in Bigelow®, Celestial Seasonings® and Salada® caffeinated and
decaffeinated green teas extracted at room temperature (24°C) and longer extraction
times (1 hour, 2 hour, 3 hour, 4 hour, 5 hour, 6 hour, 7 hour, 24 hour).
3) Compare the polyphenol concentrations of the Bigelow®, Celestial Seasonings® and
Salada® green teas as a function of time and temperature extraction conditions.
4) Compare the polyphenol concentrations of caffeinated green teas with the
decaffeinated green teas at room temperature and different time points.
6
Assumptions ofthe Study
Flavan-3-0Is (C and EC) and their corresponding gallate compounds (EGC, ECG and
EGCG) and methylxanthines are assumed to be present in all the green teas under high
temperature and room-temperature extraction conditions. In addition, it was thought that the
polyphenol concentrations would increase as the extraction time increased at any temperature.
Photochemical degradation of polyphenols was expected to be negligible.
Definition ofTerms
The following terms are important in understanding this study and will be used
commonly throughout this research paper and are defined as follows.
Antioxidant. Antioxidants are substances that offer protection against lipid oxidation,
react with free radicals, reduce oxidative stress, and stop low density lipoproteins (LDLs) or bad
cholesterol from being oxidized (Lee et aI., 2007).
Decaffeinated green tea. This is referring to the green tea without caffeine in it. Caffeine
is removed using decaffeination method. Two decaffeinating methods exist, one is using ethyl
acetate solvent and other is using water and CO2 ("Celestial Seasonings Caffeine Free Tea," n.d).
Green tea. Tea made from leaves of Camellis sinensis that are steamed and dried without
fermenting.

7
Methylxanthines. A chemical group of drugs derived from xanthine (Figure 3) (a purine
derivative); members ofthe group include theophylline, caffeine, and theobromine and they
differ from each other by the number of methyl (-CH3) groups ("Methylxanthine," n.d.).
o
HN
)N
Figure 3. Xanthine (3, 7-dihydro-purine-2,6-dione)
("Methylxanthine," n.d.)
Polyphenols. According to Lazarus (2001), a compound comprised of two or more
aromatic rings with each ring containing one or more hydroxyl groups (as cited in Kasper, 2006).

8
Chapter II: Literature Review
Camellia sinensis is one of the health promoting tea plants belonging to the family of
Theaceae (Weisburger, 1996). Leaves of the tea plant are rolled, chopped and dried. Dried leaves
when added to boiling water yield an extract or tea beverage. Tea was originally discovered
when tea leaves fell into boiling water at a reception for Chinese Emperor Shen Nung about 2735
B.C. Green tea, oolong tea and black tea are derived from the same plant called as Camellia
sinensis ("Tea Processing," n.d.). The difference between the teas is due to the difference in
processing methods. The processing steps that are commonly used are withering, rolling,
oxidation and drying. Green tea does not undergo oxidation and is steamed to oxidation making
it distinctive in color and taste from black and oolong tea ("Andao," n.d.). Green tea resembles
the original, untreated tea leaf in aromas and flavors. Oolong tea is also known as partially
oxidized tea. The range of oxidation lies between 7.5% (slight oxidation) to 70% (complete
oxidation). Black tea is fully oxidized. The dark color of black tea is due to the phenolase
catalyzed oxidation of catechins in green tea (Friedman, et al., 2005). An enzyme, polyphenol
oxidase, is activated during the rolling and chopping process of the tea leaves. People in China
have heated the leaves of the Camellia sinensis plant to inactivate the polyphenol oxidase which
has resulted in green tea. Polyphenols oxidized after withering for about 6 hours after chopping
and rolling results in black tea. Oxidation of polyphenol oxidase for about 1 or 2 hours results in
oolong tea.
In general tea, Camellia Sect. Thea is known to contain 32 species and four varieties
(Yang, Ye, Xu & Jiang, 2007) and of all these Camellia sinensis and Camellia assamica are
known to have good health benefits due to their antioxidative properties and the presence of
bioactive substances. Both of these plants contain eight catechins with EGCG as the major and

9
most potent constituting about 3-13% in dry leaves. Camellia ptilophylla contain theobromine as
a major alkaloid and contains no caffeine or a small amount of it with a small amount of
theophylline (Yang et aI., 2007). The amount of catechins in the leaves of C. ptilophylla and
C.assamica are unknown. The amount of caffeine is shown as 2.72%, 0.94% in Camellia
sinensis and Camellia assamica, respectively.
Tea is produced by processing shoots that include tender apical bud and subtending three
leaves (Sharma, Gulati & Ravindranath, 2006). Infusion of leaves with hot/cold water results in a
tea beverage. Processing procedures of the Chinese include roasting the tea shoots in a metal
roaster and then using the unidirectional rotary roller for processing. The unidirectional roaster
twists the leaves and compacts the particles. The Japanese use steaming procedures to inactivate
the shoots and then process by bi-directional rolling. Bi-directional rolling makes the shoot
surface flat without any twists and by spreading the leafjuice over the entire surface.
Catechins
Green tea is receiving increased interest from food scientists due to its purported
antioxidant properties and health benefits. Epigallocatechin gallate (EGCG) in green tea accounts
for 50-60% of the catechins; however, in black tea due to the oxidation of polyphenol oxidase
EGCG drops and is about 12% of the polyphenols (Ito et aI., 2003). Studies indicate that the
composition of catechins changes during heat processing and storage. Under high temperature
and high pH conditions, catechins undergo oxidation resulting in a rapid decrease in
concentration (Ito et aI., 2003). Therefore, brewing green teas at high temperatures for long
period does decrease the concentrations due to the oxidation. Further research would be required
to determine the time and temperatures that a decrease in concentrations would occur.
10
Extraction of catechins was conducted using organic solvents such as methanol and
acetonitrile (Yoshida, Kiso & Goto, 1999), while other studies show an extraction utilizing hot
water instead of these organic solvents. Extraction of catechins was also shown using
acetonitrile-water (1: 1, v/v), which was considered as an efficient extraction solvent combination
(Yoshida et aI., 1999). This method of extraction using organic solvents however may not reflect
the actual levels of the tea catechins if studied for human consumption of tea concentrations.
Therefore, extraction using water which reflects the polyphenols obtained in tea would be more
efficient and practical to use.
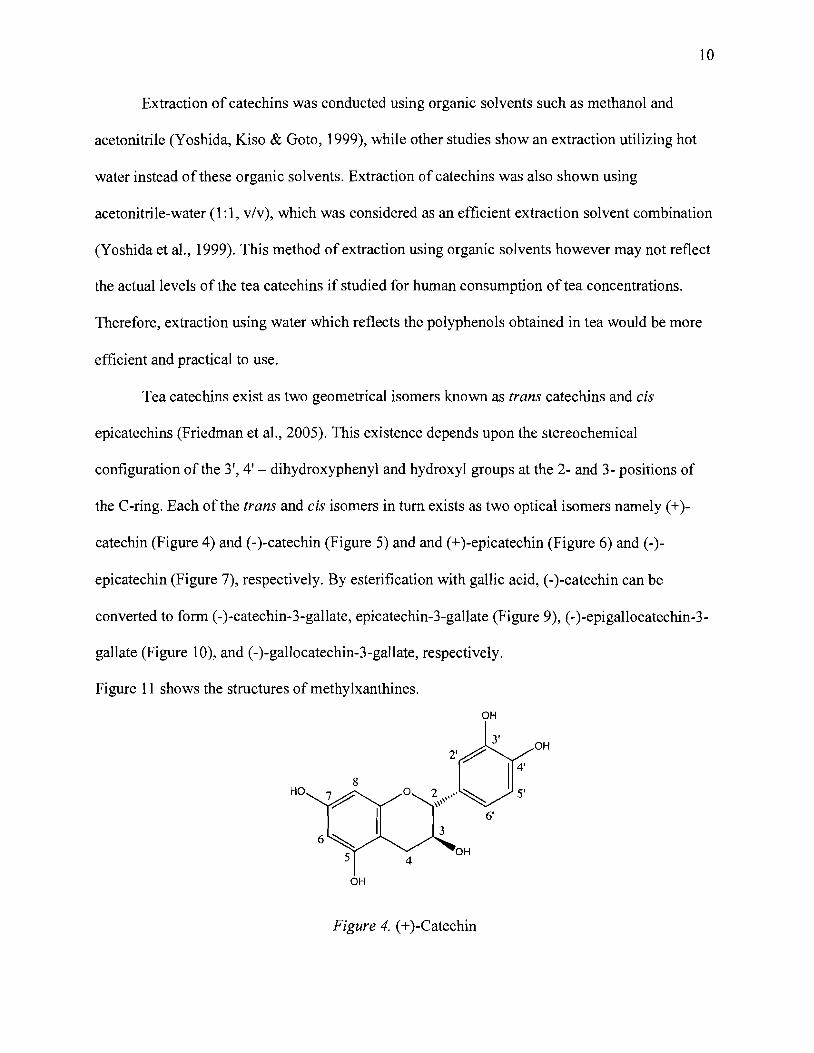
Tea catechins exist as two geometrical isomers known as trans catechins and cis
epicatechins (Friedman et aI., 2005). This existence depends upon the stereochemical
configuration of the 3', 4' - dihydroxyphenyl and hydroxyl groups at the 2- and 3- positions of
the C-ring. Each of the trans and cis isomers in turn exists as two optical isomers namely (+)
catechin (Figure 4) and (-)-catechin (Figure 5) and and (+)-epicatechin (Figure 6) and (-)
epicatechin (Figure 7), respectively. By esterification with gallic acid, (-)-catechin can be
converted to form (-)-catechin-3-gallate, epicatechin-3-gallate (Figure 9), (-)-epigallocatechin-3
gallate (Figure 10), and (-)-gallocatechin-3-gallate, respectively.
Figure 11 shows the structures of methylxanthines.
OH
OH
HO
OH
Figure 4. (+)-Catechin

11
HO
OH
OH
OH
Figure 5. (-)- Catechin (C)
OH
HO
OH
OH
Figure 6. (+)-Epicatechin (EC)
OH
OH
HO o .. ~ \"
\\\\
OH
Figure 7. (-)-Epicatechin (EC)

12 OH
OJ{
INti,,.. 'OH
OH
Figure 8. (-)- Epigallocatechin (EGC)
OB
He OH
Figure 9. (-)-Epicatechin gallate (ECG)
01"1
OH
III,
""0
I Oli c=o
HO OM
OH
Figure 10. (-)- Epigallocatechin gallate (EGCG)

13
Caffeine (Cat) Theobromine (Tb)
Theophylline (Tp)
Figure 11. Caffeine, theobromine and theophylline structures
Mechanism
Green tea is known for its health benefits due the free radical scavenging properties of the
antioxidants present. Disturbances in the structure and function of the human cells are caused by
the reaction of the oxygen free radicals with vital cellular components such as membranes,
nucleic acids and proteins (Xin, Shi, Zhao & Hou, 1995). Excessive oxygen free radicals could
damage or kill normal cells resulting heart diseases, tumors or other serious conditions. These
diseases could be cured or prevented by scavengers of active oxygen radicals. Such scavenger
are in green tea, which is known for its beneficial pharmacological and physiological effects, like
14
antihepatotoxic (prevents against hepatitis B), antipyretic (fever preventing properties), diurectic
(helps in reducing water in the body) and antioxidative properties. If the free radicals are not
removed by scavenging them then biological damages could result from lipid peroxidation,
which is involved with a series of free-radical-mediated chain reaction processes (Chen, Zhang
& Xie, 2005).
Epimerization ofCatechins During Processing
During the manufacturing and brewing of green tea, tea catechins undergo chemical
changes such as oxidation and epimerization reactions (changing of configuration of a compound
into another by enzymatic actions) (Wang & Helliwell, 2000). Steps of steaming or firing are
generally used to inactivate the enzymes thus limiting the oxidative reactions. The change in tea
catechins by epimerization has been studied using both tap and purified water. The study by
Wang and Helliwell (2000) show that epimerization occurs easily in tap water when compared to
the purified water. The main factor influencing the difference in tap and purified water are
complexity of ions and the pH of the water. This study also showed that not only the temperature
but also heating time influences the epimerization of tea catechins. Use of purified water in this
research study limited the changes in tea catechins that might have occurred due to the
epimerization reactions.
Decaffeination Process ofGreen Tea
Green tea is composed of various components including catechins, methylxanthines and
essential oil compounds (Seok Park et aI., 2007). The composition of components varies with the
strain of tea tree, the manufacturing process and the harvest time. Catechins are the primary
bioactive components of green tea. Catechins are known for their biological and physiological
benefits such as anti-inflammation, anti-oxidative, anti-aging, antiviral and antibiotic effects.

15
Among catechins, EGCG is known for its profound antioxidative property. Green tea health
benefits and purported cancer preventive activities have been extended to clinical treatments
(Fujiki, Suganuma & Miyazaki, 2005). Green tea extract and EGCG have been found to target
the following organs such as digestive (stomach, esophagus, liver, duodenum and colon), plus
cancer, bladder, prostate, breast and skin; and to inhibit the growth of cancer cells. Due to the
health benefits associated with the catechins in green tea, consumption of green tea and its
inclusion into various products are increasing including drinks, ice cream, beauty items and
cosmetics (Seok Park et aI., 2007). Conversely, the component of green tea, caffeine, is shown to
exert negative effects in humans such as sleep deprivation, and hypersensitivity. Daily intake of
less than 300 milligrams (mg) of caffeine is considered to be a safe level according to American
Beverage Association and the International Food Information Council. Many efforts have been
made to remove caffeine from caffeine-containing foods such as coffee, soda and tea. The
traditional decaffeination process with the use of organic chlorinated solvents such as
trichloroethylene or methylene chloride is receiving growing dissatisfaction from consumers.
Some chlorinated solvents have been banned due to probable causing cancer effects in humans as
warned by the National Cancer Institute (Seok Park et aI., 2007). For the decaffeination process
of coffee, water extraction and supercritical carbon dioxide have been commercially employed.
The quality of the decaffeinated product is influenced by the amount of the isolated caffeine, any
solvent residue and the remaining catechins.
In additional to influencing catechins, the decaffeination process may also have an impact
on the other components of green tea (Seok Park et aI., 2007). To avoid this impact, selective
processes for the removal of caffeine have been attempted by using hot water and microbial
degradation of caffeine. Another method is to develop genetically modified (GM) coffee plants
16
without synergizing the caffeine. These methods are found to have some limitations. One such
limitation is that the method using hot water for example, is only applicable to green tea in the
fresh form.
An additional technique, supercritical carbon dioxide (SC-COz), has several positive
effects and is reported to be an ideal non-polar extraction solvent (Seok Park et aI., 2007). The
positive features of SC-COzare high diffusivity, high dissolving power and low viscosity. It is
easily recovered and safe for humans. The removal of caffeine was less effective using SC-COz
than when using the Soxhlet method since SC-COzproved to be not feasible.
Super critical CO2 is considered to be non-polar solvent because of the fact that COz has
two oxygen atoms attached in perfect symmetry to a carbon atom (Seok Park et aI., 2007). A
polar solvent is desirable to be added to SC-COzto increase the polarity and extract the high
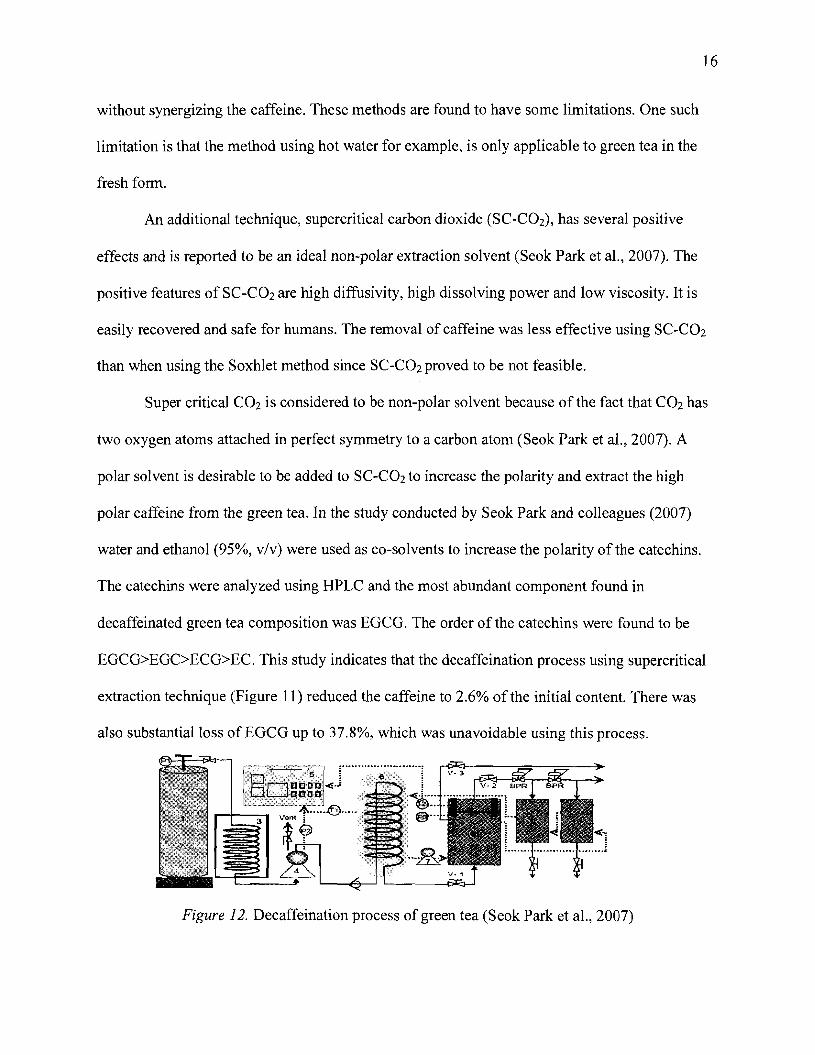
polar caffeine from the green tea. In the study conducted by Seok Park and colleagues (2007)
water and ethanol (95%, v/v) were used as co-solvents to increase the polarity of the catechins.
The catechins were analyzed using HPLC and the most abundant component found in
decaffeinated green tea composition was EGCG. The order of the catechins were found to be
EGCG>EGC>ECG>EC. This study indicates that the decaffeination process using supercritical
extraction technique (Figure II) reduced the caffeine to 2.6% of the initial content. There was
also substantial loss ofEGCG up to 37.8%, which was unavoidable using this process.
Figure 12. Decaffeination process of green tea (Seok Park et aI., 2007)
17
The decaffeination technique of hot water was used because it leaves no residue and is an
inexpensive method (Liang et aI., 2007). The concentration of caffeine decreased from 23.7mg/g
to 4.0 mglg when the tea leaf to water ratio of 1:20 (w/v) was used during water extraction. This
process was able to remove 83% of caffeine while retaining 95% of the total polyphenols.
However, this process was not applicable to black tea as high amounts of catechins were lost if
rolled and dried tea leaves are used instead of fresh leaves as in case of green tea.
EGCG Extraction
EGCG can be extracted by a simple method of boiling water and steeping for ten minutes
that does not require any expensive equipment (Copeland, Clifford & Williams, 1998). The first
step involved decaffeination of tea that was brewed with water and allowed to cool until the
temperature reached 60-70 °C. The cooled brew was then divided with a separatory funnel by
shaking for 1 minute with an equal volume of chloroform. After settling, the lower layer
composed of chloroform and caffeine, was discarded which decaffeinated the teas, and the upper
layer of settled mixture was extracted similarly for three times (Copeland et aI., 1998). The
extraction of flavanols typically followed a similar method, but the chloroform was replaced by a
range of solvents in the ratio 3:5 v/v. The organic layers formed after shaking and settling were
evaporated to dryness and any residues left was re-dissolved in a minimal volume of water. The
decaffeinated green tea brew was purified further by solvent precipitation with propyl acetate
and ethyl hexanoate. From this general technique, 25 grams of a commercial green tea leaf
yielded 400 mg of (-) EGCG which was better than 80% purity.
Instrumentation for Quant(fication ofPolyphenols
Following the above mentioned extraction, several methods have been used for analysis
of polyphenols. Analysis by electrophoresis is faster, but is 1/5 as sensitive as High Performance

18
Liquid Chromatography (HPLC) (Friedman et aI., 2005). To determine the content of catechins
and caffeine in black, green, and fruit teas consumed in United Kindom, Khokhar and
Magnusdottir (2002) used HPLC with acetonitrile as the eluent (as cited in Friedman et aI.,
2005). The HPLC method with a photo diode array detector was used by Cabrera and others
(2003) to measure four catechin and caffeine levels in 15 green, oolong and black teas sold in
Spain (as cited in Friedman et aI., 2005).The solvent used for the extraction was 80% methanol
for three hours and then twice more at 80% methanol containing 0.15% HCI for three more
hours. Another analysis was conducted on Indonesian green and black teas using HPLC-MS to
measure the catechins, theaflavins and purine alkaloids by extraction with boiling water for 3
minutes by Del Rio and others in 2004 (as cited in Friedman et aI., 2005). Extraction of
polyphenols from vegetables, fruits and teas with 90% methanol and 0.5% acetic acid was also
conducted by Sakakibara and others in 2003 (as cited in Friedman et aI., 2005).
Another study on the use of the instrumentations for quantification of catechins was
conducted to investigate the use of the HPLC with ultraviolet and MS (mass spectroscopy)
detection for the quantification of green tea catechins (Pelillio et aI., 2004). In this study,
reversed phase HPLC was used for the analysis of a green tea extract. Comparing the results
from both the detection system, similar precision results on the quantifications of green tea
catechins was observed, but HPLC with MS system shown less accurate results and provided
less detector response.
Studies indicate the use of different instrumentation for the quantification of green tea
catechins; HPLC is found to be the most commonly used instrumentation. Separation of various
catechins is usually conducted by HPLC having an internal column of 4.6 mm or higher (Pellilo
et aI., 2004). A high sensitivity level is provided by an ultraviolet detector and is considered to be
19
suitable for the analysis of catechins. The disadvantage of the ultraviolet detector is that it does
not differentiate the compounds with similar chromophore groups. A mass spectrometer is a
powerful tool for analysis (identification and confirmation of molecular structure) of unknown
compounds that will differentiate the compounds based on the structures.
HPLC is commonly used for the analysis of catechins of green tea. Other techniques and
instruments for analysis of catechins include a study that was one conducted on High
Performance Capillary Electrophoresis (HPCE) (Bonoli et aI., 2003). The features ofHPCE are
short time analysis, small sample volumes, sensitivity, low running costs and an aqueous mobile
phase. This method is in the development stage and many studies have been done regarding the
application of this method for the analysis of catechins in teas.
Reverse phase HPLC with UV detection having an isocratic elution system
(methanol/water/phosphoric acid) was used for analysis of catechins (Wang, Helliwell & You,
2000). This system provided rapid analysis and accurate results and was found be useful to detect
low concentrations of catechin and EGCG. Caffeine and gallic acid was also separated using this
system. The column used was a C18 reversed phase Kingsorb 5 ~ (l50x4.6 mm) with a flow rate
of 1.0 mLimin (Wang et aI., 2000). The column was operated at 30°C. The injection volume of
sample was 20 ~L. Two wave lengths 210 nm and 280 nm were tested in this study and the
absorption wavelength was selected at 210 nm. Further research can be conducted to study the
quantification of polyphenols using an isocratic elution system.
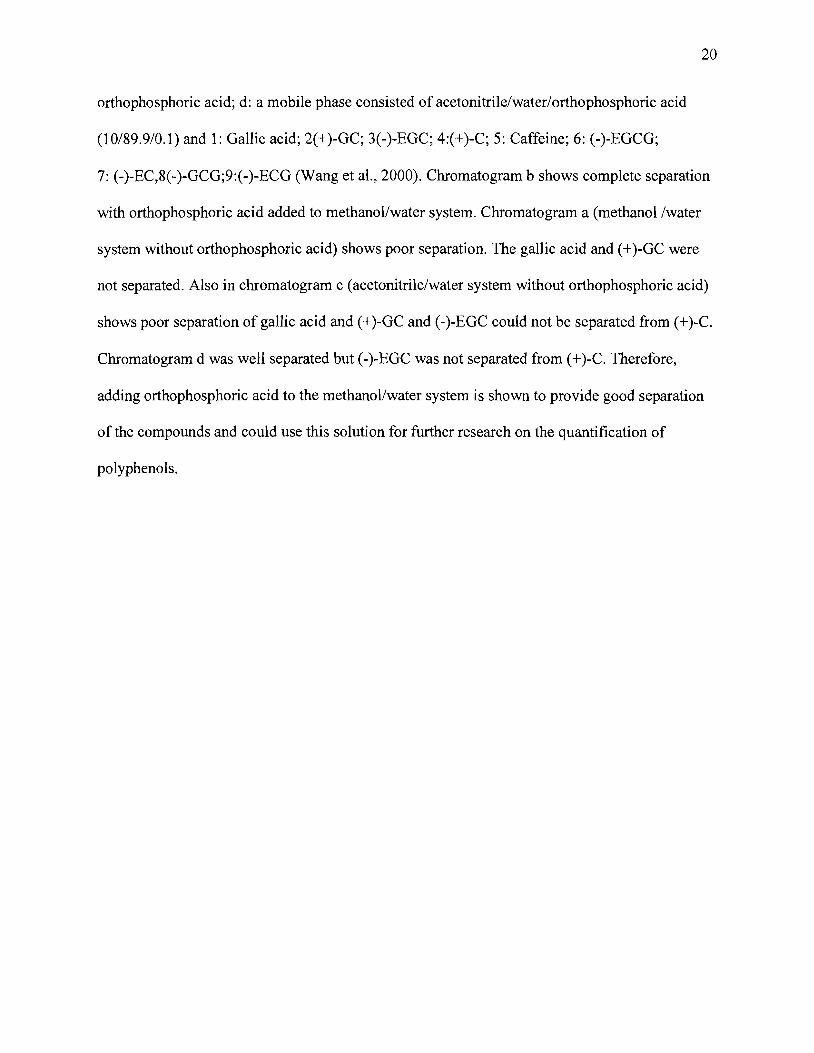
Figure 12 shows the. chromatograms of the effect of orthophosphoric acid in the mobile
phase on the separation of analytes. Where, a: a mobile phase consisted of methanol/water
(20/80) without orthophosphoric acid; b: a mobile consisted of methanol/water/orthophosphoric
acid (20/79.9/0.1); c: a mobile phase consisted of acetonitrile/water (l0/90) without
20
orthophosphoric acid; d: a mobile phase consisted of acetonitrile/water/orthophosphoric acid
(10/89.9/0.1) and 1: Gallic acid; 2(+)-GC; 3(-)-EGC; 4:(+)-C; 5: Caffeine; 6: (-)-EGCG;
7: (-)-EC,8(-)-GCG;9:(-)-ECG (Wang et al., 2000). Chromatogram b shows complete separation
with orthophosphoric acid added to methanol/water system. Chromatogram a (methanol/water
system without orthophosphoric acid) shows poor separation. The gallic acid and (+)-GC were
not separated. Also in chromatogram c (acetonitrile/water system without orthophosphoric acid)
shows poor separation of gallic acid and (+)-GC and (-)-EGC could not be separated from (+)-C.
Chromatogram d was well separated but (-)-EGC was not separated from (+)-C. Therefore,
adding orthophosphoric acid to the methanol/water system is shown to provide good separation
of the compounds and could use this solution for further research on the quantification of
polyphenols.

21
.... ,... 1 2 3
=1 "
10 1 2 s
b
::'1 'llOO
I .I
:1 'II III l il ~. · ~kJL. "Iu~u,-JL:J L}.'L, .:;:.0::::-.. .:-..:__.:~~~!~_"--.~::::::::
c
,DaD
••y I UOO1
2 3+4
!:1
d'''''' IitllOO
I :1 6 ~ !I 1 B
..... ' i. 1
1\ 5~
... II I ,1\ l\ r\ I \ I \ 1"
..... ,L ..~ __~ ....,.. --<.I "'o.,,, .,- _:1t::::=:~.. JJl-Jlh~r_,~."n .....····~--r-->~~I'···· .. ··,·~----,- 20 .~......-30· ·T ~ ..·•....,_·.,···'-"··lO·······~·········-,-·······~
9
·oo-..-r·_-'t··_····-r---r---t~
o 10
Figure 13. The effect of orthophosphoric acid in the mobile phase on the separation of catechin,
caffeine, and gallic acid. Column: 5 microns (Il) C18 (l50x4.6 mm); Detection: 210 mm; Flow
rate 1.0 mL/min.
(Wang, Helliwell & You, 2000)

22
Health Benefits o/Green Tea
One benefit of consuming green tea is that carcinogenesis in the digestive tract is
postulated to be inhibited by ECGC as demonstrated in cells (Okabe et ai., 1999). This study
showed that polyphenols from tea inhibited the growth and disintegration of a human stomach
cancer cell line KATO III, and also inhibited tumor necrosis factor-a ( TNF-a) release from the
cells. The order of polyphenols that followed the inhibition was ECG, EGCG, EGC and
theaflavins. Inhibition of TNF -a release from a human stomach cancer cell line, KATO III, took
place with the tea polyphenols (ECG, EGCG, EGC) treated with okadiac acid. EGCG was shown
to prevent neuronal cell death caused by several neurotoxins (Reznichenko et aI., 2005).
Gastrointestinal tract cancer is mainly associated with an excess intake of protein and fat
(Borrelli, Capasso, Russo & Ernst, 2004). The polyphenols of green tea have been shown to
exhibit inhibitory effects on cancer of the gastrointestinal tract and also preventive effects against
several other types of cancer. The evidence to support the preventive effects of green tea
polyphenols on stomach and intestinal cancer is not clear. Studies indicate that green tea has a
protective effect on adenomatous polyps and chronic atrophic gastritis formations. The inhibitory
effect of green tea polyphenols was studied on the human lung cancer cell line, PC-9 (Okabe et
aI., 1997). Polyphenols that were examined included EGC, ECG, EGCG, and EC. Comparing
their inhibitory effect, ECG and EGC showed the same potency as EGCG but EC showed less
inhibitory effect. These studies shows the protective effects of green tea and health benefits
associated with it on the cell line studied.
Breast carcinoma is considered to be one of the most common cancers in women
(Nakachi et aI., 1998). Breast cancer is more prevalent in western countries compared to Japan
because of their daily intake of green tea as part of the diet. Consumption of green tea prior to the
23
clinical cancer onset is believed to have decreased the risk of stage I and II breast cancer in
women.
Drinking green tea is believed to inhibit certain cancers, such as lung, skin, esophagus,
liver, and stomach (Mandel, Weinreb, Amit & Youdim, 2004). Tea catechins are mainly
absorbed by the small intestine and are metabolized by enzymatic reactions. Epidemiological
studies on the consumption of green tea and risks associated with cancer are still not clear. The
reasons for the inconclusive studies might be due to poorly designed studies, lifestyle, and
differences in metabolic systems of individuals.
An additional health benefit associated with EGCG is the inhibition of the tumor
invasion and angiogenesis processes that are found to be essential for the growth of tumors and
subsequent metastasis (lung & Ellis, 2001). One of the reasons that green tea is of growing
interest is the epidemiological evidence indicating a lower risk of various cancers by
consumption of green tea and hence EGCG. The biological activities of green tea polyphenols
are mainly attributed by the anticarcinogenic and antiproliferative effects of consuming green
tea.
Non-melanoma skin cancer is considered to be the most common malignancy in
humans (Yusuf, Irby, Katiyar & Elments, 2007). Over 1.3 million cases have been reported in
United States. Polyphenols of green tea have been observed to have chemopreventive effects and
also inhibitive effects such as carcinogenic activity against ultraviolet (UV) radiation. Thus,
ingesting green tea in conjunction with sunscreen use could potentially protect the skin against
adverse effects caused by UV radiation.
Along with the antioxidative activity, green tea is shown to exhibit tumor suppressing
activity in a cell (Li et aI., 2000). For example, polyphenols of green tea were added to human

24
gastric cancer cells with induced apoptosis, and other tumor cells, and on mouse skin
tumorigenesis. The possible health benefits are due to the respond to the negative effects of free
radicals by utilizing defensive antioxidants present in green tea.
Intestinal digestion. Although more information is available on the health benefits of
green and black tea, little is known about the tea components in the gastrointestinal tract (Record
& Lane, 2001). Changes in tea catechins occur with the changes in pH as is found in the
gastrointestinal tract. Tea was incubated at an acidic pH, similar to the pH in the stomach. Little
effect was observed on the concentration of tea catechins whereas the tea incubated at alkaline
pH (similar to small intestine) showed decline in the concentration of both green and black tea
catechins (Record & Lane, 2001). This study shows that incubations of green teas at alkaline pH
results in decrease in concentrations of catechins, and incubation at higher pH shows less effect
on catechins.
Anti-microbial activity. Polyphenols of green tea are known for their biological
activities like inhibition of allergies, inhibition of tooth decay, inhibition of oxidation, and
reduction of blood pressure (An et a1., 2004). The antioxidant level of green tea was more
effective on lipid oxidation than the synthetic antioxidant, butylated hydroxytolune (BHT). One
study on irradiation used green tea polyphenols that were irradiated with dose of 40 Kilogrey's
(kGy) more than the mass of the recommended level by the International Consultative Group of
Food Irradiation (ICGFI) as a safe dose for better understanding the effect of irradiation.
Irradiation of polyphenoIs increased the anti-microbial activities against Staphylococcus aureus
and Streptococcus mutans. The study indicated that irradiation of green tea polyphenols
maintains the biological activities and increases the anti-microbial activities (An et a1., 2004).
This study shows the effect of irradiation on changes of biological and anti microbial activities
25
by irradiating the polyphenols of green tea samples and comparing with non-irradiated samples.
From the results of this study, the inhibition ranges for various bacterial (Escherichia coli, S.
aureus, S. mutans) were 9.3, 10.1 and 9.3 mm in non-irradiated control but 10.8, 11.0 and 11.7
mm in irradiated samples, respectively.
A study was conducted to evaluate the inhibitory effects of grape seed extract, green
tea extract, nisin and their combinations against Listeria monocytogenes (Theivendran,
Hettiarachchy & Johnson, 2006). The inhibitory effect was evaluated in a phosphate buffer
solution (PBS) medium which contains 109 colony forming units (CFU) of L. monocytogenes.
Turkey frankfurters were inoculated by 106 CFU/g of L. monocytogenes. The inoculated
frankfurters with and without the addition of antimicrobial agents were dipped in soy protein
forming soy solutions and stored at 4 DC or 10 DC (Theivendran et aI., 2006). Weekly for 28 days,
the inhibitory effects of edible coating were evaluated for frankfurters. Growth and
recontamination of L. monocytogenes is shown to be controlled by an edible fat coating
containing either grape seed extract or green tea extract in combination with nisin in ready-to-eat
meat products.
Green tea is known for its purported chemopreventive and therapeutic properties. Tea is
also known for its reported antimutagenic, anticarcinogenic, and anticlastogenic effects (Perva
Uzunalic et aI, 2006) and for its cancer preventive properties in Japan (Fujiki et aI., 1997).
EGCG and green tea are of growing interest for cancer prevention due to their important features
such as having no toxicity from consumption, and having a wide range of target organs and
inhibition effects on the growth of cancer cells (Okabe et aI., 1997). One study shows that three
components of green tea, namely epicatechin gallate (ECG), epigallocatechin gallate (EGCG),
and epigallocatechin (EGC), inhibited the growth ofPC-9 cells, while epicatechin (EC) did not
26
show significant growth inhibition. These results are shown to provide new insights for EGCG
and green tea extracts for mechanism of actions against cancer.
Cancer
In the United States, heart disease was considered the first principle cause of death and
cancer as the second cause (Bushman, 1998).
Pancreatic cancer. In one of case control studies completed by Jo and coworkers, the risk
of cancer was decreased significantly in women by continuous consumption of green tea (as
cited in Bushman, 1998). Of these case control studies completed, two case control studies
indicated an inverse association and one indicated a positive association between the
consumption of green tea and its effect on cancer. Increased risk was associated with higher
green tea consumption (2: 5 cups/day). There is scope for more research on green tea and its
association with pancreatic cancer due to preliminary findings.
Colorectal cancer. Five case studies were considered and out of the five studies, three
found an inverse association of green tea and colon cancer and one found the positive association
(Bushman, 1998). In cases of rectal cancer, only one study showed a statistically significant
inverse association out of four studies.
Stomach cancer. Many studies have been conducted to find the association between
green tea and stomach cancer (Bushman, 1998). Of these studies, one ecological and four case
control studies show that there is an inverse association of green tea with stomach cancer.
Epidemiological studies indicate that drinking five cups or more of green tea results in a lower
risk of stomach and esophagus cancer (Weisburger, 1996). Tea prevents the formation of
nitrosamide (nitroso compounds) caused by the reaction of nitrates with suitable substrates which
can induce cancer.

27
Lung cancer. Drinking green tea is shown to lower the risk of lung cancer (Weisburger,
1996). Use of tobacco can cause cancer in the oral cavity, lungs, pancreas, kidneys, bladder,
esophagus, and cervix. People in Japan smoke more than Westerners but the incidence oflung
cancer is lower in Japan which is attributed to their tradition of drinking tea.
Polyphenolic constituents in varieties ofteas. Cellular antioxidants are categorized into
three classes (Dreosti, n.d). One is endogenously synthesized compounds with antioxidant
activity, for example uric acid, glutathione, and lipoic acid. The second category is externally
divided antioxidant nutrients like vitamin A, C and E, and beta-carotene. The third category is
externally divided non-nutrient antioxidants like polyphenols, salicylates, and bioflavonoids.
To be more focused on the polyphenols which are non-nutrient antioxidants, it is shown
that the difference in the relative levels of epicatechins and their oxidized condensation products
makes the green tea differentiable from black tea (Table 1) (Dreosti, n.d).
Table 1
Polyphenolic Constituents in Green and Black Tea Beverages (%Dry Solids)
Constituent Green Tea (%) Black Tea (%)
Flavanols 30-40 5-10
Epigallocatechin gallate 10-15 4-5
Epicatecchin gallate 3-10 3-4
Epigallocatechin 3-10 1-2
Epicatechin 1-5 1-2
(Dreosti, (n.d.).)

28
A study was conducted to investigate the concentrations of polyphenols extracted using
multi step extraction process (Perva-Uzanalic et aI., 2006). Table 2 shows the amount of
catechins extracted using multi step extraction at time of 95 DC and 10 minutes. The multi-step
extraction consisted of four steps, where after extraction; the residue left is extracted using water
at 95 DC and 10 minutes. This process is repeated similarly for steps three and four. The results
show that the extraction for multiple times decreased the EGC and EC contents but the EGCG
increased.
Table 2
Multi-step Extraction ofGreen Tea with Water at Ratio 40 mL: 1 g (I's=95°C, t=10 minutes)
Extraction EGC (glKg ECG (g/Kg EC (g/Kg EGCG Caf(g/Kg Step dry extract dry extract) dry extract) (g/Kg dry dry extract)
extract) 1 126 47.8 1.2 239 71.4
2 108 59.0 1.1 243 75.5
3 68.5 91.6 1.1 420 54.5
4 42.3 127 0.1 484 34.0
(Perva-Uzanalic et aI., 2006)
Under the same study conducted by Perva-Uzanalic and others in 2006, the
concentration of polyphenols and caffeine was analyzed in the starting material of green tea.
Table 3 shows amount of catechins and caffeine in green tea leaves of varieties Fanning Belas.
The concentrations of major catechins and caffeine were 191 g/Kg material; and 36.0 glKg
material, respectively. Among the catechins analyzed, EGCG represents 67.5% of the major
catechins in green tea leaves.

29
Table 3
Amount ofCatechins and Cafftine in Green Tea Leaves, Variety Fanning Belas
Active ingredient Content (g/Kg dry Content (g/Kg dry leaves) leaves)
Caffeine 36.0
Catechins
Epicatechingallate 15.2
Epigallocatechin 46.0
Epigallocatechin gallate 129
Epicatechin 0.90
(Perva-Uzanalic et aI., 2006)
Polyphenols constitute up to 36% in dry green tea leaves and among those polyphenols
measured catechins are the most prevalent (Perva-Uzunalic et aI., 2006). A study was conducted
by Perva-Uzunalic and colleagues in 2006 on the extraction efficiency of major catechins and
caffeine using a temperature range from 60°C to 95 °c and an extraction time of 1 to 120
minutes without maintaining constant temperature. This study aimed to look for the
concentrations of catechins at various temperatures for a long extraction time. One-hundred
milligrams of distilled water was poured on 1 gram of green tea leaves. The temperature
decreased from 95°C over the period oftime (l to 120 minutes) and the temperature was noted.
Optimum conditions were determined for the extraction procedure with water (Perva-Uzunalic et
aI., 2006). The extraction efficiency of catechins with water maximized at 80°C after 20 minutes
(97%) and at 95 °c after 10 minutes (90%). In general, the extraction efficiency and quality of
the extract from tea is usually influenced by the conditions including tea, solvent type, time,

30
temperature, ratio of solvent to material and pH. Higher temperatures for a shorter period of
extractions might provide maximum extraction efficiency.
Another study was conducted by Wang and Helliwell (2000) to demonstrate the effect of
different water types (tap and purified water) on the extraction of the polyphenols in green teas.
The process includes, brewing gunpowder tea infusions using purified water and tap water and
then cooling immediately to ambient temperature. After cooling the infusions were heated at
100 DC for variety of times, 0 hour, 20 minutes, 1 hour, 3 hour and 5 hours (Table 4). From the
results, the conversion from (-)-EGC and (-)-EGCG to their corresponding epimers, (-)-GC and
(-)-GCG, in the tea brewed using purified water increased during the first three hours and then
gradually decreased (Wang & Helliwell, 2000). However, (-)-EC and (-)-ECG, and their
corresponding epimers increased continuously during the five hours heating. In tap water,
(-)-GC, (-)-GCG and (-)-CG reached a higher level after 20 minutes of heating, and (-)-C reached
a higher level after 1 hour of heating. This state of stabilization indicates that the catechins after
reaching the maximum level of epimerization, the most change become the degradation or
oxidation of the catechins. This study also concluded that catechins were found to be highly
unstable in the infusions of tap water.
Based on the findings, using purified water for the present research possibly have
provided better results than using the tap water.
31
Table 4
Contents ofCatechins in Green Tea Infusion when Heated at 100°C (mg/100 mL)
Compound Ohr 20 min 1hr 3hr 5hr
Purified water
(-)-EGC 19.0 14.6 12.6 8.40 5.34
(-)-GC + (+)-GC 1.45 2.94 3.61 5.66 5.36
(-)-EGCG 24.2 19.3 17.4 12.1 8.44
(-)-GCG 0.61 2.63 3.58 6.34 6.03
(-)-EC 4.34 3.99 3.87 2.90 2.35
(-)-C+(+)-C 0.51 0.93 1.03 1.71 1.88
(-)-ECG 5.02 4.65 4.52 3.38 2.73
(-)-CG 0.06 0.36 0.43 0.99 1.14
Tap water
(-)-EGC 9.68 0.28 0.26 0.16 0.15
(-)-GC + (+)-GC 2.00 3.23 1.32 0.16 0.09
(-)-EGCG 13.2 1.34 0.61 0.23 0.15
(-)-GCG 0.98 2.44 1.05 0.34 0.16
(-)-EC 4.05 1.77 1.40 1.04 0.82
(-)-C+(+)-C 0.56 2.87 2.88 2.16 1.77
(-)-ECG 4.06 1.98 1.51 1.02 0.67
(-)-CG 0.09 1.44 1.34 0.95 0.66
(Wang & Helliwell, 2000)

32
Extraction Efficiency ofCatechins and Caffeine
Many studies indicate that the use of different times and temperature conditions for
extraction of green tea can impact the catechin levels removed, as well as influence by using
different solvents including even water (Friedman, Levin, Choi, Kozukue & Kozukue, 2006).
For example, the use of boiling water for 3, 5, 10 minutes, at 80°C for 30 minutes, at 90 °c for
30 minutes were used as extraction conditions. The use of acetonitrile and water for 1 hour, use
of ethanol at room temperature, and the use of acetone for two weeks was also shown to be used
as extraction conditions for polyphenols by other researchers. The results showed that the
amount of catechins and caffeine extracted in the boiling water for five minutes increased in the
temperature range of 60 to 100°C and was in large amounts at 100°C for 5 minutes (Friedman et
al., 2006). The total range of catechins in green tea was from 51.5 to 84.3 mg/g. The total
estimated dietary intake of catechin from green was 40.5.g mg/d and caffeine was from 92 to 146
mg/d. Based on the dietary intake, one to one and half grams of tea leaves could provide the
required level of catechins per day.
A study by Friedman and others in 2006 compared the tea constituents extracted using
water and 80% ethanol/water in boiling water for 5 minutes and at 60°C for 15 minutes to
determine the amount of polyphenols plus theaflavins. The caffeine content (in mg/g of tea) for
green teas extracted with 80% ethanol was in the range from 0.5 to 26.8 and the concentrations
extracted with water was in range from 0 to 23.1. The amount of polyphenoIs extracted using
aqueous ethanol was substantially greater than when using water alone.
A study was conducted to investigate the changes in the concentrations of polyphenols if
tea was prepared by either adding milk or vitamin C, which is most commonly used method
(Majchrzak, Mitter & Elmadfa, 2004). The results showed that adding ascorbic acid (vitamin C)
33
to green tea increased the total antioxidant activity in green tea extracts linearly up to 30 mg
ascorbic acidll 00 mL tea solution.
Green Tea Applications
Milk-tea beverages. Tea catechins health benefits are not only associated with antioxidant
activities but also include free metal chelation, scavenging of reactive oxygen and nitrogen
species, as well as inhibition of lipoxygenase and cycloxygenase (oxidative enzymes) (Ferruzzi
& Green, 2006). Knowing the health benefits of tea catechins, new products have been
developed with tea as an active ingredient in products such as ready-to-drink (RTD) tea
beverages, confections, ice creams, cereal bars and pet foods. According to Ferruzzi and Green
(2006) in many countries, tea is formulated with milk in different proportions to improve sensory
properties; however, green tea is not traditionally consumed with milk even though formulations
of green tea with soy and other dairy products are increasing. Many methods have been
developed for effective extraction of catechins in complex food formulations but methods were
not suitable for milk based products. Strong catechin-protein interaction occurs in milk based
products. Proteins have to be removed by a deproteinization step prior to the analysis so that this
step can prevent precipitation onto the HPLC column during analysis. Various methods of
deproteinization like pepsin treatment, methanol deprotenization and acid precipitation were
studied. Total catechins were highly recovered by pepsin treatment (89-102%) then by methanol
deproteinization (78-87%) and followed by acid precipitation (20-74%) (Ferruzzi & Green,
2006).
Studies show that consumption of tea with milk may have less availability of
polyphenols, however, other studies have indicated that the addition of milk to black tea does not
influence the absorption oftea catechins and its antioxidant activities (Ferruzzi & Green, 2006).

34
It is a common habit to add lemon to tea in United Kingdom, so a study was conducted to see the
effect of lemon on the polyphenols of green tea. The study showed that the addition of lemon
(ascorbic acid) increased the total antioxidant capacity linearly up to 30 mg ascorbic acid/lOO
mL tea solution.
Based on the above mentioned studies, it can be concluded that due to the purported
health benefits of green tea, its usage and applications have increased to large extent. The above
studies highlight the extensive health benefits of green tea. The information on the effect of
extraction parameters on commercial caffeinated and decaffeinated green teas of United States is
however, limited. This current study could therefore provide consumers information on the
concentrations of polyphenols present in green teas analyzed; as this study is focused on the
effect of extraction parameters time and temperature on the polyphenols and methylxanthines of
green teas commercially available in United States.

35
Chapter III: Methodology
The purpose of the study was to quantify the concentrations of catechins (catechin and
epicatechin) and their gallic acid analogs (epigallocatechin, epicatechin gallate, epigallocatechin
gallate) and the methylxanthines (caffeine, theobromine, and theophylline) as a function of
extraction time and temperature.
Reverse phase gradient HPLC was used for analysis and to quantify the concentrations of
catechins and their gallate compounds and methylxanthines in three commercial brands of green
tea in both caffeinated and decaffeinated forms.
Figure 14. Commercial green teas used for the study
Subject Selection and Description
Three commercial brands of green teas produced in the United States were chosen. The
chosen brands were caffeinated and decaffeinated Salada®, Bigelow®, and Celestial
Seasonings® green teas (Figure 13). The tea bag boxes of these three brands were purchased
from a local grocery store (Menomonie, Wisconsin, USA).
36
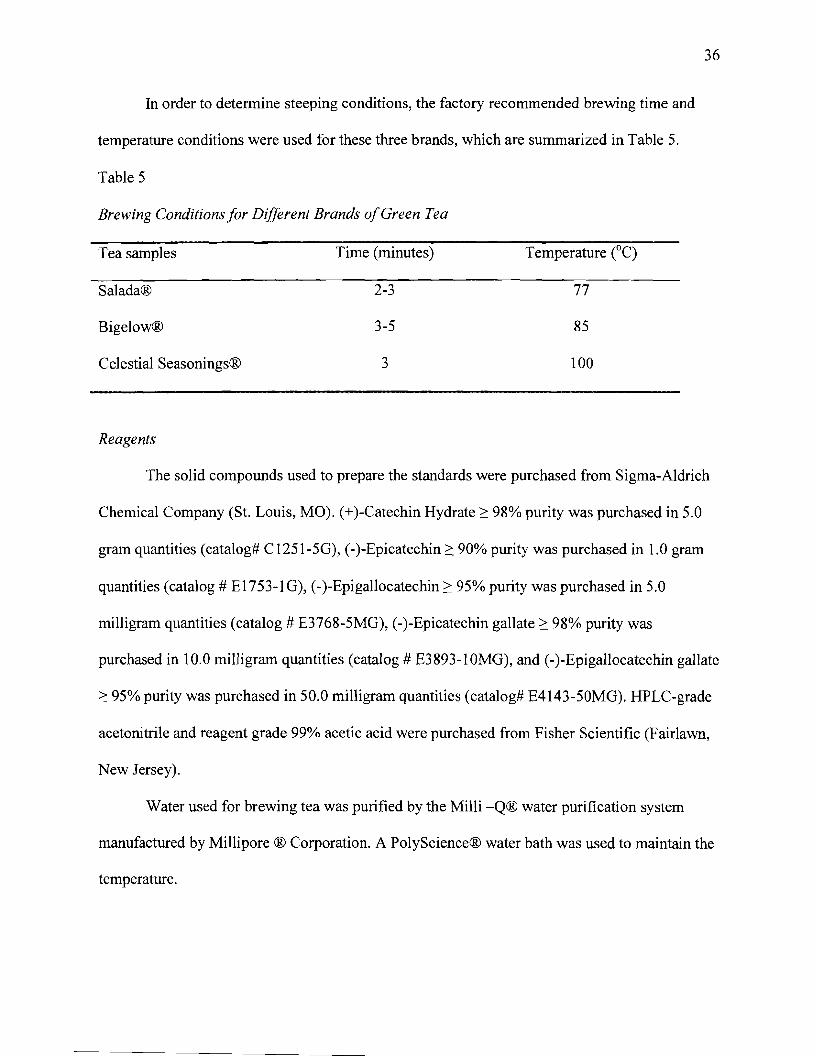
In order to detennine steeping conditions, the factory recommended brewing time and
temperature conditions were used for these three brands, which are summarized in Table 5.
Table 5
Brewing Conditions for Different Brands ofGreen Tea
Tea samples Time (minutes) Temperature (0C)
Salada® 2-3 77
Bigelow® 3-5 85
Celestial Seasonings® 3 100
Reagents
The solid compounds used to prepare the standards were purchased from Sigma-Aldrich
Chemical Company (St. Louis, MO). (+)-Catechin Hydrate 2: 98% purity was purchased in 5.0
gram quantities (catalog# C 1251-5G), (-)-Epicatechin 2: 90% purity was purchased in 1.0 gram
quantities (catalog # E1753-1 G), (-)-Epigallocatechin 2: 95% purity was purchased in 5.0
milligram quantities (catalog # E3768-5MG), (-)-Epicatechin gallate 2: 98% purity was
purchased in 10.0 milligram quantities (catalog # E3893-10MG), and (-)-Epigallocatechin gallate
2: 95% purity was purchased in 50.0 milligram quantities (catalog# E4143-50MG). HPLC-grade
acetonitrile and reagent grade 99% acetic acid were purchased from Fisher Scientific (Fairlawn,
New Jersey).
Water used for brewing tea was purified by the Milli -Q® water purification system
manufactured by Millipore ® Corporation. A PolyScience® water bath was used to maintain the
temperature.
37
Standards
The mass of solid catechins and methylxanthines was measured to the nearest 0.01
milligram using an analytical balance. Measured amounts (Tables 6 and 7) were added to a 25
mL volumetric flask and diluted to volume with methanol to prepare standard mixtures.
Individual standards and three different standard mixtures were prepared to compare and identify
the peaks of green tea samples to those of the standards. For example, to prepare the standard
mixture 1 (Table 7), 2.55 mg ofcatechin, 2.66 mg of epicatechin, 0.94 mg of epigallocatechin,
1.70 mg of epigallocatechin gallate, 0.52 mg of caffeine, 0.60 mg of theobromine, and 1.50 mg
of theophylline were added to a 25-mL volumetric flask and diluted to mark with methanol.
Individual standard solutions were also prepared. Tables 8 and 9 show the concentrations of
different standard solutions prepared per mg/L.

38
Table 6
Individual Solids (mg) Diluted to 25.0 mL to Produce Standard Solutions
Identity of standard solution Mass of Solid (mg)
EC 1 1.23
EC2 5.86
EC 3 9.45
EGC 1 1.06
EGC2 2.66
EGCG 1 1.55
EGCG2 2.40
EGCG3 7.56
Tp 1 6.43
Tp2 14.2
Cafl 1.04
Caf2 5.89
Caf3 12.9
Table 7
Mass (mg) ofIndividual Solids Diluted to 25.0 mL to Prepare Standard Mixtures
Standards Mass of solids (mg) C EC EGC ECG EGCG Caf Tb Tp
Standard Mixture 1 2.55 2.66 0.00 0.94 1.70 0.52 0.60 1.50
Standard Mixture 2 4.26 4.00 0.00 2.00 1.07 2.49 2.41 2.61
Standard Mixture 3 1.39 1.60 0.00 1.73 0.30 1.25 1.93 0.63

39
Table 8
Concentrations o/the Individual Solids (mg/L)
Identity of standard Concentrations
solution of Solids (mg/L)
EC 1
EC2
EC3
EGC 1
EGC2
EGCG 1
EGCG2
EGCG3
Tp 1
Tp2
Caf 1
Caf2
Caf3
51.5
227
378
42.2
106
61.8
96.0
302
254
566
41.4
236
517
Table 9
Concentrations o/the Individual Solids in Standards Mixtures (mg/L)
Standard Mixture Concentration (mg/L)
C EC EGC ECG EGCG Caf Tb Tp
Standard Mixture 1 102 106 0.00 38.0 68.0 21.0 24.0 60.2 Standard Mixture 2 170 160 0.00 80.1 42.7 99.5 96.2 105 Standard Mixture 3 55.6 63.9 0.00 69.2 12.1 50.0 77.1 25.2

40
Solvent Grad~ent
The chromatographic separation required a binary solvent gradient. Solvent A (99.75%
water/ 0.25% acetic acid) was prepared by diluting 5 mL of glacial acetic acid to the mark in 2-L
volumetric flask with Milli-Q® water. Solvent B (40% acetonitrile /60% solvent A) was
prepared by measuring 400 mL acetonitrile in a 1000 mL graduated cylinder and filling to the
mark with solvent A.
Sample Preparation
The sample preparation procedure consisted of bringing Milli-Q® water to different
temperatures (100°C, 95°C, 90 °c, 85°C, 80 °C) in 250-mL beakers and steeping the tea bags in
the beakers at constant temperature for different times ( 2, 4, 6, 8 and 10 minutes). Comparing
the brewing temperatures of the chosen green tea brands, the temperature varies from 77-100 °c
and the brewing temperatures were chosen based on typical recommended temperatures not to
extend beyond 10 minutes for consideration of the oxidation of polyphenols. Each beaker was
allowed to cool and a portion transferred to an autosampler vial with filtration through a 0.45
micrometer (11m) syringe-mounted membrane filter. This procedure was carried out in triplicate
for each variety and each set of conditions.
The mass of tea leaves in each tea bag was determined to the nearest O.OOOlg using an
analytical balance. Initial mass of each total tea bag was recorded and tea leaves from the tea bag
were transferred into the weighing dish and the mass of the empty tea bag was recorded. The
mass of the tea leaves was calculated using equation 1.
W tea leaves = Wbag+leaves - W empty tea bag
41
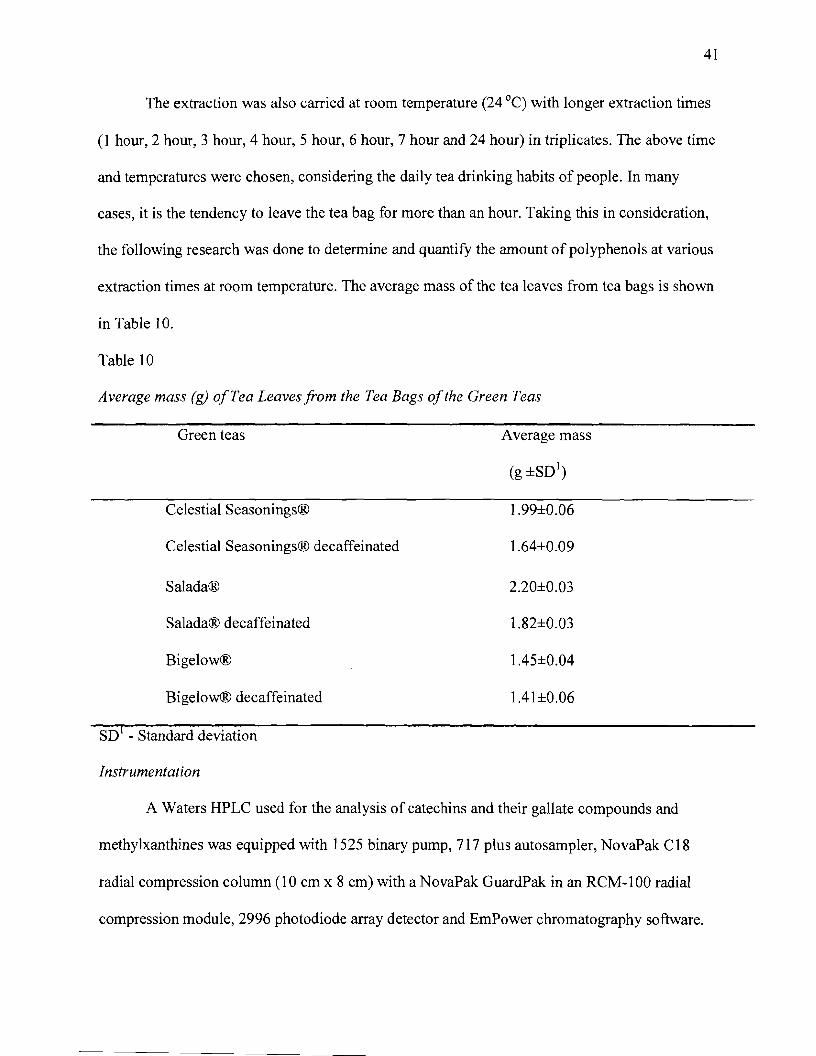
The extraction was also carried at room temperature (24°C) with longer extraction times
(1 hour, 2 hour, 3 hour, 4 hour, 5 hour, 6 hour, 7 hour and 24 hour) in triplicates. The above time
and temperatures were chosen, considering the daily tea drinking habits of people. In many
cases, it is the tendency to leave the tea bag for more than an hour. Taking this in consideration,
the following research was done to determine and quantify the amount of polyphenols at various
extraction times at room temperature. The average mass of the tea leaves from tea bags is shown
in Table 10.
Table 10
Average mass (g) a/Tea Leaves/rom the Tea Bags a/the Green Teas
Green teas Average mass
(g ±SOl)
Celestial Seasonings®
Celestial Seasonings® decaffeinated
Salada®
Salada® decaffeinated
Bigelow®
Bigelow® decaffeinated
1.99±0.06
1.64±0.09
2.20±0.03
1.82±0.03
1.45±0.04
1.4l±0.06
SOl - Standard deviation
Instrumentation
A Waters HPLC used for the analysis of catechins and their gallate compounds and
methylxanthines was equipped with 1525 binary pump, 717 plus autosampler, NovaPak C18
radial compression column (10 cm x 8 cm) with a NovaPak GuardPak in an RCM-1 00 radial
compression module, 2996 photodiode array detector and EmPower chromatography software.
42
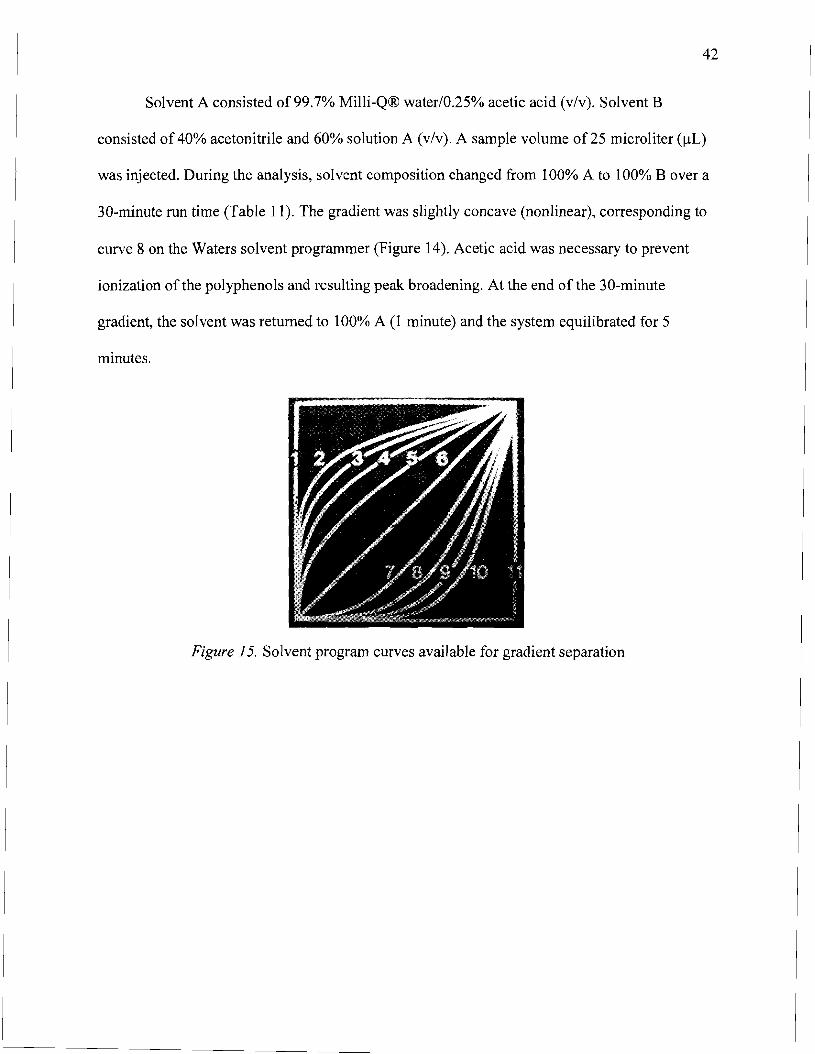
Solvent A consisted of99.7% Milli-Q® waterlO.25% acetic acid (v/v). Solvent B
consisted of 40% acetonitrile and 60% solution A (v/v). A sample volume of25 microliter (!lL)
was injected. During the analysis, solvent composition changed from 100% A to 100% B over a
30-minute run time (Table 11). The gradient was slightly concave (nonlinear), corresponding to
curve 8 on the Waters solvent programmer (Figure 14). Acetic acid was necessary to prevent
ionization of the polyphenols and resulting peak broadening. At the end of the 30-minute
gradient, the solvent was returned to 100% A (l minute) and the system equilibrated for 5
minutes.
Figure 15. Solvent program curves available for gradient separation

43
Table 11
Gradient Separation Conditions (Mobile Phase)
Time (min) Flow %A %B Curve
(mL/min)
1 0.00 2.00 100.0 0.0 0.00
2 30.00 2.00 0.0 100.0 8
3 31.00 2.00 100.0 0.0 6
4 35.00 2.00 100.0 0.0 6
Four wavelengths (260, 270, 280 and 290 nm) were used for detection and peak
verification. Multiple wavelength detection is useful for unambiguous peak identification
because peak area ratios of unknown peaks can be compared to ratios for standards. If a peak has
a retention time similar to that of a known standard, its area must compare favorably. The results
from the 270-nm chromatograms are reported in this study because that wavelength is nearest the
Amax for the analytes investigated.
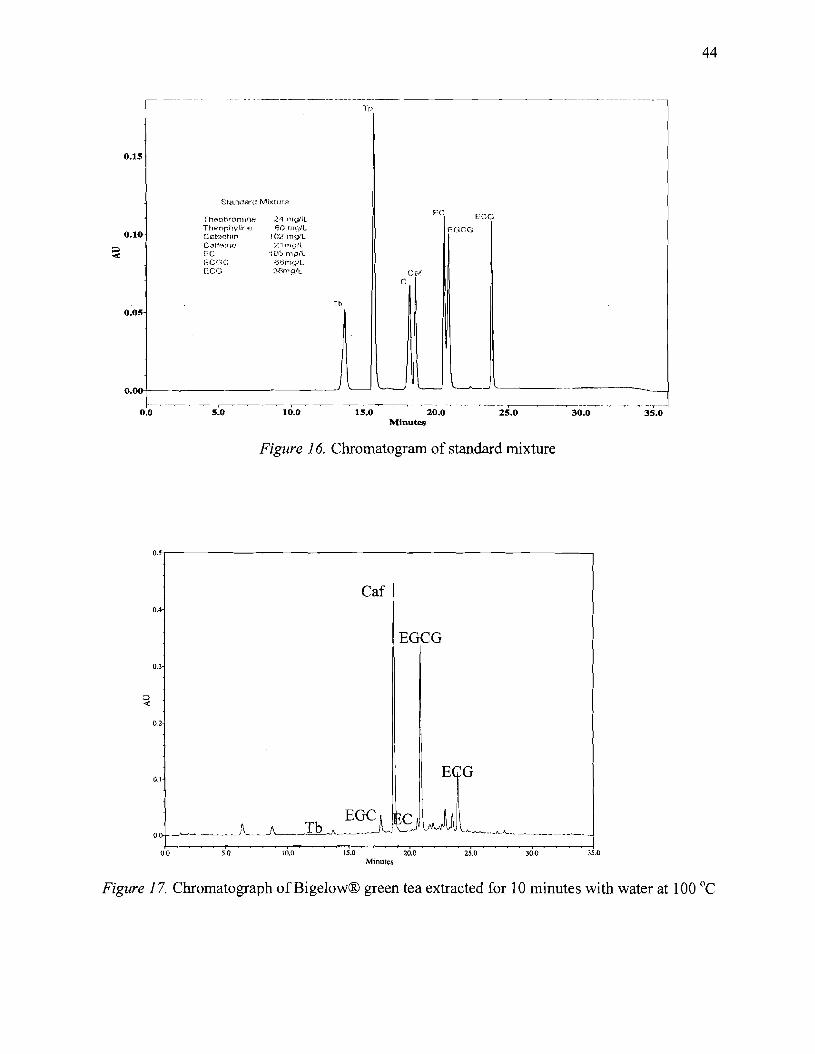
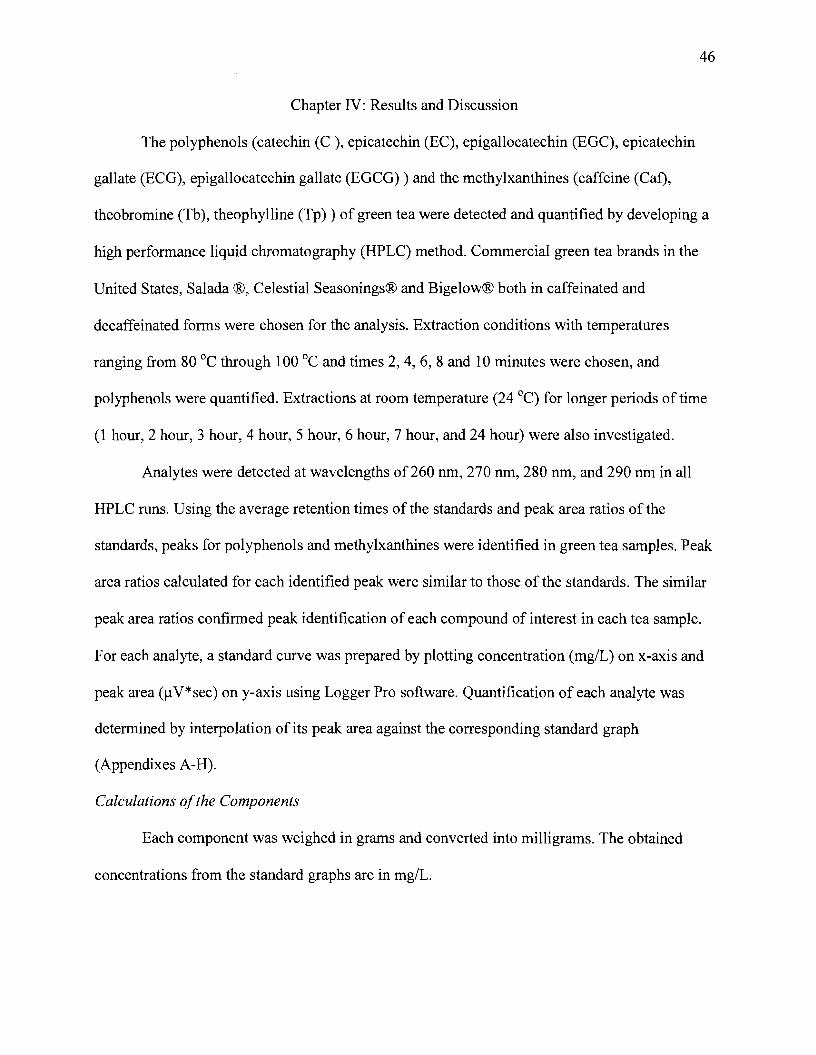
An example of the chromatogram for standard mixture #1 is shown in Figure 15, and the
Bigelow® green tea chromatograms for an 85°C at 2 minute extraction and a 100°C at 10
minute extraction are shown in Figures 17 and 16, respectively. Appendices A through G show
the standard plots of the analytes. These plots were used to identify the concentrations of
catechin, epicatechin, epigallocatechin, epigallocatechin gallate, epicatechin gallate, caffeine,
theobromine and theophylline in tea samples.
44
_._-~----_ .._.- .-..__.__.._-_.-------------------- - _ __.-Tp
0.15
Stam::laro Mixture
EC EGGTt1eobr'-.)H11ne 24 rTl(.:;IIL Thl~Or)hyJin~'.t GO rnn/L EGCG
0.1 c.:Gh;~G"lir. -I 02 rn~J/L
C:i:l1ffJlf"l(J 2'lmQ!t EeC 106 m~~/L ECCe J:)·Jrnoll. C.CG 36rnp/L
~
Cat" C
Tb 0.05
-----_.O.Oo-l--~------------------J
····-r·---~' --.... -------.-.----- ... "'--r--0.0 ..._~--~"~ ----I~O~.O--- 15.0 20:0-' 25.0 30.0 35.0 Minutes
Figure 16. Chromatogram of standard mixture
o.
Caf 0.4
EGCG
0.3
=>-<
0.2
0.1
o.
0.0 5.0 10.0 15.0 Minutes
Figure 17. Chromatograph of Bigelow® green tea extracted for 10 minutes with water at 100°C
20.0 25.0 30.0 35.0

45
0.5T----------------------------,
Caf
0.4
0.3
E CO
0.2
0.1
O.
0.0 5.0 10.0 15.0 20.0 25.0 30.0 35.0 Minutes
Figure 18. Chromatograph of Bigelow® green tea at 85 DC, 2 minutes
Data Analysis
The mean concentrations and their standard deviations were determined using Microsoft
Excel and the graphs were plotted using Logger Pro software.
Using the retention times and peak area ratios of the standards, peaks were identified in
all tea samples. The concentration of each analyte in each tea sample was determined from the
standard curve by interpolation of the peak area from the 270 run chromatogram for each sample
on the standard curve.
46
Chapter IV: Results and Discussion
The polyphenols (catechin (C ), epicatechin (EC), epigallocatechin (EGC), epicatechin
gallate (ECG), epigallocatechin gallate (EGCG) ) and the methylxanthines (caffeine (Caf),
theobromine (Tb), theophylline (Tp) ) of green tea were detected and quantified by developing a
high performance liquid chromatography (HPLC) method. Commercial green tea brands in the
United States, Salada ®, Celestial Seasonings® and Bigelow® both in caffeinated and
decaffeinated forms were chosen for the analysis. Extraction conditions with temperatures
ranging from 80°C through 100°C and times 2, 4, 6, 8 and 10 minutes were chosen, and
polyphenols were quantified. Extractions at room temperature (24°C) for longer periods of time
(1 hour, 2 hour, 3 hour, 4 hour, 5 hour, 6 hour, 7 hour, and 24 hour) were also investigated.
Analytes were detected at wavelengths of260 nm, 270 nm, 280 nm, and 290 nm in all
HPLC runs. Using the average retention times ofthe standards and peak area ratios of the
standards, peaks for polyphenols and methylxanthines were identified in green tea samples. Peak
area ratios calculated for each identified peak were similar to those of the standards. The similar
peak area ratios confirmed peak identification of each compound of interest in each tea sample.
For each analyte, a standard curve was prepared by plotting concentration (mg/L) on x-axis and
peak area (~V*sec) on y-axis using Logger Pro software. Quantification of each analyte was
determined by interpolation of its peak area against the corresponding standard graph
(Appendixes A-H).
Calculations ofthe Components
Each component was weighed in grams and converted into milligrams. The obtained
concentrations from the standard graphs are in mg/L.
47
To convert the concentrations of each compound to 250 mL serving size, the following
equation was used:
amount of component (mg) x 250 mL /serving size x 1/1 000 mL = mg/serving size
The average concentration of the analytes extracted at room temperature (24°C) for long
periods of time (l hour, 2 hour, 3 hour, 4 hour, 5 hour, 6 hour, 7 hour, and 24 hour) from
Salada®, Celestial Seasonings®, and Bigelow® green tea samples are displayed in Tables 12, 13
and 14, respectively. All of the concentrations of the compounds are given in mg/serving for ease
of comparison with other studies that denote concentrations of the catechins in milligrams per
serving. It is also useful to denote how many milligrams of catechins and methylxanthines are
present when each tea bag was brewed according to manufacturer's preparation directions
(recommends one cup of tea which is equivalent to 250 mL). The concentrations obtained were
not compared to other studies as the extraction conditions were found to be different. A study
was conducted by Wang and Helliwell (2000) on the effect of time on the epimerization of
catechins, where the infusions of tea brewed using both purified and tap water. The tea brewed
was cooled to ambient temperature and heated at 100°C for different periods of time (0 hour, 20
minutes, 1 hour, 2 hour, 3 hour, 4 hour, 5 hour). The results showed that the catechins were
highly unstable in the infusions brewed using the tap water. The epimerization increased during
the first three hours and then decreased slightly in teas brewed with purified water but for tap
water reached a maximum level after 20 minutes.
From Tables 12, 13 and 14, the results show that there was little change in the catechin
and methylxanthine concentrations of both caffeinated and decaffeinated forms with the increase
of extraction time at a constant temperature (24°C). A slight decrease in the concentration of
polyphenols of both caffeinated and decaffeinated forms was found at 2 hour extraction time

48
except for EGC in caffeinated Salada® and Bigelow® decaffeinated green teas. The
concentrations for most catechin and methylxanthines increased slightly at 3 hours and remained
constant except for C and EGC in Celestial Seasonings® and Salada® decaffeinated tea.
Generally compounds peaked at 2 to 6 hour, except for EGC in Salada® decaffeinated tea, which
was largest in value (7.63 mg/serving) at 24 hour.
Comparing the caffeine concentrations at one hour extraction in three brands of green tea,
Salada® caffeinated had the largest concentration of caffeine (40.5 mg/serving) and EGCG (68.9
mg/serving) concentrations, followed by the Celestial Seasonings® caffeine (27.3 mg/serving)
and EGCG (28.8 mg/serving) and lowest being Bigelow ® caffeine (19.8 mg/serving) and
EGCG (18.8 mg/serving) concentrations (Tables 12, 13, and 14). The other catechins and
methylxanthines also followed the same trend. In decaffeinated forms, at 1 hour extraction,
Salada® had largest concentration ofEGCG (38.5 mg/serving) followed by Bigelow® (34.5
mg/serving) and lastly Celestial Seasonings® (31.4 mg/serving). Looking at the data, it is
interesting to note that the Bigelow® decaffeinated green tea had a larger amount ofEGCG,
nearly 74% compared to the caffeinated form. Celestial Seasonings® decaffeinated tea also has
larger amount of EGCG than caffeinated form, but the difference is about 3 mg/serving at 1 hour
extraction time. Comparing the catechins, Salada® caffeinated green tea had a larger polyphenol
concentration (128 mg/serving) than Celestial Seasonings® (62.7 mg/serving) and Bigelow®
(38.4 mg/serving) green tea samples. The variation in the amount of polyphenols depends on the
type of green tea leaves used for manufacturing, and the type of extraction method used by each
company. Comparing the decaffeinated teas, the Salada® decaffeinated green tea samples had
larger amounts of polyphenoI (which includes C, EC, EGC, ECG, EGCG) concentrations (80.0
mg/serving) followed by Bigelow® (62.3 mg/serving) and then Celestial Seasonings® (58.9

49
mg/serving) at 1 hour extraction. Bigelow® decaffeinated green tea had 62% higher amounts of
polyphenols than its caffeinated green tea, which is notable. This might be influenced by the
decaffeination process used and also the type of green tea leaves. The decaffeination extraction
efficiency of Bigelow® green tea is very high compared to Salada® and Celestial Seasonings®
green teas since it allowed larger levels of polyphenols to be retained.
The concentrations of caffeine, epicatechin (EC) and epigallocatechin gallate (EGCG) are
plotted against the extraction time for Salada® tea (Figure 18). The concentration of caffeine
increased through 4 hour extraction and then tended to decrease in concentration. The
concentrations of epicatechin and epigallocatechin gallate increased until 4 hour extraction time
and remained almost constant until 7 hour extraction and decreased after 24 hour extraction time.
Comparing all the caffeinated green teas analyzed, the concentrations of EGCG decreased from 7
hour extraction time to 24 hour extraction time by around 9-11 mg/serving (for example in
Salada® tea, 84.8 mg/serving - 73.6 mg/serving = 11.2 mg/serving) in both Salada® and
Bigelow® green tea but interestingly the Celestial Seasonings® showed less of a decrease in
EGCG (2 mg/serving) compared to all others. The reason for less decrease in concentration
could be because ofthe vitamin C added to it that may have stabilized the polyphenols. A
Vitamin C peak was observed at a retention time of around 2 minutes in one of the
chromatographs obtained for Celestial Seasonings® run (Figure 19). Epicatechin concentration
increased to about 4.5 mg/serving after 1 hour extraction time and remained almost constant until
7 hours but interestingly a huge amount of decline was observed at 24 hour extraction time,
which could be either experimental error or the manufacturing process of decaffeination in
Celestial Seasonings® tea (Table 13).

50
Table 12
Concentrations (mg) ofCatechins and Methylxanthines per 250 mL Serving in Salada® Green
Tea Samples at Room Temperature 24 DC
Green Tea Sample 1 hr 2hr 3hr 4hr 5hr 6hr 7hr 24 hr
Salada caffeinated
Tpl n/a n/a n/a n/a n/a n/a n/a n/a
Tb 1.43 1.29 1.63 1.71 1.63 1.65 1.64 1.50
Caf 40.5 37.2 48.1 50.2 47.8 48.9 48.9 44.8
C 30.7 27.2 31.4 33.6 31.8 33.5 28.0 29.9
EC 11 .8 10.4 13.6 13.9 13.7 13.5 13.9 12.3
EGC 3.04 4.36 6.07 6.39 6.31 5.45 3.04 2.49
ECG 13.7 13.1 22.9 22.9 22.7 16.9 17.8 15.6
EGCG 68.9 64.9 84.5 87.2 84.6 84.0 84.8 73.6
Salada
decaffeinated n/a n/a n/a n/a n/a n/a n/a n/a
Tpl 0.88 0.83 0.92 0.66 0.84 0.89 0.91 0.92
Tb 3.43 3.14 3.60 5.40 3.47 3.63 3.63 4.32
Caf 17.9 16.1 15.9 13.7 15.5 14.5 16.7 17.4
C 8.88 5.96 6.53 5.20 6.00 6.34 6.30 7.71
EC 6.93 3.04 1.40 2.02 2.18 2.18 2.41 7.63
EGC 7.81 7.35 8.99 6.32 7.75 8.57 8.90 8.10
ECG 38.5 36.6 42.3 31.5 37.8 40.3 41.9 39.4
EGCG
In/a=not available

51
Table 13
Concentrations (mg) ofCatechins and Methylxanthines per 250 mL Serving in Celestial
Seasonings® (CS) Green Tea Samples at Room Temperature 24 DC
Green Tea Sample Ihr 2hr 3hr 4hr 5hr 6hr 7hr 24 hr
CS caffeinated
TpJ n/a n/a n/a n/a n/a n/a n/a n/a
Tb 0.29 0.50 0.54 0.37 0.40 0.45 0.45 0.43
Caf 27.3 28.4 27.3 24.9 28.3 31.6 31.4 29.3
C 20.3 26.0 30.0 29.5 28.5 29.7 29.5 28.3
EC 5.77 10.3 11.4 9.79 11.2 12.5 11.5 1.06
EGC 0.00 0.00 0.00 0.00 0.00 0.00 0.00 0.00
ECG 7.81 7.35 8.99 6.32 7.75 8.57 8.90 8.10
EGCG 28.8 41.0 50.9 42.8 49.1 54.9 55.1 53.2
CS Decaffeinated
Tpl n/a n/a n/a n/a n/a n/a n/a n/a
Tb 0.92 1.08 l.l8 l.l9 1.09 1.05 l.l1 1.05
Caf 2.75 4.13 4.59 4.58 4.23 4.17 4.35 4.12
C 13.6 14.6 15.5 15.4 14.0 13.7 15.2 13.8
EC 5.66 6.07 6.61 6.53 6.23 5.88 6.34 6.26
EGC 1.64 1.64 1.56 1.40 1.25 1.09 1.09 l.l7
ECG 6.62 9.17 10.5 10.3 9.22 9.41 10.0 9.01
EGCG 31.4 38.9 43.7 43.7 40.5 39.8 41.9 38.0
InJa=not available

52
Table 14
Concentrations (mg) ofCatechins and Methylxanthines per 250 mL Serving in Bigelow® Green
Tea Samples at Room Temperature 24°C
Green Tea 1hr 2hr 3hr 4hr 5hr 6hr 7hr 24hr Sample Bigelow Caf
TpJ n/a n/a n/a n/a n/a n/a n/a n/a
Tb 0.45 0.32 0.36 0.46 0.41 0.52 0.51 0.49
Caf 19.8 14.6 17.1 22.1 19.8 24.6 24.7 23.7
C 10.6 7.41 8.33 10.3 9.14 10.9 11.1 13.4
EC 5.20 3.53 4.06 5.54 4.90 6.34 6.72 7.40
EGC 0.00 0.00 0.00 0.00 0.00 0.00 0.00 0.00
ECG 3.82 3.19 3.93 5.36 4.67 5.88 5.93 3.69
EGCG 18.8 14.3 16.9 21.8 19.4 23.8 24.0 15.5
Bigelow Deca3
TpJ n/a n/a n/a n/a n/a n/a n/a n/a
Tb 0.82 0.79 1.12 1.00 1.04 1.06 1.06 0.89
Caf 2.25 3.51 3.12 3.81 2.90 3.15 3.17 2.37
C 11.6 14.5 16.4 14.8 15.1 15.5 15.4 11.2
EC 6.23 7.18 8.05 7.18 7.56 7.74 7.67 6.42
EGC 1.79 3.97 2.80 2.57 2.49 2.49 1.01 0.16
ECG 8.21 13.3 15.8 15.5 14.9 16.9 13.0 10.4
EGCG 34.5 41.8 49.1 45.2 46.7 48.1 48.2 39.2
In/a=not available Caf2 = caffeinated Deca3=decaffienated

53
Salada Regular Green Tea 100
Q'\ c: .~
(1) • '" en E 80 c () c 0 0 t') U
w " 0; c 60 .~
m In Ch E
•
c () c 0 U
40u w 0; c ~ a>
.s ~
c () 20 c: 0 u ro u
I 10 15 20 25
Time hours
Figure 19. The concentration of caffeine, epicatechin (EC) and epigallocatechin gallate (EGCG)
plotted against the time of extraction of Salada® caffeinated green tea at different extraction
temperatures.

54
Caffeine 0.:14
0.32
o. Ecce
Q.2
0.26 Celestial Seasonings Caffeinated Green Tea
0.24
0.22
0.2
AlJ 0.1
0.t6
0.14
0.12
ECG o.
o.
0.04 I 002 I
{~L 0.00 2·T.oo~~4T.bo~~61iO-"'800· 10 1 12.00 14~OO T'~~-~OO 22~OO 24~OO 26~OO ~~OO-~3-W~.00
Time(mill)
Figure 20. Chromatograph of Celestial Seasonings® caffeinated green tea

55
Salada® Green Tea Analysis
Salada® caffeinated green tea. The amounts of polyphenols and methylxanthines present
in Salada® caffeinated and decaffeinated forms were analyzed and the results are shown in
Tables 15 and 16, respectively. All the analyses were conducted per serving size (250 mL).
Theophylline (Tp) was not detectable in any sample. Theobromine (Tb) concentrations remained
almost constant with the increasing time at each constant temperature. The largest amounts of
total polyphenols were found at 80°C extraction temperature compared to other temperatures.
For example, the highest extraction of total polyphenols, 239 mg/serving was found at extraction
time of eight minutes at 80°C. The caffeine concentrations increased up to 8 minutes extraction
and then generally decreased at all temperatures. The concentrations of caffeine decreased as the
temperature decreased from 100°C to 90°C at corresponding extraction times, and then
increased at increasing corresponding times. For example, at a temperature of 100°C for 2
minutes extraction the concentration of caffeine was 54.4 mg/serving and at 90°C for 2 minutes
were 42.3 mg/serving and at 85°C for 2 minutes were 52.8 mg/serving.
The total polyphenol content generally increased in concentration from 2 minutes to six
minutes at each corresponding temperature, and then declined at 10 minutes. The total
polyphenol content increased from 187 mg/serving to 225 mglserving as the time was increased
from 2 minutes to 10 minutes at constant temperature of 100°C. The largest amount of total
polyphenols was attained at a temperature of 80°C and 8 minutes (239 mg/ serving). No specific
trend for EGCG content was observed. The amount ofcaffeine ranged from 41-59 mg/serving,
EGCG was from 83-131 mg/serving, and the total polyphenol content was from 147-239
mg/serving. A high extraction efficiency was noted at temperature of 80°C at 8 minutes both for
the EGCG (131 mg/serving) and total polyphenol content (239 mg/serving), and caffeine was

56
found at a larger level (59.5 mg/serving) at a temperature of 100°C. A study by Pera-Uzanalic
and others (2006) showed that higher extraction efficiency occurred at 80°C compared to 95 0c.
Degradation of catechins is greater at higher temperatures (95°C compared to 80°C). Therefore,
prolonged extraction time (more than 20 minutes) showed a decrease in the amount of catechins
at 80°C and 95 °C (Perva-Uzanalic et.aI., 2006). For example, the concentration total
polyphenols at 95°C is 174 mg/serving compared to 192 mg/serving at 80°C at same extraction
time of2 minutes.
Salada® decaffeinated green tea. The decaffeination process can be completed using
C02 and water, a method known as effervescence. The amount of caffeine retained after
decaffeination is said to be less than 5%. The amount of caffeine left after decaffeination ranges
usually from 3-6 mg/serving, which is about 5% of the caffeine amount present in caffeinated
green tea and this was observed with the current study as well, with levels ranging from 3.3 to
5.7 mg/250 mL serving. Theobromine and caffeine concentrations varied minimally with
changes in time and temperatures. A greater concentration of total polyphenol content was
extracted at 100°C for 10 minutes (147 mg/serving) and the lowest concentration was at 85°C
for 6 minutes (75.5 mg/serving). For example, at a temperature of 100°C, the concentrations of
total polyphenols were larger compared to the other temperatures analyzed particularly at 10
minutes (147 mg/serving) (Table 16). The range of polyphenoI content was 75 to 147 mg/serving
size. The amount of decaffeination using supercritical carbon dioxide has been noted to remove
37.8 % ofEGCG (Seok Park et aI., 2007). Comparing the EGCG from caffeinated green tea to
the decaffeinated green tea, the percentage of EGCG removed in the current study ranges from
38-49%, which is slightly higher than reported literature values. The typical decaffeination
process also affects the amount of EGCG removed. At constant temperatures, the concentration
57
of catechins increased with an increase in time, whereas at a constant time, the concentration
decreased with a decrease in temperature until 90°C and then increased. For example, at a
constant time of 6 minutes the concentration of total polyphenols at 100°C, 95°C, 90 °c, 85°C,
and 80 °c are 135 mg/serving, 117 mg/serving, 107 mg/serving, 75.5 mg/serving, and 86.2
mg/serving, respectively. Also for example, at a constant temperature of 90°C, the concentration
of total polyphenols at 2 minutes, 4 minutes, 6 minutes, 8 minutes and 10 minutes are 86.5
mg/serving, 93 mg/serving, 86.2 mglserving, 94 mg/serving and 95.1 mg/serving, respectively.

58
Table 15
The Average Concentrations of all the Analytes in Salada® CafJeinated Green Tea in mg/250
mL Serving
Concentration Tpl Tb Caf C EC EGC ECG EGCG Total
(mg/serving)±SD polyphenols
At temp of 100°C 2 minutes n/a 1.0iO.1 54.4±2.0 45.5±2.1 20.1±0.6 7.1±0.3 23.1±1.6 91.4±2.0 187±6.5
4 minutes n/a 1.0±0.1 57.3±2.0 48.7±1.9 21.6±0.6 8.3±0.4 25.3±1.7 94.4±2.0 198±6.5 6 minutes n/a 1.3±0.1 59.5±2.0 54.7±2.2 22.4±0.4 9.2±0.3 29.2±1.3 96.4±1.9 212±6.2 8 minutes n/a 1.4±0.1 55.3±2.1 50.3±2.2 23.3±0.5 11.4±0.4 30.9±4.8 100±2.2 216±3.4
10 minutes n/a 1.3±0.1 57.5±1.7 50.5±2.2 21.3±1.0 12.5±0.4 37.0±1.4 104±2.3 225±7.2
At temp of 95°C 2 minutes n/a 1.7±0.1 50.5±1.7 36.7±2.1 10.8±0.5 2.3±0.4 23.2±1.7 101±2.6 174±7.2
4 minutes n/a 1.8±0.1 53.6±2.0 39.5±2.0 11.8±0.6 2.6±0.2 25.2±1.5 110±2.3 189±6.5
6 minutes n/a 1.8±0.1 58.4±1.8 44.7±2.1 15.3±0.5 2.7±0.4 30.1±1.9 132±2.1 225±7.1
8 minutes n/a 1.8±0.1 54.3±2.0 40.7±1.9 13.0±0.4 2.7±0.4 28.2±1.7 119±2.1 203±6.4
10 minutes n/a 1.9±0.1 55.5±2.0 40.9±2.0 12.8±0.5 2.7±0.3 28.3±1.4 118±2.1 202±6.4
At temp of 90°C 2 minutes n/a 1.5±0.1 42.3±2.0 33.5±2.2 8.8±5.8 12.4±0.6 19.9±1.7 83±2.2 157±8.9 4 minutes n/a 1.7±0.1 49.7±1.9 37.6±2.1 14.4±0.6 13.4±0.6 26.0±1.6 103±2.0 194±6.5 6 minutes n/a 1.9±0.0 50.4±2.0 36.7±2.1 13.4±0.5 12.2±1.1 22.1±1.6 99±2.0 183±6.5 8 minutes n/a 1.7±0.1 49.4±2.0 36.5±1.9 14.310.5 12.6±0.7 23.3±1.7 102±1.8 189±6.9 10 minutes n/a 1.7±0.1 47.7±1.9 36.8±2.0 13.4±0.5 15.1±0.7 24.0±2.1 97±2.0 187±6.2
At temp of 85°C 2 minutes n/a 1.7±0.0 52.8±2.0 39.6±1.9 12.3±0.4 3.0±0.6 23.2±1.5 108±2.0 186±6.2 4 minutes n/a 1.7±0.1 52.5±2.0 39.6±1.9 12.5±0.5 3.4±0.3 23.4±1.7 108±1.9 187±5.7 6 minutes n/a 1.4±0.1 41.412.2 31.5±2.1 10.210.4 2.410.6 18.2i1.6 85±2.0 147±6.4 8 minutes n/a 3.9±0.0 55.5±2.0 43.4±2.3 15.7±0.4 3.5±0.6 25.2±1.4 115±1.9 203±6.3 10 minutes n/a 1.8±0.1 55.5±2.0 41.9±1.3 15.3±0.6 3.5±0.7 25.2±1.4 116±2.0 202±5.6
At temp of 80°C 2 minutes n/a 2.0±0.1 51.5±2.0 41.6±2.4 14.3±0.7 7.7±0.6 27.1±1.4 101±2.0 192±6.9 4 minutes n/a 2.3±0.1 57.5±2.0 47.4±1.9 16.8±0.6 8.9±0.8 30.9±1.7 119±2.3 224±6.9 6 minutes n/a 2.2±0.1 54.5±2.0 44.7±2.2 14.7±0.6 8.7±0.6 30.1±1.9 116±2.0 215±7.0 8 minutes n/a 2.3±0.1 58.3±1.9 48.4±1.8 17.410.5 9.3±0.9 34.211.6 131±2.1 23916.3 10 minutes n/a 2.2±0.1 56.4±2.0 47.4±1.6 16.4±0.6 9.5±0.8 32.2±1.6 124±2.0 229±6.0
In/a=not available

59
Table 16
The Average Concentrations ofall the Analytes in Salada® Decaffeinated Green Tea in mg/250
mL Serving
Concentration Tpl Tb Caf C EC EGC ECG EGCG Tolal
(mgfserving)iSD Polyphenols
At temp of 100 °c 2 minutes nfa 1.1±0.1 4.8iO.2 23.0il.3 8.3iO.3 3.5iO.2 16.8i1.3 66.6i2.1 118i4.8 4 minutes nfa 1.2iO.1 5AiO.2 25.0i1.6 9.2iO.2 4.3iO.l 21.1±1.1 78.4i2.1 138i5.1
6 minutes nfa 1.1±0.1 5.1±0.1 24.1±1.7 9AiO.3 5.3iO.2 19.2i1.5 76.5i2.1 135i5.7 8 minutes nfa 1.2iO.1 5.3iO.2 24.0i1.0 9.8iO.1 4.8iO.l 17.1i1.3 78.5i2.0 134i4.6 10 minutes nla l.3iO.1 5AiO.2 27.3i1.9 10.3iO.3 5.6iO.1 18.9iO.9 84.4i1.9 147i5.2
At temp of 95°C 2 minutes nfa 1.2iO.1 4.7iO.2 18AiO.6 6.6iO.2 1.8iO.1 12.8iO.6 55.3i1.9 95.0i3.4 4 minutes nfa 1.2iO.1 5.5iO.2 20.4iO.6 6.2tO.3 1.8iO.1 15.1±0.6 63.7i2.1 107i3.7 6 minutes nfa 1.3iO.1 5.1±0.1 21.6iO.5 8.1tO.1 2.1±0.1 15.8iO.5 69.2i1.9 117i3.3 8 minutes nfa 1.2iO.1 4.7iO.2 19.8iO.7 7AtO.2 1.9±0.1 15.9iO.6 66.7±1.8 112i3.4 10 minutes nfa 1.2iO.0 5.6iO.2 21.2iO.6 7.7tO.3 2.2iO.1 16.2iO.3 67.3i1.8 115i3.0
At temp of 90°C 2 minutes nfa 1.1±O.1 4.7±0.2 17.7iO.4 6.0tO.2 1.7±0.1 11.4iO.5 49.7i1.7 86.4t3.0 4 mimrtes nfa 1.2iO.1 4.7±0.2 20.8tO.3 7.3tO.2 2.1±0.2 14.6±0.5 63.5±2.0 108i3.3 6 minutes nfa 1.2±0.1 4.7±0.2 19.7tO.6 7.1±0.2 1.8iO.2 15.2iO.7 63.6±2.0 107i3.6 8 minutes nfa 1.2iO.1 4.7iO.2 20.3tO.6 7AtO.2 1.8iO.2 14.9iO.9 63.5±1.7 108i3.6 10 minutes nfa 1.3iO.1 5.7iO.2 22.0±0.8 10.1±OA 2.2±0.1 17.2iO.5 69.5i2.3 121±4.0
At temp of 85°C 2 minutes nfa 1.0iO.1 3.8±0.2 16.7tOA 6AiO.3 2.3iO.1 1l.OiO.5 49.7i1.9 86.1±3.2 4 minutes nfa 1.2±0.1 4.2±0.2 18.6tO.5 7A±0.2 2.7iO.1 11.9iO.5 54Ai2.0 95.0i3A 6 minutes nfa 0.8iO.1 3.3±0.2 14.S±0.5 6.1±0.2 2.0±0.2 9A±OA 43.5i2.1 75.5±3A 8 minutes nfa 1.0tO.1 4.2iO.2 17.3±OA 7.1±0.3 2A±0.2 12.5iO.5 5S.7t1.8 95.1±3.1 10 minutes nla 1.2±0.1 4.8±0.2 20.HO.7 7.7±0.2 2.8±0.2 15.5±0.3 66.6±2.0 113t3A
At temp of 80°C 2 minutes nfa 0.9tO.0 3.9±0.2 17.2iO.5 6.2±0.2 2.3iO.1 10AiO.5 50Ai2.3 86.5±3.6 4 minutes nfa 1.0tO.1 4.2±0.2 19.4±0.6 7.5±0.2 2.7±0.2 1l.2±0.5 52.3i1.9 93.1±3A 6 minutes nfa 0.8tO.0 4.3iO.2 lS.4iO.7 6.2iO.2 2.1±0.1 11.0±0.S 51.6i2.2 86.2i3.6 8 minutes nfa 0.8iO.1 4.2iO.2 18AiO.6 7.SiO.2 2.S±0.1 12.3iO.6 S3.3±1.9 94.0i3.S 10 minutes nla 1. 1±0.1 4AtO.2 21.2±0.5 8.2±0.2 2.9±0.2 11.4iO.5 51.S±2A 95.1±3.7
lnla=not available

60
Celestial Seasonings® Green Tea Analysis
Celestial Seasonings® caffeinated green tea. Table 17 shows that the theobromine
concentration was greater overall at a temperature of 100°C and lowest at a temperature of 80°C
compared to other temperatures. The caffeine content overall increased with an increase in time
at each temperature up to 8 minutes, and then it decreased. With a change in temperatures, the
caffeine concentrations tended to increase from 80 °c to 90°C and then decreased when
temperatures were higher than 90 0c. Catechins increased in concentrations up to 8 minutes at
each temperature and then decreased slightly. Total polyphenol concentration (280 mg/serving)
was greatest at a temperature of 100°C with an extraction time of 10 minutes. Total polyphenol
concentrations typically decreased with a decrease of temperature at corresponding times. For
example, total polyphenol concentrations at 100°C, 95°C, 90 °c, 85°C, and 80 °c decreased as
follows, 168 mg/serving, 145 mg/serving, 140 mg/serving, 106 mg/serving and 98.5 mg/serving,
respectively at a constant extraction time of 4 minutes. The range of total polyphenols was from
97 - 280 mg/serving, EGCG was 51-110 mg/serving, and caffeine was 28-42 mg/serving.
Compared to the Salada® caffeinated green tea, the range of total polyphenols is wider with
EGCG, and caffeine lower in range. The differences in the amounts might be due the type of
green tea leaves used, processing conditions, type of processing (bi-directional rolling or uni
directional rolling). The amount of tea leaves in the tea bag also affects the change in the
concentrations of the polyphenols and methylxanthines. Salada® has a larger mass of tea leaves
compared to Celestial Seasonings® by around 0.2 g. The package directions say to steep the tea
bag in boiling water for 3 minutes. Comparing the amount of polyphenols at 4 minutes and 10
minutes at boiling temperature, 66% higher polyphenols was obtained. The concentration of

61
polyphenols at 4 minutes at boiling temperature is 168 mg/serving and at 10 minutes are 280
mg/serving, which is about a 66% increase (Table 17).
Celestial Seasonings® decaffeinated green tea. Table 18 shows that the amount of
caffeine increased with an increase in time at a constant temperature, but the caffeine content did
not follow a specific pattern with respect to the change in temperature across constant times. The
concentrations of total polyphenols (Figure 20) increased with an increase in time at a constant
temperature, and tended to decline with a decrease in temperature at a constant time. For
example, at a constant temperature of 100DC, the concentrations at 2 minutes, 4 minutes,
6minutes, 8 minutes and 10 minutes are 76.1 mg/serving, 87.6 mg/serving, 97.2 mg/serving, 93.1
mg/serving, and 86.4 mg/serving, respectively. The amount of caffeine ranged from 28.4
mg/serving to 42.4 mg/serving in caffeinated green tea and 3.2 mg/serving to 6.4 mg/serving in
decaffeinated green tea. The amount of caffeine retained falls to between 11 to 15% of the
caffeine obtained from caffeinated green tea. The concentration of EGCG tended to increase as
the extraction time increased and the leveled off similar to the trend shown by total polyphenols.
The range of the concentrations ofEGCG was from 41-93 mg/serving size. Compared to the
caffeinated green tea, the concentration of EGCG was reduced to 15-21 % in decaffeinated
Celestial Seasonings® green tea. The decaffeination process did not affect the amount of
catechins sustainably, however; the efficiency of removing caffeine is found to be less. The
amount of total polyphenols decreased with a decrease in temperature at a constant time, but
tended to increase with an increase in time at constant temperatures until 8 minutes and then
decreased. The range of total polyphenols is from 90 to 177 mg/serving size. The larger amounts
were obtained at a temperature of 100DC and particularly at an extraction time of 8 minutes.

62
Table 17
The Average Concentrations ofall the Analytes in Celestial Seasonings® Caffeinated Green Tea
in mg/250 mL Serving
Concentration Tpl Tb Caf C EC EGC ECG EGCG Total
(mg/serving)iSD Polyphenols
At temp of 100 °c 2 minutes n/a 1.2iO.1 30.4t2.3 31.1±0.7 1l.2tO.8 4.3t1.0 12.7t1.2 55.2iO.8 165i2.7 4 minutes n/a 1.2iO.1 29.6±1.5 31.6±1.2 1l.4t1.2 4.6tO.9 13.3i1.0 56.9i2.5 168t3.9 6 minutes n/a 1.5tO.1 37.5±1.3 42.7±1.3 15.4iO.8 5.2iO.7 22.0iO.5 89.1±2.9 242t3.7 8 minutes n/a 1.6tO.1 39.9t2.1 49.2tO.2 16.8tO.7 5.6tO.3 27.5t1.4 106t2.5 276i6.4 10 minutes n/a 1.7tO.1 42.4i3.5 47.4iO.1 16.8tO.6 5.9tO.5 26.5t1.0 1l0t1.5 280t2.3
At temp of 95°C 2 minutes n/a 0.5iO.1 31.1±0.3 28.2i1.0 1l.OtO.2 2.9tO.3 1O.9tO.5 51.7tO.8 104t2.8 4 minutes n/a 0.siO.1 37.0iO.5 37.9t1.2 12.2tO.6 2.6tO.6 16.7tO.S 7S.9tO.4 14St3.4 6 minutes n/a O.6iO.1 42.0iO.5 42.7tO.s 14.7iO.6 2.0iO.2 18.8iO.s 86.2iO.S 16Si2.2 8 minutes n/a 0.5iO.0 34.7iO.6 38.6tOA 12.2tOA 2.4tO.6 17.0iO.7 79.8i2.8 lS0i2.7 10 minutes n/a O.SiO.O 3S.2tO.S 38.9tO.3 12.9tO.8 2.3tO.6 17.9iO.6 81.st2A lS4t3.0
At temp of 90°C 2 minutes n/a O.5iO.1 36.0iO.s 31Ai1.4 1l.1±O.6 1.7tO.6 13.3tO.6 62.0t2A 120t3.5 4 minutes n/a 0.6tO.1 38.0tO.3 39.2iO.9 12.8tO.8 1.4tO.6 15.1±0.3 71.9t2.1 140t3.3 6 minutes n/a O.6tO.1 41.3t1.1 43AtO.7 14.0tO.l 1.7±1.l 17.8tO.6 83.2tS.S 160t3.0 8 minutes n/a 0.6iO.1 38.1±0.3 37.8t1.0 12.8tO.7 1.7±0.7 lS.7tO.S 73.8t2.1 142i3.7 10 minutes n/a 0.6iO.l 38.1±0.9 39.7iO.4 l2.9iO.8 3.2iO.7 18.1±0.6 81.6iS.5 156±3.1
At temp of 85°C 2 minutes n/a O.SiO.l 33.1±0.3 28.6iO.s 1O.1±OA 1.2iO.6 11.1tO.3 SS.1±4.6 106i2.6 4 minutes n/a O.siO.l 30.2iO.6 27.9iO.9 9.6iO.6 1.8tO.6 11.8iO.7 SS.1±1.6 106±3.1 6 minutes n/a O.siO.O 34.0iO.3 32.7tOA l1.7iO.8 2.0iO.6 l4.1±0.5 67.3t2.4 128t3.0 8 minutes n/a O.SiO.l 3S.2tO.9 35.6±0.6 l2.0±0.7 2.1±0.6 l4.7iO.5 69.7i2.l 134t2.8 10 minutes n/a O.4tO.1 30.0tOA 28.8tO.7 1O.1±0.s 1.9tO.7 12.8tO.9 59.St3.8 113t3.6
At temp of 80°C 2 minutes n/a 0.4tO.0 32.0iO.6 26.5iO.8 9.1±0.S 0.6iO.l 9.2iO.s 52.3i2.0 97.9t1.9 4 minutes n/a O.4tO.O 29.2tO.7 2S.2iO.3 9.S±0.S 1.3iO.1 10.3±0.7 52.2t3.3 98.St2.0 6 minutes n/a OAtO.1 32.SiO.6 30.S±lA 1l.OtO.s 1.StO.l l2.3tOA 64.0t3.0 l19i2.9 8 minutes n/a OAtO.O 33.SiO.6 33.2±0.S 1l.StO.S 1.6tO.l 13.3tO.S 64.2t2.9 l24tl.7 10 minutes n/a 0.3tO.0 28Ai1.0 26.0tO.6 9.3tO.6 l,3tO.0 l2.S±0.6 S6.9t4.4 106±2.S
In/a=not available
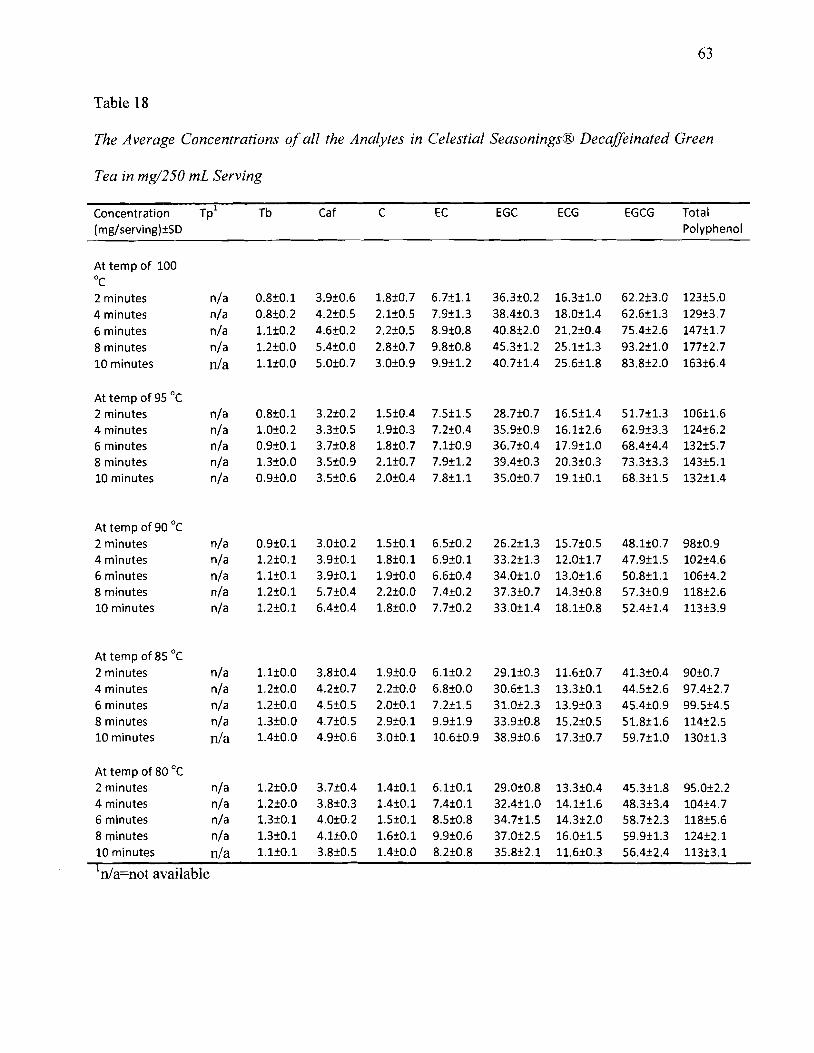
63
Table 18
The Average Concentrations of all the Analytes in Celestial Seasonings® Decaffeinated Green
Tea in mg/250 mL Serving
Concentration Tpl Tb Caf C EC EGC ECG EGCG Total
(mg/serving)±SD Polyphenol
At temp of 100 °c 2 minutes n/a 0.8iO.1 3.9iO.6 1.8iO.7 6.7i1.1 36.3±0.2 16.3i1.0 62.2±3.0 123i5.0 4 minutes n/a 0.8iO.2 4.2iO.5 2.1±0.5 7.9±1.3 38.4iO.3 18.0i1.4 62.6±1.3 129±3.7
6 minutes n/a 1.1±0.2 4.6±0.2 2.2iO.5 8.9±0.8 40.8i2.0 21.2±0.4 75.4±2.6 147i1.7
8 minutes n/a l.2iO.0 5.4iO.0 2.8±0.7 9.8±0.8 45.3±1.2 25.1±1.3 93.2i1.0 177i2.7 10 minutes nJa 1.1±O.O 5.0±0.7 3.0±0.9 9.9±1.2 40.7±1.4 25.6±1.8 83.8±2.0 163±6.4
At temp of 95°C 2 minutes n/a 0.8±0.1 3.2±0.2 1.5±0.4 7.5±1.5 28.7±0.7 16.5±1.4 51.7±1.3 106±1.6 4 minutes n/a 1.0±0.2 3.3±0.5 1.9±0.3 7.2±0.4 35.9±0.9 16.1±2.6 62.9±3.3 124±6.2 6 minutes n/a 0.9±0.1 3.7±0.8 1.8±0.7 7.1±0.9 36.7±OA 17.9±1.0 68.4±4A 132±5.7 8 minutes n/a 1.3±0.0 3.5±0.9 2.1±0.7 7.9±1.2 39.4±0.3 20.3±0.3 73.3±3.3 143±5.1 10 minutes n/a 0.9±0.0 3.5±0.6 2.0±OA 7.8±1.1 35.0±0.7 19.1±0.1 68.3±1.5 132±1.4
At temp of 90°C 2 minutes n/a 0.9±0.1 3.0±0.2 1.5±0.1 6.5±0.2 26.2±1.3 15.7±0.5 48.1±0.7 98±0.9 4 minutes n/a 1.2±0.1 3.9±0.1 1.8±0.1 6.9iO.1 33.2±1.3 12.0±1.7 47.9i1.5 102±4.6 6 minutes n/a 1.1±O.l 3.9±0.1 1.9±0.0 6.6±0.4 34.0±1.0 13.0±1. 6 50.8±1.1 106±4.2 8 minutes n/a 1.2±0.1 5.7±0.4 2.2±0.0 7.4±0.2 37.3±0.7 14.3±0.8 57.3±0.9 118±2.6 10 minutes n/a 1.2±0.1 6A±0.4 1.8±0.0 7.7±0.2 33.0i1.4 18.1iO.8 52Ai1.4 113i3.9
At temp of 85°C 2 minutes n/a 1.1±O.O 3.8iOA 1.9iO.0 6.1±0.2 29.1±0.3 11.6iO.7 41.3iO.4 90iO.7 4 minutes n/a 1.2iO.0 4.2iO.7 2.2iO.0 6.8iO.0 30.6i1.3 13.3±0.1 44.5i2.6 97.4i2.7 6 minutes n/a 1.2iO.0 4.5iO.5 2.0iO.1 7.2±1.5 31.0±2.3 13.9iO.3 45A±0.9 99.5i4.5 8 minutes n/a l.3iO.O 4.7iO.5 2.9iO.1 9.9i1.9 33.9iO.8 15.2iO.5 51.8i1.6 114i2.5 10 minutes nJa 1.4iO.0 4.9±0.6 3.0iO.1 10.6iO.9 38.9iO.6 17.3iO.7 59.7i1.0 130i1.3
At temp of 80°C 2 minutes n/a 1.2iO.0 3.7±0.4 1AiO.1 6.1±0.1 29.0iO.8 13.3±0.4 45.3i1.8 95.0i2.2 4 minutes n/a 1.2iO.0 3.8±0.3 1.4iO.1 7.4±0.1 32.4i1.0 14.1±1.6 48.3i3.4 104±4.7 6 minutes n/a 1.3iO.1 4.0iO.2 1.5iO.1 8.5iO.8 34.7±1.5 14.3i2.0 58.7i2.3 118i5.6 8 minutes n/a 1.3iO.1 4.1±0.0 1.6iO.1 9.9±0.6 37.0i2.5 16.0i1.5 59.9i1.3 124±2.1 10 minutes nJa 1.1±0.1 3.8iO.5 1.4iO.0 8.2iO.8 35.8i2.1 11.6iO.3 56Ai2A 113±3.1
InJa=not available

64
() Celestial Seasonings Regular Green Tea o 30 ro (5 c <.> c o ()
"8 c (I) .c: a. >, "5 Q
o l-
"d 200 o (j)
\U c:o c o (.)
<IJ .c
g •0:>.
& • ~ u 100 o o o ~
\\J c: u
<3 (5
a5 ~ (5 Q
~. Ol~----r----r-----r----jr-----r----r----,r-----r-----r----., o 2 6 8 10
Figure 21. The concentration of total polyphenols plotted against the time of extraction of
Celestial Seasonings® caffeinated green tea at extraction temperatures of 100 DC, 90 DC and
80 Dc.

65
Bigelow® Caffeinated Green Tea
Bigelow® caffeinated green tea. Table 19 shows that the theobromine
concentrations remained almost constant with level ranging from 0.9 to 1.7 mg/serving within
each extraction condition. The extraction of caffeine, and total po1yphenols increased with an
increase in time until 8 minutes and then remained constant at constant temperatures; however,
there was a decrease in concentrations with a decrease in temperature at constant times. The
range of caffeine concentrations was from 20.,,3 1 mg/serving, EGCG was 23-47 mg/serving, and
total polyphenol content was from 51-109 mg/serving. Comparing the caffeine content with the
brands investigated, Bigelow® was found to have the lowest caffeine, EGCG and total
polyphenol content compared to all other brands. Green tea is known for its health benefits due
to its antioxidant properties and the benefits include: reducing the risk of cancer and coronary
heart disease, which might be due the ability of catechins to prevent low density lipoprotein
(LDL) from being oxidized; antibiotic effects; a possible role in treating humans with type 2
diabetes; preventive effects on chronic inflammatory diseases and neurological disorders (Chiu,
2006). When po1ypheno1s are lower, any associated health benefits are also lower. Therefore,
Bigelow® tea may not be as high in healthy antioxidants as the other brands studied. Larger
amounts of caffeine, EGCG and total polyphenols were obtained at a temperature of 100°C and
up to an extraction time of 8 minutes. The company recommended brewing conditions of
Bigelow® green tea brand is 85°C for 3 to 5 minutes. When comparing the concentration at this
extraction condition and the conditions at which the largest concentration was attained, the
difference of only 2 mg was observed for total polyphenols and 7 mg for EGCG and 5 mg for

66
caffeine. This shows that the package directions might represent the brewing conditions at which
maximum concentrations of polyphenols could be obtained.
Bigelow® decaffiinated green tea. The extraction of methylxanthines was almost
constant with the change oftime and temperatures and it was found that the polyphenol content
increased with increasing time at constant temperature and decreased with a decrease in
temperature. For example, the largest amount of total polyphenols (194 mg/serving) and EGCG
(102 mg/serving) was obtained at an extraction temperature of 100°C at 10 minutes but
decreasing the temperature to 80°C at 10 minutes only gave 155 mg/serving total polyphenol and
78.9 mg/serving EGCG. The caffeine left after the decaffeination process is 2.6 to 5.8
mg/serving size, which is about 15 to 18 percent of the caffeine found in the Bigelow®
caffeinated green tea. Interestingly, the amount ofEGCG was found to be greater in the
decaffeinated green tea than in the caffeinated tea. The range of EGCG obtained was from 56 to
102 mg/serving and the total polyphenol content ranged from 112 to 194 mg/serving that is
almost double the amount compared to the EGCG and total polyphenol content of the Bigelow®
caffeinated green tea. The Salada® and Celestial Seasonings® caffeinated green tea showed
greater amounts of polyphenols than the decaffeinated forms but Bigelow® showed the reverse
effect which is very interesting. The decaffeinated green tea leaves mass was found to be almost
the same as that of the caffeinated tea leaves of Bigelow® brand. The Bigelow® decaffeinated
green tea (1.41 g/tea bag) had a lower mass of tea leaves compared to the Salada® (1.82 g/tea
bag) and Celestial Seasonings® (1.64 g/tea bag) decaffeinated green teas. This implies that
differences in the tea leaves mass might have had an affect on the change in the concentrations of
polyphenols and methylxanthines.
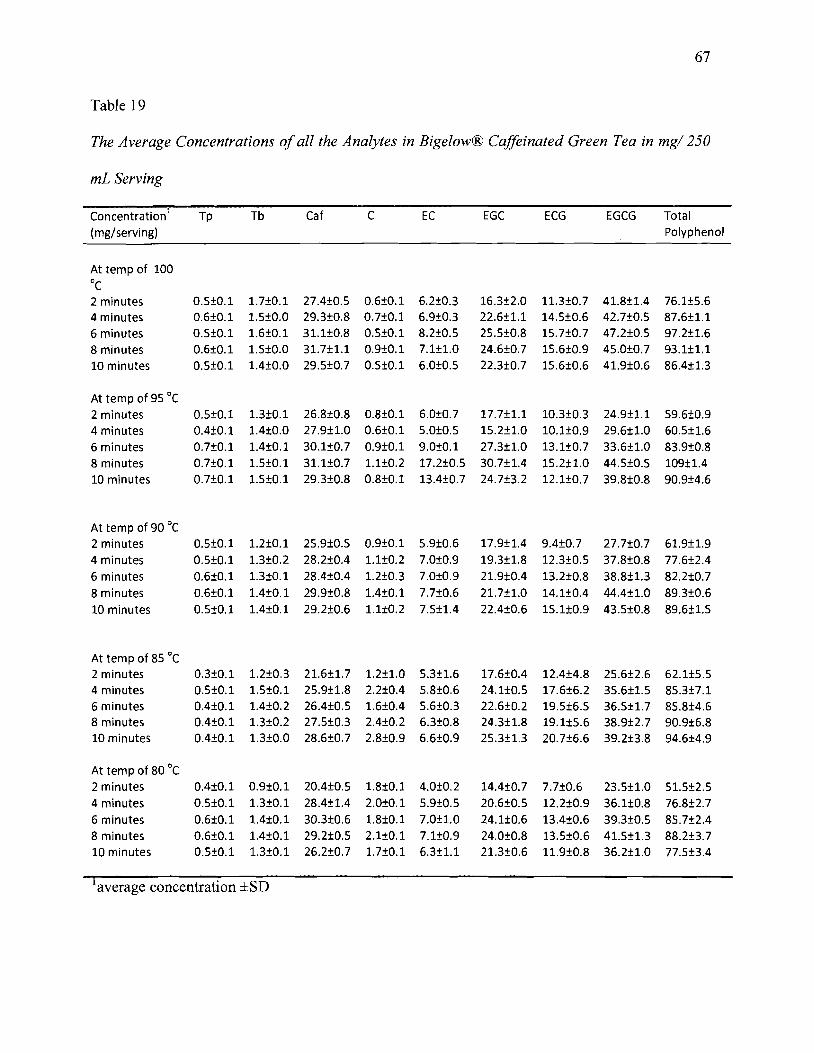
67
Table 19
The Average Concentrations ofall the Analytes in Bigelow® CajJeinated Green Tea in mg/250
mL Serving
Concentration1 Tp Tb Caf C EC EGC ECG EGCG Total
(mg/serving) Polyphenol
At temp of 100 °c 2 minutes O.S±O.l 1.7±0.1 27.4±0.5 0.6±0.1 6.2±0.3 16.3±2.0 11.3±0.7 41.8±1.4 76.1±S.6 4 minutes 0.6±0.1 1.S±0.0 29.3±0.8 0.7±0.1 6.9±0.3 22.6±1.1 14.S±0.6 42.7±0.5 87.6±1.1 6 minutes O.S±O.l 1.6±0.1 31.1±0.8 0.5±0.1 8.2±0.S 2S.5±0.8 lS.7±0.7 47.2±0.S 97.2±1.6 8 minutes 0.6±0.1 1.S±O.O 31.7±1.1 0.9±0.1 7.1±1.0 24.6±0.7 lS.6±0.9 4S.0±0.7 93.1±1.1 10 minutes 0.5±0.1 1.4±0.0 29.S±0.7 O.S±O.l 6.0±0.S 22.3±0.7 lS.6±0.6 41.9±0.6 86.4±1.3
At temp of 9S °c 2 minutes O.S±O.l 1.3±0.1 26.8±0.8 0.8±0.1 6.0±0.7 17.7±1.1 1O.3±0.3 24.9±1.1 S9.6±0.9 4 minutes 0.4±0.1 1.4±0.0 27.9±1.0 0.6±0.1 S.O±O.5 lS.2±1.0 10.1±0.9 29.6±1.0 60.5±1.6 6 minutes 0.7±0.1 1.4±0.1 30.1±0.7 0.9±0.1 9.0±0.1 27.3±1.0 13.1±0.7 33.6±1.0 83.9±0.8 8 minutes 0.7±0.1 1.S±O.l 31.1±0.7 1.1±0.2 17.2±0.5 30.7±1.4 lS.2±1.0 44.S±0.5 109±1.4 10 minutes 0.7±0.1 1.S±O.l 29.3±0.8 0.8±0.1 13.4±0.7 24.7±3.2 12.1±0.7 39.8±0.8 90.9±4.6
At temp of 90°C 2 minutes 0.5±0.1 1.2±0.1 2S.9±0.5 0.9±0.1 S.9±0.6 17.9±1.4 9.4±0.7 27.7±0.7 61.9±1.9 4 minutes 0.5±0.1 1.3±0.2 28.2±0.4 1.1±0.2 7.0±0.9 19.3±1.8 12.3±0.S 37.8±0.8 77.6±2.4 6 minutes 0.6±0.1 1.3±0.1 28.4±0.4 1.2±0.3 7.0±0.9 21.9tO.4 13.2tO.8 38.8±1.3 82.2±0.7
8 minutes 0.6±0.1 1.4±0.1 29.9tO.8 1.4±0.1 7.7±0.6 21.7±1.0 14.1±0.4 44.4t1.0 89.3tO.6 10 minutes 0.StO.1 1.4tO.1 29.2±0.6 1.1±0.2 7.St1.4 22.4tO.6 lS.1±0.9 43.5tO.8 89.6±l.S
At temp of 8S °c 2 minutes 0.3±0.1 1.2±0.3 21.6±1.7 1.2±1.0 S.3±1.6 17.6±0.4 12.4±4.8 2S.6±2.6 62.1tS.S 4 minutes 0.5±0.1 1.S±O.l 2S.9±1.8 2.2±0.4 S.8±0.6 24.1±0.S 17.6t6.2 3S.6±l.S 8S.3±7.1 6 minutes 0.4±0.1 1.4±0.2 26.4±0.5 1.6±0.4 S.6±0.3 22.6±0.2 19.5±6.S 36.S±1.7 8S.8±4.6 8 minutes 0.4±0.1 1.3±0.2 27.5±0.3 2.4±0.2 6.3±0.8 24.3±1.8 19.1±S.6 38.9±2.7 90.9±6.8 10 minutes 0.4±0.1 1.3±0.0 28.6±0.7 2.8±0.9 6.6±0.9 2S.3±1.3 20.7±6.6 39.2±3.8 94.6±4.9
At temp of 80°C 2 minutes 0.4tO.1 0.9±0.1 20.4tO.5 1.8±0.1 4.0±0.2 14.4±0.7 7.7±0.6 23.S±1.0 S1.St2.5 4 minutes 0.5±0.1 1.3±0.1 28.4±1.4 2.0±0.1 S.9±0.S 20.6±0.S 12.2tO.9 36.1±0.8 76.8±2.7 6 minutes 0.6±0.1 1.4±0.1 30.3tO.6 1.8±0.1 7.0±1.0 24.1±0.6 13.4±0.6 39.3±0.5 8S.7±2.4 8 minutes 0.6±0.1 1.4±0.1 29.2±0.S 2.1±0.1 7.1±0.9 24.0±0.8 13.S±0.6 41.S±1.3 88.2±3.7 10 minutes 0.5±0.1 1.3±0.1 26.2tO.7 1.7±0.1 6.3±1.1 21.3±0.6 1l.9±0.8 36.2±1.0 77.St3.4
[average concentration ±SD
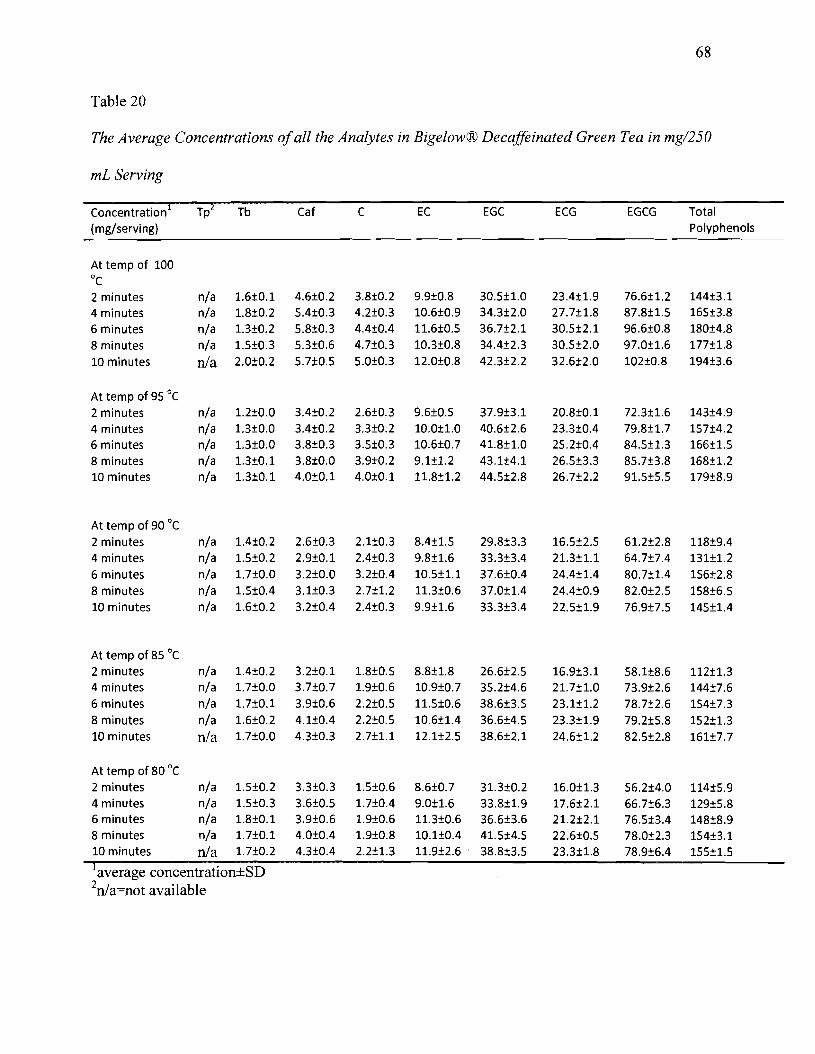
68
Table 20
The Average Concentrations ofall the Analytes in Bigelow® Decaffeinated Green Tea in mg/250
mL Serving
Concentration1 Tp2 Tb Caf C EC EGC ECG EGCG Total (mg/serving) Polyphenols
At temp of 100 °c 2 minutes n/a 1.6±0.1 4.6±0.2 3.8±0.2 9.9±0.8 30.S±LO 23A±1.9 76.6±1.2 144±3.1 4 minutes n/a L8±0.2 SA±O.3 4.2±0.3 10.6±0.9 34.3±2.0 27.7±L8 87.8±LS 16S±3.8 6 minutes n/a 1.3±0.2 S.8±0.3 4A±OA 1L6±0.S 36.7±2.1 30.S±2.1 96.6±0.8 180±4.8 8 minutes n/a LS±O.3 S.3±0.6 4.7±0.3 1O.3±0.8 34A±2.3 30.S±2.0 97.0±L6 177±L8 10 minutes n/a 2.0±0.2 S.7±0.S S.O±O.3 12.0±0.8 42.3±2.2 32.6±2.0 102±0.8 194±3.6
At temp of 9S °c 2 minutes n/a L2±0.0 3A±0.2 2.6±0.3 9.6±0.5 37.9±3.1 20.8±0.1 72.3±L6 143±4.9 4 minutes n/a L3±0.0 3.4±0.2 3.3±0.2 10.0±LO 40.6±2.6 23.3±OA 79.8±L7 157±4.2 6 minutes n/a L3±0.0 3.8±0.3 3.5±0.3 10.6±0.7 41.8±LO 25.2±0.4 84.5±1.3 166±1.5 8 minutes n/a L3±0.1 3.8±0.0 3.9±0.2 9.1±1.2 43.1±4.1 26.5±3.3 85.7±3.8 168±L2 10 minutes n/a L3±0.1 4.0±0.1 4.0±0.1 1L8±L2 44.5±2.8 26.7±2.2 9L5±5.5 179±8.9
At temp of 90°C 2 minutes n/a L4±0.2 2.6±0.3 2.1±0.3 8A±L5 29.8±3.3 16.S±2.5 61.2±2.8 118±9A 4 minutes n/a LS±0.2 2.9±0.1 2A±0.3 9.8±L6 33.3±3A 2L3±L1 64.7±7A 131±L2 6 minutes n/a L7±0.0 3.2±0.0 3.2±OA 10.5±U 37.6±OA 24A±L4 80.7±lA 156±2.8 8 minutes n/a L5±OA 3.1±0.3 2.7±L2 1L3±0.6 37.0±lA 24.4±0.9 82.0±2.5 158±6.5 10 minutes n/a L6±0.2 3.2±0.4 2A±0.3 9.9±L6 33.3±3.4 22.5±L9 76.9±7.S 145±lA
At temp of 85°C 2 minutes n/a L4±0.2 3.2±0.1 L8±0.5 8.8±L8 26.6±2.5 16.9±3.1 58.1±8.6 112±L3 4 minutes n/a L7±0.0 3.7±0.7 L9±0.6 10.9±0.7 35.2±4.6 2L7±LO 73.9±2.6 144±7.6 6 minutes n/a L7±0.1 3.9±0.6 2.2±0.S 1L5±0.6 38.6±3.5 23.1±1.2 78.7±2.6 154±7.3 8 minutes n/a L6±0.2 4.1±OA 2.2±0.S 10.6±L4 36.6±4.S 23.3±1.9 79.2±5.8 152±1.3 10 minutes n/a L7±0.0 4.3±0.3 2.7±L1 12.1±2.S 38.6±2.1 24.6±L2 82.S±2.8 161±7.7
At temp of 80°C 2 minutes n/a 1.5±0.2 3.3±0.3 L5±0.6 8.6±0.7 3L3±0.2 16.0±1.3 56.2±4.0 114±5.9 4 minutes n/a L5±0.3 3.6±0.5 L7±OA 9.0±1.6 33.8±L9 17.6±2.1 66.7±6.3 129±5.8 6 minutes n/a L8±0.1 3.9±0.6 L9±0.6 1L3±0.6 36.6±3.6 2L2±2.1 76.5±3A 148±8.9 8 minutes n/a L7±0.1 4.0±0.4 L9±0.8 10.1±0.4 4L5±4.5 22.6±0.5 78.0±2.3 154±3.1 10 minutes n/a L7±0.2 4.3±0.4 2.2±L3 1L9±2.6 . 38.8±3.S 23.3±L8 78.9±6A 155±LS
1average concentration±SD 2n/a=not available
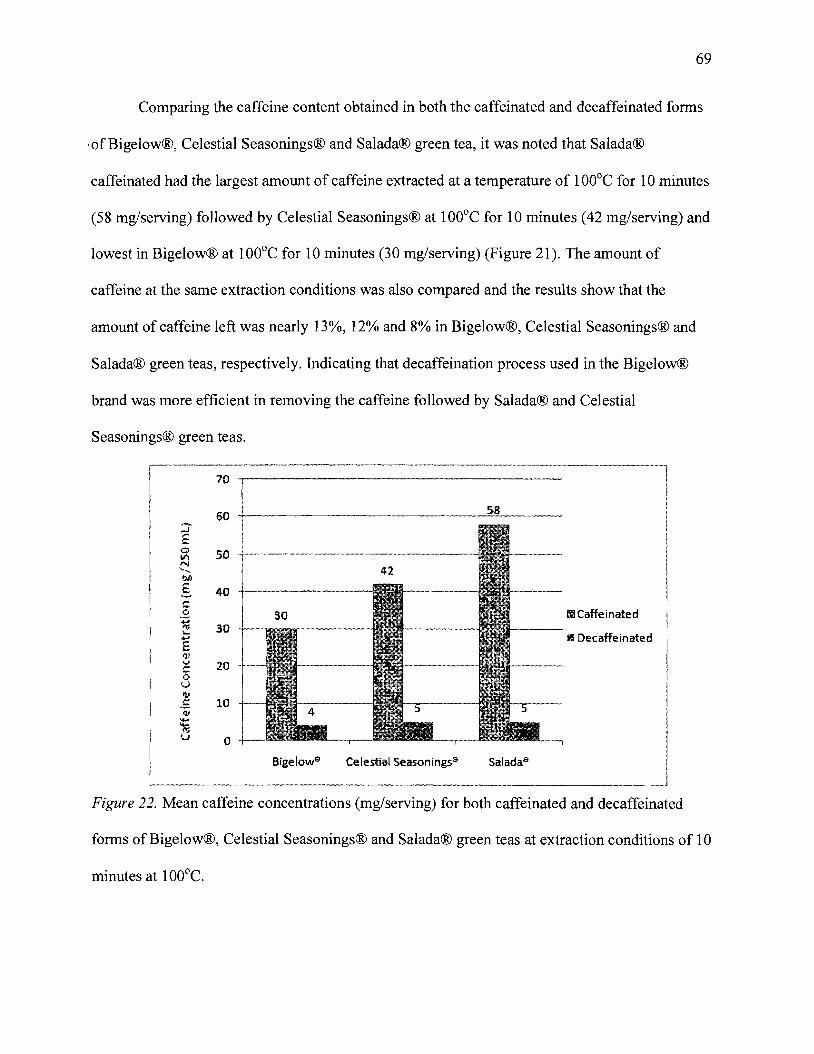
69
Comparing the caffeine content obtained in both the caffeinated and decaffeinated fonns
·ofBigelow®, Celestial Seasonings® and Salada® green tea, it was noted that Salada®
caffeinated had the largest amount of caffeine extracted at a temperature of 100°C for 10 minutes
(58 mg/serving) followed by Celestial Seasonings® at 100°C for 10 minutes (42 mg/serving) and
lowest in Bigelow® at 100°C for 10 minutes (30 mg/serving) (Figure 21). The amount of
caffeine at the same extraction conditions was also compared and the results show that the
amount of caffeine left was nearly 13%, 12% and 8% in Bigelow®, Celestial Seasonings® and
Salada® green teas, respectively. Indicating that decaffeination process used in the Bigelow®
brand was more efficient in removing the caffeine followed by Salada® and Celestial
Seasonings® green teas.
70 -,--------------------.
t'l Decaffeinated
Il'il Caffe inated
o
:r E 0 5011\ N""'-...., til)
E 40 c .2... ro 30....... E 'lJ vc: 0 u
60 +--------.----..--------='------
10
Bigelowe Celestial Seasoningss
Figure 22. Mean caffeine concentrations (mg/serving) for both caffeinated and decaffeinated
fonns of Bigelow®, Celestial Seasonings® and Salada® green teas at extraction conditions of 10
minutes at 100°C.
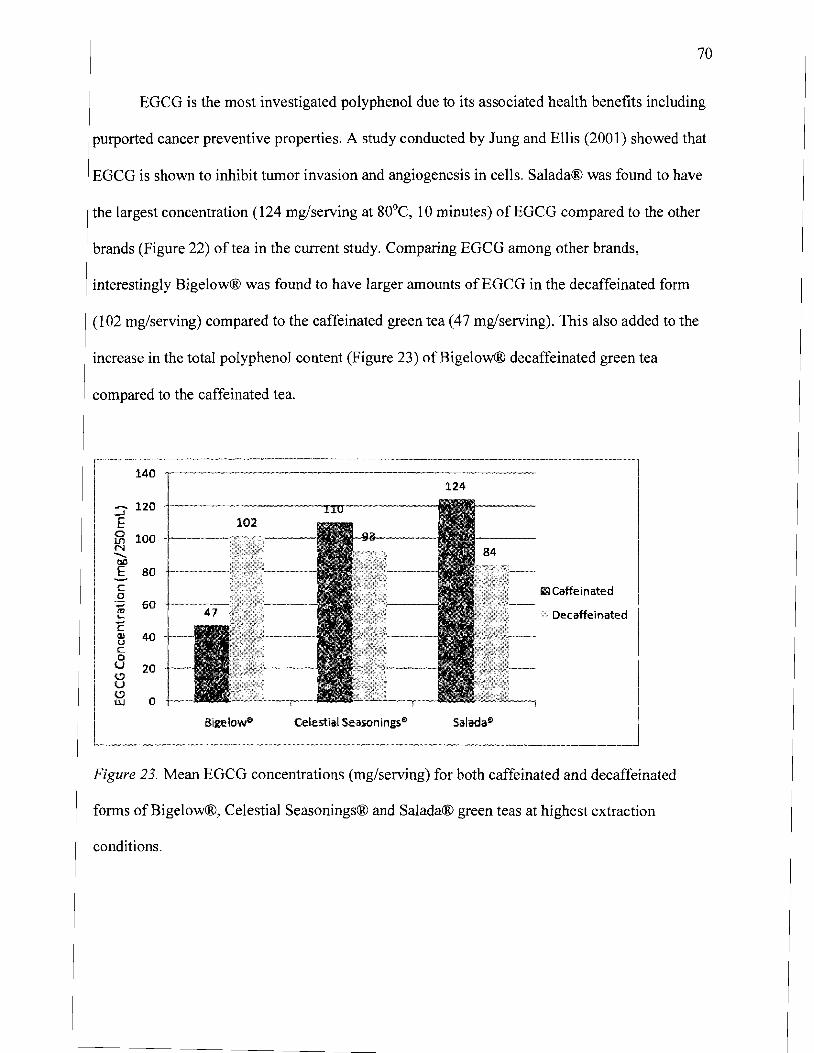
--
70
EGCG is the most investigated polyphenol due to its associated health benefits including
purported cancer preventive properties. A study conducted by lung and Ellis (2001) showed that
EGCG is shown to inhibit tumor invasion and angiogenesis in cells. Salada® was found to have
the largest concentration (124 mg/serving at 80°C, 10 minutes) ofEGCG compared to the other
brands (Figure 22) of tea in the current study. Comparing EGCG among other brands,
interestingly Bigelow® was found to have larger amounts of EGCG in the decaffeinated form
(102 mg/serving) compared to the caffeinated green tea (47 mg/serving). This also added to the
increase in the total polyphenol content (Figure 23) of Bigelow® decaffeinated green tea
compared to the caffeinated tea.
140 124
:J' 120
E ffi 100 N
~
E 80 c
Celestial5easoningss
Ii] caffeinated0 +-' 60 ro L-. Decaffeinated +-'C Qj u 40 c 0 u 20 {,:;l u {,:;l UJ 0
Figure 23. Mean EGCG concentrations (mg/serving) for both caffeinated and decaffeinated
forms of Bigelow®, Celestial Seasonings® and Salada® green teas at highest extraction
conditions.
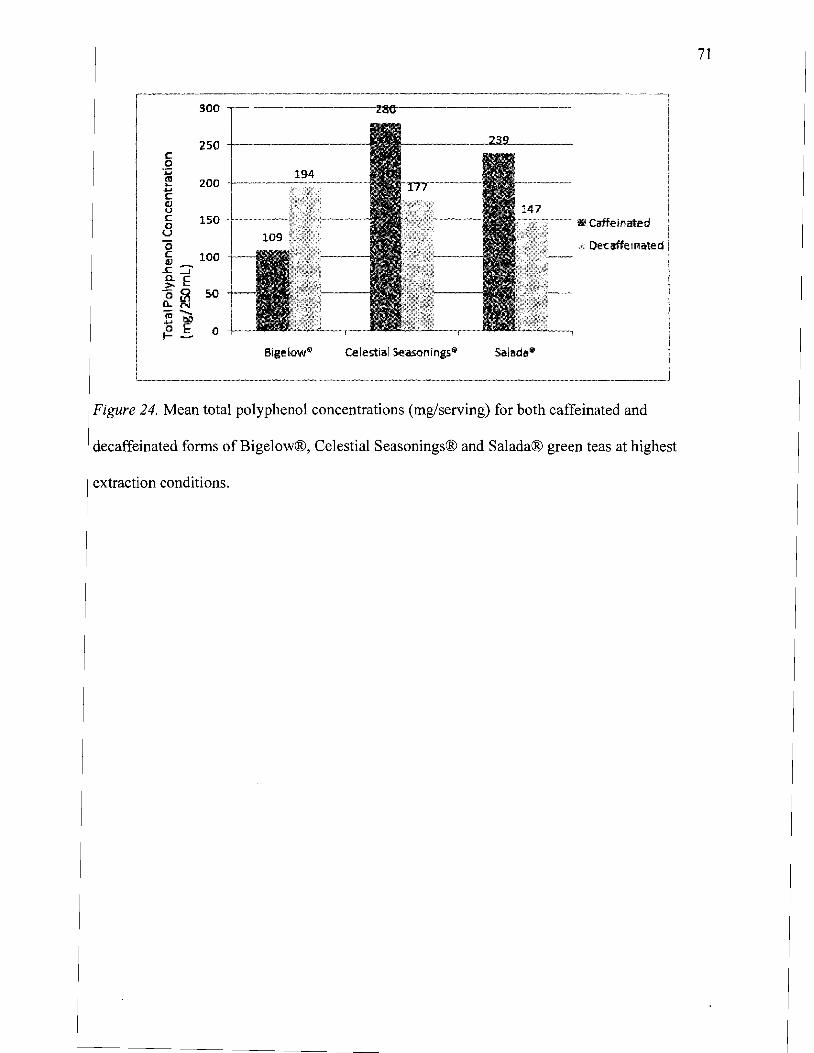
71
c o ..... fD.... ..... C (IJ u C --;--c=-~ m Caffeinated o u
Decaffeinated"0 c 100 ~::Jo..E 2!:-0 o 1Il 50 o..N lii"bi;"0 E a1-
Celestial5easoningse
Figure 24. Mean total polyphenol concentrations (mg/serving) for both caffeinated and
decaffeinated forms of Bigelow®, Celestial Seasonings® and Salada® green teas at highest
extraction conditions.

72
Chapter V: Conclusion
The purpose of the study was to identify and quantify polyphenols and methylxanthines
in three brands of green tea (Bigelow®, Salada® and Celestial Seasonings®) in both caffeinated
and decaffeinated types at different extraction time and temperature conditions. The polyphenols
and methylxanthines were analyzed by HPLC. All the concentrations were calculated in
milligrams per 250 mL serving for analyzing amount ofcompounds per one cup of green tea for
each bag. The analysis was carried out in triplicate for all the extraction conditions for each type
of green tea analyzed. It is known that green tea has health benefits due to the antioxidant
properties of the compounds in it.
Overall, polyphenols increased with increasing extraction temperature at constant time
and decreased with decrease in temperature. This was observed for the all brands of green teas
tested. Interestingly, Bigelow® decaffeinated showed larger amounts ofEGCG and total
polyphenols compared to the caffeinated form which was not seen in other two brands (Salada®
and Celestial Seasonings®). All the brands used the same method of decaffeination for removal
of caffeine. The mass of tea leaves per bag was found to be higher in caffeinated forms compared
to the decaffeinated forms. Salada® caffeinated green tea has more concentrations of caffeine
then followed by Celestial Seasonings® and then by Bigelow®. The higher amount of tea leaves
in Salada® might be one of the reasons for it. Overall, the largest concentration of total
polyphenols was observed in Celestial Seasonings® followed by Salada® and lowest in
Bigelow® green tea.
This study was also aimed to identify and quantify the amount of polyphenols and
methylxanthines at different extraction times of 1 hour through 24 hours at room temperature.

73
The concentrations of polyphenols tended to increase until 7 hours of extraction time and then
decreased after 24 hours had elapsed. The concentrations of caffeine remained almost constant.
This study determined that larger concentrations of beneficial polyphenols are found in
tea brewed for long periods oftime (10 minutes) at higher temperatures (lOO°C). When steeping
tea bags in room temperature water, it could be beneficial to steep until 7 hours and then
refrigerate the tea. The decrease in concentrations after this time might be due to the oxidation of
polyphenols after longer exposure to air. It is also very interesting that in Celestial Seasonings®,
the concentrations of EGCG after 24 hours did not decrease while the decrease after 24 hours
was observed in other brands. The presence of vitamin C which may protect EGCG from
oxidation might be the reason for this. Research on the presence or absence of vitamin C and its
role in protecting polyphenols from oxidation could help resolve this question.
If decaffeinated teas are to be chosen, then Bigelow® provides greater polyphenol
concentrations. This study shows that consumers can enjoy health benefits of green tea even
steeping for long periods of time at room temperature. Based on this research further steps are
recommended to learn more about the polyphenols and their availability.
Recommendations
The following steps are recommended for further research
1. Conduct sensory evaluation of the tea brewed at different extraction conditions
2. Identify and quantify polyphenol content of green tea at each hour interval for 24
hours to observe at what time point the polyphenols tend to decrease.
3. Identify and quantify polyphenols I methylxanthines in food products that add
green tea extracts.

74
4. Identify and quantify polyphenols when green tea leaves are heated in water to
100°C and then cooled over periods of time.
5. Determine the effect of different decaffeination processes on the polyphenols of
green tea.
6. Determine the effect of extraction parameters on polyphenols of other teas like
white tea/black tea/ oolong teas.

75
References
An, B., Kwak, J., Son, J., Park, J., Lee, J., Jo, C. et al. (2004). Biological and anti-microbial
activity of irradiated green tea polyphenols. Food Chemistry, 88, 549-555.
Andao. (n.d). Retrieved January 15,2008, from
http://www.andaotea.comlandaopamphlet.pdf
Bonoli, M., Pelillo, M., Gallina Toschi, T., & Lecker, G. (2003). Analysis of green tea catechins:
Comparative study between HPLC and HPCE. Food Chemistry, 81,631-638.
Borrelli, F., Capasso, R, Russo, A., & Ernst, E. (2004). Systematic review: Green tea and
gastrointestinal cancer risk. Amimnet Pharmacol Ther, 19,497-510.
Bushman, J. L. (1998). Green tea and cancer in humans: A review ofthe literature. Nutrition and
Cancer, 31(3), 151-159.
Celestial Seasonings® caffeine free tea. (n.d). Retrieved January 18, 2008, from
http://www.vitacost.comlcelestialseasonings.html
Chen, H., Zhang, M., & Xie, B. (2005). Components and antioxidant activity of polysaccharide
conjugate from green tea. Food Chemistry, 90, 17-21.
Chen, x., & Anderson, J. J. B. (2002). Isoflavones and bone: Animal and human evidence of
efficacy. J Musculoskel Neuron Interact, 2(4), 352-359.
Chiu, S. (2006). Is green tea good for you? Journal ofFood Science Education, 5, 70-71.
Copeland, E. L., Clifford, M. N., & Williams, C. M. (1998). Preparation of (-)epigallocatechin
gallate from commercial green tea by caffeine precipitation and solvent partition. Food
Chemistry, 61, 81-87.
Dreosti, I. E. (n.d.). Bioactive ingredients: Antioxidants and polyphenols in tea. Nutrition
Reviews, 54(11),51-58.

76
Ferruzzi, M. G., & Green, R. J. (2006). Analysis of catechins from milk-tea beverages by
enzyme assisted extraction followed by high performance liquid chromatography. Food
Chemistry, 99, 484-491.
Friedman, M., Kim, S. Y., Lee, S. J., Han, G. P., Han, J. S., Lee, K. Ret al. (2005). Distribution
of catechins, theaflavins, caffeine, and theobromine in 77 teas consumed in the United
States. Journal ofFood Science, 70(9), 550-559.
Friedman, M., Levin, C. L., Choi, S. H., ~ozukue, E., & Kozukue, N. (2006). HPLC analysis of
catechins, theaflavins, and alkaloids in commercial teas and green tea dietary
supplements: Comparison of water and 80% ethanol/water extracts. Journal ofFood
Science, 71(6),328-337.
Fujiki, H., Suganuma, M., Okabe, S., Sueoka, N., Komori, A., Sueoka, E. et al. (1997). Cancer
inhibition by green tea. Mutation Research, 402, 307-310.
Fujiki, H., Suganuma, M., Matsuyama, S., & Miyazaki, K. (2005). Cancer prevention with green
tea polyphenols for the general population and for patients following cancer treatment.
Current Cancer Therapy Reviews, 1, 109-114.
Ito, R, Yamamoto, A, Kodama, S., Kato, K., Yoshimura, Y., & Matsunga, A (2003). A study
on the change of enantiomeric purity of catechins in green tea infusion. Food Chemistry,
83, 563-568.
Jung, Y. D., & Ellis, L. M. (2001). Inhibitions of tumor invation and angiogenesis by
epigallocatechin-gallate (EGCG), a major component of green tea. International Journal
ofExperimental Pathology, 82, 309-316.

77
Kai, O. c., Chi, C. W., Michael, S. R, Kwong ,W. c., & Chi, P. P. (2004). Determination of
catechins and catechin gallates in biological fluids by HPLC with coulometric array
detection and solid phase extraction. Analytical Chemical Acta, 510, 69-76.
Kasper, K. (2006).1dentijication and quantijication offlavanols and methylxanthines in
chocolates with difftrent percentages ofchocolate liquor. Menomonie, WI: University of
Wisconsin-Stout.
Lee, S., Park, M. K., Kim, K. H., & Kim, Y. S. (2007). Effect of supercritical carbon dioxide
decaffeination on volatile components of green teas. Journal ofFood Science, 72(7),497
502.
Li, H., Yashiki, S., Sonoda, J., Lou, H., Ghosh, S. K., Byrnes, J. J. et al (2000). Green tea
polyphenols induce apoptosis in vitro IN peripheral blood T lymphocytes of adult T-cell
leukemia patients. Jpn. J Cancer Res., 91, 34-40.
Li, 1., & Jiang, Y. (2007). Litchi flavonoids: Isolation, identification and bilogical activity.
Molecules, 12,745-758.
Liang, H, Liang, Y., Dong, J., Lu, J., Xu, H, & Wang, H (2007). Decaffeination offreash green
tea leaf (Camellia sinenis) by hot water treatment. Food Chemistry, 101, 1451-1456.
Majchrzak, D., Mitter, S., & Elmadfa, L (2004). The effect of ascorbic acid on total antioxidant
activity of black and green teas. Food Chemistry, 88, 447-451.
Mandel, S., Weinreb, 0., Amit, T., Youdim, M. B. H (2004). Cell signaling pathways in the
neuroprotective actions of green tea polyphenol (-) - epigallocatechin-3-gallate:
implications for neurodegerative diseases. Journal ofNeurochemistry, 88, 1555-1569.
Methylxanthines. (n.d). Retrieved January 15,2008, from
http://www.biology-online.org/dictionary/Methylxanthines

78
Murakami, M., Yamaguchi, T., & Matora, T. (2003). Effects of Ascorbic Acid and a-Tocopherol
on Antioxidant Activity of Polyphenolic Compounds. Journal o/Food Science, 68(5),
1622-1625.
Nakachi, K., Suemasu, K., Suga, K., Takeo, T., Imai, K., & Higashi, Y. (1998). Influence of
drinking green tea on breast cancer malignancy among Japanese patients. Jpn. J Cancer
Res., 89, 254-261.
New cancer research. (n.d). Retrieved January 15, 2008, from
http://www.newcancerresearch.com/Website_05022001.pdf
Okabe, S., Suganuma, M., Hayashi, M., Sueoka, E., Komori, A, & Fujiki, H. (1997).
Mechanisms of growth inhibition of humans lung cancer cell line, PC-9, by tea
polyphenols. Jpn. J Cancer Res, 88, 639-643.
Okabe, S., Ochiai, Y, Aida, M., Park, K., Kim, S., Nomura, T et al. (1999). Mechanistic aspects
of green tea as a cancer preventive: Effect of components on human stomach cancer cell
lines. Jpn. J Cancer Res, 90, 733-739.
Pelillio, M., Biguzzi, B., Bendini, A, Gallina Toschi, T, Vanzizni, M., & Lecker, G. (2002).
Preliminary investigation into development of HPLC with UV and MS-electrospray
detection for the analysis of tea catechins. Food Chemistry, 78,369-374.
Pelillio, M., Biguzzi, B., Bendini, A, Gallina Toschi, T, Vanzizni, M., & Lecker, G. (2004). An
investigation in the use of HPLC with UV and MS-electrospray detection for the
quantification of tea catechins. Food Chemistry, 87, 465- 470.
Perva-Uzunalic, A, Skerget, M., Knez, Z., Weinreich, B., Otto, F., & Gruner, S. (2006).
Extraction of active ingredients from green tea (Camellia sinensis): Extraction efficiency
of major catechins and caffeine. Food Chemistry, 96, 597-605.

79
Record, I. R., & Lane, J. M. (2001). Simulated intestinal digestion of green and black teas. Food
Chemistry, 73,481-486.
Reznichenko, L., Amit, T., Youdim, M. B. H., & Mandel, S. (2005). Green tea polyphenol
(-)-epigallocatechin-3-gallate induces neurorescue of long-term serum-deprived PC12
cells and promotes neurite outgrowth. Journal ofNeurochemistry, 93, 1157-1167.
Seok Park, H., Jin Lee, H., Hye Shin, M., Won, K., Lee, H., Kim, Y. et al. (2007). Effects of
cosolvents on the decaffeination of green tea by supercritical carbon dioxide. Food
Chemistry, 105, 1011-1017.
Sharma, V., Gulati, A., & Ravindranath, S. D. (2006). Extractability of tea catechins as a
function of maufacture procedure and temperature of infusion. Food Chemistry, 93, 141
148.
Silvia, M., Orly, W., Tamar, A., & Moussa B. H. Y. (2004). Cell signaling pathways in the
neuroprotective actions of the green tea polyphenol (-)-epigallocatechin-3-gallate:
implications forneurodegenerative diseases. Journal ofNeurochemistry, 88,1555-1569.
Suminori, K. (1992). Green tea and colon cancer. Jpn. J Cancer Res, 83,669.
Tea processing. (n.d). Retrieved September 29,2007, from
http://www.enjoyingtea.com/teaprocessing1.html
Theivendran, S., Hettiarachchy, N. S., & Johnson, M. G. (2006). Inhibition oflisteria
monocytogenes by nisin combined with grape seed extract or green tea extract in soy
protein film coated on turkey frankfurters. Journal ofFood Science, 71 (2), 39-44.
Wang, H., & Helliwell, K. (2000). Epimerization of catechins in green tea infusions. Food
Chemistry, 70, 337-344.

80
Wang, H., Helliwell, K., & You, X. (2000). Isocratic elution system for the determination of
catechins, caffeine and gallic acid in green tea using HPLC. Food Chemistry, 68, 115
121.
Weisburger, J. H. (1996). Tea antioxidants and health. In E. Andenas & L.Packer (Eds.),
Handbook ofantioxidants (pp. 469-471). New York, NY: Marcel Dekker, Inc.
Xin, W., Shi, H., Zhao, B., & Hou, J. (1995). Studies on green tea po1yphenol's antioxidative and
protective effects on biomembranes. A.S.H. Ong, E. Niki, L. Packer (Eds), Nutrition,
Lipids, Health, and Disease (pp. 67). Chapaign, IL: AOCS Press.
Yang, X. R., Ye, C. x., Xu, 1. K., & Jiang, Y. M. (2007). Simultaneous analysis of purine
alkaloids and catechins in Camellia sinensis, Camellia ptilophylla and Camellis assamica
var. kucha by HPLC. Food Chemistry, JOO, 1132-1136.
Yoshida, Y., Kiso, M., & Goto, T. (1999). Efficiency of the extraction of catechins from green
tea. Food Chemistry, 67, 429-433.
Yusuf, N., Irby, C., Katiyar, S. K., & Elmets, C. A. (2007). Photoprotective effects of green tea
polypheno1s. Photodermatol Photoimmunol Photomed, 23, 48-56.

81
Appendix A: Catechin (C) Standard Curve
20
1.5
.() <D U1
> :::l.
IJ) <J) L
<{ 10 c 1: () <J)
ro u
0.5
Catechin Standard Curve
~=----"--------j
•
Fit for Data Set I Catechin )\,rea y =Ax A 0006211 +/- 9097E-005 RMSE 0.01876
o.O-t""'--...,.--...,.--.,.--.,.--.,.--.,.--,--,.---r--.,.--,..----,..----,.---,.---,.----.---,,-----,
o 50 100 150 Catechin Concentration (m /L

82
Appendix B: Epicatechin (EC) Standard Curve
3
2
(J) .o(f)> :::J.
(I)
~ q: u w
EC Standard Curve
Fit for Data Set I EC Area V= Ax A: 0.006588 +/- 4.145E-005 RMSE: 0.02022
Ol---r:::-,...---.--.,--,..--,.--,.--,.--,...--r--r--.,,----.,----,---r---r--.,.--.,.-......,..-......., a 100 200 300
(813, 2809) fSI. 0.4 M 0000 EC Corii:entmtl,jn (m Il)
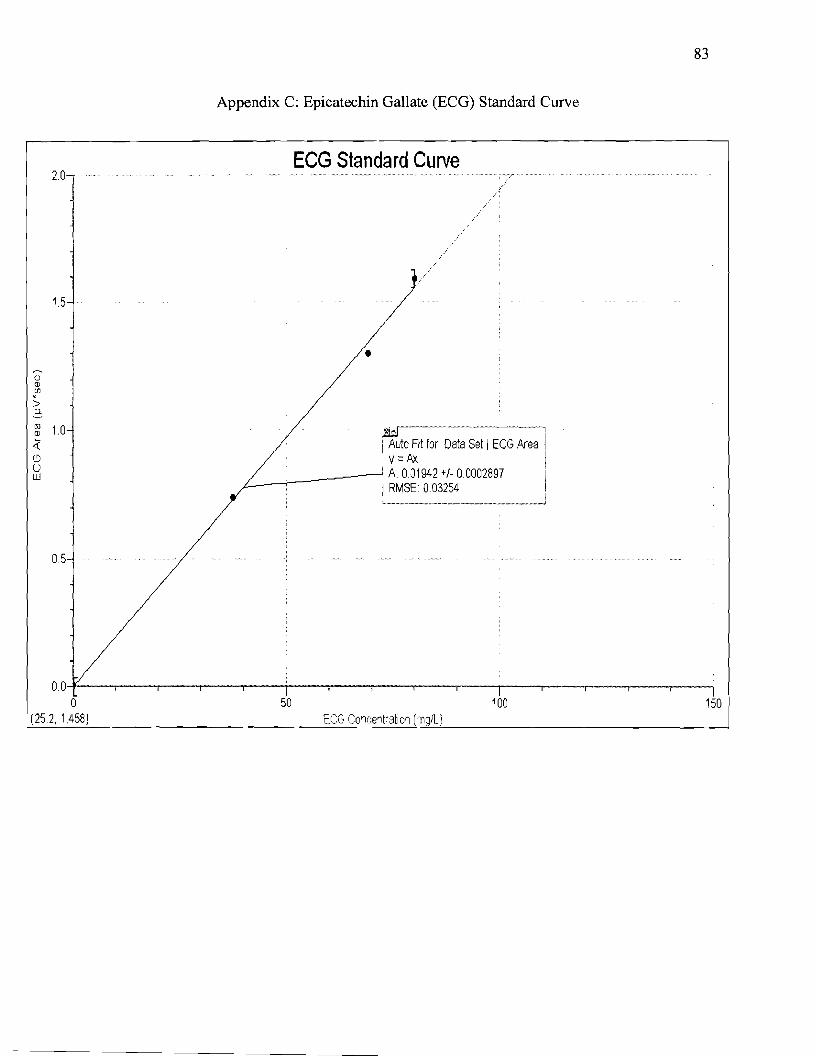
83
Appendix C: Epicatechin Gallate (ECG) Standard Curve
ECG Standard Curve 2.0
1.5
• ~
() (])
•(J)
> ::I.
!Zf --- I .'i: ~ 1.0
I~~o:/ for Data Set IECG Area 1 o u lL.__-----i A: 0.01942 +/- 0.0002897 i
RMSE: 003254 iw
\"'•••__._••••~_._••"' M__•••_.~.,~ ., _ ..J
0.5
OO-+----r----r---r---,----r--__,r--,--....,.---,.--,..---,----,-----,--..,----,
o 50 100 150 (252, 1458) ECG Concentration (mg/L)
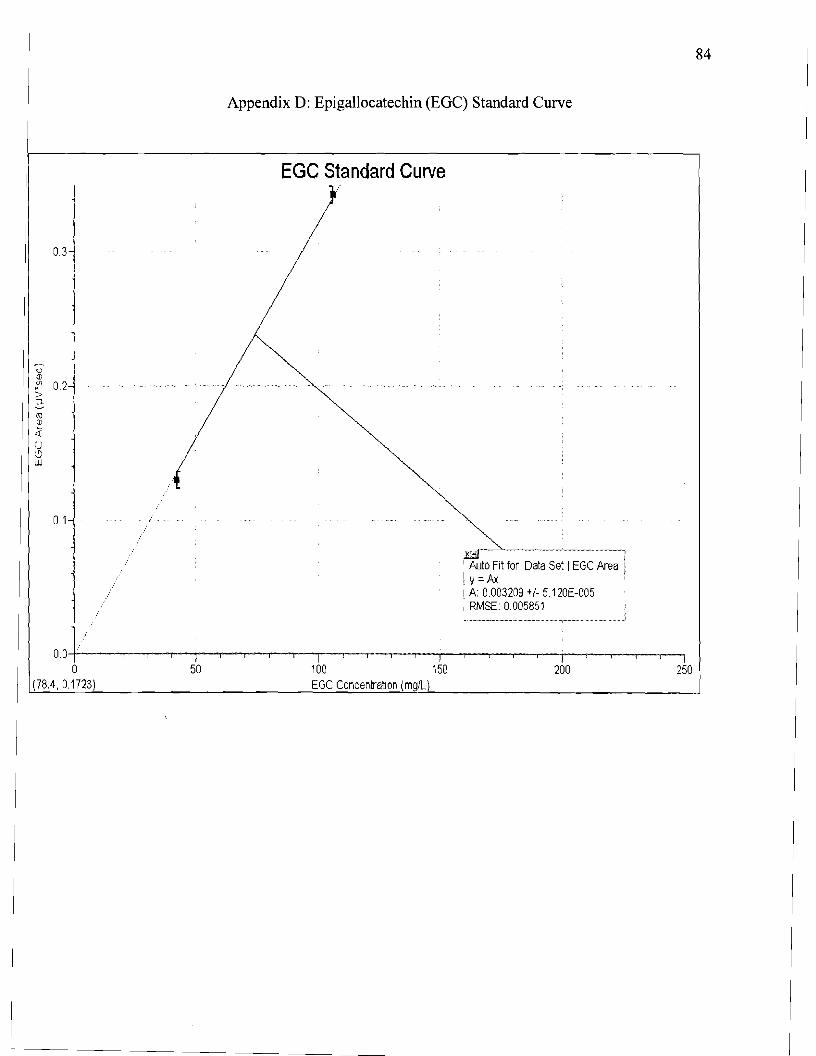
84
Appendix D: Epigallocatechin (EGC) Standard Curve
EGC Standard Curve
03
o <1)
:f 0.2 > :l
(IJ Gl
4:. ()(..9 W
01
)(i,,·r---"--------'-----·--,
AJJto Fit for Data Set I EGC Area y = Ax A 0.003209 +/- 5120E-005 RMSE: 0.005851
oO-t---,--,-....,.....--,--,---.,...-,....--....,.....--,--,---.,--,....----,---,--,---.,...-r-----r----,---i---r--r-----r----,-----,
o 50 100 150 200 250 (78.4,01723) EGC Concentration (mgfL

85
Appendix E: Epigallocatechin Gallate (EGCG) Standard Curve
5
4
. ~ 3 U)
> ::J.
OJ
1( <.') u 3 2
EGCG Standard Curve
,r-~--~_~-l Auto Fit for Data Set I EGCG Area V =Ax A: 0.01625 +/- 0.0002119 RMSE 0.07063
O+--,----,----,----,----,---.---.----.--....,----r----r---.---....,.--....,-----,Ir------,.---r---,.---,.----;I o 100 200 300 400
ECGC Concentration rf19I~L"--- ---.J
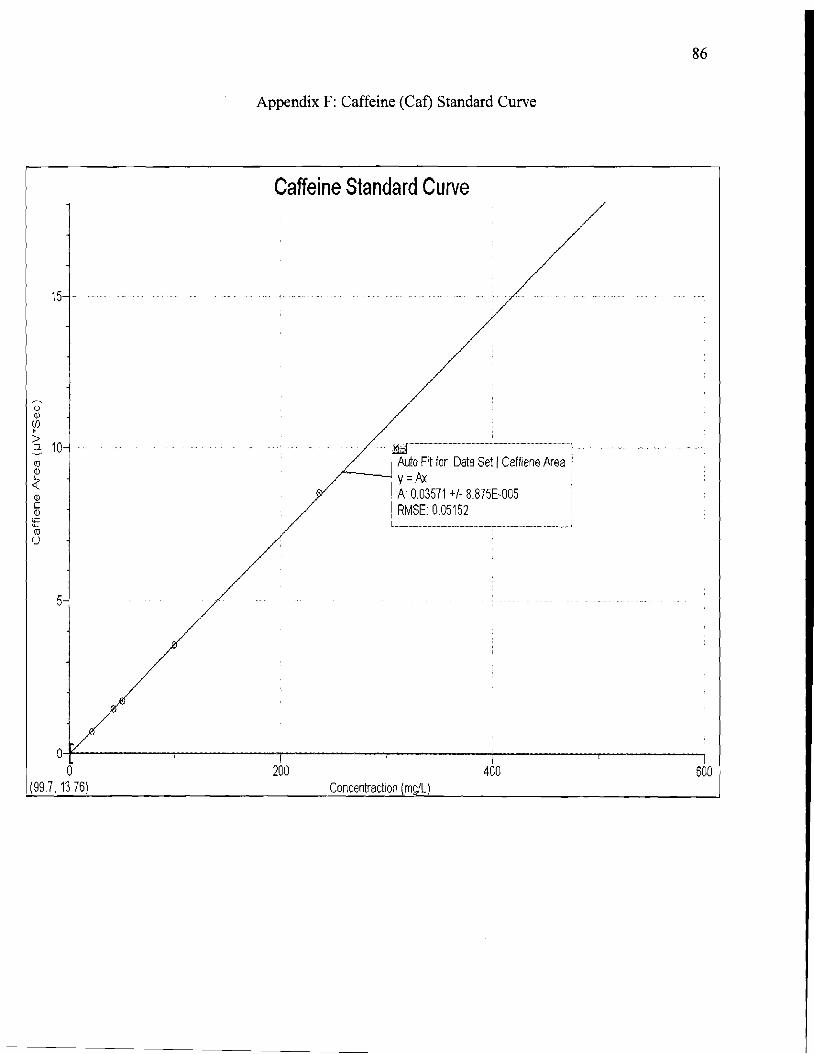
86
Appendix F: Caffeine (Cat) Standard Curve
Caffeine Standard Curve
Q) L
<f (J) c Q)
""" (IJ
0
5
<) (J) (f)•>
10-i::::l. I
(IJ ! Atfr.o Fit for Data Set ICaffiene Area r--__I y=AJ,
A: 0.03571 +1- 8.875E-005 RMSE: 0.05152
O+------r-----..,-------,------"!""-------,...-------, o 200 400 600
(997, 1376) Concentraction (m ILl

87
Appendix G: Theobromine (Tb) Standard Curve
Theobromine Standard Curve 5
4
() Q) (J]
" 3:J. >
J(\J Q)
«L
(J) c E 0 L
.D 0 2Q)
.c I
.5(.";
Auto Fit for Data Set ITheobromine Area V=Ax A: 0.03626 +/- 0.0003800 RMSE: 0.04772
O*----'j----r-----'j----r----r----.....,----,..----,----,------, o 20 40 60 80 100
(2052, 2811) Theobi'oiTtine Concentration (mg/L)

88
Appendix H: Theophylline (Tp) Standard Curve
Thephylline Standard Curve o
15
0 (])
•U1.~
,/
:::l.
(IJ 10 cD
q:L
Q) c >, .r: 00 Q) .r: I-
Auto Fit for Data Set ITheophylline Area i y=Ax
A: 0.04150 +1- 0.00047175 RMSE: 0.05813
O-t--------,.-------r------,-------+------r------j o 200 400 600
(177.3,12.22) Theophylline Concentartion (mg/L)