effect of energy expenditure on postprandial triacylglycerol in adolescent boys
TRANSCRIPT

ORIGINAL ARTICLE
Effect of energy expenditure on postprandial triacylglycerolin adolescent boys
Keith Tolfrey • Conor Bentley • Mary Goad •
Joanna Varley • Sebastian Willis • Laura Barrett
Received: 21 December 2010 / Accepted: 18 March 2011 / Published online: 6 April 2011
� Springer-Verlag 2011
Abstract This study examined the effects of 30 and
60 min of moderate intensity exercise on postprandial
triacylglycerol concentration [TAG] in 11 healthy, 13-year-
old boys. The boys completed three counterbalanced
conditions. On day 1, they either rested (CON), or jogged
for 30 min (EX30) or 60 min (EX60) at 55% peak _VO2:
Following a 12-h fast, on day 2 a capillary blood sample
was taken for fasting [TAG] before a high fat milkshake
was consumed. Further blood samples were taken every
hour over a 6-h postprandial rest period for [TAG]. The
estimated energy expenditure for EX30 (982 kJ) was
doubled in EX60 (1967 kJ). Differences in fasting [TAG]
between the conditions were small (ES = 0.23, P = 0.35).
Differences in postprandial TAG over time between
conditions were identified (ES = 0.41, P = 0.03). Mean
[TAG] was lower in EX60 than CON (-33 to -3%,
P = 0.03) with a similar strong trend for EX30 (-29 to
1%, P = 0.06); EX60 and EX30 were not different from
each other (-21 to 14%, P = 0.62). The total area under
the [TAG] versus time curve was different between con-
ditions (ES = 0.42, P = 0.03). Again, EX60 was lower
than CON (-31 to -2%, P = 0.02) with a strong trend for
EX30 (-31 to 4%, P = 0.06); EX30 and EX60 were not
different from each other (-17 to 16%, P = 0.58). This
study shows for the first time that both 30 and 60 min of
jogging, with energy expenditures equivalent to 982 and
1,967 kJ, attenuates postprandial [TAG] in adolescent
boys, but not in a dose-dependent manner.
Keywords TAG � Intermittent exercise � 30 min � PPL
Introduction
The evidence supporting the paediatric origins of athero-
sclerosis are compelling (Malcom et al. 2009) and
long-standing (Zeek 1930). This has prompted calls for
preventive steps to be taken during childhood (Froberg and
Andersen 2005). Postprandial plasma triacylglycerol con-
centration ([TAG]) has a strong independent relationship
with cardiovascular events in adult population studies
(Bansal et al. 2007; Nordestgaard et al. 2007; Sarwar et al.
2010). In contrast, similar independent associations with
fasting [TAG] have not been reported so consistently
(Sarwar et al. 2007), highlighting the importance of the
postprandial period. There is a dearth of research on the
postprandial lipaemic response to exercise in young people.
Consequently, the identification of effective intervention
strategies to reduce postprandial [TAG] in young people is
critical.
Several reviews of studies with adults have indicated that
aerobic exercise-induced energy expenditure (EE) reduces
postprandial [TAG] (Hardman 1998; Petitt and Cureton
2003; Katsanos 2006). Two recent separate studies with
lean and obese adults, respectively, found that exercise EE
of only 1.10 and 0.87 MJ (*262 and 208 kcal) were
required to reduce [TAG] significantly compared with a
non-exercise control condition (Miyashita et al. 2008;
Miyashita 2008). Moreover, the efficacy was achieved
equally by accumulation or continuous exercise EE models.
In stark contrast, similarly designed exercise interventions
Communicated by Klaas R Westerterp.
K. Tolfrey (&) � C. Bentley � M. Goad � J. Varley �S. Willis � L. Barrett
Paediatric Exercise Science Research Group, School of Sport,
Exercise and Health Sciences, Loughborough University,
Loughborough, Leicestershire LE11 3TU, UK
e-mail: [email protected]
123
Eur J Appl Physiol (2012) 112:23–31
DOI 10.1007/s00421-011-1936-x
have been restricted to only three studies with adolescents
boys as far as we are aware (Barrett et al. 2007; Tolfrey
et al. 2008; MacEneaney et al. 2009). Each of these studies
reported attenuated postprandial [TAG] following the
exercise interventions. The minimum estimated exercise EE
across the conditions used in these studies was *1.5 MJ
(*366 kcal; Tolfrey et al. 2008). The overweight, late-
adolescent boys in the MacEneaney et al. (2009) study
experienced a similar reduction (*20%) in postprandial
[TAG] as normal weight boys.
Previously, we compared 60-min bouts of moderate and
vigorous intensity intermittent exercise, but did not identify
a dose-dependent effect with both bouts leading to similar
reductions (*22%) compared with a non-exercise control
(Tolfrey et al. 2008). We chose 60 min of exercise because
international guidelines for recommended daily physical
activity for adolescents tend to range from 60 to 90 min,
depending on the participant characteristics and country of
origin (e.g. Department of Health, Physical Activity,
Health Improvement and Prevention 2004; Janssen and
LeBlanc 2010). In light of previous findings, the purpose of
the current study was to reduce the exercise time to only
30 min in an attempt to identify the lowest dose of mod-
erate exercise intensity EE that could still reduce post-
prandial [TAG] in healthy, though not endurance trained,
adolescent boys. This reduction in exercise time represents
a significant and important advance in research with young
people in this area.
Methods
Participants
Eleven adolescent boys volunteered for this study after
giving their written assent; written informed consent was
also provided by a parent for each boy. The university
ethical advisory committee approved all of the study pro-
cedures. A general health questionnaire showed that they
were all in good health, not taking any substances known to
influence fat or carbohydrate metabolism, and physically
active through participation in sports, but not engaged in
specific endurance training. Baseline participant charac-
teristics are shown in Table 1.
Anthropometry and physical maturation
Body mass (Seca, Hamburg, Germany) and stature (Holtain,
Crosswell, UK) were measured with the boys wearing run-
ning shorts, socks, and T-shirt. Triceps and subscapular
skinfold thickness was measured using Harpenden callipers
(John Bull, St. Albans, UK) on the right hand side of the
body with the median of three measurements calculated as
the fold thickness. Triceps and subscapular skinfold thick-
nesses were used to estimate percent body fat (BF%) using
maturation, race, and sex-specific equations (Slaughter et al.
1988). A self-assessment of secondary sexual characteristics
by the boys was used to estimate physical maturity. The
boys used drawings of the five stages of genitalia and pubic
hair development to provide this information (Morris and
Udry 1980). The parents were asked to assist the boys with
this assessment by (1) discussing the schematic illustrations
with them, and (2) comparing their son’s genital and pubic
hair development with the schematics and accompanying
written descriptions.
Preliminary exercise measurements
Before the main trials, the boys were habituated to exercise
on the treadmill (Technogym Runrace, Gambettola, Italy)
set at 1% gradient. Next, 4 3 4 min incremental exercise
stages were used to identify the steady-state relationship
between treadmill speed, oxygen uptake ( _VO2), and heart
rate. The starting speed was 6.5 with 0.5 km h-1 incre-
ments up to 8.0 km h-1. Heart rate (HR) was monitored
continuously via radio telemetry (Polar PE4000, Kempele,
Finland) whenever the boys exercised on the treadmill, and
ratings of perceived exertion (RPE) were measured using
the 6–20 scale (Borg 1974) in the final 15 s of each exer-
cise bout. Expired gas samples were collected into 100-L
Douglas bags (Cranlea and Company, Birmingham, UK)
during the final minute of each progressive bout. Oxygen
and carbon dioxide concentrations in each Douglas bag
were analysed using a paramagnetic oxygen analyser and
an infrared carbon dioxide analyser (Servomex 1400,
Sussex, UK) calibrated against gases of known concen-
tration before and after each series of four bags. The vol-
ume of expired gas was determined using a dry gas meter
(Harvard, Kent, UK). For each sample, oxygen uptake
( _VO2), expired carbon dioxide ( _VCO2), minute ventilation
( _VE), and respiratory exchange ratio were calculated. These
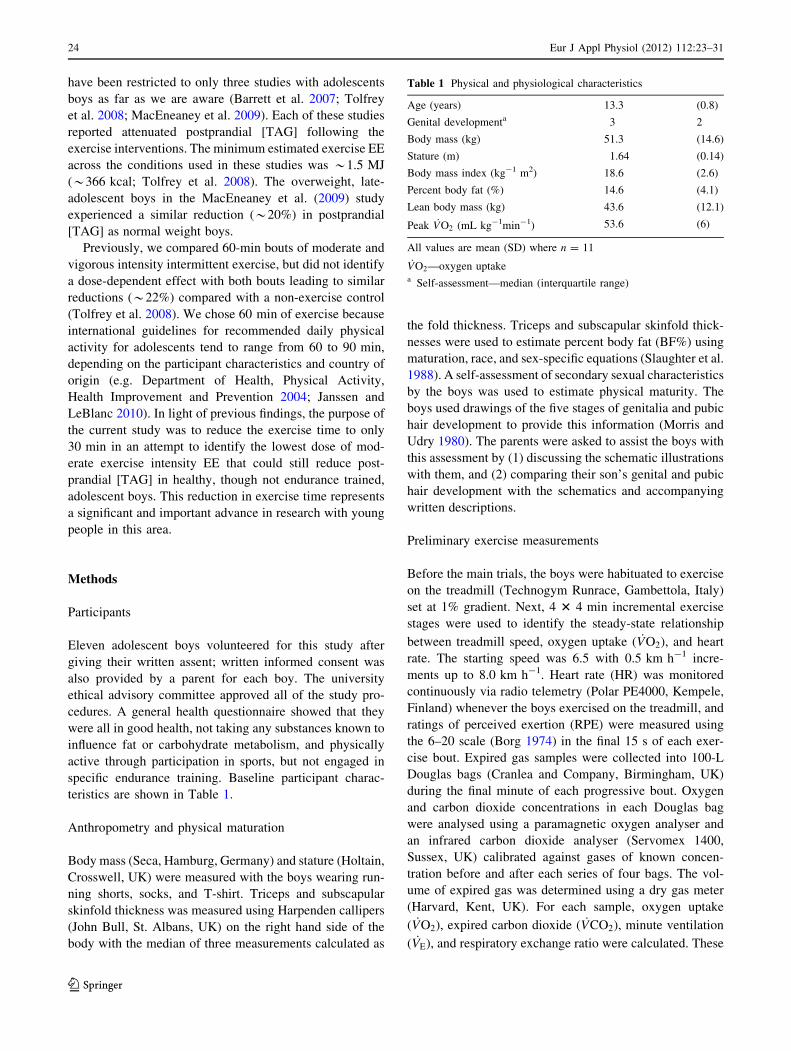
Table 1 Physical and physiological characteristics
Age (years) 13.3 (0.8)
Genital developmenta 3 2
Body mass (kg) 51.3 (14.6)
Stature (m) 1.64 (0.14)
Body mass index (kg-1 m2) 18.6 (2.6)
Percent body fat (%) 14.6 (4.1)
Lean body mass (kg) 43.6 (12.1)
Peak _VO2 (mL kg-1min-1) 53.6 (6)
All values are mean (SD) where n = 11
_VO2—oxygen uptakea Self-assessment—median (interquartile range)
24 Eur J Appl Physiol (2012) 112:23–31
123

submaximal _VO2 data were used subsequently to (1)
choose an appropriate speed for each individual at which
their peak _VO2 could be determined (below) and (2) to
establish the speed required to elicit 55% peak _VO2 for the
two experimental exercise conditions described below.
Peak oxygen uptake (peak _VO2)
After a standardised 10-min rest period, peak _VO2 was
determined with each boy running at a fixed individual
speed (9–11 km h-1), while the treadmill belt was raised
by 1% each minute until volitional exhaustion. Oxygen
uptake, HR, and RPE were measured using the methods
described previously. The boys were asked to run until
volitional exhaustion, which was verified using the fol-
lowing criteria: (1) a plateau in _VO2 (B3%) with an
increase in treadmill gradient; (2) a maximum heart rate
(HRmax) C 95% of age-predicted maximum (220—chro-
nological age); and (3) respiratory exchange ratio C1.10.
Experimental design
A within-measures, counterbalanced crossover design was
used in which the boys completed three separate condi-
tions, each separated by a standardised 14-day period.
A 2-day model was used similar to our previous study
(Tolfrey et al. 2008). A schematic representation of the
design is shown in Fig. 1.
Day 1
On the first day, the boys either (a) rested in the laboratory
for 110 min (CON); (b) completed 60 min of intermittent
treadmill exercise (EX60); or (c) completed 30 min of
intermittent treadmill exercise (EX30). The exercise was
designed to be of moderate intensity and to elicit *55%
peak _VO2. An intermittent exercise model was used because
initial pilot work with the boys indicated that they preferred
to complete it in this manner, and some suggested that they
might not be able to exercise continuously for 60 min. The
boys arrived at the laboratory at 15:30 h on each occasion,
and each condition was completed at 17:30 h on day 1. The
30 and 60 min bouts of exercise were completed in 3 or
6 3 10 min blocks separated by passive rest periods of
equal duration. During each 10-min interval of exercise,
samples of expired gas were collected in the fourth and
tenth minute and analysed using the procedures described
previously to verify the relative exercise intensity. Subse-
quently, assuming that the urinary nitrogen excretion rate
was negligible and that the participants had reached a
physiological steady state, these samples were used to
estimate exercise EE and the oxidation of carbohydrate and
fat (Frayn 1983). The treadmill speed was adjusted peri-
odically throughout each condition in an effort to match the
target exercise intensity (Table 2). Heart rate was recorded
continuously and RPE was recorded during the last 15 s of
each expired air sampling period as described previously.
Day 2
Following a standardised 12-h overnight fast, the boys were
driven to the laboratory. After providing an initial fasting
capillary blood sample at *07:55, a high fat test milkshake
was consumed within 10 min and then six further blood
samples were taken at hourly intervals (Fig. 1). The timing of
the postprandial period commenced when the boys started
consuming the milkshake (08:00) and was standardised so
that it occurred *14.5 h after completion of the treadmill
exercise or rest period the previous day. During this post-
prandial period, the boys were asked to remain seated
throughout whilst they read, played on a non-active computer
games console or watched DVD films. One-and-half litres of
plain water was provided, and the boys were asked to drink
this in small quantities divided equally over the 6 h.
Standardisation of diet, physical activity, and milkshake
With parental assistance, the boys recorded their food
and drink intake and all physical activities in the 48-h
Day 2 Day 1
Evening meal
Milk shake
15:40 to 17:30
Rest (CON)
30 min intermittent exercise (EX30)
60 min intermittent exercise (EX60)
Exercise completed at 17:30
** ↑↑ ↑ ↑ ↑ ↑ ↑ ↑
Evening meal was replicated from 1st condition 07:55 08:00 09:00 10:00 11:00 12:00 13:00 14:00
* Key: ↑ capillary blood sample for
[TAG] and [glucose] ↑ capillary blood sample for [TAG],
[glucose], [haemoglobin], and haematocrit
Fig. 1 Schematic of 2-day
protocol
Eur J Appl Physiol (2012) 112:23–31 25
123
period leading up to day 2 of the first assigned experi-
mental condition (including the evening meal shown in
Fig. 1). This information was used to match their diet
and activity patterns across the three experimental con-
ditions. The boys were reminded verbally of this
requirement to replicate their nutritional intake and
activity just prior to the second and third conditions. In
addition, the boys were asked to minimise their
engagement in physical activity, other than the prescribed
treadmill exercise, in this 48-h period; however, no
measurements were taken to verify this. Before leaving
the laboratory on day 1 of each experimental condition,
the boys were reminded that they could drink plain water
but should not consume any food after 20:00 h that
evening. They were asked to eat a small cereal snack bar
at 19:45 h to standardise the fasting period across par-
ticipants and experimental conditions. They were also
asked to remain as inactive as possible after leaving the
laboratory in an effort to minimise this as an extraneous
factor on measurements during day 2.
The milkshake was a 3:1 mix of vanilla dairy ice
cream and double cream with 10 g of either powdered
strawberry or chocolate flavour added. It provided 1.50 g
of fat (70% of total energy), 1.20 g of carbohydrate
(25%), and 0.21 g of protein (5%) per kilogram of
body mass (80 kJ kg-1). The composition of the milk-
shake consumed differed slightly in the current study to
account for the small changes to the macronutrient
content of the ice cream and double cream by the
manufacturers since our last study (Tolfrey et al. 2008).
None of the boys reported any gastrointestinal problems
when consuming the milkshake or during the 6-h post-
prandial period.
Analytical methods
The fasting and postprandial capillary blood samples were
used to quantify [TAG] and glucose concentration ([glu-
cose]). Haematocrit and haemoglobin concentration were
determined from the fasting and final samples to estimate
change in plasma volume (Dill and Costill 1974). The
whole hand was pre-warmed for 5 min in water heated to
40�C whilst the participant remained seated. The hand was
dried thoroughly and cleaned with a steret before the tip of
the finger was pierced (Unistick 3 Extra, Owen Mumford,
Oxford, UK). After the initial drop had been discarded,
between 300 and 600 lL of whole blood was collected
into potassium-EDTA coated Microvette CB 300 tubes
(Sarstedt Ltd, Leicester, UK) and centrifuged immediately
at 12,800g for 15 min (Eppendorf 5415c, Hamburg,
Germany). Plasma was separated immediately after cen-
trifugation; 20 lL was removed and then diluted 50 times
by the addition of 980 lL of ice-cold saline (0.9%; Barrett
et al. 2007; Tolfrey et al. 2008) to prevent any freeze-
drying effect as a result of storage. This procedure was
repeated so that two aliquots of diluted plasma were stored
at -80�C for a month for subsequent analysis by enzy-
matic, colourimetric methods (Randox Laboratories Ltd,
Crumlin, UK) with the use of a centrifugal analyser (Cobas
Mira Plus, Roche, Basel, Switzerland). The predilution
procedure precluded the dilution step of the assay when
[TAG] and [glucose] were measured, and three times the
sample volume recommended in the Randox kit assay
procedure was used. This resulted in the concentration of
the sample for analysis being the same as that in the ori-
ginal assay procedure (Barrett et al. 2007; Tolfrey et al.
2008). The within-batch coefficients of variation for [TAG]
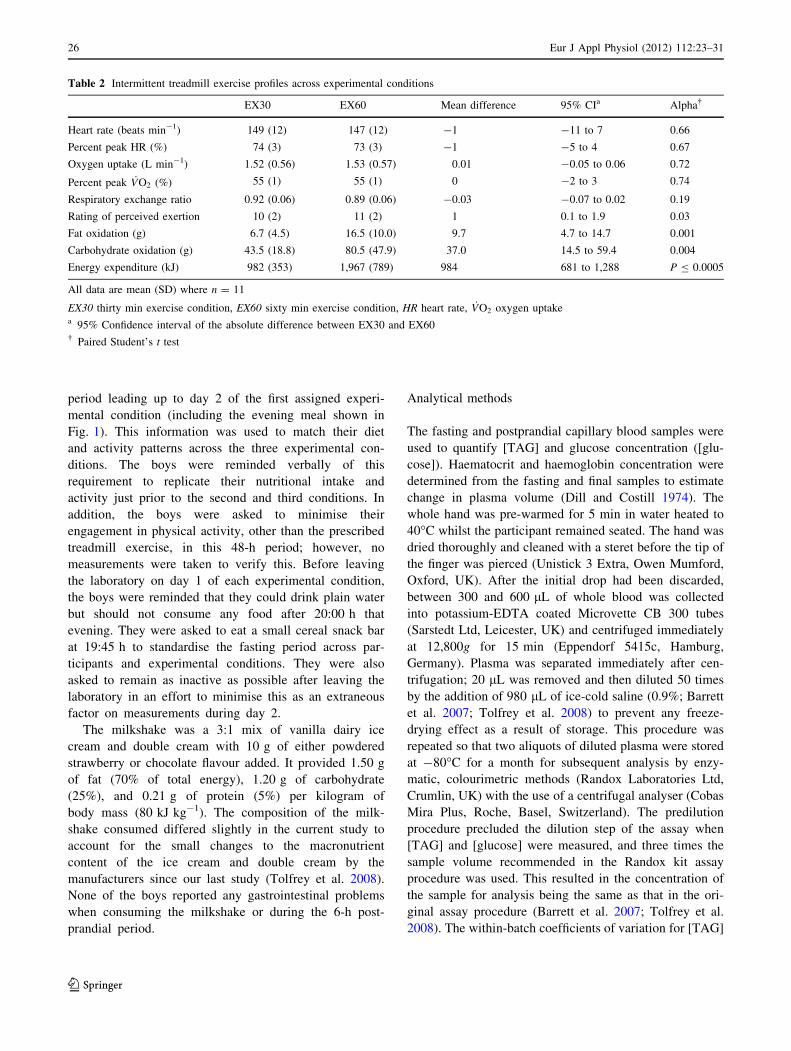
Table 2 Intermittent treadmill exercise profiles across experimental conditions
EX30 EX60 Mean difference 95% CIa Alpha�
Heart rate (beats min-1) 149 (12) 147 (12) -1 -11 to 7 0.66
Percent peak HR (%) 74 (3) 73 (3) -1 -5 to 4 0.67
Oxygen uptake (L min-1) 1.52 (0.56) 1.53 (0.57) 0.01 -0.05 to 0.06 0.72
Percent peak _VO2 (%) 55 (1) 55 (1) 0 -2 to 3 0.74
Respiratory exchange ratio 0.92 (0.06) 0.89 (0.06) -0.03 -0.07 to 0.02 0.19
Rating of perceived exertion 10 (2) 11 (2) 1 0.1 to 1.9 0.03
Fat oxidation (g) 6.7 (4.5) 16.5 (10.0) 9.7 4.7 to 14.7 0.001
Carbohydrate oxidation (g) 43.5 (18.8) 80.5 (47.9) 37.0 14.5 to 59.4 0.004
Energy expenditure (kJ) 982 (353) 1,967 (789) 984 681 to 1,288 P B 0.0005
All data are mean (SD) where n = 11
EX30 thirty min exercise condition, EX60 sixty min exercise condition, HR heart rate, _VO2 oxygen uptakea 95% Confidence interval of the absolute difference between EX30 and EX60� Paired Student’s t test
26 Eur J Appl Physiol (2012) 112:23–31
123

and [glucose] using the methods described above were 2.9
and 1.8%, respectively. The capillary sampling technique
provides plasma concentrations that are systematically
lower than from venous samples, but the difference is small
(TAUC-TAG unbiased typical error 4.9% [95% CI 3.8 to
7.1%]) and does not affect the interpretation of the study
(unpublished data).
Statistical analyses
The data were stored and analysed using the Statistical
Package for the Social Sciences (SPSS for Windows Ver-
sion 16; SPSS Inc., Chicago, USA). Descriptive statistics
[means (SD)] representing the physical and physiological
characteristics at baseline (Table 1) were calculated for the
11 boys. Normality of the data was confirmed by Shapiro–
Wilk tests, and Mauchly’s test of sphericity was used to
check for homogeneity of variances. A Greenhouse–Geis-
ser correction of the degrees of freedom was used if
sphericity could not be assumed. Differences between the
EX30 and EX60 responses (Table 2) were examined using
Student’s paired t tests and effect sizes (ES; Field 2009).
The total 6 h area under the plasma concentration versus
time curves for TAG (TAUC-TAG) and glucose (TAUC-
glucose) were calculated using the trapezium rule for each
experimental condition. The TAUC and fasting concentra-
tions for TAG and glucose were compared across the
experimental conditions using separate one-way within-
measures ANOVA. Estimated changes in plasma volume
across the conditions were analysed using the same proce-
dure. Separate 3 9 7 (condition by time) within-measures
ANOVA were used to identify differences in [TAG] and
[glucose] over the postprandial period. A priori simple
planned contrasts with CON as the reference category were
used to follow up the effects from the omnibus ANOVAs.
The 95% CI for mean absolute and percentage differences
between conditions were calculated using the t distribution
and n - 1 degrees of freedom. Percentage changes over time
for paired results were calculated after the data had been
transformed using a natural logarithm. The mean percentage
difference was then obtained from 100 (emean difference - 1).
Pearson’s product moment correlations were used to identify
which factors were determinants of exercise-induced chan-
ges in TAUC-TAG and to explain the anticipated inter-
individual variability. All results are presented as mean (SD).
Results
Treadmill exercise responses
On average, the boys jogged at a target intensity of 55%
peak _VO2 in both exercise conditions. Aside from a 1 unit
increase in RPE between EX30 and EX60, the only
meaningful differences were the anticipated increase in EE
(95% CI 82 to 111%) and absolute (g) macronutrient oxi-
dation for EX60 compared with EX30 (Table 2).
Plasma volume and fasting concentrations
Average estimated changes in plasma volume between the
fasting and 6-h samples across each condition were small
(CON 0.1%, EX30 0.8%, EX60 0.6%; ES = 0.06,
P = 0.88), so the raw [TAG] and [glucose] were used in all
subsequent analyses. Differences in fasting [TAG] were
small (ES = 0.23, P = 0.35), whereas differences in
fasting [glucose] were small to moderate (ES = 0.40,
P = 0.04) with a progressive decline across the three
conditions as EE increased (Table 3). A simple planned
contrast indicated that glucose in EX60 was lower than
CON (95% CI -0.73 to -0.11 mmol L-1, P = 0.01).
Postprandial changes in [TAG] and [glucose] over time
Changes in plasma [TAG] over time and across the three
conditions are shown in Fig. 2. [TAG] was lower in both
EX30 and EX60 compared with CON (main effect condi-
tion ES = 0.41, P = 0.03; main effect time ES = 0.49,
P = 0.002, condition 9 time interaction ES = 0.08,
P = 0.65). The percentage differences (95% CI) in [TAG]
for the entire study period were moderate: EX30 versus
CON -16% (-29 to 1%, P = 0.06); EX60 versus CON
-20% (-33 to -3%, P = 0.03); and EX30 versus EX60
-5% (-21 to 14%, P = 0.62). Similarly, moderate chan-
ges in TAUC-TAG were identified (ES = 0.42, P = 0.03);
simple planned contrasts revealed that both EX30 (95% CI
-31 to 4%, P = 0.06) and EX60 (95% CI -31 to -2%,
P = 0.02) were lower than CON, although not different
from each other (95% CI -17 to 16%, P = 0.58) (Table 3).
Individual changes (delta) in TAUC-TAG are provided
in Fig. 3; only participant 1 was a ‘non-responder’ (i.e.
reductions in exercise conditions did not exceed the con-
trol) in both exercise conditions, whereas participants 2 and
3 were ‘non-responders’ in EX30 and, likewise, partici-
pants 4 and 9 in EX60. The Pearson product moment
correlation between EX30 and EX60 for these delta values
was moderate (r = 0.60, P = 0.05). These individual
changes in TAUC-TAG for both EX30 and E60 were not
significantly related to any of the other measured variables
shown in Tables 1 and 2 (P [ 0.05). For EX30, BMI
shared the strongest relationship with delta TAUC-TAG
accounting for *10% of the variance (P = 0.32), whereas
the exercise respiratory exchange ratio explained *24% of
the variance (P = 0.13) in EX60 delta TAUC-TAG.
Scaling the EE and substrate oxidation values using dif-
ferent body size/composition factors, either linearly or
Eur J Appl Physiol (2012) 112:23–31 27
123

allometrically, did not help to explain any more of this
individual variability.
[Glucose] was lower in both EX30 and EX60 compared
with CON (main effect condition ES = 0.40, P = 0.04;
main effect time ES = 0.60, P = 0.009, condition 9 time
interaction ES = 0.15, P = 0.92). The percentage differ-
ences (95% CI) in [glucose] for the entire study period
were small: EX30 versus CON -2% (-4 to 0%, P =
0.01); EX60 versus CON -4% (-7 to 0%, P = 0.05);
EX30 versus EX60 -1% (-5 to 2%, P = 0.52). The dif-
ference in TAUC-glucose was small to moderate (ES =
0.35, P = 0.09) (Table 3).
Discussion
The results of this study show, for the first time in ado-
lescent boys, that a single bout of only 30 min of
moderate intensity jogging completed *14.5 h before
drinking a high fat milkshake was sufficient to reduce
postprandial [TAG] by *16% (-29 to 1%). The gross
exercise EE was only 982 kJ, and the average exercise
RPE of 10 (between very light and fairly light) suggests
that the boys were comfortable throughout the moderate
intensity jog. Doubling the EE by increasing the exercise
time from 30 to 60 min had a small (*4%) additional
effect on the reduction in postprandial [TAG], although
the confidence intervals were indicative of a more robust
effect. Changes in fasting [TAG] were small confirming
that a greater EE may be required to reduce this param-
eter (Magkos 2009).
Our results support previous research showing an exer-
cise effect on postprandial TAG metabolism in adolescents
(Barrett et al. 2007; Tolfrey et al. 2008; MacEneaney et al.
2009). However, all these studies required the participants
to exercise for *60 min with EE ranging from *1.5 to
2.5 MJ, thus matching most international guidelines for
accumulated daily physical activity time in young people
(Department of Health, Physical Activity, Health
Improvement and Prevention 2004; Janssen and LeBlanc
2010). Given many young people may still fall short of this
minimum recommendation (Riddoch et al. 2007), we were
interested in seeing whether a lower dose might still
attenuate postprandial [TAG] as recommended in a recent
review (Katsanos 2006). This lower dose is consistent with
the minimum expenditure in public health guidelines for
adults (Haskell et al. 2007) and has recently been shown to
be efficacious with adults (Miyashita et al. 2008; Miyashita
2008). The lack of any differences in the physiological
responses to the two exercise conditions (Table 2) shows
that we were successful in providing a similar metabolic
challenge, which differed only in the time it was performed
and consequently the amount of energy expended.
Table 3 Fasting (baseline) and total area under the time (TAUC) for plasma triacylglycerol (TAG) and glucose (GLU) concentrations across
experimental conditions
CON EX30 EX60 CON vs. EX30
(95% CI)
CON vs. EX60
(95% CI)
EX30 vs. EX60
(95% CI)
Fast triacylglycerol (mmol L-1)a 0.87 (0.46) 0.77 (0.50) 0.77 (0.45) -0.31 to 0.11 -0.20 to 0.01 -0.17 to 0.18
Fast glucose (mmol L-1)b 4.98 (0.55) 4.84 (0.45) 4.56 (0.47) -0.56 to 0.28 -0.73 to -0.11bi -0.58 to 0.02
TAUC-TAG (mmol L-1 6 h)c 7.06 (3.48) 6.15 (3.63) 5.94 (3.56) -1.86 to 0.05ci -2.01 to -0.22cii -1.04 to 0.62
TAUC-glucose (mmol L-1 6 h)d 29.9 (2.04) 29.1 (1.54) 28.9 (1.53) -1.58 to 0.13 -2.33 to 0.25 -1.25 to 0.88
Data are mean (SD) where n = 11; 95% CI 95% confidence interval of the absolute difference (mmol L-1 and mmol L-1 6 h) between
conditions
CON control condition, EX30 thirty min exercise condition, EX60 sixty min exercise condition, TAG triacylglycerol, TAUC total area under the
concentration versus time curvea ANOVA F(2,20) = 1.1, P = 0.35b ANOVA F(2,20) = 3.8, P = 0.04, simple planned contrast—biP = 0.01 CON vs. EX60c ANOVA F(2,20) = 4.4, P = 0.03, simple planned contrasts—ciP = 0.06 CON vs. EX30; ciiP = 0.02 CON vs. EX60d ANOVA F(2,20) = 2.8, P = 0.09
Fig. 2 Fasting (F) and postprandial plasma triacylglycerol concen-
trations for the control (CON), and 30 min (EX30), and 60 min
(EX60) exercise conditions. Data are mean (SD); n = 11. Blackrectangle is when the milkshake was consumed. Main effect for
condition (P = 0.03); main effect for time (P = 0.002); condition by
time interaction (P = 0.65)
28 Eur J Appl Physiol (2012) 112:23–31
123

Exercise EE has been identified previously as the pri-
mary determinant for a reduction in postprandial [TAG]
(Hardman 1998; Katsanos 2006), although once two out-
lying studies were accounted for, the strength of this effect
reported in a meta-analysis (r = -0.35; Petitt and Cureton
2003) was only moderate. Manipulations of exercise
intensity and duration support a dose-dependent response
in adults (Tsetsonis and Hardman 1996; Gill et al. 2002;
Katsanos et al. 2004), although variations in design char-
acteristics preclude the identification of a so-called optimal
or minimal dose. The 12% difference between conditions
in late-adolescent boys was linked tentatively to the greater
EE in the intermittent-games activity (Barrett et al. 2007).
However, the authors acknowledged it was not possible to
estimate exercise EE accurately due to the sprinting com-
ponent of the simulated games activity. Moreover, the
between-groups design in this study may have been a
confounding factor. In stark contrast, our previous study
showed that despite a mean difference of 644 kJ between
the 60-min moderate and vigorous intensity bouts of
treadmill exercise, the reductions in [TAG] were similar at
21 and 18%, respectively (Tolfrey et al. 2008). The current
study design resulted in an even larger EE differential
between the conditions (Table 2). Yet, the results still do
not provide a convincing argument for a dose–response
change in [TAG], or they suggest a threshold attenuation
above which further ‘improvements’ may not be possible.
Despite the large fat load that the milkshake provided,
the postprandial lipaemic effect in the control condition
was blunted compared with other studies of healthy
adolescents or adults consuming similar or less fat for
breakfast (e.g. Pfeiffer et al. 2006; Barrett et al. 2007;
MacEneaney et al. 2009). Consequently, the group mean
reductions in [TAG] in the two exercise conditions may
represent an underestimation of the extent to which the
exercise EE might affect postprandial lipaemia. Alterna-
tively, it might reflect the younger boys in our study
compared to those mentioned above. The mean milkshake
fat consumption of 77 g should lead to exaggerated post-
prandial lipaemia with a tendency for [TAG] to plateau
(Lairon et al. 2007). Furthermore, this quantity may result
in less clear dose dependence than with more moderate
(30–50 g) fat loads (Lairon et al. 2007); however, sys-
tematic evaluation of this in adults supports a linear
increase in plasma [TAG] up to 120 g of fat (Cohen et al.
1988). The dairy milkshake may have also contributed to a
diminished lipaemic response because of the high propor-
tion of short- and medium-chain fatty acids that mostly
enter the liver via the portal system (Barr et al. 1985).
The low EE and perceived exertion associated with the
30-min moderate intensity jog (EX30) may be attractive to
adolescent boys who are too busy with other non-physical
activities to accumulate much more than *1 MJ each day.
The sample size is comparable with previous exercise
studies with adolescents (Barrett et al. 2007; Tolfrey et al.
2008; MacEneaney et al. 2009), and we acknowledged that
it is a major commitment for the participants to complete a
study of this nature. Furthermore, although the effect sizes
for the changes in [TAG] are modest, the confidence
intervals suggest that main between-condition comparisons
are quite robust. The EX30 resulted in a reduction in
TAUC-TAG for the majority of the boys in the study
(Fig. 3), but for two boys lipaemia was greater in the
exercise condition(s) than the control. Although a number
of control measures were implemented to reduce between-
condition variability beyond the manipulated differences in
EE, compliance cannot be guaranteed and deviations that
cannot be discounted are likely to have a significant impact
2.1
0.70.1
-0.9 -1.1 -1.2 -1.3-1.5
-1.9 -1.9
-3.1
0.8
-1.2 -1.3
0.2
-2.3
-1.0
-1.4
-0.6 -0.2
-1.2
-4.2
-4.5
-4.0
-3.5
-3.0
-2.5
-2.0
-1.5
-1.0
-0.5
0.0
0.5
1.0
1.5
2.0
2.5
1 2 3 4 5 6 7 8 9 10 11
Del
ta T
AU
C-T
AG
(Exe
rcis
e m
inus
Con
trol
) (m
mol
/L 6
h)
Individual Participants
EX30 minus CON
EX60 minus CON
Fig. 3 Individual changes in
postprandial TAG responses
(TAUC) between the two
exercise conditions and control
(EX30 - CON, P = 0.061;
EX60 - CON, P = 0.019).
Order of participants (left to
right) according to size of the
EX30-induced change in
TAUC-TAG. Negative values
correspond to an attenuation in
TAUC-TAG in the exercise
condition compared with CON
Eur J Appl Physiol (2012) 112:23–31 29
123
(Magkos 2009). Moreover, considerable day-to-day vari-
ability in fasting [TAG] has been shown that may also be a
factor (Tolfrey et al. 1999). Regardless of the research
design and rigorous standardisation/control, it is not known
if any of the reported changes in [TAG] are relevant from a
clinical perspective, because this is not a clinical end point.
However, the clinical relevance of non-fasting TAG as an
independent risk factor for future cardiovascular disease is
clear (Bansal et al. 2007; Nordestgaard et al. 2007; Sarwar
et al. 2010), and numerous longitudinal cohort studies that
have included a measure of TAG have identified an asso-
ciation with future cardiovascular disease (e.g. Cook et al.
2009).
The mechanisms underlying the changes in postprandial
[TAG] in the exercise conditions cannot be determined
directly from our study and, to our knowledge, have not
been measured in adolescents to date. However, two sepa-
rate studies with adults found that individuals who experi-
enced an increase in either muscle (Herd et al. 2001) or
plasma (Gill et al. 2003) lipoprotein lipase (LPL) activity
16–24 h after a single bout of moderate exercise had the
greatest attenuation in fasting and postprandial [TAG]
concentrations. The authors concluded that LPL activity
probably contributed to the exercise-induced reductions in
fasting and postprandial plasma [TAG] through increased
hydrolysis, but it was unlikely to be acting on its own (Herd
et al. 2001; Gill et al. 2003). Whether this applies to the
boys in our study is not clear because of possible matura-
tional effects and the relatively low EE (Ferguson et al.
1998). An exercise-induced reduction in hepatic very low
density lipoprotein (VLDL)-TAG synthesis and secretion
has been implicated (Gill et al. 2007; Magkos 2009), but the
clearance rate of VLDL-TAG appears to increase only
above a threshold of *2 MJ in adults that is considerably
higher than EX30 although similar to EX60 in our study and
has been questioned following moderate intensity exercise
(Gill et al. 2007; Magkos 2009). Although the exercise-
induced changes in TAUC-TAG following both EX30 and
EX60 varied considerably across the 11 boys, it was clear
that the majority of the boys experienced an exercise-
induced reduction in both conditions compared with the
non-exercise control (CON). It was not possible to identify
a clear determinant of this inter-individual variation within
our study; differences in exercise substrate metabolism and
energy expenditure between the individual boys did not
appear to be significant contributory factors. A limitation of
the indirect calorimetry estimations is that we assumed that
the urinary nitrogen excretion rate was negligible and did
not account for non-respiratory carbon dioxide excretion
that may have resulted in an underestimation of fat oxida-
tion in some individuals (Rowlands 2005). However, a
study with adults, where a lipolysis inhibitor (acipimox)
was used to reduce exercise lipid metabolism, showed that
reductions in postprandial lipaemia were independent of
specific substrate metabolism during exercise (Malkova
et al. 1999)—we are not aware of a similar study with
adolescents. In a recent study designed to examine hetero-
geneity in the effects of exercise on postprandial [TAG] in
adults with type 2 diabetes, Gill et al. (2007) found that
changes in 3-hydroxybutyrate (3-OHB) explained almost
half of the variance in TAUC-TAG. The participants with
the largest increase in 3-OHB, a marker of hepatic fatty acid
oxidation, experienced the greatest exercise-induced
reductions in postprandial TAG (Gill et al. 2007). The
capillary blood sampling technique used in our study did
not permit us to measure 3-OHB, but it is possible that this
mechanism might explain some of the heterogeneity found
in this group of boys. Moreover, this would be compatible
with an emerging body of evidence suggesting that mod-
erate exercise-induced reductions in postprandial TAG
were mediated by changes in hepatic fatty acid flux rather
than changes in LPL activity (Gill et al. 2007).
In conclusion, we believe that this is the first study to
find that \1 MJ of moderate intensity treadmill exercise
was sufficient to reduce postprandial [TAG] in healthy
adolescent boys. Furthermore, although doubling the gross
exercise energy expenditure resulted in small further
attenuation in the postprandial [TAG], it could not be
described as a dose–response change. This might suggest
that an energy expenditure threshold exists in adolescent
boys beyond which further reductions are unlikely to be
demonstrated. However, further work is required to
examine this systematically.
Acknowledgments We thank all of the participants for their dedi-
cation to the study and their parents/carers for supporting them
throughout. We also thank Mr Graham Bett, Mr Ian Smith and Mrs
Sophie Diaper from Woodbrook Vale High School, Loughborough
for their support with the study. The research was not supported
directly by any funding other than that available internally through
Loughborough University.
References
Bansal S, Buring J, Rifai N, Mora S, Sacks F, Ridker P (2007) Fasting
compared with nonfasting triglycerides and risk of cardiovascu-
lar events in women. JAMA 298(3):309–316
Barr SI, Kottke BA, Mao SJ (1985) Postprandial distribution of
apolipoproteins C-II and C-III in normal subjects and patients
with mild hypertriglyceridemia: comparison of meals containing
corn oil and medium-chain triglyceride oil. Metabolism 34(11):
983–992
Barrett L, Morris J, Stensel D, Nevill M (2007) Exercise and
postprandial plasma triacylglycerol concentrations in healthy
adolescent boys. Med Sci Sports Exerc 39(1):116–122
Borg GA (1974) Perceived exertion. Exerc Sports Sci Rev 2:131–153
Cohen JC, Noakes TD, Spinnler Benade AJ (1988) Serum triglyceride
responses to fatty meals: effects of meal fat content. Am J Clin
Nutr 47:825–827
30 Eur J Appl Physiol (2012) 112:23–31
123

Cook S, Auinger P, Huang TT-K (2009) Growth curves for cardio-
metabolic risk factors in children and adolescents. J Pediatr
155:S6.e15-26
Department of Health, Physical Activity, Health Improvement and
Prevention (2004) At least five a week: evidence on the impact
of physical activity and its relationship to health. A report from
the Chief Medical Officer, United Kingdom, pp 10–11 (Avail-
able from UK Department of Health)
Dill DB, Costill DL (1974) Calculation of percentage changes in
volumes of blood, plasma, and red cells in dehydration. J Appl
Physiol 37(2):247–248
Ferguson MA, Alderson NL, Trost SG, Essig DA, Burke JR, Durstine
JL (1998) Effects of four different single exercise sessions on
lipids, lipoproteins, and lipoprotein lipase. J Appl Physiol 85(3):
1169–1174
Field A (2009) Discovering statistics using SPSS for windows, 3rd
edn. Sage Publications, London
Frayn KN (1983) Calculation of substrate oxidation rates in vivo from
gaseous exchange. J Appl Physiol 55:628–634
Froberg K, Andersen L (2005) Mini review: physical activity and
fitness and its relations to cardiovascular disease risk factors in
children. Int J Obes 2:34–39
Gill JMR, Herd SL, Hardman AE (2002) Moderate exercise and post-
prandial metabolism: issues of dose–response. J Sports Sci
20:961–967
Gill JMR, Herd SL, Vora V, Hardman AE (2003) Effects of a brisk
walk on lipoprotein lipase activity and plasma triglyceride
concentrations in the fasted and postprandial states. Eur J Appl
Physiol 89:184–190
Gill JMR, Al-Mamari A, Ferrell WR, Cleland SJ, Perry CG, Sattar N,
Packard CJ, Caslake MJ, Petrie JR (2007) Effect of prior
moderate exercise on postprandial metabolism in men with type
2 diabetes: heterogeneity of responses. Atherosclerosis 194:
134–143
Hardman AE (1998) The influence of exercise on postprandial
triacylglycerol metabolism. Atherosclerosis 141(Suppl 1):S93–
S100
Haskell WL, Lee I-M, Pate RR, Powell KE, Blair SN, Franklin BA,
Macera CA, Heath GW, Thompson PD, Bauman A (2007)
Physical activity and public health: updated recommendation for
adults from the American College of Sports Medicine and the
American Heart Association. Circulation 116:1081–1093
Herd SL, Kiens B, Boobis LH, Hardman AE (2001) Moderate
exercise, postprandial lipemia, and skeletal muscle lipoprotein
lipase activity. Metabolism 50(7):756–762
Janssen I, LeBlanc AG (2010) Systematic review of the health
benefits of physical activity and fitness in school-aged children
and youth. Int J Behav Nutr Phys Act 7:40
Katsanos CS (2006) Prescribing aerobic exercise for the regulation of
postprandial lipid metabolism. Sports Med 36(7):547–560
Katsanos CS, Grandjean PW, Moffatt RJ (2004) Effects of low and
moderate exercise intensity on postprandial lipemia and post-
heparin plasma lipoprotein lipase activity in physically active
men. J Appl Physiol 96(1):181–188
Lairon D, Lopez-Miranda J, Williams C (2007) Methodology for
studying postprandial lipid metabolism. Eur J Clin Nutr
61(10):1145–1161
MacEneaney O, Harrison M, O’Gorman D, Pankratieve E, O’Connor
P, Moyna N (2009) Effect of prior exercise on postprandial
lipemia and markers of inflammation and endothelial activation
in normal weight and overweight adolescent boys. Eur J Appl
Physiol 106(5):721–729
Magkos F (2009) Basal very low-density lipoprotein metabolism in
response to exercise: mechanisms of hypotriacylglycerolemia.
Prog Lipid Res 48(3–4):171–190
Malcom G, McMahan C, McGill H Jr, Herderick E, Tracy R,
Troxclair D, Strong J (2009) Associations of arterial tissue lipids
with coronary heart disease risk factors in young people.
Atherosclerosis 203(2):515–521
Malkova D, Hardman AE, Bowness RJ, MacDonald IA (1999) The
reduction in postprandial lipemia after exercise is independent of
the relative contributions of fat and carbohydrate to energy
metabolism during exercise. Metabolism 48(2):245–251
Miyashita M (2008) Effects of continuous versus accumulated
activity patterns on postprandial triacylglycerol concentrations
in obese men. Int J Obes 32:1271–1278
Miyashita M, Burns SF, Stensel DJ (2008) Accumulating short bouts
of walking reduced postprandial plasma triacylglycerol concen-
trations and resting blood pressure in healthy young men. Am J
Clin Nutr 88:1225–1231
Morris NM, Udry JR (1980) Validation of a self-administered
instrument to assess stage of adolescent development. J Youth
Adolesc 9:271–280
Nordestgaard B, Benn M, Schnohr P, Tybjaerg-Hansen A (2007)
Nonfasting triglycerides and risk of myocardial infarction,
ischemic heart disease, and death in men and women. JAMA
298(3):299–308
Petitt DS, Cureton KJ (2003) Effects of prior exercise on postprandial
lipemia: a quantitative review. Metabolism 52(4):418–424
Pfeiffer M, Wenk C, Colombani PC (2006) The influence of 30
minutes of light to moderate intensity cycling on postprandial
lipemia. Eur J Cardiovasc Prev Rehabil 13:363–368
Riddoch CJ, Mattocks C, Deere K, Saunders J, Kirkby J, Tilling K,
Leary SD, Blair SN, Ness AR (2007) Objective measurement of
levels and patterns of physical activity. Arch Dis Child
92(11):963–969
Rowlands DS (2005) Model for the behaviour of compartmental CO2
stores during incremental exercise. Eur J Appl Physiol 93:555–568
Sarwar N, Danesh J, Eiriksdottir G, Sigurdsson G, Wareham N,
Bingham S, Boekholdt S, Khaw K, Gudnason V (2007)
Triglycerides and the risk of coronary heart disease: 10,158
incident cases among 262,525 participants in 29 Western
prospective studies. Circulation 115(4):450–458
Sarwar N, Sandhu M, Ricketts S, Butterworth A, Di-Angelantonio E,
Boekholdt S, Ouwehand W, Watkins H, Samani N, Saleheen D,
Lawlor D, Reilly M, Hingorani A, Talmund P, Danesh J (2010)
Triglyceride-mediated pathways and coronary disease: collabo-
rative analysis of 101 studies. Lancet 375(9726):1634–1639
Slaughter MH, Lohman TG, Boileau RA, Horswill CA, Stillman RJ,
Van Loan MD, Bemben DA (1988) Skinfold equations for
estimation of body fatness in children and youth. Hum Biol
60(5):709–723
Tolfrey K, Campbell IG, Jones AM (1999) Intra-individual variation
of plasma lipids and lipoproteins in prepubescent children. Eur J
Appl Physiol 79(5):449–456
Tolfrey K, Doggett A, Boyd C, Pinner S, Sharples A, Barrett L (2008)
Postprandial triacylglycerol in adolescent boys: a case for
moderate exercise. Med Sci Sports Exerc 40(6):1049–1056
Tsetsonis NV, Hardman AE (1996) Reduction on postprandial
lipemia after walking: influence of exercise intensity. Med Sci
Sports Exerc 28(10):1235–1242
Zeek P (1930) Juvenile atherosclerosis. Arch Pathol Lab Med
10:417–446
Eur J Appl Physiol (2012) 112:23–31 31
123