effect of concrete materials on permeability of concrete ... · effect of concrete materials on...
TRANSCRIPT
Take the steps...
Transportation Research
Research...Knowledge...Innovative Solutions!
2009-34
Effect of Concrete Materials on Permeability of Concrete
Mixes Used in Mn/DOT Paving Projects
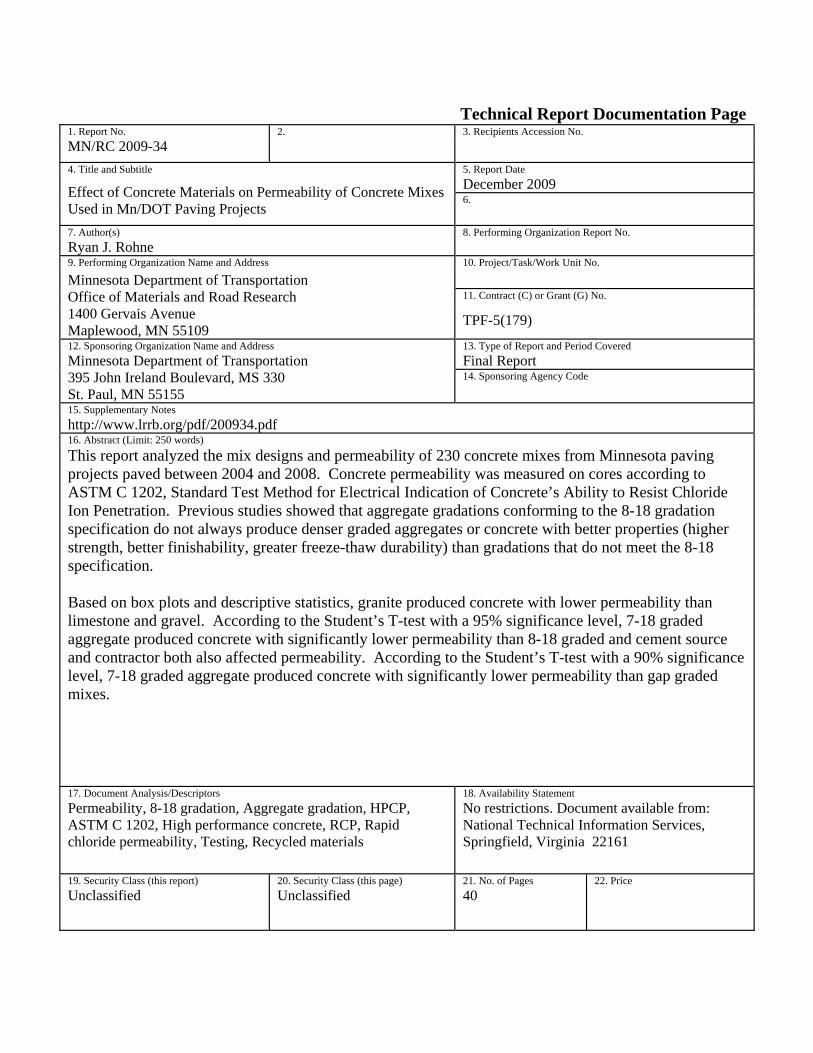
Technical Report Documentation Page 1. Report No. 2. 3. Recipients Accession No. MN/RC 2009-34 4. Title and Subtitle 5. Report Date
Effect of Concrete Materials on Permeability of Concrete Mixes Used in Mn/DOT Paving Projects
December 2009 6.
7. Author(s) 8. Performing Organization Report No. Ryan J. Rohne 9. Performing Organization Name and Address 10. Project/Task/Work Unit No. Minnesota Department of Transportation Office of Materials and Road Research 1400 Gervais Avenue Maplewood, MN 55109
11. Contract (C) or Grant (G) No.
TPF-5(179)
12. Sponsoring Organization Name and Address 13. Type of Report and Period Covered Minnesota Department of Transportation 395 John Ireland Boulevard, MS 330 St. Paul, MN 55155
Final Report 14. Sponsoring Agency Code
15. Supplementary Notes http://www.lrrb.org/pdf/200934.pdf 16. Abstract (Limit: 250 words) This report analyzed the mix designs and permeability of 230 concrete mixes from Minnesota paving projects paved between 2004 and 2008. Concrete permeability was measured on cores according to ASTM C 1202, Standard Test Method for Electrical Indication of Concrete’s Ability to Resist Chloride Ion Penetration. Previous studies showed that aggregate gradations conforming to the 8-18 gradation specification do not always produce denser graded aggregates or concrete with better properties (higher strength, better finishability, greater freeze-thaw durability) than gradations that do not meet the 8-18 specification. Based on box plots and descriptive statistics, granite produced concrete with lower permeability than limestone and gravel. According to the Student’s T-test with a 95% significance level, 7-18 graded aggregate produced concrete with significantly lower permeability than 8-18 graded and cement source and contractor both also affected permeability. According to the Student’s T-test with a 90% significance level, 7-18 graded aggregate produced concrete with significantly lower permeability than gap graded mixes.
17. Document Analysis/Descriptors 18. Availability Statement Permeability, 8-18 gradation, Aggregate gradation, HPCP, ASTM C 1202, High performance concrete, RCP, Rapid chloride permeability, Testing, Recycled materials
No restrictions. Document available from: National Technical Information Services, Springfield, Virginia 22161
19. Security Class (this report) 20. Security Class (this page) 21. No. of Pages 22. Price Unclassified Unclassified 40

Effect of Concrete Materials on Permeability of Concrete Mixes Used in Mn/DOT Paving Projects
Final Report
Prepared by:
Ryan J. Rohne Minnesota Department of Transportation Office of Materials and Road Research
December 2009
Published by:
Minnesota Department of Transportation Research Services Section
395 John Ireland Boulevard, MS 330 St. Paul, Minnesota 55155-1899
This report represents the results of research conducted by the authors and does not necessarily represent the views or policies of the Minnesota Department of Transportation. This report does not contain a standard or specified technique.
The authors and the Minnesota Department of Transportation do not endorse products or manufacturers. Trade or manufacturers’ names appear herein solely because they are considered essential to this report.

ACKNOWLEDGEMENTS Appreciation goes to Maria Masten, Robert Golish, and Wendy Garr for providing the data presented in this report and to Bernard Izevbekhai for fostering this kind of research.
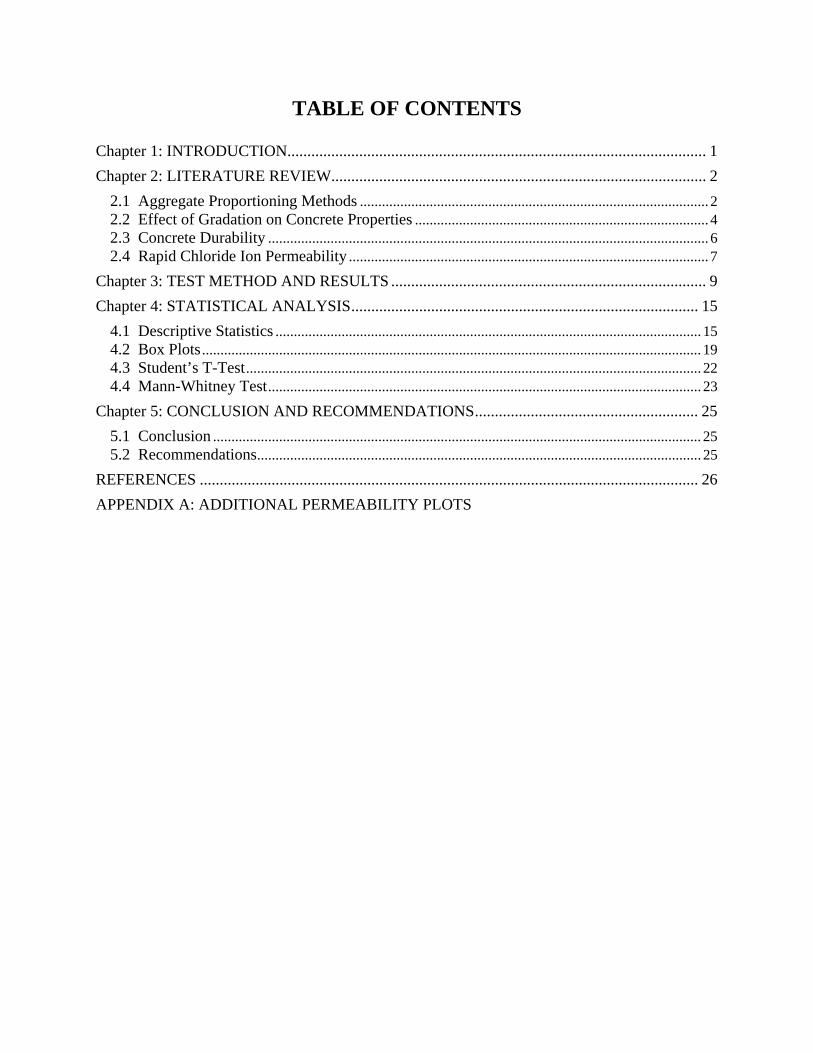
TABLE OF CONTENTS
Chapter 1: INTRODUCTION......................................................................................................... 1 Chapter 2: LITERATURE REVIEW.............................................................................................. 2
2.1 Aggregate Proportioning Methods ............................................................................................... 2 2.2 Effect of Gradation on Concrete Properties ................................................................................ 4 2.3 Concrete Durability ........................................................................................................................ 6 2.4 Rapid Chloride Ion Permeability .................................................................................................. 7
Chapter 3: TEST METHOD AND RESULTS ............................................................................... 9 Chapter 4: STATISTICAL ANALYSIS ....................................................................................... 15
4.1 Descriptive Statistics .................................................................................................................... 15 4.2 Box Plots ........................................................................................................................................ 19 4.3 Student’s T-Test ............................................................................................................................ 22 4.4 Mann-Whitney Test ...................................................................................................................... 23
Chapter 5: CONCLUSION AND RECOMMENDATIONS ........................................................ 25 5.1 Conclusion ..................................................................................................................................... 25 5.2 Recommendations ......................................................................................................................... 25
REFERENCES ............................................................................................................................. 26 APPENDIX A: ADDITIONAL PERMEABILITY PLOTS

LIST OF TABLES
TABLE 1 Dilek and Leming Mixture Composition and Concrete Properties _______________ 6 TABLE 2 Aggregate Type _____________________________________________________ 16 TABLE 3 Aggregate Gradation _________________________________________________ 17 TABLE 4 Contractor _________________________________________________________ 17 TABLE 5 Cement Type on 28 Day Cores _________________________________________ 18 TABLE 6 Cement Type on 60 Day Cores _________________________________________ 18 TABLE 7 w/cm Ratio ________________________________________________________ 19 TABLE 8 Students T-test Results _______________________________________________ 23 TABLE 9 Mann-Whitney Test _________________________________________________ 24
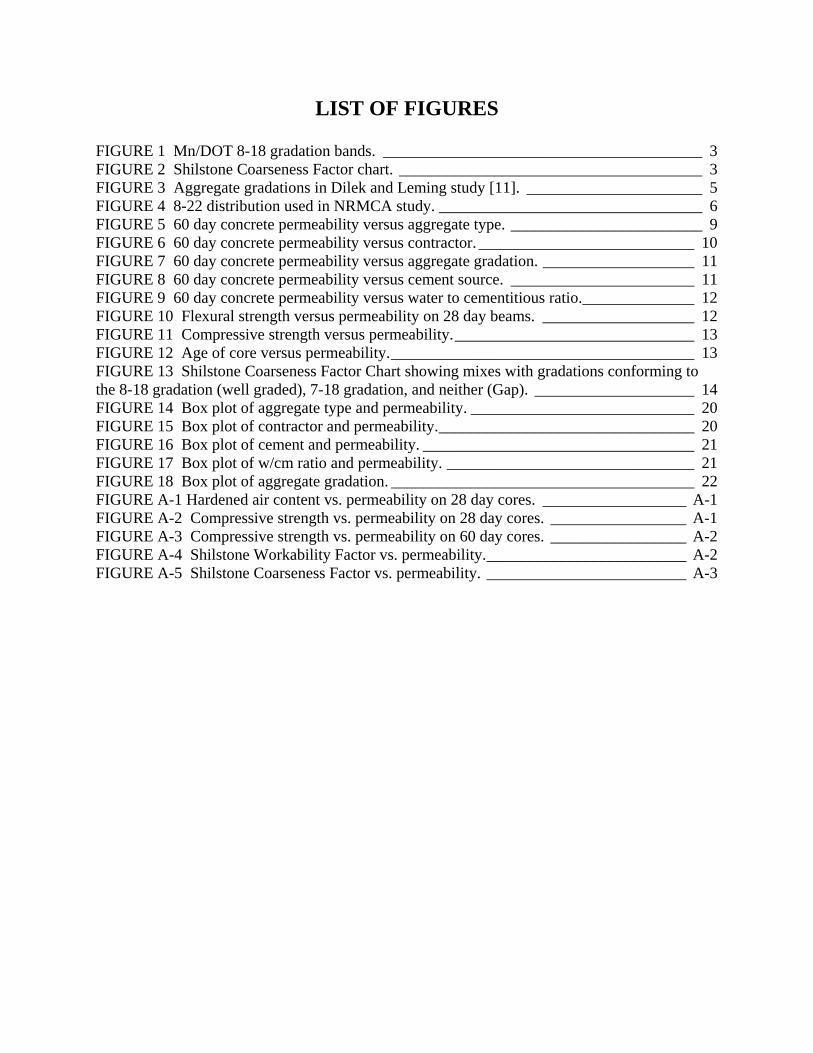
LIST OF FIGURES
FIGURE 1 Mn/DOT 8-18 gradation bands. ________________________________________ 3 FIGURE 2 Shilstone Coarseness Factor chart. ______________________________________ 3 FIGURE 3 Aggregate gradations in Dilek and Leming study [11]. ______________________ 5 FIGURE 4 8-22 distribution used in NRMCA study. _________________________________ 6 FIGURE 5 60 day concrete permeability versus aggregate type. ________________________ 9 FIGURE 6 60 day concrete permeability versus contractor. ___________________________ 10 FIGURE 7 60 day concrete permeability versus aggregate gradation. ___________________ 11 FIGURE 8 60 day concrete permeability versus cement source. _______________________ 11 FIGURE 9 60 day concrete permeability versus water to cementitious ratio. ______________ 12 FIGURE 10 Flexural strength versus permeability on 28 day beams. ___________________ 12 FIGURE 11 Compressive strength versus permeability. ______________________________ 13 FIGURE 12 Age of core versus permeability. ______________________________________ 13 FIGURE 13 Shilstone Coarseness Factor Chart showing mixes with gradations conforming to the 8-18 gradation (well graded), 7-18 gradation, and neither (Gap). ____________________ 14 FIGURE 14 Box plot of aggregate type and permeability. ____________________________ 20 FIGURE 15 Box plot of contractor and permeability. ________________________________ 20 FIGURE 16 Box plot of cement and permeability. __________________________________ 21 FIGURE 17 Box plot of w/cm ratio and permeability. _______________________________ 21 FIGURE 18 Box plot of aggregate gradation. ______________________________________ 22 FIGURE A-1 Hardened air content vs. permeability on 28 day cores. __________________ A-1 FIGURE A-2 Compressive strength vs. permeability on 28 day cores. _________________ A-1 FIGURE A-3 Compressive strength vs. permeability on 60 day cores. _________________ A-2 FIGURE A-4 Shilstone Workability Factor vs. permeability. _________________________ A-2 FIGURE A-5 Shilstone Coarseness Factor vs. permeability. _________________________ A-3
EXECUTIVE SUMMARY
The Minnesota Department of Transportation (Mn/DOT) has been paying incentives for aggregate gradations that meet the 8-18 gradation band (well graded) for many years although the benefits of these mixes has not been studied. Mn/DOT’s 2005 Standard Specifications for Construction lists an optional incentive of $2.00 per cubic yard for aggregate gradations that meet the 8-18 gradation requirements and $0.50 per cubic yard for aggregate gradations that meet the 7-18 gradation requirements. The 8-18 gradation requirement states that the percent retained on each sieve should be between 8 (7 for 7-18 gradation) and 18 percent except for the coarsest sieve, on which the percent retained can be lower than 8 percent, and for sieves finer than No. 30. The current High Performance Concrete Pavement (HPCP) or 60-year concrete pavement design requires aggregates conforming to the 8-18 gradation band and a water to cementitious (w/cm) ratio below 0.40 with incentives paid for lower w/cm ratios. These requirements were initiated to insure that concrete mixes would have good aggregate interlock, low paste content, and low permeability. Previous studies showed that aggregate gradations conforming to the 8-18 specifications do not always produce denser graded aggregates or concrete with better properties (higher strength, better finishability, greater freeze-thaw durability) than gradations that do not meet the 8-18 specification. This report analyzed 230 concrete mixes from Minnesota paving projects paved between 2004 and 2008. Concrete permeability was measured on cores according to ASTM C 1202, Standard Test Method for Electrical Indication of Concrete’s Ability to Resist Chloride Ion Penetration. Based on box plots and descriptive statistics, granite produced concrete with lower permeability than limestone and gravel. According to the Student’s T-test with a 95% significance level, 7-18 graded aggregate produced concrete with significantly lower permeability than 8-18 graded and cement source and contractor both also affected permeability. According to the Student’s T-test with a 90% significance level, 7-18 graded aggregate produced concrete with significantly lower permeability than gap graded mixes.
Chapter 1 INTRODUCTION
The Minnesota Department of Transportation (Mn/DOT) has been paying incentives, for aggregate gradations that meet the 8-18 gradation band (well graded) for many years although the benefits of these mixes has not been adequately studied. The current High Performance Concrete Pavement (HPCP) or 60 year concrete pavement design requires aggregates conforming to the 8-18 gradation band and a water to cementitious (w/cm) ratio below 0.40 with incentives paid for lower w/cm ratios. These requirements were initiated to insure that concrete mixes would have good aggregate interlock, low paste content, and low permeability. This report analyzed 230 concrete mixes from Minnesota paving projects paved between 2004 and 2008. The concrete mix design, aggregate gradation, and concrete permeability test results were evaluated to determine if:
• The permeability of 8-18 graded mixes was lower than the permeability of gap graded mixes
• There is a single property or material that decreases concrete permeability, for example do mixes with lower w/cm ratio’s have lower permeability or is there a cement type/source that lowers concrete permeability
• 8-18 aggregate gradations have greater packing density and produce concrete with improved performance compared to concrete with non 8-18 graded aggregates
Concrete permeability was measured on cores according to ASTM C 1202, Standard Test Method for Electrical Indication of Concrete’s Ability to Resist Chloride Ion Penetration. Information from the concrete mix designs was then used along with the aggregate gradations. Permeability was used to evaluate the mixes because low permeability is typically associated with durable concrete pavements and Mn/DOT’s High Performance Concrete Pavement (HPCP) specifications are intended to insure low concrete permeability. The descriptive statistics tool in Excel, Box Plots, Students T-test, and Mann-Whitney were used to determine statistical significance.
1
Chapter 2 LITERATURE REVIEW
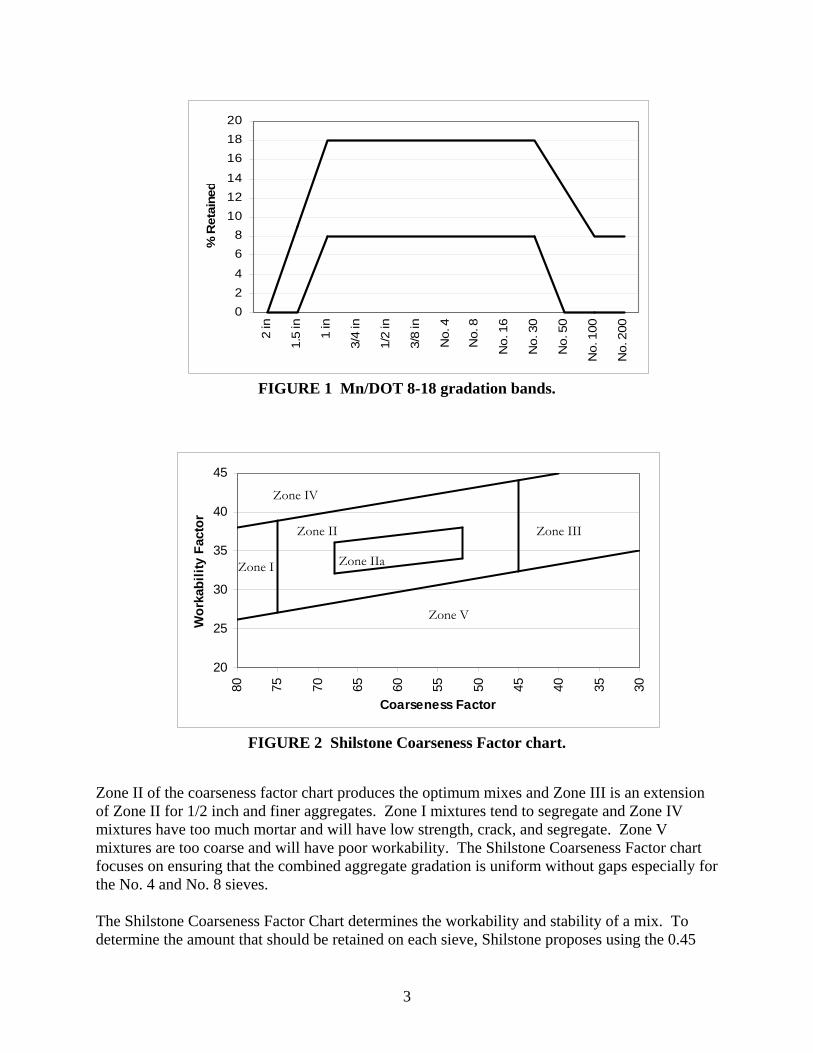
A literature review was conducted to review different methods for proportioning concrete aggregates and to determine if concrete mixes that met the 8-18 gradation requirement had more favorable properties than mixes that did not. The ASTM C 1202 procedure was also summarized along with some of the test limitations. 2.1 Aggregate Proportioning Methods ACI 211 [1], Standard Practice for Selecting Proportions for Normal, Heavyweight and Mass Concrete, is one of the most commonly used concrete proportioning methods. In this method, water content depends on the maximum size of aggregate, desired slump, and to a lesser extent aggregate shape and whether or not admixtures are used. This method is intended for designing concrete mixes by blending only two aggregates; coarse and fine. The coarse aggregate content is then determined based on the fineness modulus of the fine aggregate. This method uses the fineness modulus to account for aggregate packing although if a manufactured sand that does not conform to ASTM C 33 [2] is used, very different size distributions can results in the same fineness modulus but for sands that do conform to ASTM C 33, the differences are very small [3,4]. The particle packing of the coarse aggregate is considered by the dry rodded unit weight. This method does not encourage gradation optimization by combining multiple aggregates. According to Burnham, Izevbekhai, and Rangaraju [5], the aggregate gradation for high-performance concrete pavement mixes (HPCP) should be optimized based on an 8-18 specification for combined gradations. The percent retained on each sieve should be between 8 and 18 percent except for the coarsest sieve, on which the percent retained can be lower than 8 percent, and for sieves finer than No. 30. The acceptable band of combined aggregate gradations is shown in Figure 1. While the 8-18 gradation is intended to create a well graded mix, it is still possible to have a gap graded mix that could have low packing densities and workability problems due to excess or deficiencies of either small or large particles [4]. Shilstone [6, 7] divided the aggregate sizes into three main groups: Q, I, and W. The Q or quality aggregate is the plus 3/8 inch particles that reduce the amount of paste needed and prevent shrinkage and cracks. The I or intermediate particles are the minus 3/8 inch plus No. 8 particles that fill the large voids between the Q particles and contribute to workability but if these particle are flat or elongated they decrease mix mobility. The W or workability particles are the minus No. 8 sizes and act as lubrication between the larger particles. Shilstone [6] and Shilstone and Shilstone [7] proposed that concrete mixes can be optimized by using the coarseness factor chart shown in Figure 2. The horizontal axis of the chart is the Coarseness Factor or the percent of plus No. 8 retained on the 3/8 in. sieve. The vertical axis is the Workability Factor or the percent passing the No. 8 sieve adjusted for the cement content. The chart shown in Figure 2 is based on 556 lb/yd3 of cement. For every 94 lb/yd3 of cement added or subtracted, 2.5% must be added or subtracted from the vertical axis. This is to account for lean mixes, which may have workability problems, and rich mixes that may tend to segregate.
2
024
68
101214
161820
2 in
1.5
in
1 in
3/4
in
1/2
in
3/8
in
No.
4
No.
8
No.
16
No.
30
No.
50
No.
100
No.
200
% R
etai
ned
FIGURE 1 Mn/DOT 8-18 gradation bands.
20
25
30
35
40
45
3035404550556065707580
Coarseness Factor
Wor
kabi
lity
Fact
or
Zone IV
Zone II Zone III
Zone IIaZone I
Zone V
FIGURE 2 Shilstone Coarseness Factor chart.
Zone II of the coarseness factor chart produces the optimum mixes and Zone III is an extension of Zone II for 1/2 inch and finer aggregates. Zone I mixtures tend to segregate and Zone IV mixtures have too much mortar and will have low strength, crack, and segregate. Zone V mixtures are too coarse and will have poor workability. The Shilstone Coarseness Factor chart focuses on ensuring that the combined aggregate gradation is uniform without gaps especially for the No. 4 and No. 8 sieves. The Shilstone Coarseness Factor Chart determines the workability and stability of a mix. To determine the amount that should be retained on each sieve, Shilstone proposes using the 0.45
3
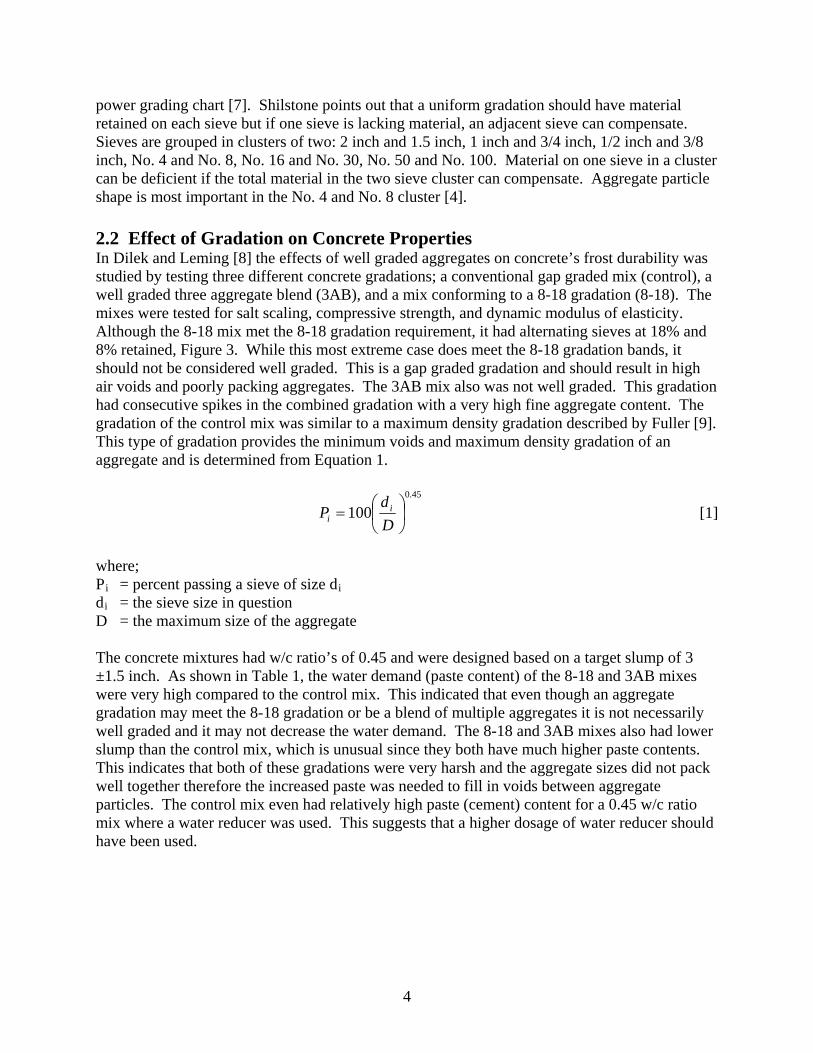
power grading chart [7]. Shilstone points out that a uniform gradation should have material retained on each sieve but if one sieve is lacking material, an adjacent sieve can compensate. Sieves are grouped in clusters of two: 2 inch and 1.5 inch, 1 inch and 3/4 inch, 1/2 inch and 3/8 inch, No. 4 and No. 8, No. 16 and No. 30, No. 50 and No. 100. Material on one sieve in a cluster can be deficient if the total material in the two sieve cluster can compensate. Aggregate particle shape is most important in the No. 4 and No. 8 cluster [4]. 2.2 Effect of Gradation on Concrete Properties In Dilek and Leming [8] the effects of well graded aggregates on concrete’s frost durability was studied by testing three different concrete gradations; a conventional gap graded mix (control), a well graded three aggregate blend (3AB), and a mix conforming to a 8-18 gradation (8-18). The mixes were tested for salt scaling, compressive strength, and dynamic modulus of elasticity. Although the 8-18 mix met the 8-18 gradation requirement, it had alternating sieves at 18% and 8% retained, Figure 3. While this most extreme case does meet the 8-18 gradation bands, it should not be considered well graded. This is a gap graded gradation and should result in high air voids and poorly packing aggregates. The 3AB mix also was not well graded. This gradation had consecutive spikes in the combined gradation with a very high fine aggregate content. The gradation of the control mix was similar to a maximum density gradation described by Fuller [9]. This type of gradation provides the minimum voids and maximum density gradation of an aggregate and is determined from Equation 1.
45.0
100 ⎟⎠⎞
⎜⎝⎛=
Dd
P ii
[1]
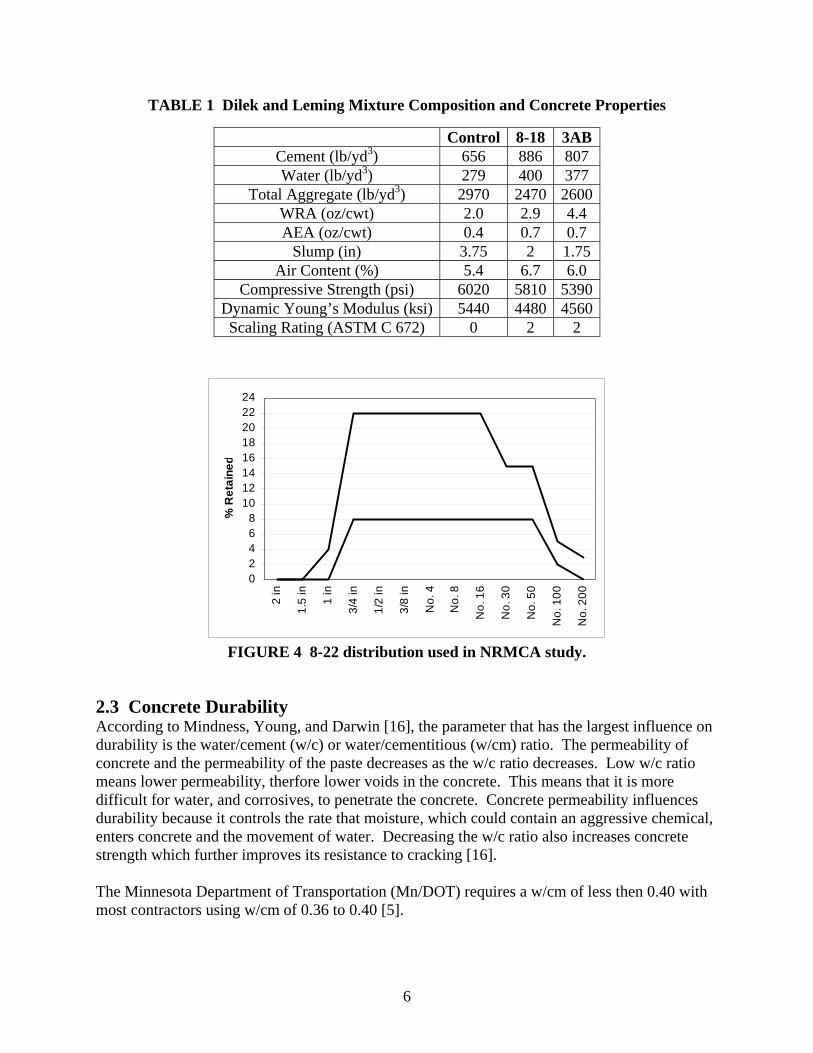
where; Pi = percent passing a sieve of size di di = the sieve size in question D = the maximum size of the aggregate The concrete mixtures had w/c ratio’s of 0.45 and were designed based on a target slump of 3 ±1.5 inch. As shown in Table 1, the water demand (paste content) of the 8-18 and 3AB mixes were very high compared to the control mix. This indicated that even though an aggregate gradation may meet the 8-18 gradation or be a blend of multiple aggregates it is not necessarily well graded and it may not decrease the water demand. The 8-18 and 3AB mixes also had lower slump than the control mix, which is unusual since they both have much higher paste contents. This indicates that both of these gradations were very harsh and the aggregate sizes did not pack well together therefore the increased paste was needed to fill in voids between aggregate particles. The control mix even had relatively high paste (cement) content for a 0.45 w/c ratio mix where a water reducer was used. This suggests that a higher dosage of water reducer should have been used.
4
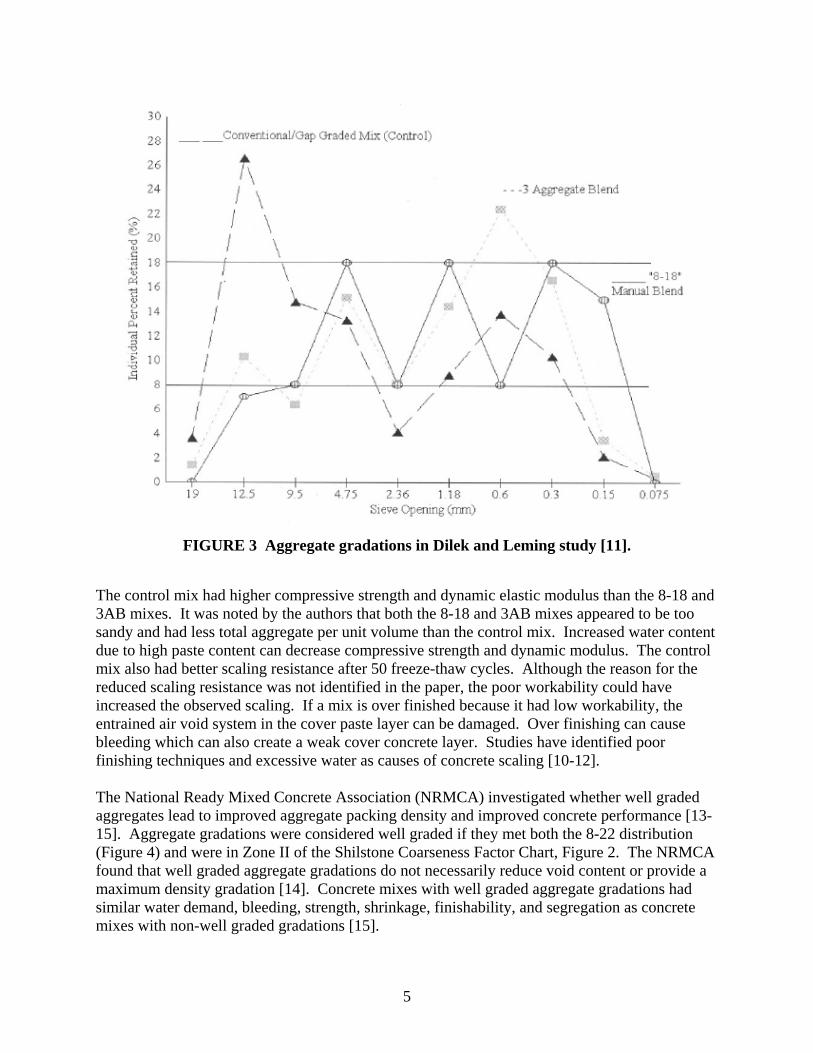
FIGURE 3 Aggregate gradations in Dilek and Leming study [11].
The control mix had higher compressive strength and dynamic elastic modulus than the 8-18 and 3AB mixes. It was noted by the authors that both the 8-18 and 3AB mixes appeared to be too sandy and had less total aggregate per unit volume than the control mix. Increased water content due to high paste content can decrease compressive strength and dynamic modulus. The control mix also had better scaling resistance after 50 freeze-thaw cycles. Although the reason for the reduced scaling resistance was not identified in the paper, the poor workability could have increased the observed scaling. If a mix is over finished because it had low workability, the entrained air void system in the cover paste layer can be damaged. Over finishing can cause bleeding which can also create a weak cover concrete layer. Studies have identified poor finishing techniques and excessive water as causes of concrete scaling [10-12]. The National Ready Mixed Concrete Association (NRMCA) investigated whether well graded aggregates lead to improved aggregate packing density and improved concrete performance [13-15]. Aggregate gradations were considered well graded if they met both the 8-22 distribution (Figure 4) and were in Zone II of the Shilstone Coarseness Factor Chart, Figure 2. The NRMCA found that well graded aggregate gradations do not necessarily reduce void content or provide a maximum density gradation [14]. Concrete mixes with well graded aggregate gradations had similar water demand, bleeding, strength, shrinkage, finishability, and segregation as concrete mixes with non-well graded gradations [15].
5
6
TABLE 1 Dilek and Leming Mixture Composition and Concrete Properties
Control 8-18 3AB Cement (lb/yd3) 656 886 807 Water (lb/yd3) 279 400 377
Total Aggregate (lb/yd3) 2970 2470 2600 WRA (oz/cwt) 2.0 2.9 4.4 AEA (oz/cwt) 0.4 0.7 0.7
Slump (in) 3.75 2 1.75 Air Content (%) 5.4 6.7 6.0
Compressive Strength (psi) 6020 5810 5390 Dynamic Young’s Modulus (ksi) 5440 4480 4560 Scaling Rating (ASTM C 672) 0 2 2
FIGURE 4 8-22 distribution used in NRMCA study.
2.3 Concrete Durability According to Mindness, Young, and Darwin [16], the parameter that has the largest influence on durability is the water/cement (w/c) or water/cementitious (w/cm) ratio. The permeability of concrete and the permeability of the paste decreases as the w/c ratio decreases. Low w/c ratio means lower permeability, therfore lower voids in the concrete. This means that it is more difficult for water, and corrosives, to penetrate the concrete. Concrete permeability influences durability because it controls the rate that moisture, which could contain an aggressive chemical, enters concrete and the movement of water. Decreasing the w/c ratio also increases concrete strength which further improves its resistance to cracking [16]. The Minnesota Department of Transportation (Mn/DOT) requires a w/cm of less then 0.40 with most contractors using w/cm of 0.36 to 0.40 [5].
02468
1012141618202224
2 in
1.5
in
1 in
3/4
in
1/2
in
3/8
in
No.
4
No.
8
No.
16
No.
30
No.
50
No.
100
No.
200
% R
etai
ned
“The low w/c ratio produces a cementitious-paste phase that attains a discontinuous capillary-pore system in a very short curing duration, which in turn rapidly reduces its permeability to external ionic solutions [17].”
Two important durability issues associated with concrete pavements are Alkali Silica Reactivity (ASR) and freeze-thaw durability. Both deterioration mechanisms intensify as water ingress increases. Alkali-silicate gels form in the presence of hydroxyl and alkali-metal ions. The silica structure of the aggregates is broken down by hydroxyl ions. Then the alkali-metal ions are absorbed on the surface of the newly created reaction byproducts. This is then an alkali-silica gel which swells through absorption when it contacts water [16]. Freeze-thaw damage occurs because of the expansion of water when it freezes. This increase in volume induces pressure if it is confined in a closed space such as cement paste pores. If the induced stress is less than the strength of the cement paste, an elastic volume increase will occur which will be removed when the ice turns back into water. If the induced stress is greater than the strength of the paste, a permanent inelastic volume change will occur. This volume change can include cracking and after additional freezing and thawing cycles, ice can form in these cracks and the damage can increase [18]. Deterioration due to frost action only occurs in the presence of moisture. 2.4 Rapid Chloride Ion Permeability ASTM C 1202, Standard Test Method for Electrical Indication of Concrete’s Ability to Resist Chloride Ion Penetration [19], is a test that has become popular for measuring concrete’s permeability. The test consists of monitoring the amount of electrical current that passes through a 2 inch thick slice of a 4 inch diameter core over a six hour period. One end of the core is immersed in a sodium chloride solution and the other in a sodium hydroxide solution. The total charge passed, in coulombs, is then used to relate the resistance of the specimen to chloride ion penetration. Sample age has significant effect on the test results with most concrete’s becoming less permeable with time. Age and curing condition have significant effect on the results as well. The maximum allowable aggregate size for the test has not been established but tests have shown that aggregate sizes up to 1.0 inch have reliable results. The ASTM C 1202 procedure is an indirect measure of concrete’s permeability. It measures concrete’s resistively and then relates it to permeability. Geiker [20] found that there was a linear correlation between coulombs and total porosity of the concrete matrix but blended cements yielded a lower coulomb value without an accompanying reduction in the porosity. Torii [21] suggested that there is a better correlation between coulombs and the volume of pores finer than 0.04 mm than that between coulombs and total porosity. Many sources found that as the resistivity of the concrete decreases, the current increases [20, 22, 23]. Whiting [24] compared the ponding test (ASTM C 1543 [25]) to the Rapid Chloride Permeability (RCP) test and found that the RCP test gives conservative results for 90 day concrete.
Feldman [26] found that applying 60 volts, according to the RCP procedure, to the concrete specimens is very severe, often causing physical and chemical changes to the specimen. Applying high voltages across young concrete can cause high temperatures which accelerate hydration. This accelerated curing may be enhanced by the ingress of chloride ion into the pore
7

solution. The resistance of the pore solution decreases with an increase in temperature. In older concrete, resistivity may decrease and initial current and charge passed increase due to an increase in concentration of ions in the pore solution, resulting in overestimates of concrete permeability. Shi, Stegemann, and Caldwell [27] found that replacing Portland cement with a supplementary cementing material changes the pore structure and solution of concrete. While the pore structure affects the permeability of concrete, the pore solution does not. Using silica fume may reduce the RCP test result by six to 15 times while the actual chloride ingress as measured by the 90 day ponding test may only be one to two times higher. Scanlon and Sherman [28] indicated that the general correlation between chloride ingress and coulomb values appears invalid for use with concretes containing silica fume, fly ash, or high-range water-reducing admixtures. Although the ASTM C 1202 test for measuring concrete permeability has its flaws and limitations, it is still a useful tool in determining concrete permeability. All current testing procedures for measuring concrete permeability have their limitations. The ponding [25] procedure can take years to complete. Hydraulic permeability test methods can be distorted by the suction of dry concrete and moisture content and distort the results of gas permeability tests.
8
Chapter 3 TEST METHOD AND RESULTS
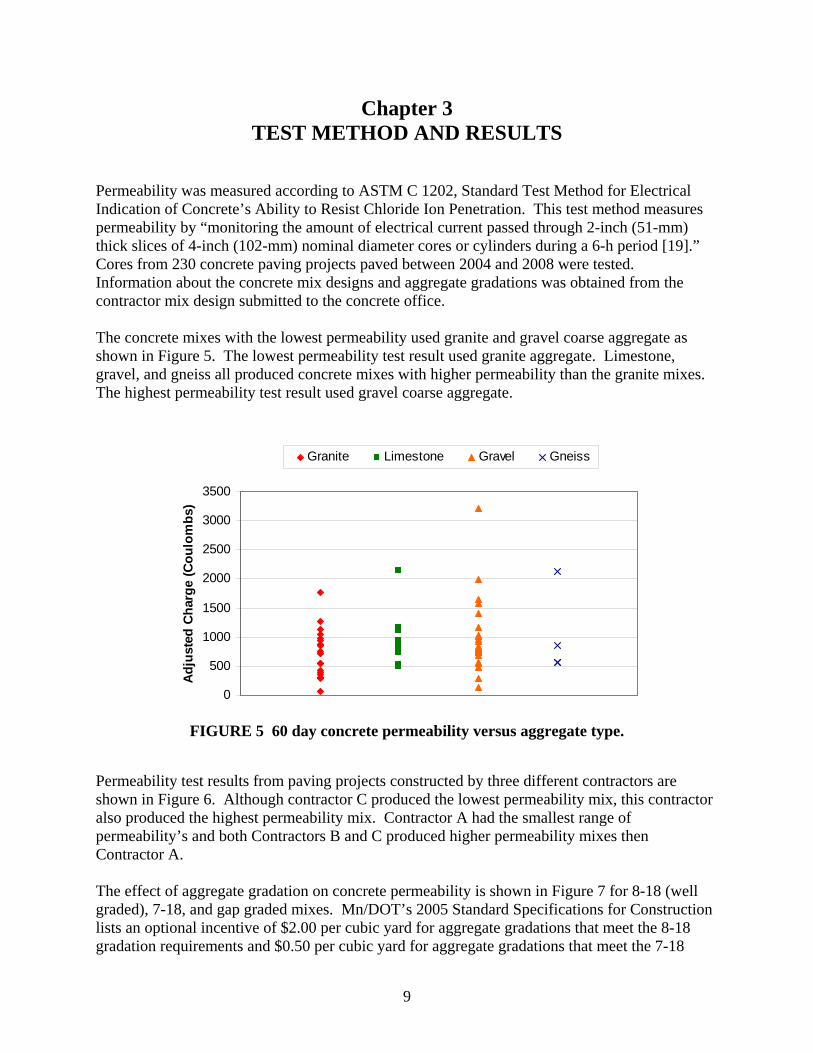
Permeability was measured according to ASTM C 1202, Standard Test Method for Electrical Indication of Concrete’s Ability to Resist Chloride Ion Penetration. This test method measures permeability by “monitoring the amount of electrical current passed through 2-inch (51-mm) thick slices of 4-inch (102-mm) nominal diameter cores or cylinders during a 6-h period [19].” Cores from 230 concrete paving projects paved between 2004 and 2008 were tested. Information about the concrete mix designs and aggregate gradations was obtained from the contractor mix design submitted to the concrete office. The concrete mixes with the lowest permeability used granite and gravel coarse aggregate as shown in Figure 5. The lowest permeability test result used granite aggregate. Limestone, gravel, and gneiss all produced concrete mixes with higher permeability than the granite mixes. The highest permeability test result used gravel coarse aggregate.
0
500
1000
1500
2000
2500
3000
3500
Adju
sted
Cha
rge
(Cou
lom
bs)
Granite Limestone Gravel Gneiss
FIGURE 5 60 day concrete permeability versus aggregate type.
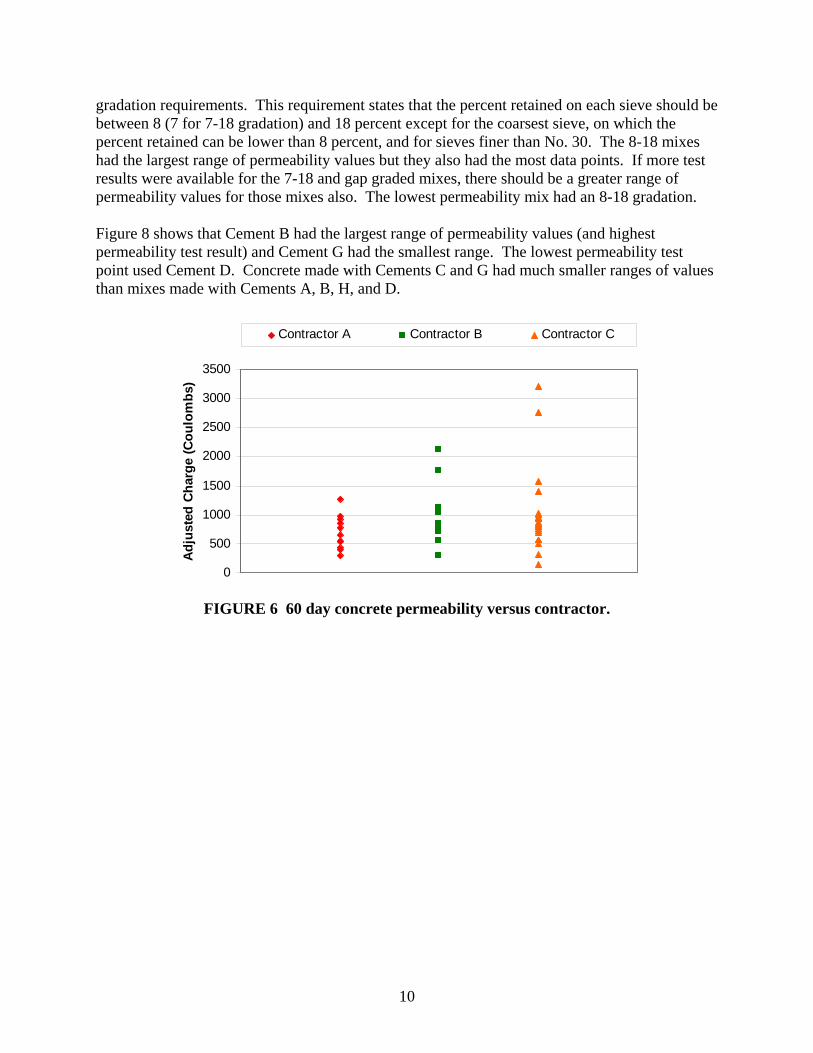
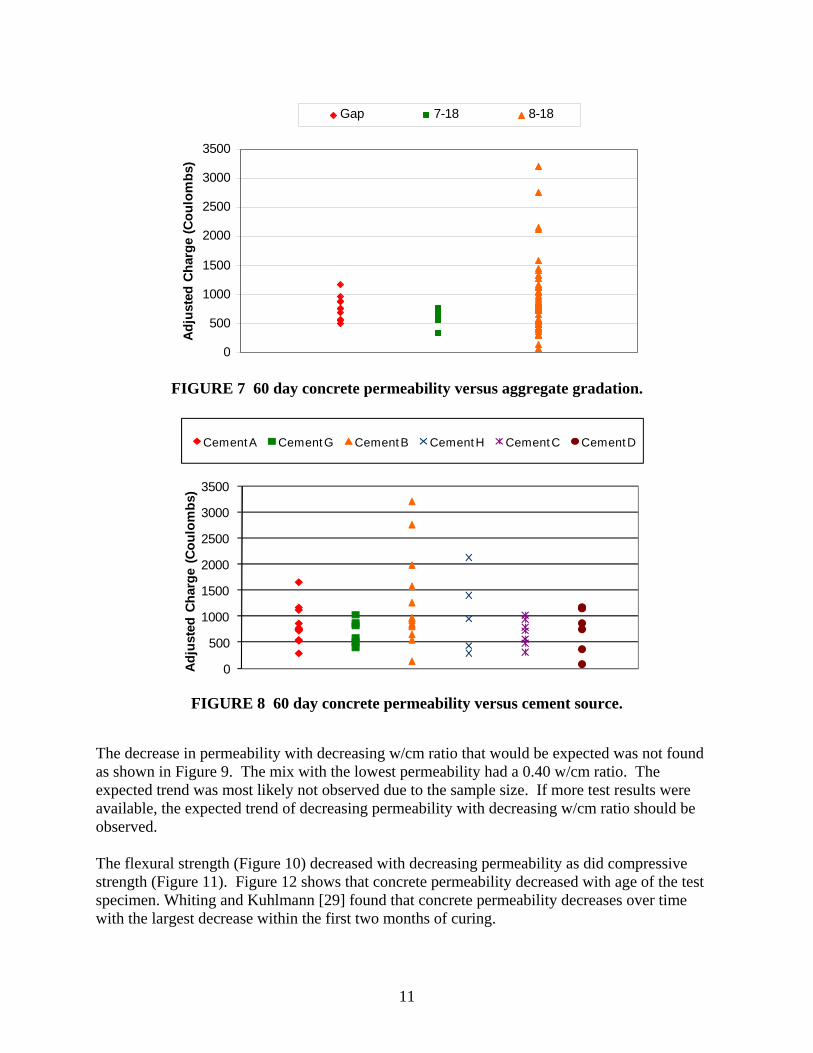
Permeability test results from paving projects constructed by three different contractors are shown in Figure 6. Although contractor C produced the lowest permeability mix, this contractor also produced the highest permeability mix. Contractor A had the smallest range of permeability’s and both Contractors B and C produced higher permeability mixes then Contractor A. The effect of aggregate gradation on concrete permeability is shown in Figure 7 for 8-18 (well graded), 7-18, and gap graded mixes. Mn/DOT’s 2005 Standard Specifications for Construction lists an optional incentive of $2.00 per cubic yard for aggregate gradations that meet the 8-18 gradation requirements and $0.50 per cubic yard for aggregate gradations that meet the 7-18
9
gradation requirements. This requirement states that the percent retained on each sieve should be between 8 (7 for 7-18 gradation) and 18 percent except for the coarsest sieve, on which the percent retained can be lower than 8 percent, and for sieves finer than No. 30. The 8-18 mixes had the largest range of permeability values but they also had the most data points. If more test results were available for the 7-18 and gap graded mixes, there should be a greater range of permeability values for those mixes also. The lowest permeability mix had an 8-18 gradation. Figure 8 shows that Cement B had the largest range of permeability values (and highest permeability test result) and Cement G had the smallest range. The lowest permeability test point used Cement D. Concrete made with Cements C and G had much smaller ranges of values than mixes made with Cements A, B, H, and D.
0
500
1000
1500
2000
2500
3000
3500
Adju
sted
Cha
rge
(Cou
lom
bs)
Contractor A Contractor B Contractor C
FIGURE 6 60 day concrete permeability versus contractor.
10
0
500
1000
1500
2000
2500
3000
3500
Adju
sted
Cha
rge
(Cou
lom
bs)
Gap 7-18 8-18
FIGURE 7 60 day concrete permeability versus aggregate gradation.
FIGURE 8 60 day concrete permeability versus cement source.
0
500
1000
1500
2000
2500
3000
3500
Adju
sted
Cha
rge
(Cou
lom
bs)
Cement A Cement G Cement B Cement H Cement C Cement D
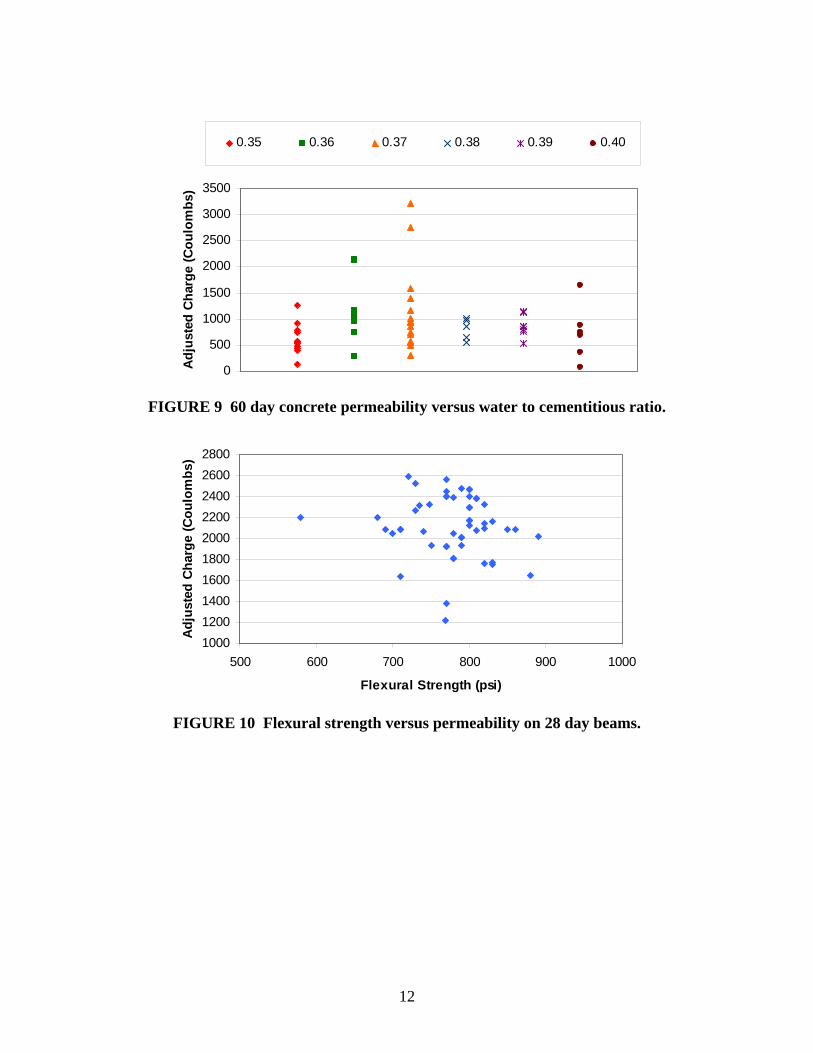
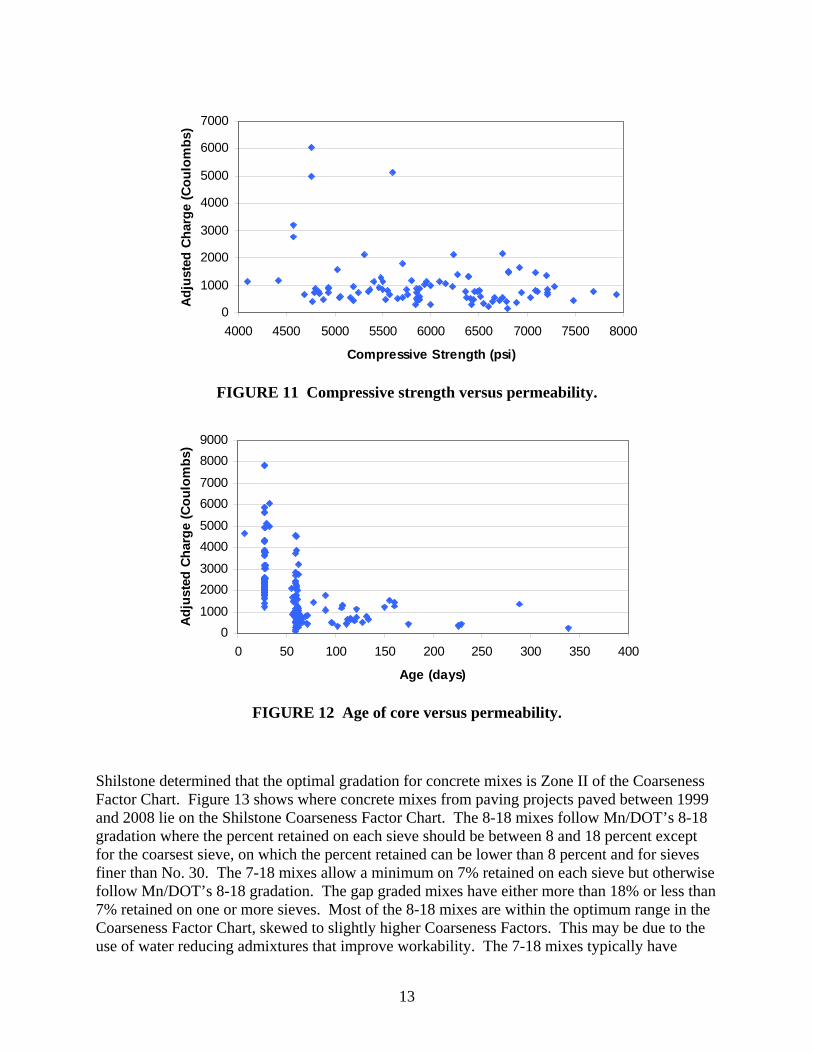
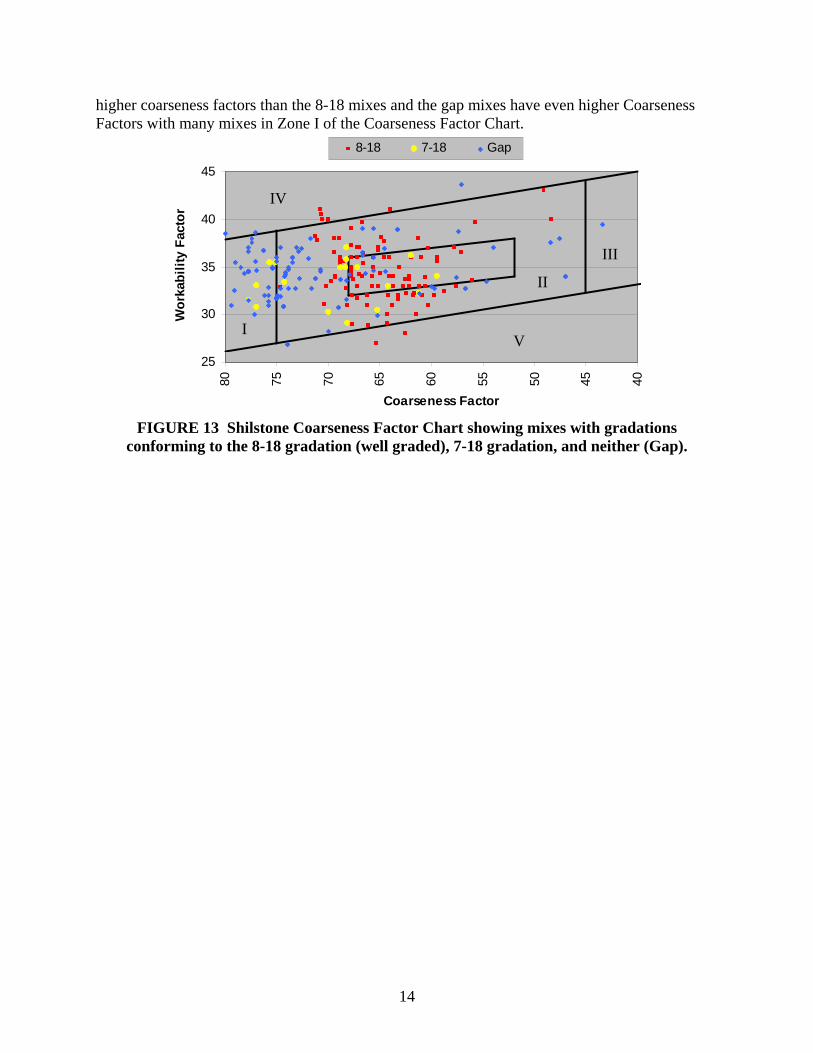
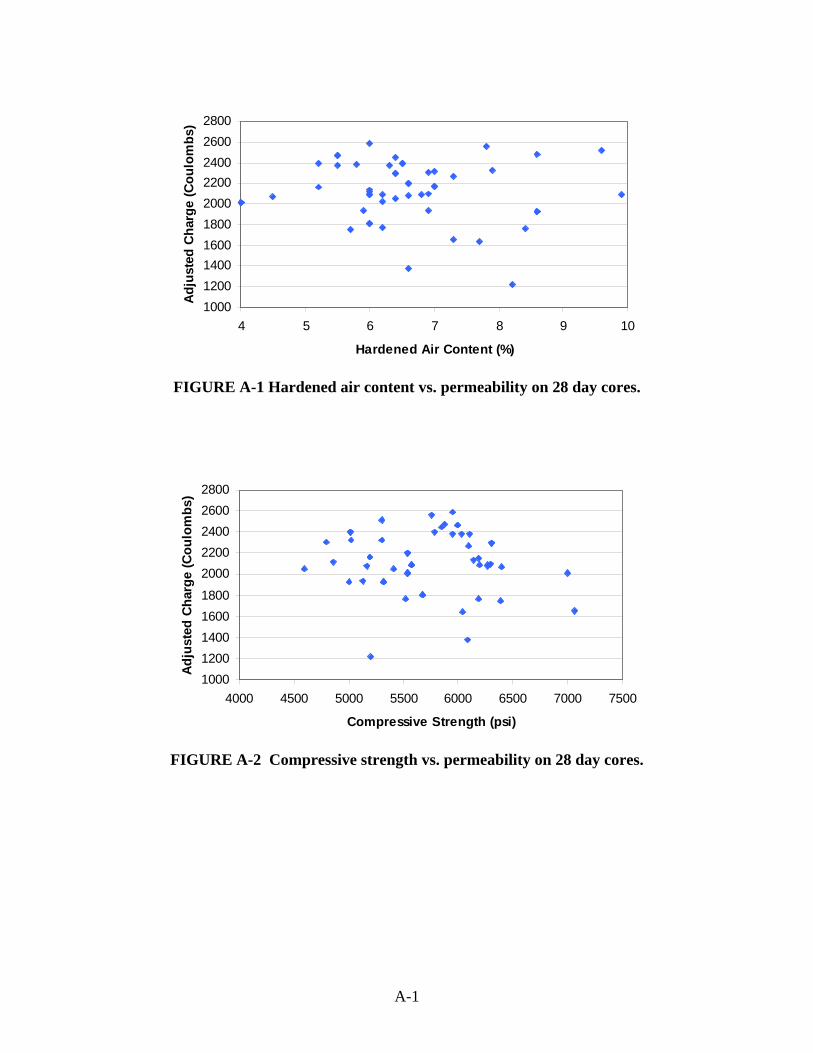
The decrease in permeability with decreasing w/cm ratio that would be expected was not found as shown in Figure 9. The mix with the lowest permeability had a 0.40 w/cm ratio. The expected trend was most likely not observed due to the sample size. If more test results were available, the expected trend of decreasing permeability with decreasing w/cm ratio should be observed. The flexural strength (Figure 10) decreased with decreasing permeability as did compressive strength (Figure 11). Figure 12 shows that concrete permeability decreased with age of the test specimen. Whiting and Kuhlmann [29] found that concrete permeability decreases over time with the largest decrease within the first two months of curing.
11
0
500
1000
1500
2000
2500
3000
3500Ad
just
ed C
harg
e (C
oulo
mbs
)
0.35 0.36 0.37 0.38 0.39 0.40
FIGURE 9 60 day concrete permeability versus water to cementitious ratio.
1000120014001600180020002200240026002800
500 600 700 800 900 1000
Flexural Strength (psi)
Adj
uste
d Ch
arge
(Cou
lom
bs)
FIGURE 10 Flexural strength versus permeability on 28 day beams.
12
0
1000
2000
3000
4000
5000
6000
7000
4000 4500 5000 5500 6000 6500 7000 7500 8000
Compressive Strength (psi)
Adju
sted
Cha
rge
(Cou
lom
bs)
FIGURE 11 Compressive strength versus permeability.
01000
20003000
40005000
60007000
80009000
0 50 100 150 200 250 300 350 400
Age (days)
Adj
uste
d Ch
arge
(Cou
lom
bs)
FIGURE 12 Age of core versus permeability.
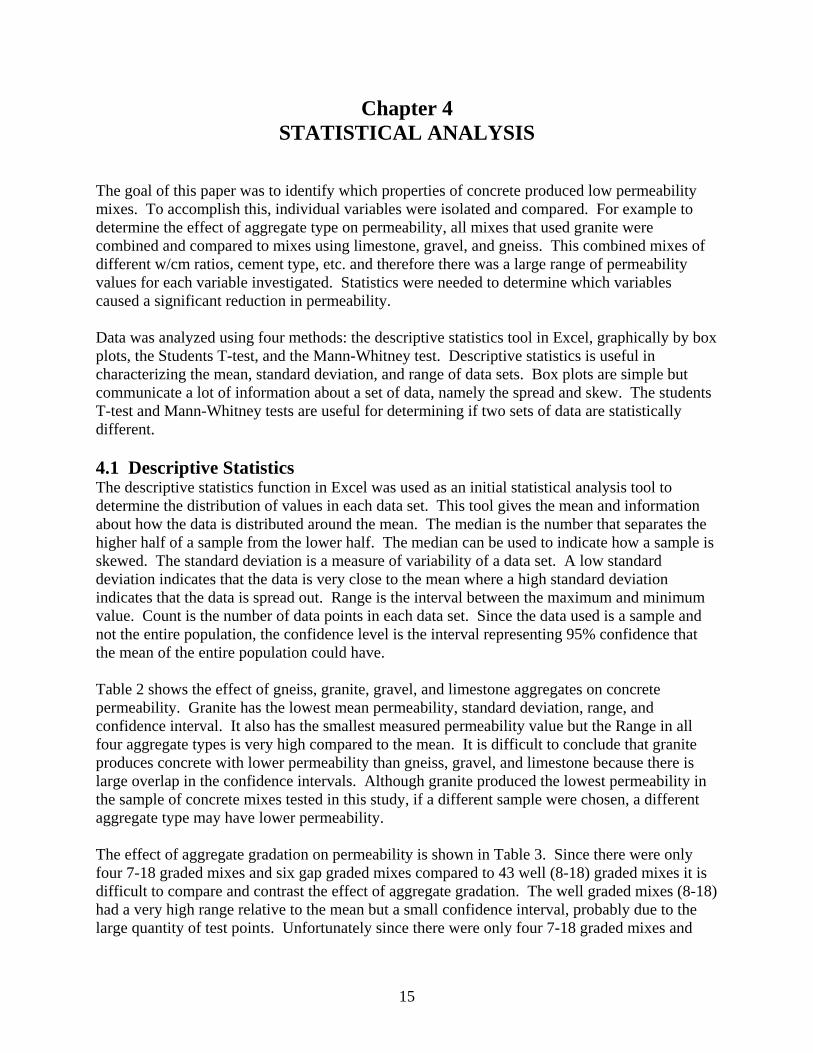
Shilstone determined that the optimal gradation for concrete mixes is Zone II of the Coarseness Factor Chart. Figure 13 shows where concrete mixes from paving projects paved between 1999 and 2008 lie on the Shilstone Coarseness Factor Chart. The 8-18 mixes follow Mn/DOT’s 8-18 gradation where the percent retained on each sieve should be between 8 and 18 percent except for the coarsest sieve, on which the percent retained can be lower than 8 percent and for sieves finer than No. 30. The 7-18 mixes allow a minimum on 7% retained on each sieve but otherwise follow Mn/DOT’s 8-18 gradation. The gap graded mixes have either more than 18% or less than 7% retained on one or more sieves. Most of the 8-18 mixes are within the optimum range in the Coarseness Factor Chart, skewed to slightly higher Coarseness Factors. This may be due to the use of water reducing admixtures that improve workability. The 7-18 mixes typically have
13
higher coarseness factors than the 8-18 mixes and the gap mixes have even higher Coarseness Factors with many mixes in Zone I of the Coarseness Factor Chart.
25
30
35
40
45
404550556065707580
Coarseness Factor
Wor
kabi
lity
Fact
or
8-18 7-18 Gap
IV
III
II
I V
FIGURE 13 Shilstone Coarseness Factor Chart showing mixes with gradations conforming to the 8-18 gradation (well graded), 7-18 gradation, and neither (Gap).
14
Chapter 4 STATISTICAL ANALYSIS
The goal of this paper was to identify which properties of concrete produced low permeability mixes. To accomplish this, individual variables were isolated and compared. For example to determine the effect of aggregate type on permeability, all mixes that used granite were combined and compared to mixes using limestone, gravel, and gneiss. This combined mixes of different w/cm ratios, cement type, etc. and therefore there was a large range of permeability values for each variable investigated. Statistics were needed to determine which variables caused a significant reduction in permeability. Data was analyzed using four methods: the descriptive statistics tool in Excel, graphically by box plots, the Students T-test, and the Mann-Whitney test. Descriptive statistics is useful in characterizing the mean, standard deviation, and range of data sets. Box plots are simple but communicate a lot of information about a set of data, namely the spread and skew. The students T-test and Mann-Whitney tests are useful for determining if two sets of data are statistically different. 4.1 Descriptive Statistics The descriptive statistics function in Excel was used as an initial statistical analysis tool to determine the distribution of values in each data set. This tool gives the mean and information about how the data is distributed around the mean. The median is the number that separates the higher half of a sample from the lower half. The median can be used to indicate how a sample is skewed. The standard deviation is a measure of variability of a data set. A low standard deviation indicates that the data is very close to the mean where a high standard deviation indicates that the data is spread out. Range is the interval between the maximum and minimum value. Count is the number of data points in each data set. Since the data used is a sample and not the entire population, the confidence level is the interval representing 95% confidence that the mean of the entire population could have. Table 2 shows the effect of gneiss, granite, gravel, and limestone aggregates on concrete permeability. Granite has the lowest mean permeability, standard deviation, range, and confidence interval. It also has the smallest measured permeability value but the Range in all four aggregate types is very high compared to the mean. It is difficult to conclude that granite produces concrete with lower permeability than gneiss, gravel, and limestone because there is large overlap in the confidence intervals. Although granite produced the lowest permeability in the sample of concrete mixes tested in this study, if a different sample were chosen, a different aggregate type may have lower permeability. The effect of aggregate gradation on permeability is shown in Table 3. Since there were only four 7-18 graded mixes and six gap graded mixes compared to 43 well (8-18) graded mixes it is difficult to compare and contrast the effect of aggregate gradation. The well graded mixes (8-18) had a very high range relative to the mean but a small confidence interval, probably due to the large quantity of test points. Unfortunately since there were only four 7-18 graded mixes and
15
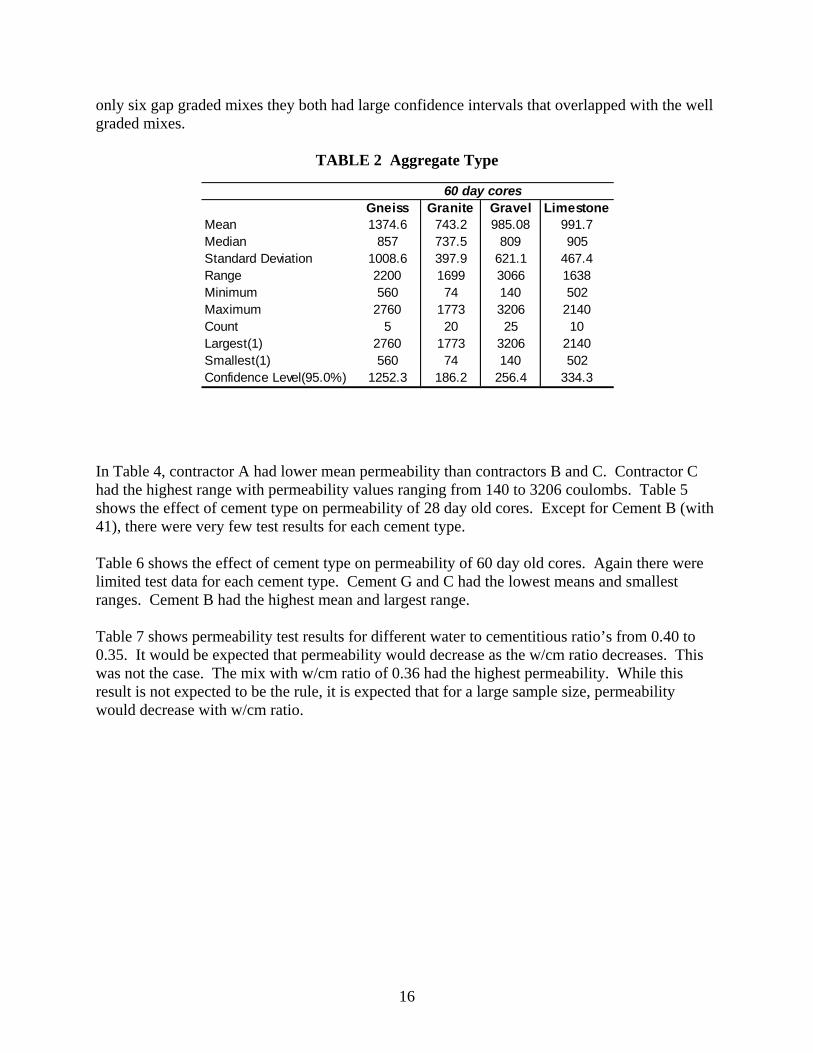
only six gap graded mixes they both had large confidence intervals that overlapped with the well graded mixes.
TABLE 2 Aggregate Type
60 day coresGneiss Granite Gravel Limestone
Mean 1374.6 743.2 985.08 991.7Median 857 737.5 809 905Standard Deviation 1008.6 397.9 621.1 467.4Range 2200 1699 3066 1638Minimum 560 74 140 502Maximum 2760 1773 3206 2140Count 5 20 25 10Largest(1) 2760 1773 3206 2140Smallest(1) 560 74 140 502Confidence Level(95.0%) 1252.3 186.2 256.4 334.3
In Table 4, contractor A had lower mean permeability than contractors B and C. Contractor C had the highest range with permeability values ranging from 140 to 3206 coulombs. Table 5 shows the effect of cement type on permeability of 28 day old cores. Except for Cement B (with 41), there were very few test results for each cement type. Table 6 shows the effect of cement type on permeability of 60 day old cores. Again there were limited test data for each cement type. Cement G and C had the lowest means and smallest ranges. Cement B had the highest mean and largest range. Table 7 shows permeability test results for different water to cementitious ratio’s from 0.40 to 0.35. It would be expected that permeability would decrease as the w/cm ratio decreases. This was not the case. The mix with w/cm ratio of 0.36 had the highest permeability. While this result is not expected to be the rule, it is expected that for a large sample size, permeability would decrease with w/cm ratio.
16
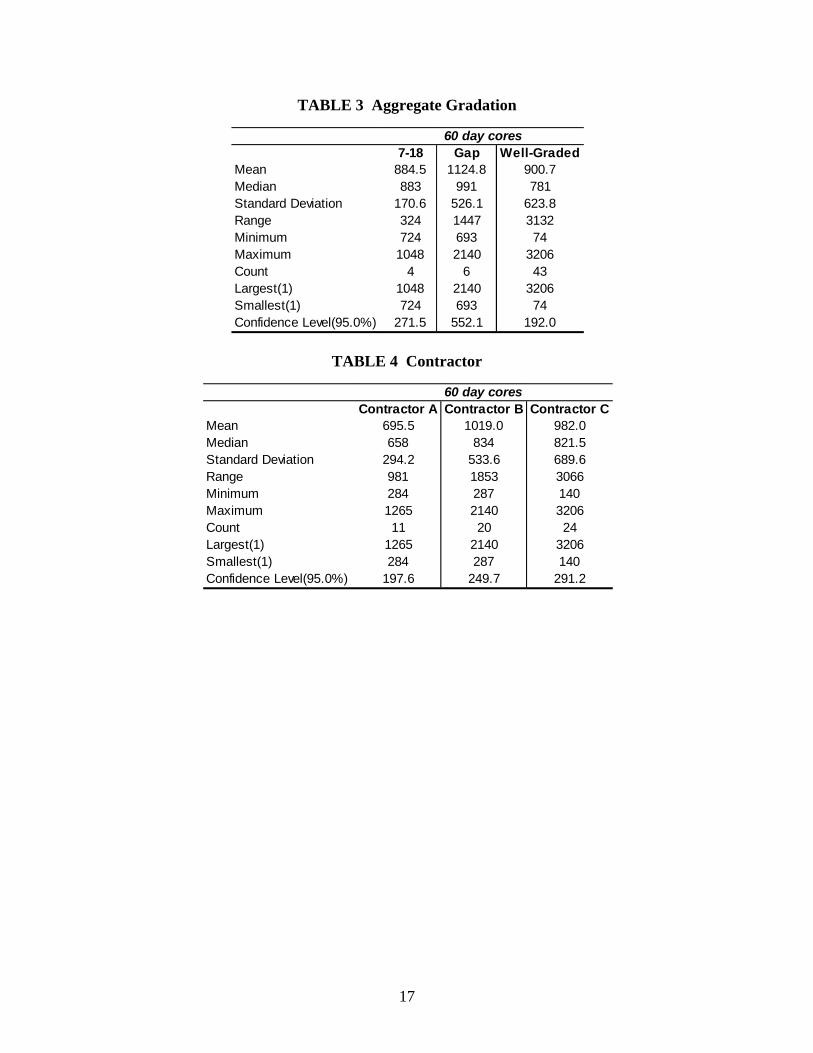
TABLE 3 Aggregate Gradation
60 day cores7-18 Gap Well-Graded
Mean 884.5 1124.8 900.7Median 883 991 781Standard Deviation 170.6 526.1 623.8Range 324 1447 3132Minimum 724 693 74Maximum 1048 2140 3206Count 4 6 43Largest(1) 1048 2140 3206Smallest(1) 724 693 74Confidence Level(95.0%) 271.5 552.1 192.0
TABLE 4 Contractor
60 day coresContractor A Contractor B Contractor C
Mean 695.5 1019.0 982.0Median 658 834 821.5Standard Deviation 294.2 533.6 689.6Range 981 1853 3066Minimum 284 287 140Maximum 1265 2140 3206Count 11 20 24Largest(1) 1265 2140 3206Smallest(1) 284 287 140Confidence Level(95.0%) 197.6 249.7 291.2
17

TABLE 5 Cement Type on 28 Day Cores
28 day coresCement A Cement B Cement C Cement D Cement E Cement F
Mean 1822.5 2857.5 2321.7 1940.0 2385.0 2215.0Median 1895 2325 2380 1925 2385 2185Standard Deviation 335.1 1324.6 162.5 287.2 98.1 122.0Range 740 6173 430 630 170 310Minimum 1380 1650 2090 1640 2300 2090Maximum 2120 7823 2520 2270 2470 2400Count 4 41 6 4 4 8Largest(1) 2120 7823 2520 2270 2470 2400Smallest(1) 1380 1650 2090 1640 2300 2090Confidence Level(95.0%) 533.2 418.1 170.6 457.0 156.2 102.0
TABLE 6 Cement Type on 60 Day Cores
60 day coresCement A Cement G Cement B Cement H Cement C Cement D
Mean 818.8 692.8 1250.6 1039.0 681.1 724.7Median 751 690 941.5 948 717 800.5Standard Deviation 339.9 240.7 859.8 752.2 228.0 435.4Range 1367 626 3066 1844 712 1101Minimum 287 396 140 284 303 74Maximum 1654 1022 3206 2128 1015 1175Count 13 6 14 5 9 6Largest(1) 1654 1022 3206 2128 1015 1175Smallest(1) 287 396 140 284 303 74Confidence Level(95.0%) 205.4 252.6 496.4 934.0 175.2 456.9
18
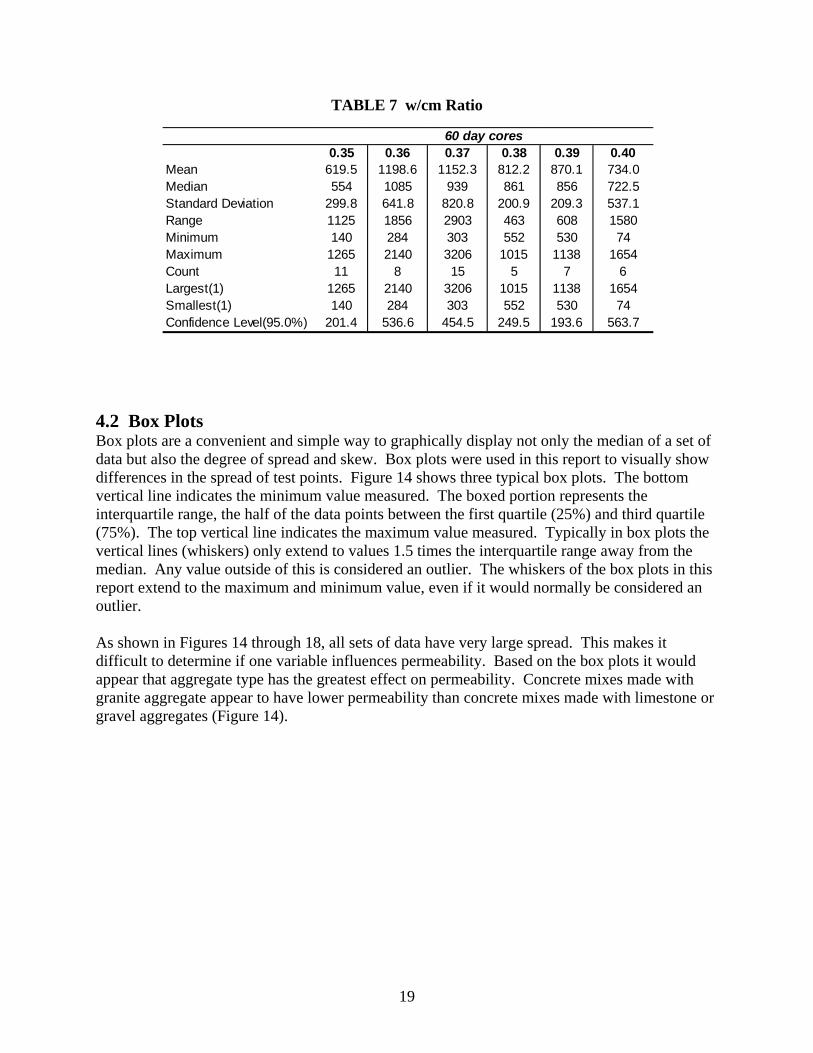
TABLE 7 w/cm Ratio
60 day cores0.35 0.36 0.37 0.38 0.39 0.40
Mean 619.5 1198.6 1152.3 812.2 870.1 734.0Median 554 1085 939 861 856 722.5Standard Deviation 299.8 641.8 820.8 200.9 209.3 537.1Range 1125 1856 2903 463 608 1580Minimum 140 284 303 552 530 74Maximum 1265 2140 3206 1015 1138 1654Count 11 8 15 5 7 6Largest(1) 1265 2140 3206 1015 1138 1654Smallest(1) 140 284 303 552 530 74Confidence Level(95.0%) 201.4 536.6 454.5 249.5 193.6 563.7
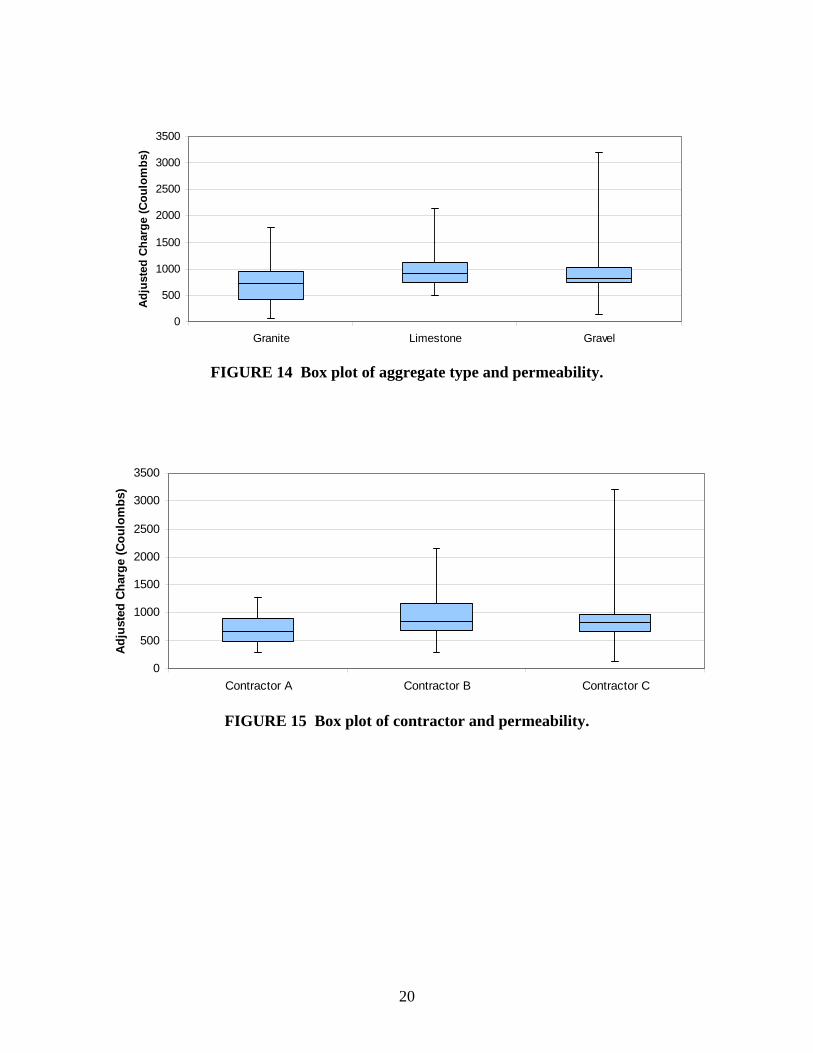
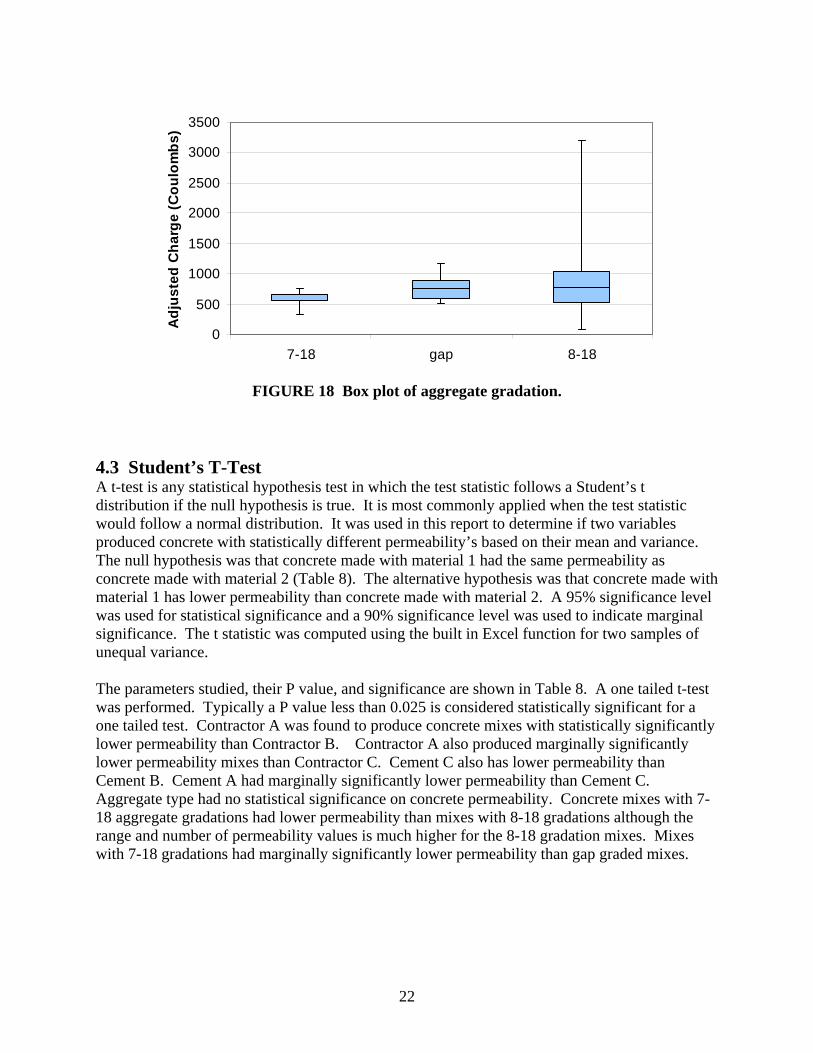
4.2 Box Plots Box plots are a convenient and simple way to graphically display not only the median of a set of data but also the degree of spread and skew. Box plots were used in this report to visually show differences in the spread of test points. Figure 14 shows three typical box plots. The bottom vertical line indicates the minimum value measured. The boxed portion represents the interquartile range, the half of the data points between the first quartile (25%) and third quartile (75%). The top vertical line indicates the maximum value measured. Typically in box plots the vertical lines (whiskers) only extend to values 1.5 times the interquartile range away from the median. Any value outside of this is considered an outlier. The whiskers of the box plots in this report extend to the maximum and minimum value, even if it would normally be considered an outlier. As shown in Figures 14 through 18, all sets of data have very large spread. This makes it difficult to determine if one variable influences permeability. Based on the box plots it would appear that aggregate type has the greatest effect on permeability. Concrete mixes made with granite aggregate appear to have lower permeability than concrete mixes made with limestone or gravel aggregates (Figure 14).
19
0
500
1000
1500
2000
2500
3000
3500
Granite Limestone Gravel
Adju
sted
Cha
rge
(Cou
lom
bs)
FIGURE 14 Box plot of aggregate type and permeability.
0
500
1000
1500
2000
2500
3000
3500
Contractor A Contractor B Contractor C
Adju
sted
Cha
rge
(Cou
lom
bs)
FIGURE 15 Box plot of contractor and permeability.
20
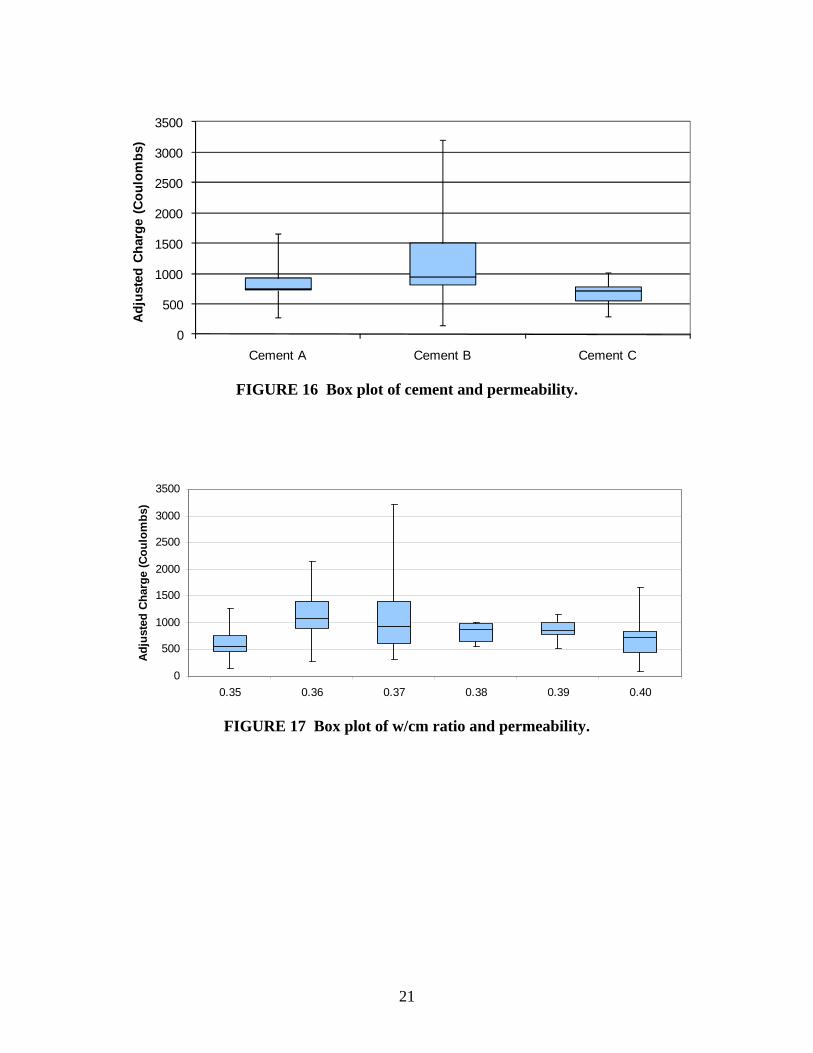
FIGURE 16 Box plot of cement and permeability.
0
500
1000
1500
2000
2500
3000
3500
Cement A Cement B Cement C
Adj
uste
d C
harg
e (C
oulo
mbs
)
0
500
1000
1500
2000
2500
3000
3500
0.35 0.36 0.37 0.38 0.39 0.40
Adj
uste
d C
harg
e (C
oulo
mbs
)
FIGURE 17 Box plot of w/cm ratio and permeability.
21
0
500
1000
1500
2000
2500
3000
3500
7-18 gap 8-18
Adj
uste
d C
harg
e (C
oulo
mbs
)
FIGURE 18 Box plot of aggregate gradation.
4.3 Student’s T-Test A t-test is any statistical hypothesis test in which the test statistic follows a Student’s t distribution if the null hypothesis is true. It is most commonly applied when the test statistic would follow a normal distribution. It was used in this report to determine if two variables produced concrete with statistically different permeability’s based on their mean and variance. The null hypothesis was that concrete made with material 1 had the same permeability as concrete made with material 2 (Table 8). The alternative hypothesis was that concrete made with material 1 has lower permeability than concrete made with material 2. A 95% significance level was used for statistical significance and a 90% significance level was used to indicate marginal significance. The t statistic was computed using the built in Excel function for two samples of unequal variance. The parameters studied, their P value, and significance are shown in Table 8. A one tailed t-test was performed. Typically a P value less than 0.025 is considered statistically significant for a one tailed test. Contractor A was found to produce concrete mixes with statistically significantly lower permeability than Contractor B. Contractor A also produced marginally significantly lower permeability mixes than Contractor C. Cement C also has lower permeability than Cement B. Cement A had marginally significantly lower permeability than Cement C. Aggregate type had no statistical significance on concrete permeability. Concrete mixes with 7-18 aggregate gradations had lower permeability than mixes with 8-18 gradations although the range and number of permeability values is much higher for the 8-18 gradation mixes. Mixes with 7-18 gradations had marginally significantly lower permeability than gap graded mixes.
22
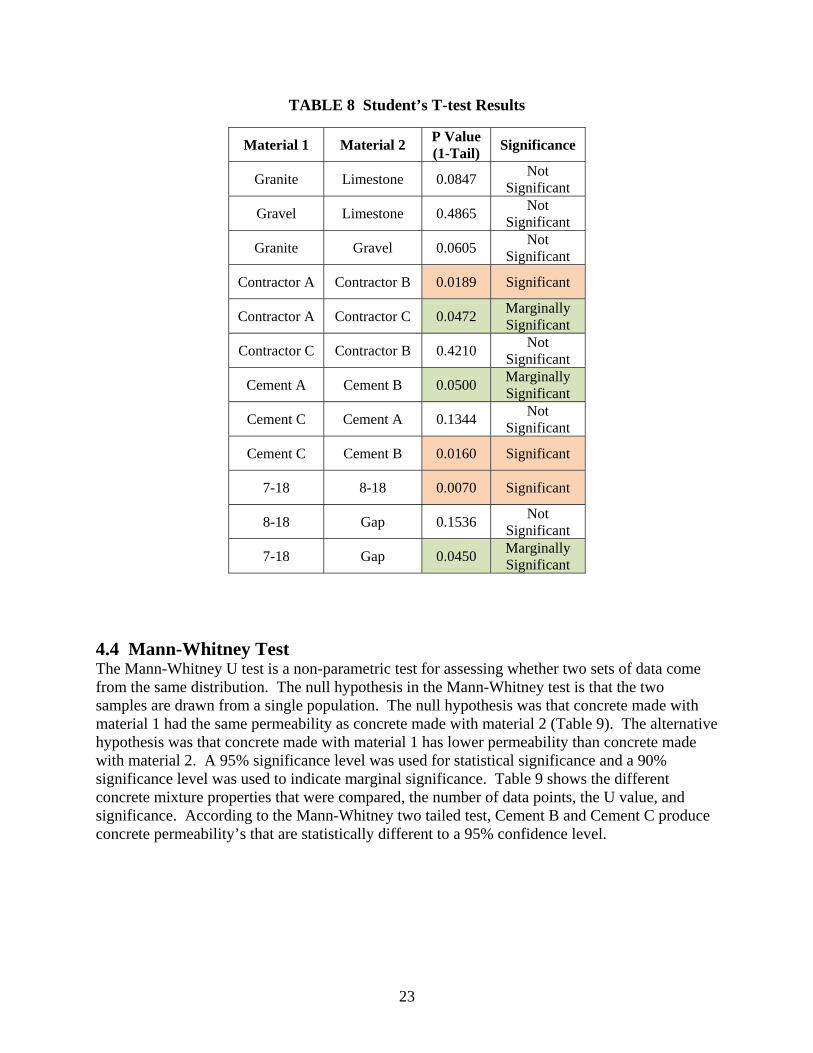
TABLE 8 Student’s T-test Results
Material 1 Material 2 P Value (1-Tail) Significance
Granite Limestone 0.0847 Not Significant
Gravel Limestone 0.4865 Not Significant
Granite Gravel 0.0605 Not Significant
Contractor A Contractor B 0.0189 Significant
Contractor A Contractor C 0.0472 Marginally Significant
Contractor C Contractor B 0.4210 Not Significant
Cement A Cement B 0.0500 Marginally Significant
Cement C Cement A 0.1344 Not Significant
Cement C Cement B 0.0160 Significant
7-18 8-18 0.0070 Significant
8-18 Gap 0.1536 Not Significant
7-18 Gap 0.0450 Marginally Significant
4.4 Mann-Whitney Test The Mann-Whitney U test is a non-parametric test for assessing whether two sets of data come from the same distribution. The null hypothesis in the Mann-Whitney test is that the two samples are drawn from a single population. The null hypothesis was that concrete made with material 1 had the same permeability as concrete made with material 2 (Table 9). The alternative hypothesis was that concrete made with material 1 has lower permeability than concrete made with material 2. A 95% significance level was used for statistical significance and a 90% significance level was used to indicate marginal significance. Table 9 shows the different concrete mixture properties that were compared, the number of data points, the U value, and significance. According to the Mann-Whitney two tailed test, Cement B and Cement C produce concrete permeability’s that are statistically different to a 95% confidence level.
23
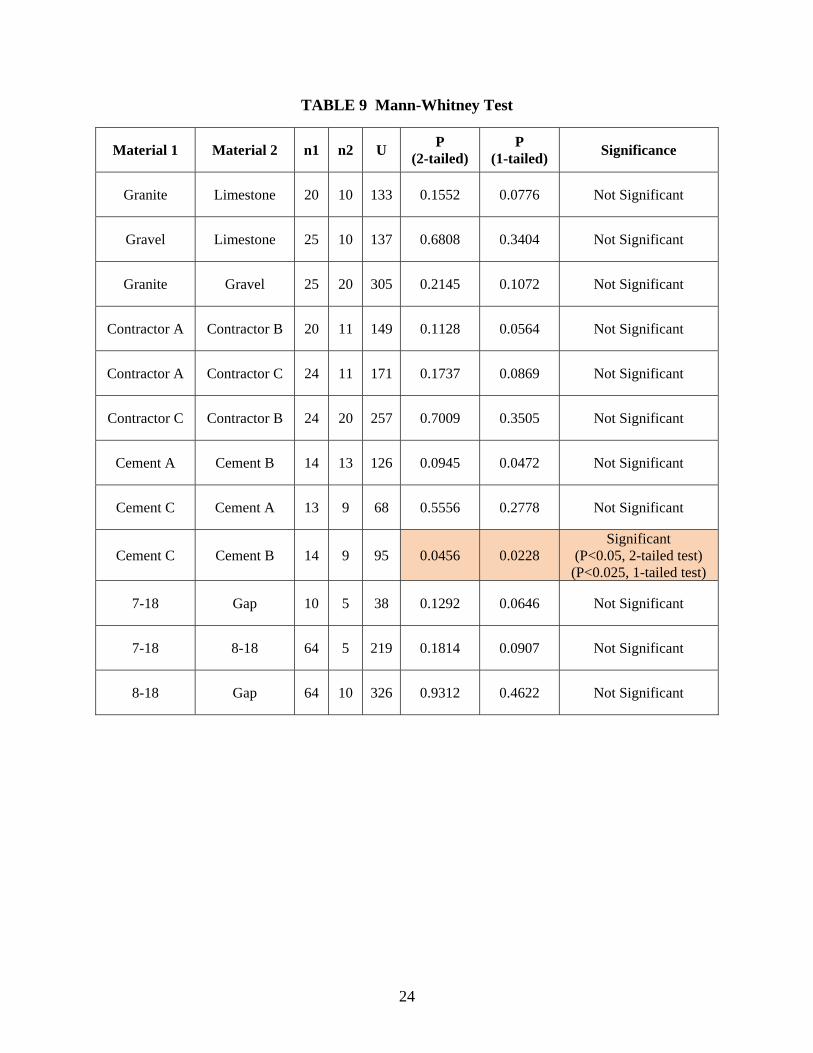
TABLE 9 Mann-Whitney Test
Material 1 Material 2 n1 n2 U P (2-tailed)
P (1-tailed) Significance
Granite Limestone 20 10 133 0.1552 0.0776 Not Significant
Gravel Limestone 25 10 137 0.6808 0.3404 Not Significant
Granite Gravel 25 20 305 0.2145 0.1072 Not Significant
Contractor A Contractor B 20 11 149 0.1128 0.0564 Not Significant
Contractor A Contractor C 24 11 171 0.1737 0.0869 Not Significant
Contractor C Contractor B 24 20 257 0.7009 0.3505 Not Significant
Cement A Cement B 14 13 126 0.0945 0.0472 Not Significant
Cement C Cement A 13 9 68 0.5556 0.2778 Not Significant
Cement C Cement B 14 9 95 0.0456 0.0228 Significant
(P<0.05, 2-tailed test) (P<0.025, 1-tailed test)
7-18 Gap 10 5 38 0.1292 0.0646 Not Significant
7-18 8-18 64 5 219 0.1814 0.0907 Not Significant
8-18 Gap 64 10 326 0.9312 0.4622 Not Significant
24
Chapter 5 CONCLUSION AND RECOMMENDATIONS
5.1 Conclusion This report analyzed 230 concrete mixes from Minnesota paving projects paved between 2004 and 2008. For each of the mixes, concrete permeability was measured by ASTM 1202 Standard Test Method for Electrical Indication of Concrete’s Ability to Resist Chloride Ion Penetration. Concrete permeability was used to evaluate aggregate gradation, coarse aggregate type, cement source, contractor, and water to cementitious ratio. The descriptive statistics function in Excel, box plots, Student’s T-test, and Mann-Whitney were used to determine which variables caused statistically significant changes to concrete permeability. A literature review of concrete aggregate proportioning methods and the effect of aggregate gradation on concrete properties was included. Previous studies showed that aggregate gradations conforming to 8-18 specifications do not always produce denser graded aggregates or concrete with better properties (higher strength, better finishability, greater freeze-thaw durability) than gradations that do not meet the 8-18 specification [13-15]. It was found that 8-18 gradations do not always produce denser graded aggregates than non 8-18 gradations. The 8-18 gradation chart allows for a wide range of aggregate gradations, some of which may produce concrete with poor properties if 8 and 18 percent is retained on alternating sieves. These mixes would still be eligible for incentives under the 2005 Mn/DOT Standard Specifications for Construction. Based on the box plots and descriptive statistics, granite produced concrete with lower permeability than limestone and gravel. According to the Student’s T-test with a 95% significance level, Contractor A produced concrete with significantly lower permeability than Contractor B, Cement C produced concrete with significantly lower permeability than Cement B, and the 7-18 gradation produced concrete with significantly lower permeability than the 8-18 gradation. According to the Student’s T-test with a 90% significance level, Contractor A produced concrete with significantly lower permeability than Contractor C, Cement A produced concrete with significantly lower permeability than Cement B, and the 7-18 gradation produced concrete with significantly lower permeability than gap graded mixes. Based on Mann-Whitney with a 95% significance level, Cement C produced concrete with lower permeability than Cement B. 5.2 Recommendations Paying incentives or requiring aggregate gradations that meet the 8-18 requirements may not be necessary to produce concrete mixes with low permeability. While concrete mixes with 8-18 gradations can have low permeability, this requirement does not insure low permeability. Previous studies have shown the 8-18 graded aggregates do not always have denser gradations than non 8-18 graded aggregates. Concrete permeability depends on many factors and performance based specifications may be a more direct way to insure low permeability than specifying aggregate gradation and w/cm ratio.
25
REFERENCES
1. ACI Committee 211 (1991). Standard Practice for Selecting Proportions for Normal, Heavyweight and Mass Concrete, ACI 211.1-91, American Concrete Institute, Farmington Hills, MI.
2. ASTM C 33 (2003). Standard Specification for Concrete Aggregates, American Society
for Testing and Materials, Philadelphia, PA.
3. B. Hudson (2003). “Blending Manufactured Sands for Concrete,” Proceedings, Eleventh Annual International Center for Aggregates Research Symposium, Denver, CO.
4. P. Nel Quiroga and D. W. Fowler (2004). The Effects of Aggregates Characteristics on
the Performance of Portland Cement Concrete, Report No. ICAR 104-1F, International Center for Aggregates Research, Austin, TX.
5. T. Burnham, B. Izevbekhai, and P.R. Rangaraju (2006). “The Evolution of High-
Performance Concrete Pavement Design in Minnesota,” Proceedings of the International Conference on Long-Life Concrete Pavements, Chicago, IL, pp. 135-151.
6. J.M. Shilstone, Sr. (1990). “Concrete Mixture Optimization,” Concrete International,
Vol. 12, No. 6, pp. 33-39.
7. J.M. Shilstone, Sr. and J.M. Shilstone, Jr. (2002). “Performance-Based Concrete Mixtures and Specification for Today,” Concrete International, Vol. 24, No. 2, pp. 80-83.
8. U. Dilek and M.L. Leming (2005). “Effects of Proposed Well-Graded Aggregate
Gradations on Frost Durability of Concrete,” Journal of ASTM International, Vol. 2, No. 5, ASTM International, West Conshohocken, PA.
9. M.S. Mamlouk and J.P. Zaniewski (1999). Materials for Civil and Construction
Engineers, Addison Wesley Longman, Inc., Menlo Park, CA.
10. D. Lankard (2001). “Scaling Revisited,” Concrete International, Vol. 23, No. 5, pp. 43-49.
11. F.W. Madderom (1980). “How to Eliminate Concrete Scaling,” Concrete International,
Vol. 2, No. 2, pp. 110-114.
12. M. Pigeon, C. Talbot, J. Marchand, and H. Hornain (1996). “Surface Microstructure and Scaling Resistance of Concrete,” Cement and Concrete Research, Vol. 26, No. 10, pp. 1555-1566.
13. K.H. Obla and H. Kim (2008). “On Aggregate Grading,” Concrete International, Vol.
30, No. 3, pp. 45-50.
26
27
14. K. Obla, H. Kim, and C. Lobo (2007). Effect of Continuous (Well-Graded) Combined
Aggregate Grading on Concrete Performance Phase A: Aggregate Voids Content (Packing Density), National Ready Mixed Concrete Association, Silver Spring, MD, 29 pp.
15. K. Obla, H. Kim, and C. Lobo (2007). Effect of Continuous (Well-Graded) Combined
Aggregate Grading on Concrete Performance Phase B: Concrete Performance, National Ready Mixed Concrete Association, Silver Spring, MD, 42 pp.
16. S. Mindess, J.F. Young, and D. Darwin (2003). Concrete, 2nd Edition, Pearson
Education, Inc., Upper Saddle River, NJ.
17. P.R. Rangaraju (2003). “Development of Some Performance-Based Material Specifications for High-Performance Concrete Pavement,” Transportation Research Record, No. 1834, pp. 69-76.
18. I. Soroka (1980). Portland Cement Paste and Concrete, Chemical Publishing Co. Inc.,
New York, NY.
19. ASTM C 1202 (2007). Standard Test Method for Electrical Indication of Concrete’s Ability to Resist Chloride Ion Penetration, American Society for Testing and Materials, Philadelphia, PA.
20. M. Geiker, N. Thaulow, and P.J. Anderson (1991). “Assessment of rapid chloride
permeability test of concrete with and without mineral admixtures,” Proceedings from the Fifth International conference on Durability of Building Materials and Components, Brighton, UK, pp. 46-55.
21. K. Torii, M. Kawamura, and M. Mihara (1992). “Chloride permeability and pore
solution compositions of mortars containing silica fume,” Proceedings of the 46th Annual Conference of the Cement Association of Japan, pp. 544-549.
22. N.S. Berke, D.W. Pfiefer, and T.G. Weil (1988). “Protection against chloride induced
corrosion,” Concrete International, Vol. 10, No. 12, pp. 45-55.
23. D.R. Morgan and J. Wolsiefer Sr. (1992). “Wet-mixed silica fume shotcrete: Effect of silica fume,” American Concrete Institute Special Publication 132-67, pp. 1251-1271, Editor: V.M. Malhotra.
24. D. Whiting (1987). “Application of the rapid chloride permeability test to evaluation of
penetrating sealers for concrete,” Cement, Concrete and Aggregates, CCAGDP, Vol. 9, No. 1, pp. 49-51.

28
25. ASTM C 1543 (2007). Standard Test Method for Determining the Penetration of Chloride Ion into Concrete by Ponding, American Society for Testing and Materials, Philadelphia, PA.
26. R.F. Feldman, G.W. Chan, R.J. Brousseau, and P.J. Tumidajski (1994). “Investigation
of the Rapid Chloride Permeability Test,” ACI Materials Journal, Vol. 91, No. 2, May-June.
27. C. Shi, J.A. Stegemann, and R.J. Caldwell (1998). “Effect of Supplementary Cementing
Materials on the Specific Conductivity of Pore Solution and its Implications on the Rapid Chloride Permeability Test (AASHTO T277 and ASTM C1202) Results,” ACI Materials Journal, Vol. 95, No. 4, July-August.
28. J.M. Scanlon and M.R. Sherman (1995). “Use of Fly Ash to Improve Concrete
Durability by Reducing permeability,” Proceedings of the Third National Concrete and Masonry Engineering Conference, San Francisco, June 15.
29. D. Whiting and L. Kuhlmann (1987). “Curing and Chloride Permeability,” Concrete
International, No. 4, Vol. 9, pp. 18-21.
APPENDIX A ADDITIONAL PERMEABILITY PLOTS
A-1
FIGURE A-1 Hardened air content vs. permeability on 28 day cores.
FIGURE A-2 Compressive strength vs. permeability on 28 day cores.
1000120014001600180020002200240026002800
4 5 6 7 8 9 10
Hardened Air Content (%)
Adju
sted
Cha
rge
(Cou
lom
bs)
10001200140016001800
20002200240026002800
4000 4500 5000 5500 6000 6500 7000 7500
Compressive Strength (psi)
Adju
sted
Cha
rge
(Cou
lom
bs)
A-2
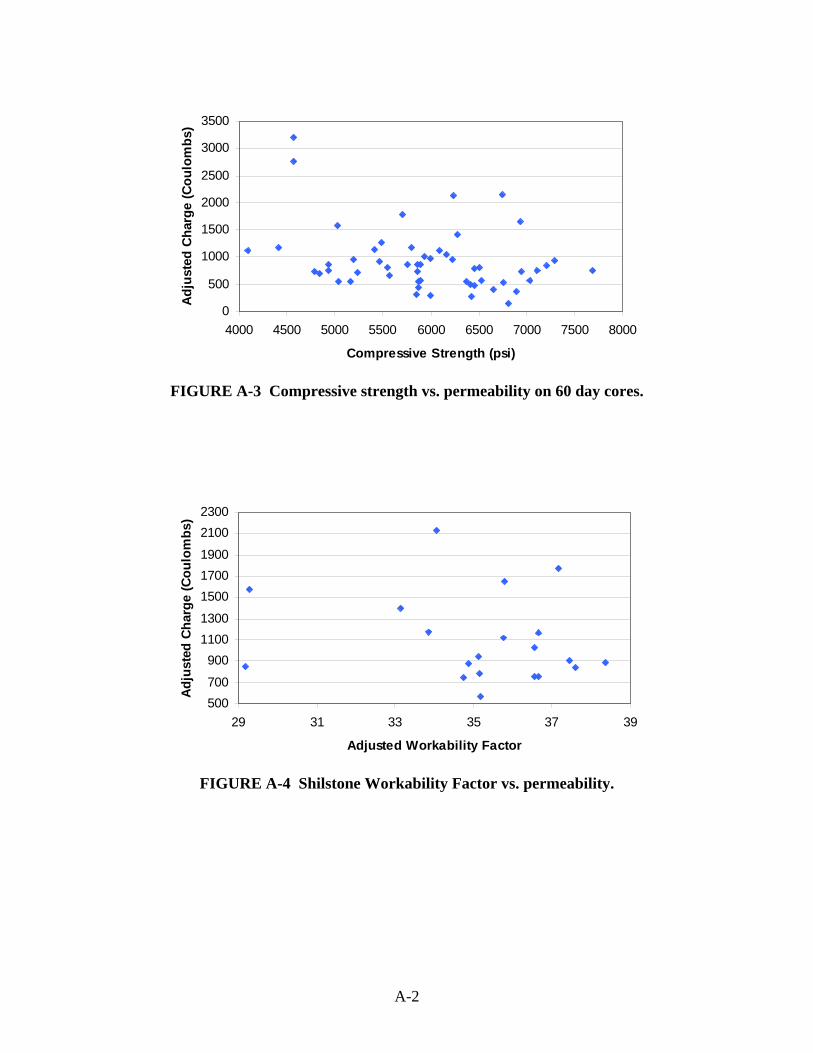
FIGURE A-3 Compressive strength vs. permeability on 60 day cores.
FIGURE A-4 Shilstone Workability Factor vs. permeability.
0
500
1000
1500
2000
2500
3000
3500
4000 4500 5000 5500 6000 6500 7000 7500 8000
Compressive Strength (psi)
Adju
sted
Cha
rge
(Cou
lom
bs)
500700
90011001300
150017001900
21002300
29 31 33 35 37 39
Adjusted Workability Factor
Adju
sted
Cha
rge
(Cou
lom
bs)
A-3
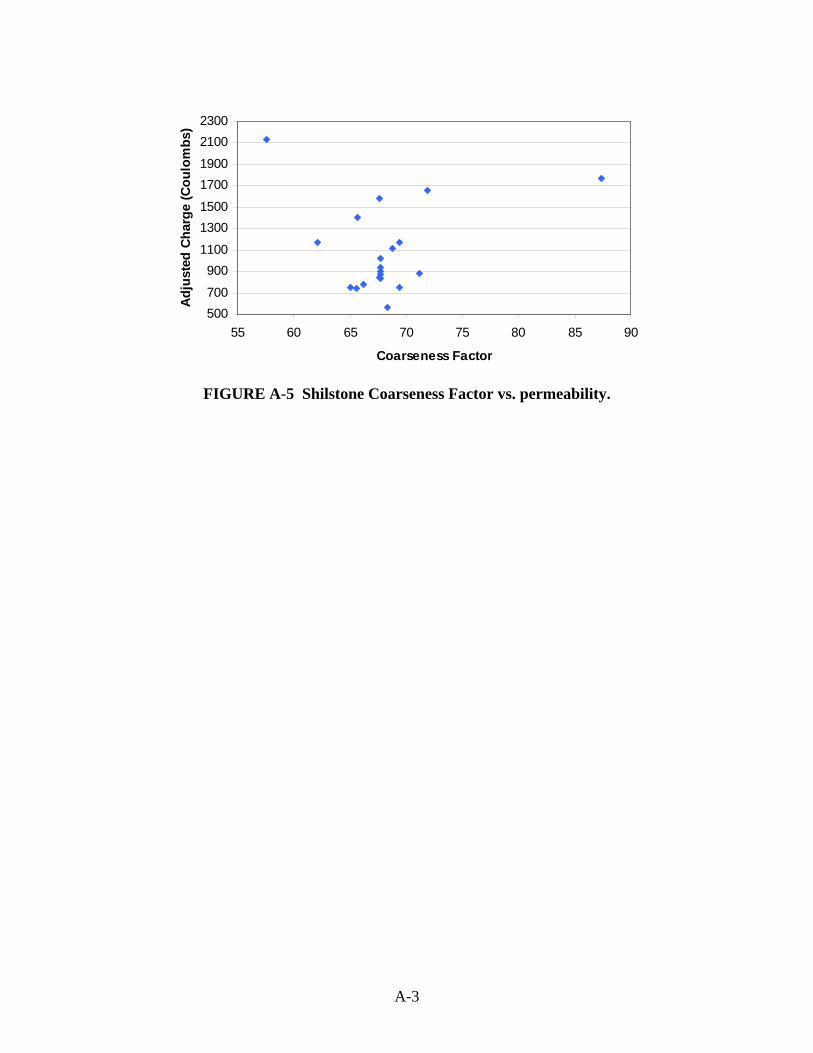
FIGURE A-5 Shilstone Coarseness Factor vs. permeability.
500700
9001100
13001500
17001900
21002300
55 60 65 70 75 80 85 90
Coarseness Factor
Adj
uste
d Ch
arge
(Cou
lom
bs)