effect of coag-flocculation kinetics on telfairia occidentalis seed coagulant
TRANSCRIPT

INTERNATIONAL JOURNAL OF MULTIDISCIPLINARY SCIENCES AND ENGINEERING, VOL. 3, NO. 9, SEPTEMBER 2012
[ISSN: 2045-7057] www.ijmse.org 22
Effect of Coag-Flocculation Kinetics on Telfairia
Occidentalis Seed Coagulant (TOC) in
Pharmaceutical Wastewater
Ugonabo Victor Ifeanyi
1,*, Menkiti Matthew Chukwudi
2, Onukwuli Dominic. Okechukwu
3
1,2,3Department of Chemical Engineering Nnamdi Azikiwe University, Awka, Nigeria *[email protected]
Abstract– The effect of coag-flocculation kinetics on Telfairia
occidentalis seed coagulant in pharmaceutical wastewater has
been investigated at room temperature. Various dosages of the
coagulant at different wastewater medium was used in
evaluating how coag-flocculation kinetic parameters affected
Telfairia occidentalis seed coagulant in pharmaceutical
wastewater. Such kinetics parameters determined were
coagulation reaction rate constant K, the order of reaction α, 1
and R2. Turbidity measurement was employed in line with
turbidimetric standard method. The highest and least values for
K, are 1.1282E – 01Lg min-1
and 4.1402E-03Lgmin-1
; α, are 1.5
and 1.1; 1, are 0.35 and 2.4E-04; R
2 are 0.997 and 0.972,
respectively. The best turbidity percentage removed is recorded
at 88% for 0.6g coagulant dosage and pH of 13. Conclusively,
Telfairia occidentalis is an effective bio-coagulant which can
reduce the level of turbidity in pharmaceutical wastewater.
Keywords– Effect, Kinetics, Pharmaceutical Wastewater, Telfairia Occidentalis Seed and Coagulation/Flocculation
I. INTRODUCTION
harmaceutical processes are accompanied by the
generation of waste water commonly referred to as
pharmaceutical wastewater. Generally, raw
pharmaceutical wastewater contains biochemical oxygen
demand (BOD) in the range 1,200 – 1,700 mg/l, chemical
oxygen demand (COD) in the range 2,000 – 3,000 mg/l, total
alkalinity (as CaCO3) in the range 50 – 100 mg/l, suspended
solids in the range 300 – 400 mg/l, pH in the range 6.5 – 7.0,
phenols in the range 65 – 72 mg/l (Mayadhate, et al, 1988),
The wastewater characteristics vary greatly upon the
manufacturing process and raw materials used (Anderson, 1980).
The pharmaceutical industry employs a wide array of
wastewater treatment and disposal methods (Struzeski, 1980).
Such methods includes; neutralization/pH adjustment,
coagulation/flocculation, sedimentation, adsorption etc. It was
reported that treatment of pharmaceutical wastewater with
inorganic coagulants (Salts of Fe, and Alum.) at
pharmaceutical plant in Bombay was less effective
(Mayabhate, et al, 1988). Therefore, it becomes necessary to
develop new technologies, practices and bio-raw materials for
the treatment of pharmaceutical wastewater or the
optimization of the existing ones for efficient growth of the industry while minimizing impacts to the environment
(Menkiti, et al, 2011). Coag-flocculation technique with bio-
raw materials can be applied for these purposes.
Coagulation and flocculation are important unit processes
used in water and wastewater treatment. Although used inter-
changeable but there are two distinct terms coagulation step
proceeds flocculation (Diterlizzi, 1994). Coagulation involves
the addition of chemical Coagulants during relatively intense
mixing to destabilize colloidal particles (Ma, et al, 1993).
The addition of chemical agents in water provides
positive electric charges to reduce negative charge (potential)
of the colloids. As a result, it will overcome the repulsive
forces of the particles (WST, 2003., Lenntech, 2005). Flocculation is the aggregation of destabilized particles into
larger flocs that can be removed subsequently by
sedimentation and or filtration (Suidan, 1988., Koohestanian,
et al, 2008). This aggregation is influenced by interparticle
interaction forces, volume fraction of the suspension, pH etc
(Glover, et al, 2000).
Number of aggregating agents used in water treatment
processes include, inorganic coagulants (salts of Fe and Al)
and natural organic polymers. (Faust and Aly, 1998., Gregor,
et al, 1997). Alumunium Salt is widely used as coagulants but
its usage are associated with the following problems; influences the pH value of the water, increases the soluble
residues metal content of the sludge, and infection of
Alzheimer’s disease (Crapper, et al, 1973., Miller, et al,
1984).
For developing economies, the use of renewable bio-raw
materials as an alternative coagulant to inorganic salts will
help conserve the nations foreign earnings. In this regard,
natural materials of plant origin, which are non toxic,
biodegradable, eco-friendly, cheap and locally abundant can
be introduced as a viable alternative coagulant for the
treatment of waste water. Among such natural coagulant is
Telfairia occidentalis seed. Telfairia occidentalis is a pod herbs of family cucurbitaceae. It is grown in southern part of
Nigeria .The seed kernel when expressed on dry weight basis
contains 33.92% crude protein, 3.97% fibre, 31.57%fats and
oil, 8.46% moisture, 21.9% ash, 0.11% total sugars
respectively(Rezig, et al.,2012).
Apparently, no major studies have been done to treat
pharmaceutical wastewater by Telfairia occidentalis in
coagulation and flocculation process. Therefore, this study
was carried to analyze the effects of Telfairia occidentalis in
treating pharmaceutical wastewater in different experimental
P
INTERNATIONAL JOURNAL OF MULTIDISCIPLINARY SCIENCES AND ENGINEERING, VOL. 3, NO. 9, SEPTEMBER 2012
[ISSN: 2045-7057] www.ijmse.org 23
conditions. The optimum pH, dosage and settling time needed
to achieve the best performance of Telfairia Occentalis in
flocculation process were determined.
II. THEORETICAL PRINCIPLES AND COAG-FLOCCULATION KINETICS
The kinetics of Brownain Coagulation of particles can be described by:
i+j i=1 (1)
Where Kij is a second order coagulation rate constant, t is the time, and Nz is the total particle concentration of - fold
aggregates. It has been shown that the kinetics of coagulation process being controlled by Brownian motion have best
performance at the early stage (t > 30 mins) (Smoluchowski, 1917; Menkiti, et al, 2010; Van Zanten, 1992; Suidan, 1998;
Fridriskhberg, 1984). However, for the kinetics of Brownian Coagulation of mondispersed particles at the early stage is
described generally by (Smoluchowski, 1917., Menkiti, et al, 2008)
= -KNtα (2)
Linearizing equation 2 yields
ln - = ln K + α ln Nt (3)
From graphical illustration of equaton 3 i.e.,
ln - = VS ln Nt, K and α can be determined.
Where, K = Coagulation rate constant/Collision frequency/Absolute
coagulation rate constant
α = The order of coagulation reaction.
Nt = The concentration of the particles (TDSP) at time, t.
Previous works has shown that for the conditions described above (Menkiti, et al, 2008., Fridrikhsberg, 1984., Van – Zanten
and Elimelech, 1992., Smoluchowski, 1917).
K = 8R1π D1 (4)
α = 2
R1 = 2a (5)
Where, a = particle radius,
D1 = Diffusivity
From Einstein’s equation (Fridrikhsberg, 1984., Danov, et al, 2001).
D1 = KB (6)
Where, KB = Boltzman constant (Molar gas constants per particle)
B = The friction factor
T = Absolute temperature (ok).
From Stokes equation
B = 6 πղa (7)
Substituting equations 7, 6 and 5 in 4, gives

INTERNATIONAL JOURNAL OF MULTIDISCIPLINARY SCIENCES AND ENGINEERING, VOL. 3, NO. 9, SEPTEMBER 2012
[ISSN: 2045-7057] www.ijmse.org 24
K = 8π2a KB
K = KB (8)
Where, ղ = Viscosity of the medium (Coagulating and flocculating effluent).
Substituting equation 8 into 2, yields.
= - Nt2 (9)
Using separable variable method and integrating equation 2
At t = o Nt = No
t = t Nt = Nt
- dNt = - kdt (10)
Nt2
= K (11)
Nt-1 = K t
- = kt (12)
Similarly, = kt + (13)
Multiplying both sides of equation 13 by No, yields
= No Kt + (14)
= No Kt + (15)
Making Nt the subject matter
Nt = No
1 + No Kt
Similarly,
Nt = No
1 + t/ (1/Nok) (16)
1
Let No = NoK = . (17)
Substituting equation 17 in 16, yield
Nt = (18)
When, t = , equation 18 becomes
Nt = = (19)
According to the theory of smoluchowski where the coagulation of the spherical particles is controlled entirely by Brownian
diffusion, the coagulation rate constant for doublet formation of an initially monodisperse suspension is given by:
Kij = 2k = 8 KBT
3 ղ (20)

INTERNATIONAL JOURNAL OF MULTIDISCIPLINARY SCIENCES AND ENGINEERING, VOL. 3, NO. 9, SEPTEMBER 2012
[ISSN: 2045-7057] www.ijmse.org 25
Solving equation 1, analytically and assuming kij = kii yields (Holthof, et al, 1996., Menkiti, et al, 2008).
= (K11No t/2)
n-1
(1 + K11 No t/2)
n+1 (21)
Similarly Nƶ(t) = t n-1
No 2 [ ]
n+1 (22)
1 + t/2[ ]
Substitute equation 17 in 22.
Nƶ(t) = t n-1
No 2
n+1 (23)
1 + t/2
Assume 2 = 1 (24)
Substitute equation 24 in 23, gives
Nƶ(t) = n-1
No
n+1 (25)
1+
Equation 25, represents general expression for particle of any ith order. For mono particles (i = 1)
N1 = No 1
(1+ )2 (26)
For dimers (i = 2)
N2 = No (
(1 + )3 (27)
For trimers (i = 3)
N3 = No (2
(1 + )4 (28)
Mathematically, the theoretical quantity can be evaluated with aid of equation 17.
i.e = 1/NoK.
Recall from equation 8, K = 8 KBT
3 ղ
INTERNATIONAL JOURNAL OF MULTIDISCIPLINARY SCIENCES AND ENGINEERING, VOL. 3, NO. 9, SEPTEMBER 2012
[ISSN: 2045-7057] www.ijmse.org 26
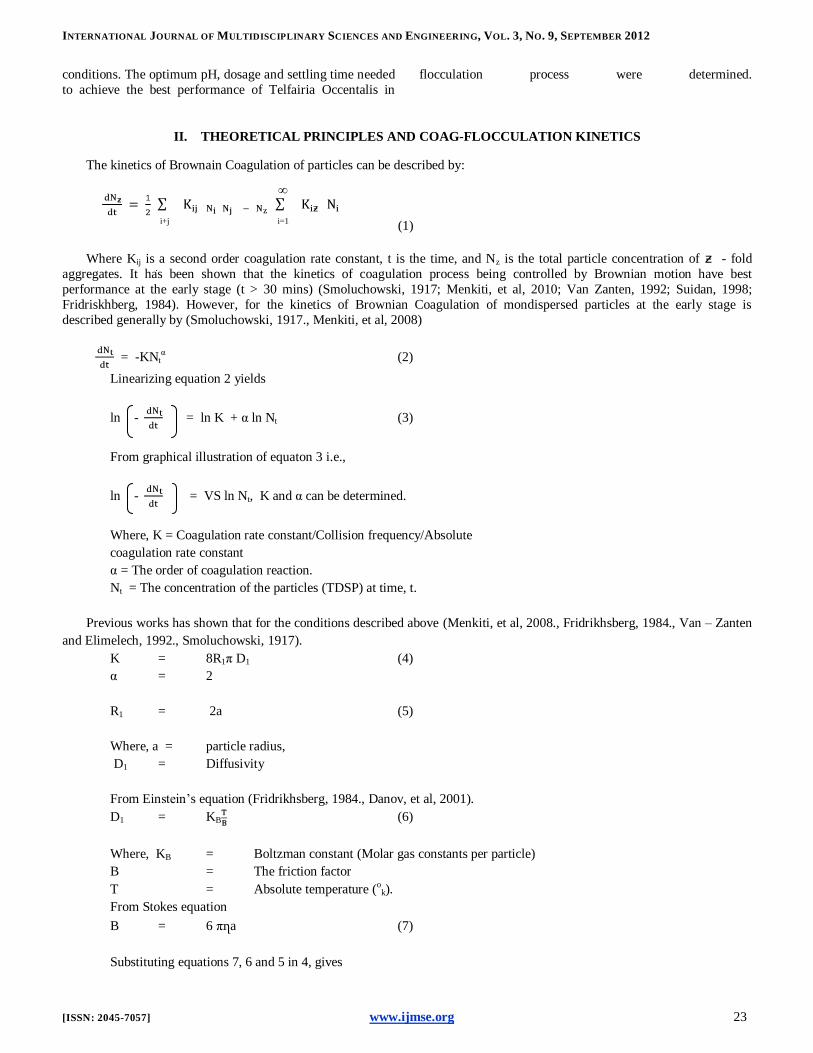
Substitute equation 8 in 17
= 1 8 KBT = 3ղ
No 3 ղ 8KBTNo (29)
As No No/2, 1/2
1/2 = 3ղ
8KBT(0.5 No)
Similarly,
1/2 = 3ղ (30)
4KBTNo
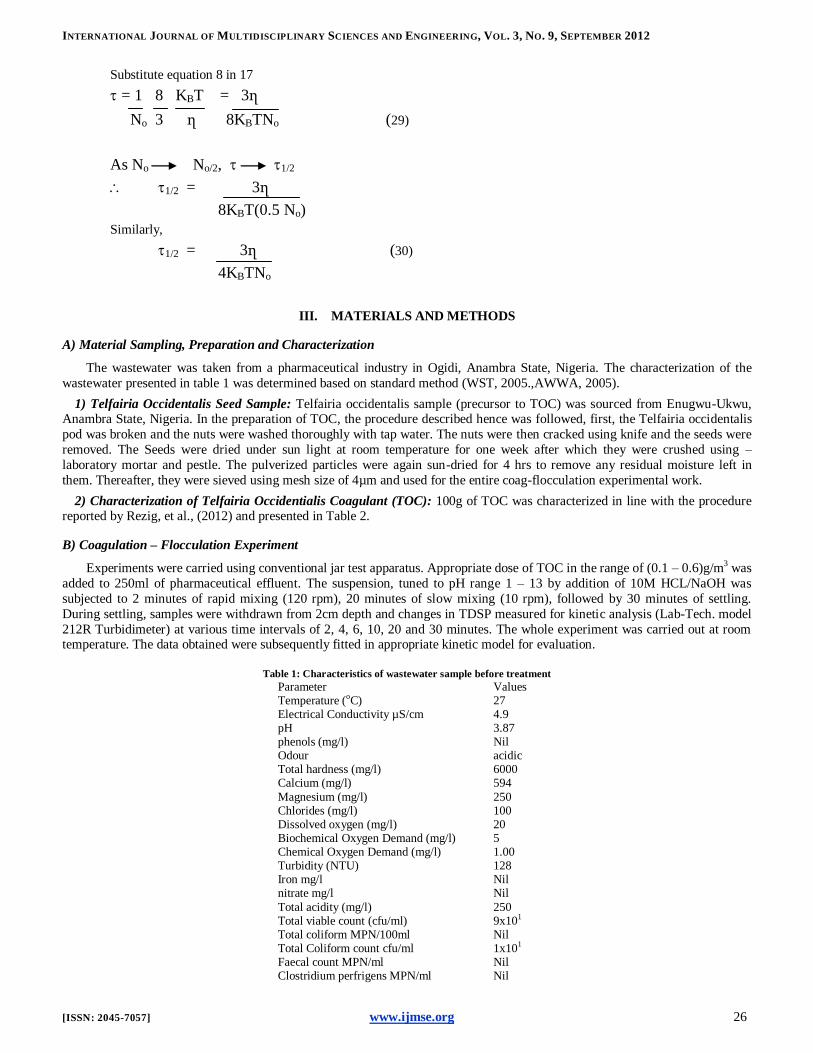
III. MATERIALS AND METHODS
A) Material Sampling, Preparation and Characterization
The wastewater was taken from a pharmaceutical industry in Ogidi, Anambra State, Nigeria. The characterization of the
wastewater presented in table 1 was determined based on standard method (WST, 2005.,AWWA, 2005).
1) Telfairia Occidentalis Seed Sample: Telfairia occidentalis sample (precursor to TOC) was sourced from Enugwu-Ukwu, Anambra State, Nigeria. In the preparation of TOC, the procedure described hence was followed, first, the Telfairia occidentalis
pod was broken and the nuts were washed thoroughly with tap water. The nuts were then cracked using knife and the seeds were
removed. The Seeds were dried under sun light at room temperature for one week after which they were crushed using –
laboratory mortar and pestle. The pulverized particles were again sun-dried for 4 hrs to remove any residual moisture left in
them. Thereafter, they were sieved using mesh size of 4µm and used for the entire coag-flocculation experimental work.
2) Characterization of Telfairia Occidentialis Coagulant (TOC): 100g of TOC was characterized in line with the procedure reported by Rezig, et al., (2012) and presented in Table 2.
B) Coagulation – Flocculation Experiment
Experiments were carried using conventional jar test apparatus. Appropriate dose of TOC in the range of (0.1 – 0.6)g/m3 was
added to 250ml of pharmaceutical effluent. The suspension, tuned to pH range 1 – 13 by addition of 10M HCL/NaOH was
subjected to 2 minutes of rapid mixing (120 rpm), 20 minutes of slow mixing (10 rpm), followed by 30 minutes of settling.
During settling, samples were withdrawn from 2cm depth and changes in TDSP measured for kinetic analysis (Lab-Tech. model
212R Turbidimeter) at various time intervals of 2, 4, 6, 10, 20 and 30 minutes. The whole experiment was carried out at room temperature. The data obtained were subsequently fitted in appropriate kinetic model for evaluation.
Table 1: Characteristics of wastewater sample before treatment
Parameter Values Temperature (oC) 27 Electrical Conductivity µS/cm 4.9 pH 3.87 phenols (mg/l) Nil Odour acidic Total hardness (mg/l) 6000 Calcium (mg/l) 594
Magnesium (mg/l) 250 Chlorides (mg/l) 100 Dissolved oxygen (mg/l) 20 Biochemical Oxygen Demand (mg/l) 5 Chemical Oxygen Demand (mg/l) 1.00 Turbidity (NTU) 128 Iron mg/l Nil nitrate mg/l Nil
Total acidity (mg/l) 250 Total viable count (cfu/ml) 9x101 Total coliform MPN/100ml Nil Total Coliform count cfu/ml 1x101 Faecal count MPN/ml Nil Clostridium perfrigens MPN/ml Nil

INTERNATIONAL JOURNAL OF MULTIDISCIPLINARY SCIENCES AND ENGINEERING, VOL. 3, NO. 9, SEPTEMBER 2012
[ISSN: 2045-7057] www.ijmse.org 27
Table 2: Characteristics of 100g of the seed kernel (TOC precursor)
Parameter Value Moisture Content % 0.01
Crude Protein Content % 27.0 Crude Fibre % 3.0 Ash Content % 2.0 Fat & oil Content % 53.0 Carbohydrates Content % 15.0
Table 3: Coagulation kinetics for varying TOC dosages at pH = 1
TOC K (Lg min-1
) R2 Rate Equation (min) 1
(min)
Doses (g) (-r)
0.1 1.0987E-02 1.2 0.996 -r = 1.0E-02Nt1.2 0.0989 0.1978
0.2 1.1749E-02 1.2 0.994 -r = 1.1E-02Nt1.2 0.0925 0.0185
0.3 6.8878E-03 1.2 0.995 -r = 6.8E-02Nt1.2 0.157 0.3156
0.4 2.9897E-02 1.1 0.994 -r = 2.9E-02Nt1.1 0.0364 0.0728
0.5 1.4567E-02 1.2 0.995 -r = 1.4E-02Nt1.2 0.0746 0.1492
0.6 8.7824E-03 1.3 0.995 -r = 8.7E-03Nt1.3 0.1238 0.2476
Table 4: Coagulation Kinetics for Varying TOC dosages at pH = 3
TOC K (Lg min-1
) R2 Rate Equation (min) 1
(min)
Doses (g) (-r) 0.1 3.7553E-02 1.2 0.989 -r = 3.7E-02Nt
1.2 0.0121 0.0242 0.2 4.9095E-02 1.2 0.991 -r = 4.9E-02Nt
1.2 0.0092 0.0184 0.3 1.1282E-01 1.1 0.987 -r = 1.1E-01Nt
1.1 0.004 0.008 0.4 4.6236E-02 1.2 0.988 -r = 4.6E-02Nt
1.1 0.0098 0.0196
0.5 5.0590E-02 1.2 0.990 -r = 5.0E-02Nt1.2 0.0312 0.0624
0.6 9.4894E-02 1.1 0.972 -r = 9.4E-02Nt1.1 0.0047 0.0094
Table 5: Coagulation Kinetics for Varying TOC Dosages at pH = 5
TOC K (Lg min-1
) R2 Rate Equation (min) 1
(min)
Doses (g) (-r)
0.1 5.3184E-02 1.1 0.994 -r = 5.3E-02Nt1.1 0.0078 0.0156
0.2 5.3611E-02 1.1 0.992 -r = 5.3E-02Nt1.1 0.0077 0.0154
0.3 3.6334E-03 1.2 0.995 -r = 3.6E-02Nt1.2 0.0115 0.0230
0.4 5.1099E-02 1.2 0.997 -r = 5.1E-02Nt1.2 0.0081 0.0162
0.5 4.1878E-02 1.2 0.992 -r = 4.1E-02Nt1.2 0.0099 0.0198
0.6 8.7423E-03 1.1 0.995 -r = 8.7E-03Nt1.1 0.0047 0.0094
Table 6: Coagulation Kinetics for Varying TOC Dosages at pH = 7
TOC K (Lg min-1
) R2 Rate Equation (min) 1
(min)
Doses(g) (-r) 0.1 6.5454E-03 1.3 0.996 -r = 6.5E-03Nt
1.3 0.1107 0.2214 0.2 1.6391E-02 1.2 0.994 -r = 1.6E-02Nt
1.2 0.0442 0.0884
0.3 4.1402E-03 1.5 0.995 -r = 4.1E-03Nt1.5 0.1750 0.3500
0.4 9.1500E-03 1.4 0.994 -r = 9.1E-03Nt1.4 0.0792 0.1584
0.5 5.6983E-02 1.2 0.995 -r = 5.6E-02Nt1.2 0.0127 0.0254
0.6 4.4582E-03 1.5 0.995 -r = 4.4E-03Nt1.5 0.1625 0.3250
Table 7: Coagulation Kinetics for Varying TOC Dosages at pH = 10
TOC K (Lg min-1
) R2 Rate Equation (min) 1
(min)
Doses (g) (-r) 0.1 1.0163E-02 1.3 0.994 -r = 1.0E-02Nt
1.3 0.0713 0.1426 0.2 1.3884E-02 1.3 0.983 -r = 1.3E-02Nt
1.3 0.0522 0.1044 0.3 5.8460E-03 1.4 0.994 -r = 5.8E-03Nt
1.4 0.00012 0.00024 0.4 2.0020E-02 1.3 0.994 -r = 2.0E-02Nt
1.3 0.0362 0.0724 0.5 7.3064E-03 1.4 0.977 -r = 7.3E-03Nt
1.4 0.0992 0.1984 0.6 2.6729E-02 1.3 0.990 -r = 2.6E-02Nt
1.3 0.0271 0.0542

INTERNATIONAL JOURNAL OF MULTIDISCIPLINARY SCIENCES AND ENGINEERING, VOL. 3, NO. 9, SEPTEMBER 2012
[ISSN: 2045-7057] www.ijmse.org 28
Table 8: Coagulation Kinetics for Varying TOC Dosages at pH = 13
TOC K (Lg min-1
) R2 Rate Equation (min) 1
(min)
Doses (g) (-r) 0.1 1.5932E-03 1.6 0.951 -r = 1.5E-03Nt
1.6 0.3032 0.6064
0.2 5.9106E-03 1.5 0.977 -r = 5.9E-03Nt1.5 0.0817 0.1634
0.3 5.8018E-02 1.2 0.994 -r = 5.8E-02Nt1.2 0.0083 0.0166
0.4 4.1254E-02 1.3 0.995 -r = 4.1E-02Nt1.3 0.0117 0.0234
0.5 1.1498E-01 1.1 0.994 -r = 1.1E-01Nt1.1 0.0042 0.0084
0.6 9.1905E-02 1.2 0.987 -r = 9.1E-02Nt1.2 0.0052 0.0104
Figure 1:Particle Conc.Vs Time for pH=1 at varying TOC dosage
Figure 2:Particle Conc.Vs Time for pH=3 at varying TOC dosage
Figure 3:Particle Conc.Vs Time for pH=5 at varying TOC dosage
0
100
200
300
400
500
600
700
800
2 4 6 10 20 30
Co
nc.
( mg/
l)
Time(mins)
0.1g
0.2g
0.3g
0.4g
0.5g
0.6g
0
200
400
600
800
1000
2 4 6 10 20 30
Co
nc.
(mg/
L)
Time(mins)
0.1g
0.2g
0.3g
0.4g
0.5g
0.6g
0
200
400
600
800
1000
1200
1400
1600
2 4 6 10 20 30
Co
nc.
(mg/
L)
Time(mins)
0.1g
0.2g
0.3g
0.4g
0.5g
0.6g
INTERNATIONAL JOURNAL OF MULTIDISCIPLINARY SCIENCES AND ENGINEERING, VOL. 3, NO. 9, SEPTEMBER 2012
[ISSN: 2045-7057] www.ijmse.org 29
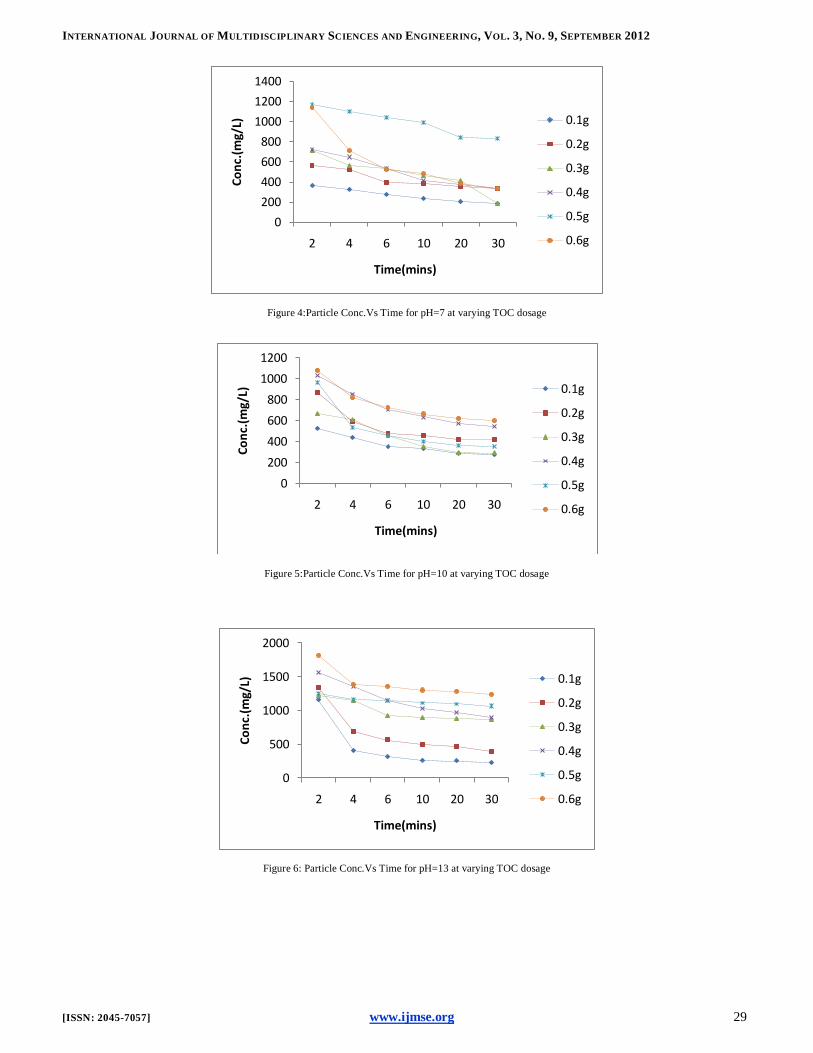
Figure 4:Particle Conc.Vs Time for pH=7 at varying TOC dosage
Figure 5:Particle Conc.Vs Time for pH=10 at varying TOC dosage
Figure 6: Particle Conc.Vs Time for pH=13 at varying TOC dosage
0
200
400
600
800
1000
1200
1400
2 4 6 10 20 30C
on
c.(m
g/L)
Time(mins)
0.1g
0.2g
0.3g
0.4g
0.5g
0.6g
0
200
400
600
800
1000
1200
2 4 6 10 20 30
Co
nc.
(mg/
L)
Time(mins)
0.1g
0.2g
0.3g
0.4g
0.5g
0.6g
0
500
1000
1500
2000
2 4 6 10 20 30
Co
nc.
(mg/
L)
Time(mins)
0.1g
0.2g
0.3g
0.4g
0.5g
0.6g

INTERNATIONAL JOURNAL OF MULTIDISCIPLINARY SCIENCES AND ENGINEERING, VOL. 3, NO. 9, SEPTEMBER 2012
[ISSN: 2045-7057] www.ijmse.org 30
Figure 7: Selected plot of Particle Conc.Vs Time for 0.2g TOC dosage at varying pH
Figure 8: Selected plot of Particle Conc.Vs Time for 0.4g TOC dosage at varying pH
Figure 9: Selected plot of Particle Conc.Vs Time for 0.6g TOC dosage at varying pH
0
200
400
600
800
1000
1200
1400
1600
2 4 6 10 20 30
Co
nc.
(mg/
L)
Time(mins)
pH=1
pH=3
pH=5
pH=7
pH=10
pH=13
0
500
1000
1500
2000
2 4 6 10 20 30
Co
nc.
(mg/
L)
Time(mins)
pH=1
pH=3
pH=5
pH=7
pH=10
pH=13
0
500
1000
1500
2000
2 4 6 10 20 30
Co
nc.
(mg/
L)
Time(mins)
pH=1
pH=3
pH=5
pH=7
pH=10
pH=13
INTERNATIONAL JOURNAL OF MULTIDISCIPLINARY SCIENCES AND ENGINEERING, VOL. 3, NO. 9, SEPTEMBER 2012
[ISSN: 2045-7057] www.ijmse.org 31
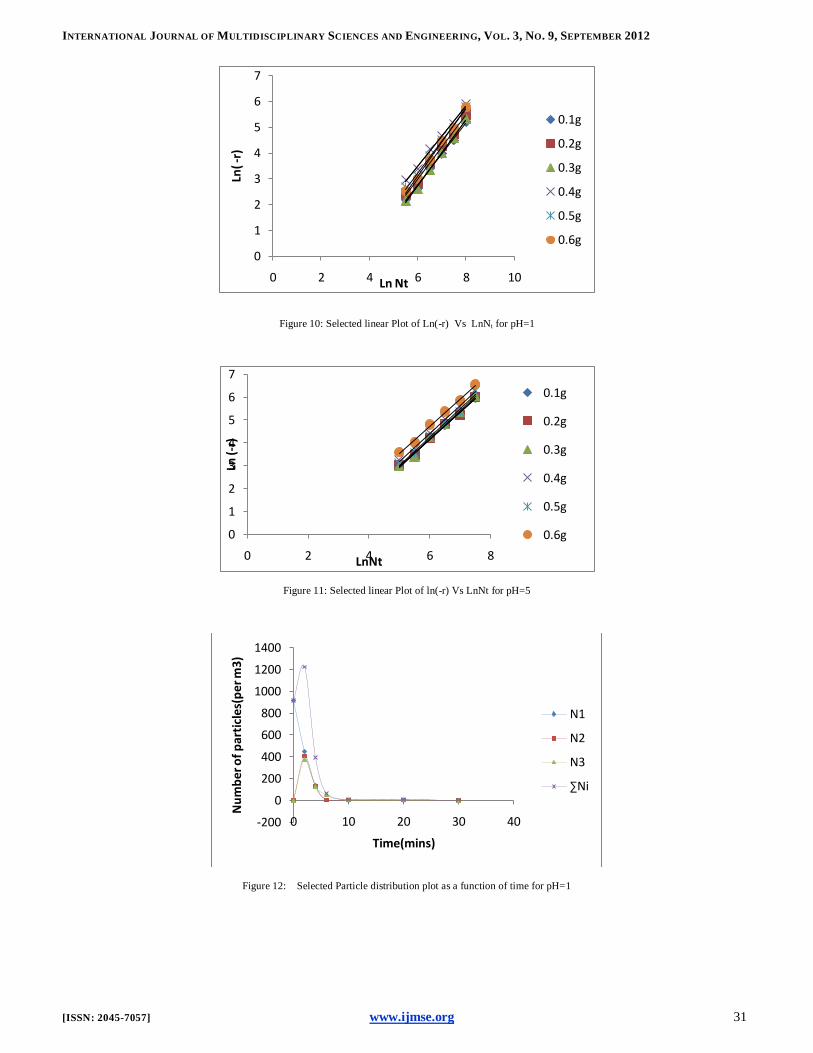
Figure 10: Selected linear Plot of Ln(-r) Vs LnNt for pH=1
Figure 11: Selected linear Plot of ln(-r) Vs LnNt for pH=5
Figure 12: Selected Particle distribution plot as a function of time for pH=1
0
1
2
3
4
5
6
7
0 2 4 6 8 10
Ln( -
r)
Ln Nt
0.1g
0.2g
0.3g
0.4g
0.5g
0.6g
0
1
2
3
4
5
6
7
0 2 4 6 8
Ln (-
r)
LnNt
0.1g
0.2g
0.3g
0.4g
0.5g
0.6g
-200
0
200
400
600
800
1000
1200
1400
0 10 20 30 40
Nu
mb
er o
f p
arti
cles
(pe
r m3)
Time(mins)
N1
N2
N3
∑Ni

INTERNATIONAL JOURNAL OF MULTIDISCIPLINARY SCIENCES AND ENGINEERING, VOL. 3, NO. 9, SEPTEMBER 2012
[ISSN: 2045-7057] www.ijmse.org 32
Figure 13: Selected Particle distribution plot as a function of time for pH=5
IV. RESULTS AND DISCUSSION
A) The effect of coagulant dosage variation on turbidity
removal
The jar test results obtained in the unit of Turbidity
(NTU) were converted to concentrations (mg/l) by
multiplying by a factor of 2.0 (Ozacar and Sengil, 2003).
These results are represented in figures 1-9. The general
observable trend in figures 1-9 show that the TDSP (turbidity)
removal is time dependent. The TDSP concentration is seen to decline linearly with time from initial value of 2070 mg/l. The
decrease of turbidity with time is supportive of the fact that as
the reaction proceeds the amount of TDSP available for the
coagulation decreases. Hence resulting in the poor
performance of TOC for binding and bridging phenomenon.
The linear decline in turbidity from 0 – 5 minutes is a product
of either floc mechanism or combination of entrapment –
bridging mechanism. Figures 1 – 6, show that increase in
coagulant dosage result in the increase in the rate of TDSP
removal. The ability of TOC to remove TDSP from the
pharmaceutical effluent reached the optimum value of 0.6g coagulant dosage. The least TDSP removal was recorded at
the coagulant dosage of 0.1g. This is an indication that the
least turbidity at 5 minutes time occurred for 0.6g coagulant
dosage. This is due to the ability of TOC to initiate particle
sweep.
B) The effect of pH variation on turbidity removal
The pH parameter affects the surface charge of TOC and
stabilization of the TDSP in the wastewater as well. In addition, the solubility of TOC in pharmaceutical wastewater
sample is influenced by pH value, because high pH of the
medium is seen to favour high degree of TOC solubility . In
figures 7-9 it was observed that the trends were almost
identical but with different percentage removal for particular
pH. Figure 9, demonstrates that 88% turbidity removal can be
achieved at pH of 13 at initial TDSP of 2070 mg/l. Therefore
the optimum pH condition of the treatment system was pH of
13. The good performance at alkaline medium as observed
may be due to adsorption of TDSP in the wastewater onto
hydroxide flocs or that the positive charges on the TOC
surface will significantly decrease as medium pH increases.
The contribution by the charge neutralization of the TOC to
destabilize the particles become less important as the pH
increases. This result is in line with previous works (Sanghi
and Bhattacharya, 2005., Menkiti, et al, 2010). Moreover,
based on observation, the floc produced by TOC appears
rapid at pH of 13 and subsequent aggregation into large floc, for easy settling and removal.
C) Coagulation – flocculation kinetic parameters
The values of coagulation – flocculation kinetic
parameters obtained for varying TOC dosages at constant pH
are presented in tables 3 to 7. The values of coagulation rate
constant K, and the order of coagulation reaction α, are
evaluated from the graphical illustration of equation 3, known
as linearized selected plots presented in figures10-11 . The slope gives the value of α, while K is obtained as the
exponential value of the intercept. The general trend in the
tables indicate that K relates to α, inversely i.e. low value of
α, is a condition for high value of K. This phenomenon is
expected because K which is basically the rate per particle
concentration i.e. the rate at which two particles approaches
one another (Fridkhsberg, 1984). This analogy suggest that K
is associated with energy barrier (KT) between two potential
coagulating particles (Diterlizzi, 1994). In addition tables 3 –
7, indicate that the optimum value of K is recorded at pH of 3
for 0.3g dosage with the corresponding low α. Also the values of α, presented in the tables suggest that the system is not
controlled by perikinetic mechanism. However, the values of
α, obtained are in agreement with the theory of smoluchowski
wihich is associated with coagulation process being
predominantly controlled by Brownian motion (Metcalf and
Eddy, 2003; Sterling, et al, 2003; Fridrikhsberg, 1984.,
Menkiti, et al, 2008). Linear regression coefficient (R2) was
employed to ascertain the level of accuracy of fit of the
experimental data on the model expressed as equation 3.
Results in tables 3 – 7, show that the values of R2 obtained are
0
500
1000
1500
2000
2500
3000
3500
0 10 20 30 40N
um
be
r o
f p
arti
cle
s (p
erm
3)
Time (mins)
N1
N2
N3
∑Ni
INTERNATIONAL JOURNAL OF MULTIDISCIPLINARY SCIENCES AND ENGINEERING, VOL. 3, NO. 9, SEPTEMBER 2012
[ISSN: 2045-7057] www.ijmse.org 33
greater than 0.97. Ordinarily, this result suggests that the
reaction is a second order but it contradicts the values of α,
obtained from the experiment. This phenomenon could be
attributed to the retarding effect of hydrodynamic interaction
(Holthoff. et al 1996) which is not accounted for in Brownian
Coagulation. The rate equation (-r) which accounts for the rate of depletion of particle concentration (in TDSP) is
evaluated from equation 2 and presented in tables3 –7.
Finally, the values of and 1 are presented in tables 3-7.The
values 1 is an important parameter that is associated with aggregation of ions or particles in a coagulation process. The
highest and the least values of 1 are recorded at pH of 7 and 1 for 0.3g and 0.2g TOC dosage respectively.
D) Particle distribution plots
The particle distribution plots are obtained based on the
evaluation of equations 26-28 for monomer, dimer and trimer
particles respectively. The particle distribution pattern is
presented in figures 12-13. These plots basically depicts the pattern and distribution of aggregation of ions /particles as
they floc into visible blobs. Figures12-13 show that the
particles and distribution plots exhibits similar trend, which is
an indication of system being controlled by similar
mechanism. Critical observation on the figures indicate that
the total number of particles (∑Ni) passes through the
maximum because they are absent at t = o, N = o and at the
end of coagulation-flocculation process all (∑Ni, N1, N2, and
N3) tend towards t = infinity, ∑Ni , N1, N2, N3 = o. Also the
total number of particles (∑Ni) decreases more rapidly than
classes of particles. This phenomenon is peculiar to
coagulation – flocculation process where there is presence of colloidal entrapment and high attractive forces prevailing.
This indicate that the process is controlled by charge
neutralization and high bridging mechanism which led to floc
sweep in figure 12 from 8mins and10mins in figure 13 to t =
infinity, respectively. Hence the formation of monomer, dimer
and trimer appears to be affected by minimal energy barrier.
V. CONCLUSION
Within, the experimental condition, 88% turbidity
reduction is achieved within 0 – 3 minutes of coagulation –
flocculation process. This phenomenon presents TOC as a
potential bio-coagulant that can be employed in large scale
treatment of pharmaceutical wastewater. The coagulation
process was found to be predominantly controlled by
Brownian mechanism. The experimental results obtained are
in agreement with previous works (Menkiti, et al, 2008.,Van-
Zanten and Elimelech, 1992).
REFERENCES
A.Koohestanian, M.Hosseini, Z.Abbasion, The separation method for
removing of colloidal particles from Raw Water; American-
Eurasian J. Agric & Environ. Sci.4(2), (2008), 266 – 273
D.A.Fridrikhsberg, A Course in Colloid Chemistry, Mir Publishers
Moscow, Russia (1984)
D.K.Danov, P.A.Kralchevsky, I.B.Ivanov, Dynamic Process in
Surfactants Stabilized Emulsion, Faculty of Chemistry, University
of Sofia (2001).
D.R. Anderson, Pharmaceutical Wastewater treatment., A case study,
proceedings of the 35th
Industrial Waste Conference, Purdue
University, West Lafayette, IN, (1980), 456 – 462
D.R.Crapper, S.S.Krishnan, A.J.Dalton, Brain Aluminum Distribution in
Alzhemer’s Disease and Experimental Neurofibrillary
Degeneration, Science,180, (1973), 511 – 513
E.J.Struzeski, Status of wastes handling and waste treatment across the
pharmaceutical industry and 1977 effluent limitations. Proceddings
of the 35th
Industrial Waste Conference, Purdue University West
Lafayette, IN, (1980), 1095 – 1108
H.Holthof, S.U.Egelhaaf, P.Schurtenberger, H.Sticher, M.Borkovec,
Coagulation Rate Measurement of Colloidal Particls by
Simultaneous static and Dynamic Light Scattering. Langmuir,
American Chemical Society,12, (1996), 5541-5549
J.E.Gregor, C.J.Nokes, E.Fenton, Optimizing natural organic matter
removal from low Turbidity waters by controlled pH adjustment of
aluminium coagulation water Res.31(12), (1997), 2949 – 2958
J.H.Van - Zanten, M. Elimelech, Determination of Absolute
Coagulation Rate Constant by Multi-light Scatterng. J. Coll.
Interface Sci. USA,154(1), (1988) .
J.J.Ma, G.R.Chen, G.R.XU, G.O.Cai, Enhanced Coagulation of
surface waters with high organic content by permanganate
preoxidation. Water Science and Technology. Water Supply,China,
1(1),(2011), 51 – 61.
Lenntech, Lenntech Water Treatment and Air Purification Holding, B.V.
Rotterdamseweg (2005).
M.C.Menkiti, C.A.Onyechi, D.O. Onukwuli, Evaluation of perkinetics
compliance for the coag-flocculation of Brewery Effluent by
Brachystegia Eurycoma Seed Extract. International Journal of
Multidisciplinary Science and Engineering, 2(6), (2011), 73 – 80
M.C.Menkiti, P.K.Igbokwe, F.X.O.Ugodulunwa, O.D.Onukwuli, Rapid
Coagulation/Flocculation Kinetics of Coal Effluents with High
Organic Content Using Blended and Unblended Chitin Derived
Coagulants (CSC). Research Journal of Applied Sciences,3(4),
(2008), 317 – 323
M.C.Sterling, J.T.Ojo, R.L. Autenrieth, Application of particle
population kinetics in modeling the vertical Transport of chemically
dispersed crude oil . Proceedings of the twenty-sixth Arctic and
Marine oil Spill program (AMOP).Technical Seminar Ottawa,
Canada, (2), (2003), 787- 798
M.Ozacar, I.A.Sengil, Evaluation of Tannin Biopolymer as a Coagulant
Aid for Coagulation of Colloids and Surfaces,229, (2003), 85-96
M.T. Suidan, Coagulation and flocculation, Environmental engineering
unit operations and unit process lab. Manual, 4th
Ed. Association of
Environmental Engineering Professors, Canada (1988).
M. Von-Smoluchowski, Versucheiner Mathematischen Theorie der
Koagulations Kinetic Kolloider Lousungen. Z. Phys. Chem. 92,
(1917), 129 – 168
Metcalf and Eddy, Physical unit Process, Wastewater Engineering
Treatment and Reuse. 4th
Edn. Tata – McGraw Hill. New York,
(2003).
R.G.Miler, F.C. Kopfler, K.C. Kelty, J.A. Stober, N.S. Ulmer, The
occurrence of aluminium in drinking waters. Journal AWWA,76,
(1984), 84 – 91
R.Sanghi, B. Bhattacharya, Comparative Evaluation of Natural
Polyelectrolytes Psyllium and Chitosan as Coagulant Aids for
Decolourization of Dye solution. Water Qual.Res.J. Canada,40(1),
(2005), 97-101
S.D.Diterlizzi, Introduction to coagulation and flocculation of waste
water Environment System Project, U.S.A. (1994).
S.D.Faust, O.M.Aly, Chemistry of Water Treatment., 2nd
Edition, Ann
Arbor Press (1998).
S.Glover , Y.Yan , G.J.Jameson, S. I.Biggs, Bridging Flocculation
Studies by Light Scattering and Settling Chemical Engineering
Journal, 80(3), (2000) .
S.P. Mayabhate, S.K.Gupta, S.G.Joshi, Biological treatment of
pharmaceutical Wastewater. Water Air Soil. Poll.38, (1988), 189 –
197
WST., About coagulation and Flocculation: Information Bulletin, USA.
(2005).