effect of climatic variations on pollution deposit on electric insulation … · 2012-10-25 ·...
TRANSCRIPT
CIRED2005 Session No 1
EFFECT OF CLIMATIC VARIATIONS ON POLLUTION DEPOSIT ON ELECTRIC INSULATION AND RELATED FAILURE
M.REZAEI M.A.SHARIATI M.A.TALEBI F.DANESHVAR
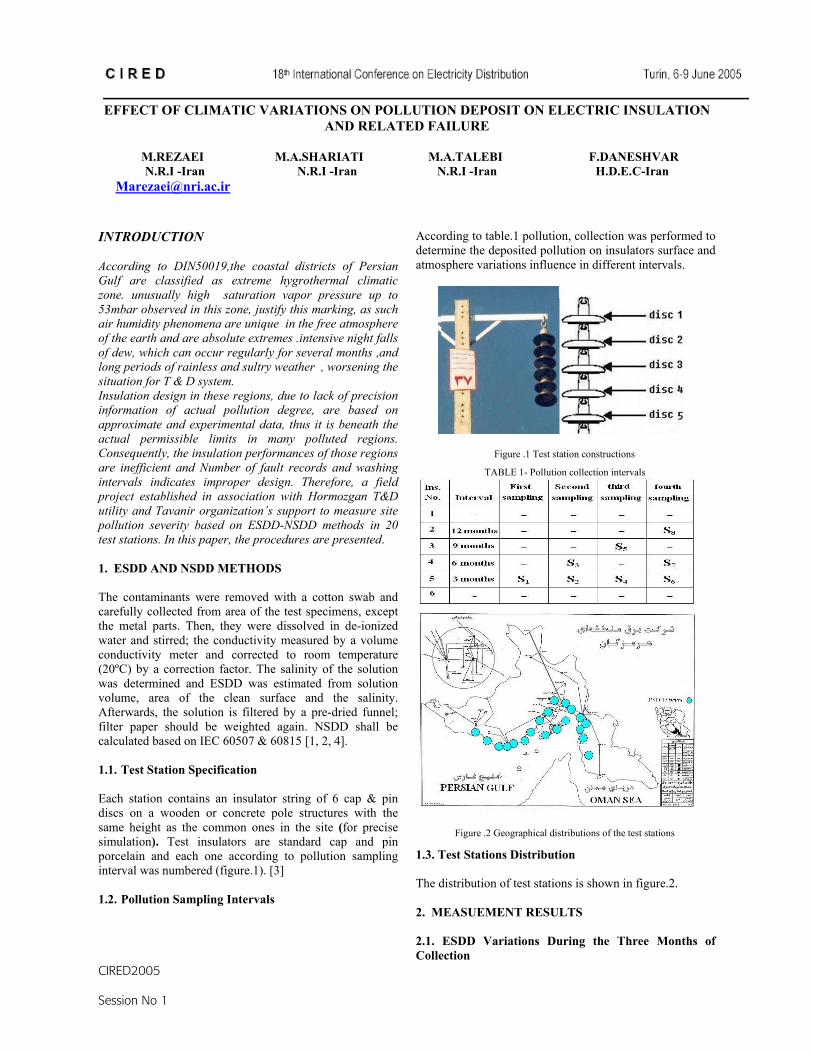
N.R.I -Iran N.R.I -Iran N.R.I -Iran H.D.E.C-Iran [email protected] INTRODUCTION According to DIN50019,the coastal districts of Persian Gulf are classified as extreme hygrothermal climatic zone. unusually high saturation vapor pressure up to 53mbar observed in this zone, justify this marking, as such air humidity phenomena are unique in the free atmosphere of the earth and are absolute extremes .intensive night falls of dew, which can occur regularly for several months ,and long periods of rainless and sultry weather , worsening the situation for T & D system. Insulation design in these regions, due to lack of precision information of actual pollution degree, are based on approximate and experimental data, thus it is beneath the actual permissible limits in many polluted regions. Consequently, the insulation performances of those regions are inefficient and Number of fault records and washing intervals indicates improper design. Therefore, a field project established in association with Hormozgan T&D utility and Tavanir organization’s support to measure site pollution severity based on ESDD-NSDD methods in 20 test stations. In this paper, the procedures are presented. 1. ESDD AND NSDD METHODS The contaminants were removed with a cotton swab and carefully collected from area of the test specimens, except the metal parts. Then, they were dissolved in de-ionized water and stirred; the conductivity measured by a volume conductivity meter and corrected to room temperature (20ºC) by a correction factor. The salinity of the solution was determined and ESDD was estimated from solution volume, area of the clean surface and the salinity. Afterwards, the solution is filtered by a pre-dried funnel; filter paper should be weighted again. NSDD shall be calculated based on IEC 60507 & 60815 [1, 2, 4]. 1.1. Test Station Specification Each station contains an insulator string of 6 cap & pin discs on a wooden or concrete pole structures with the same height as the common ones in the site (for precise simulation). Test insulators are standard cap and pin porcelain and each one according to pollution sampling interval was numbered (figure.1). [3] 1.2. Pollution Sampling Intervals
According to table.1 pollution, collection was performed to determine the deposited pollution on insulators surface and atmosphere variations influence in different intervals. 1.3. Test Stations Distribution The distribution of test stations is shown in figure.2. 2. MEASUEMENT RESULTS 2.1. ESDD Variations During the Three Months of Collection
Figure .1 Test station constructions
TABLE 1- Pollution collection intervals
Figure .2 Geographical distributions of the test stations

CIRED2005 Session No 1
The three months variations are shown in figure.3. it can been seen that during the dry months, April thorough October, of exposure the rate of ESDD indicates significant increase. 2.2. Maximum ESDD in Different Stations Maximum ESDD of the test stations during pollution collection are shown in figure.5 .pollution degree in each station can be determined with this criterion. The pollution degree of 12nd station in Queshm Island (1.2mg /m2) is noticeable and classifies the station as a special region. The other sites, especially in Bandarabbas, Banarshenas, Koohestak, Bosstanoo, are categorized as “very heavy” pollution degree. In this research effect of energized lines-devices on deposition rate, respect to [3], considered 20-30%. 2.3. Maximum NSDD in Different Stations Maximum NSDD pollution of the 20 test stations are shown in figure.6 Again, in 12nd station it is considerable (10.7 mg/cm2) which could be one of the reasons why pollution-result flashover faults occur in the region in spit of consideration of high specific creepage distances and frequent maintenance procedures. Therefore, the introduction of new criteria based on NSDD values for pollution severity assessment also is necessary.
2.4. NSDD/ESDD ratio in different stations Maximum NSDD/ESDD ratios of the 20 test stations are shown in figure.7. The special ratio of some stations (e.g. Queshm, Bandarlengeh and Minab), those indicate a very heavy pollution, are noticeable. This criterion indicates that consideration of combination of ESDD and NSDD values for pollution severity assessment in some areas is necessary.
2.5. Effect of Measurement Intervals The ESDD results are shown in terms of measurements intervals in figures .8 .It can be seen that: 1) The cumulative process of pollution is ascendant, 2) Lack of rain provides maximum pollution degree in the last months of dry period.
Figure .5 Maximum ESDD of the 20 test stations
Figure .6 Maximum NSDD of the 20 test stations
Figure .7 Maximum NSDD/ESDD of the 20 test stations
Figure .8 Sampling-interval effects on ESDD
Figure .3 ESDD variations in different 3 months

CIRED2005 Session No 1
3. CLIMATE ASSESSMENT IMPORTANCE Climatic conditions play the main role in pollution process and flashover mechanism-the pollution result. Polluted particles deposition, pollution distribution on insulators surface, polluted condition stability and its penetration from sources to the network insulation are influenced by climate. The most effective atmospheric parameters on pollution, conductive film formation or self-cleaning of insulation, are relative and absolute humidity, dew, fog, rain, etc. It is known that polluted film without water has not any significant effect on insulation, but when it is aqueous, conductive layer forms and insulation damages. The other parameters are assessed carefully as the followings. [7, 8, 9] 3.1. Rain Period According to figure.9, rainless period is 7 month, so insulation self-cleaning lost its point. On the other hand, it rains instantaneously, intensely and rarely, thus the fault records are influenced at the beginning of rain period (figures .15) [6,7,9,10]. Effect of the dry period on pollution deposition process can be concluded from figures 13and 14. 3.2 . Ambient And Dew Point Temperature According to figure.9, maximum average monthly ambient temperature in dry period is 40ºC as well as hot seasons. In dry months, the maximum absolute temperature in the shade exceeds 46ºC. The high heat flow density in this high irradiance zone causes high insulator surface temperature i.e.65ºC. Considering insulators inherent properties, their materials, temperature fluctuations and mismatching with environment, dew phenomena occurred and wet the insulators surface. The site’s dew point is in the of summer even reaches to 30ºC. 3.3. Sand Storm Occurrence High sand and dust content in the air are typical for this climatic region and there are large deposits of sand on the Surface in many inland areas formerly covered by water. According to figure.10, the number of days with sandstorm days in dry period, especially at the beginning of spring and end of summer, increase considerably and affect on accumulation of polluted particles on insulation surface. These effects on ESDD and NSDD are shown in figures. 13 and 14. The No. of days with haze also follows the same regime. 3.4. Saturation Vapor Pressure and Relative Humidity
Variations of saturation vapor pressure, its degree and different relative humidity parameters are shown in figure.11. It can be seen that the damp conditions present whole a year (9 to 11 month). Damp maximum value at the end of summer that causes repetitive condensation on insulation surface and the subsequent T&D’s failures can be calculated by figures.15 and 16. The annual average relative humidity in the site is more than RH=60% and in the middle of winter it reaches to 70%. Annual average maximum humidity is 80 to 85% and the maximum absolute value is more than 95%. The maximum occurs at the end of the night and dawn. 3.5. Wind (Speed and Direction) It is very complicated to assess wind effect on flashover process and pollution deposition. Speed and direction of wind has both pollutant and cleaning effects. On the other hand, mild winds accelerate dew production, but severe winds influence adversely. According to the assessments of wind periods and their directions, prevail wind blow to south and south-west (figure.12), sea to coast in hot season, and transfer the suspense ions in atmosphere. 4. FAULT-PERFORMANCE RECORDS The flashovers on the network’s ceramic insulators are due to salt deposits, which in turn caused by rainless periods and seasonal winds. Faults records in T&D network of Hormozgan among 1999 to 2003 (four years) are shown in figure.15 and 16. It can be seen that the outages follow the climatic variations, thus intensification of atmospheric factors are the main reasons of these faults. [11] 5. CONCLUSIONS AND DISCUSSION 1-Maximum pollution degrees of the 20 test stations in Hormozgan are achieved in this research and effect of seasonal parameters on them were assessed. 2- According to the results, pollution degrees in some stations are more than IEC 60815 limits, so 31 mm/kV creepage distance is inefficient. Thus, higher creepage distances as well as more washing are required. The operation records confirm the above. 3-NSDD results indicate an abnormal (very high) degree, so different methods of maintenance should be considered. 4- According to the assessments of climate variations and pollution deposition on insulation, it is deducted that they follow an equal regime and the process can be simulated with neural networks and statistics methods. 5- According to outage-fault records in T&D network of Hormozgan during four years, the outage can be approximated and simulated by pollution deposition process as well as atmospheric variations. 6-Field measurements show that the site topography and distance from pollution resources are the two effective factors in pollution deposition.

CIRED2005 Session No 1
7-Considering field measurements results, creepage distances as well as maintenance periods (knowing insulators specification, operational voltage and environmental conditions) can be determined.
Figure .13 ESDD variations during the year
Figure .14 NSDD variations during the year
Figure .15 Fault Record –Distribution network
Figure .9 Rainfalls and mean of MAX Temperature
Figure .10 No of days with Sandstorm and Haze
Figure .11 Vapor Pressure and Relative Humidity
Figure .12 Prevail Wind Direction

CIRED2005 Session No 1
6. REFERENCS
[1] IEC 60815, 1986, “Guide for The Selection of Insulators in Respect of Polluted Conditions”. [2] IEC 60507, 1991-04, “Artificial Pollution Test on High Voltage Insulators to be used in A.C Systems” [3] CIGRE Taskforce 33-13-03, 2000, “Round Robin Pollution Monitor Study” [4] P.J.Lambeth, H.Auxel,“Methods of Measuring the Severity of Natural Pollution As it Affects H.V. Insulator Performance”, ELECTRA – No 20. [5] M.R.Shariati, A.R.Moradian, M.R.Ghaemi, M.Oskouee, A. Omidvarnia, B. Masoudi , 2004, “ Pollution Measurements Based On DDG Method for Different type Of Insulatore Profile” , CIGRE. [6] M.P. Arabani, A.R. Shirani, M. Hojjat, 2000 , “New Investigation On Insulation Failures in Iranian EHV Lines Located in Polluted Area” , CIGRE.
[7] A.D. TSANKAS, G.I. Papaefthimiou , D.P. Agoris, 2002, “Pollution Flashover Fault Analysis And Forecasting Using Neural Networks”, CIGRE. [8] F. Zedan, M.Akbar, 1990, “Performance Of H.V. Transmission Line Insulators In Desert Conditions”, IEEE. [9] Meteorological Data (1998-2003). [10] Operation History (1998-2003). 7. ENDNOTE N.R.I. is abbreviation of Niroo Research Institute and H.D.E.C is abbreviation of Hormozgan Distribution Electric Company.
Figure .16 Fault Record Transmission network