effect of best position blade pitching on power ... · turbine under different tsrs. the main...
TRANSCRIPT

© Faculty of Mechanical Engineering, Belgrade. All rights reserved FME Transactions (2018) 46, 560-566 560
Received: March 2018, Accepted: May 2018 Correspondence to: Ramesh K. Kavade, Research scholar and Asso. Prof. in Mech. Eng., Dr. D.Y. Patil Institute of Technology, Pimpri, Pune, India E-mail: [email protected] doi:5937/fmet1804560K
Ramesh K. Kavade Research Scholar
Dr. D. Y. Patil Institute of Technology,Pimpri, Pune,Maharashtra
India
Pravin M. Ghanegaonkar Principal & Professor in Mechanical
Engineering Department Keystone School of Engineering
Pune, Maharashtra India
Effect of Best Position Blade Pitching on Power Coefficient of VAWT at Different Tip Speed Ratio by SST & DMST Model This paper analyses the effect of best position blade pitching on the power coefficient of vertical axis wind turbine (VAWT) at different tip speed ratios (TSRs). Single Stream Tube (SST) and Double Multiple Stream Tube (DMST) models are used for present analysis. The results indicate that the best pitch position blade method improves the self- starting capacity and power coefficient of turbine.. The best position blade pitching curve-1 with 45° pitch angles gives maximum power coefficient for TSRs of 0.5 and the best position blade pitching curve-5 with 15° pitch angle gives maximum coefficient of power about 0.49 for TSR 2.5. The results of SST model are compared with DMST model and presented at the end of this paper. Keywords: Vertical axis wind turbine, Aerodynamics, single stream tube model, Double multiple stream tube model, Blade pitch angle, Coefficient of power
1. INTRODUCTION
Rapid increase in global energy requirement resulted in considerable attention towards renewable energy sources as there are shortages of fossil fuels. VAWT is one of the important options to produce sufficient electricity for household’s application at rural and urban area as it has got various advantages like simple in construction, low cost, works independently irrespective of wind direction and also operates well in turbulent wind conditions. This makes it suitable for power generation for house hold application in rural and urban areas in many countries.
Rasuo et al [1] developed the composite material turbine blade and full scale testing was carried out for behaviour analysis. The composite blade profile was fabricated from fibreglass skin. Biadgo, A. M., and Aynekulu, G [2] explained aerodynamic design methods based on general momentum theory and blade element momentum theory for horizontal axis wind turbine (HWAT). In this research the paper user interference computer program is written in VISUALBASIC to estimate the aerodynamic performance of the existing HAWT blades and used for performance analysis of turbine. Rasuo et al [3] and [4] used genetic algorithms for determination of optimum positions of single wind turbines within the wind farms installed on arbitrary configured terrains for maximum effectiveness. In wind farm layout optimization and the positions of the turbines should be adjusted freely so that the wind wake effects could be reduced.
Darrieus turbine operates basically on the lift force;
it was first developed by G.J. Darrieus, a French Engineer in 1925. It operates at higher rotational speed due to much higher relative wind velocities and produces more power [5-8]. The fixed pitch blade VAWTs are not able to start by itself. This type of turbine is less efficient at low wind speed. The above referred disadvantages of fixed pitch blade VAWTs are overcome in the turbine with variable pitch blades control methods [9-12]. The pitch control methods are being developed and presented by many researchers like Cooper and Kennedy, Lixun Zhang, B.K. Kirke, L. Lazauskas, D. W. Erickson, J. J. Wallace and J. Peraire, Palash Jain, A. Abhishek, Zhang Li-xun, and Liang Ying-pin as referred in the Ref. [13-22]. Some of the researcher proposed VAWTs with individual blade pitching and claimed 25% higher power coefficient than of collective pitch control. It is learnt from the literature survey that most of the referred pitch control methods are under develop and require more efforts to improve its performance [23-25].
As explained above, the methods used for pitching blades are still required more attention and investigation in order to enhance the overall performance of the turbine under different TSRs. The main objective of this research paper is to present the effect of different best position blade pitching curves on overall performance of the turbine to self-start at low wind speed and increase its power coefficient at various TSRs. In this paper SST and DMST mathematical models are developed and numerical analysis of the turbine and its comparison between SST and DMST is carried out to predict the performance of the turbine. 2. METHODOLOGY Various computational models have been previously used by many researchers to predict the performance of the wind turbine with their own strengths and

FME Transactions VOL. 46, No 4, 2018 ▪ 561
weaknesses. The detailed information of all these computational methods for a small scale VAWT can be referred from Ref. [6]. The momentum based modes like Single Stream Tube Model, Multiple Stream Tube Model and Double Multiple Stream Tube Model are the simplest and quickest among the others models. The present analysis is carried out with Single Stream Tube Model and results are compared with Double Multiple Stream Tube Model. 2.1 Single stream tube model Figure 1 represents the single stream tube model. This model is presented by Templin in 1974. The entire VAWT is supposed to be placed in the stream actuator as shown in the Figure1. Wind flows with free stream wind velocity (V∞) over the turbine in the stream tube and there is fractional decrease in wind velocity when it strikes the turbine. This fractional decrease in wind velocity is known as axial induction factor, ‘a’ and it is defined by the equation as,
aV Va
V∞
∞
−= (1)
Figure 1. Single stream tube model
Free stream velocity (V∞), induced velocity (Va) and wake velocity (Vw) zones are as shown in the Figure 1. The induced velocity is assumed to be constant throug–hout the induced velocity zone.
The induced velocity and Wake velocity can be expressed as,
)(aV V 1 a∞= − (2)
)(wV V 1 2a∞= − (3)
According to momentum principle across the stream tube, the force on the turbine is given as,
2aF 2 AV I= ρ (4)
where, I is interference factor and it given as,
aI1 a⎛ ⎞= ⎜ ⎟−⎝ ⎠
Figure 2 shows, the local velocity field and aerodynamic forces acting on the blade with pitch angle at specific azimuth angle in the rotation of the turbine.
The angle of attack (α) is calculated for variable pitch turbine as,
( )( )
1 sintan
cos− ⎛ ⎞θ
α = − γ⎜ ⎟⎜ ⎟θ + λ⎝ ⎠ (5)
Figure 2. Plan view of velocity triangle and various forces acting on variable blade pitch angle.
In case of fixed pitch consider γ=0 in the above equation.
The relative wind velocity (Vr ) can be also be obtained as,
( )( ) ( )( )2 2r aV V sin cos= θ + θ + λ (6)
The blade chord wise tangential force coefficient (Ct) and a normal force coefficient (Cn) can be obtained with CL and CD by the following equations,
( ) ( )t L DC C sin C cos= α + γ − α + γ (7)
( ) ( )n L DC C cos C sin= α + γ + α + γ (8)
For the turbine with number of blades ‘B’, the total torque becomes as,
2 2r t0
hcBRT V C d4πρ= θπ ∫ (9)
Then, we can calculate the power generated by turbine (Pt ) by the following equation as,
2 2t r t0
hcBRP T V C d4πρ ω= ×ω = θπ ∫ (10)
The total thrust on the turbine with number of blades ‘B’ is calculated by,
( ) ( )2 2r n t0
hcBF V C sin C cos d4
πρ= θ − θ θ⎡ ⎤⎣ ⎦π ∫ (11)
Interference factor given as,
( ) ( )2 2r n t2 0
aI V C sin C cos d
8V
πσ= θ − θ θ⎡ ⎤⎣ ⎦∫ (12)
where, σ is the solidity of the turbine and it is defined by following equation,
2Bc
Rσ =
π (13)
The efficiency or power coefficient (Cp) of turbine is the ratio of the turbine power output to the wind power input. It is calculated by following equations:

562 ▪ VOL. 46, No 4, 2018 FME Transactions
3w
1P AV2 ∞= ρ (14)
Power coefficient of the turbine is given as,
( )t
p 33a
PC
1 AV 1 I2
=ρ +
(15)
Performance of the turbine is analyzed by using above equations in the MATLAB programming.
2.2 Double Multiple Stream Tube (DMST) model The Double Multiple Stream Tube (DMST) model developed by Paraschivoiu I. and this model allowed for the difference between the upwind and downwind passes of each blade by dividing each stream tube into an upwind half and a downwind half as shown in Figure 3. The turbine’s interaction with the wind in the upwind and downwind passes of the blades separately.
In the upstream and downstream region, the free stream velocity (V∞u) is decreased along the axial direction of stream tube by interference factors au and ad such that the induced velocity (Vu), equilibrium induced velocity (Ve) and downstream induced velocity (Vd) can be given as,
u u uV V a∞= (16)
( )e u uV V 2a 1∞= − (17) d e dV V a= (18)
Figure 3. Schematic of Double Multiple Stream Tube Model
The interference factor, au for upstream side is calculated as,
( ) ( ) ( )/2 2
ruui n t2
u/2
VBcF sec C cos C sin d8 R V
+π
−π= θ θ − θ θ⎡ ⎤⎣ ⎦π ∫
The implicit expression is expressed as,
uui
aFπ=+ π
(19)
The upstream and downstream half power coeffi–cient given as,
pu qavuC C= ×λ (20)
pd qavdC C= ×λ (21)
The total power coefficient of turbine is the addition of upstream and downstream power coefficients
T pu pdC C C= + (22)
A Matlab program is developed by using the above referred two momentum models to calculate the various parameters of the turbine. In this Matlab program lift and drag coefficient for local Reynolds number and angle of attack are used from the data table by Sheldahl, & Klimas, 1981 [23].
3. VALIDATION OF PRESENT MODEL CODE: The SST model code is validated with the experimental results from the research paper reported in the Ref. [9]. The detailed specification of VAWT used in this refe–rence is as given in the Table 1. Figure 4 presents the comparison of power coefficient Vs TSRs CFD results of turbine used in Ref. [9] and present simulation code. The results developed by present simulation code indi–cate good correlation with Ref. [9]. Table 1: Specification of the turbine used in the reference [9]
Dimensional parameter Value Turbine height (h) 0.8 m Turbine radius (R) 0.4 m Chord length (c) 0.2 m Number of blades (B) 3 Blade profile NACA0018 Wind speed (V∞) 8 m/s
Figure 4. Validation of SST simulation code with results of turbine used in Ref. [9].
The DMST model code is also validated with the computational results from the research paper reported in Ref. [10]. The detailed specification of VAWT used in this reference is as given in the Table 2. The Figure 5 represents the comparison of power coefficient from DMST simulation code and results available in Ref. [10]. The results indicate good correlation with the simulation results available in this reference. Table 2: Specification of the turbine used in the Ref. [10]
Dimensional parameter Value Turbine height (h) 6.0 m Turbine radius (R) 3.0 m Chord length (c) 0.2 m Number of blades (B) 2 Blade profile NACA0015 Turbine speed (N) 125 rpm
FME Transactions VOL. 46, No 4, 2018 ▪ 563
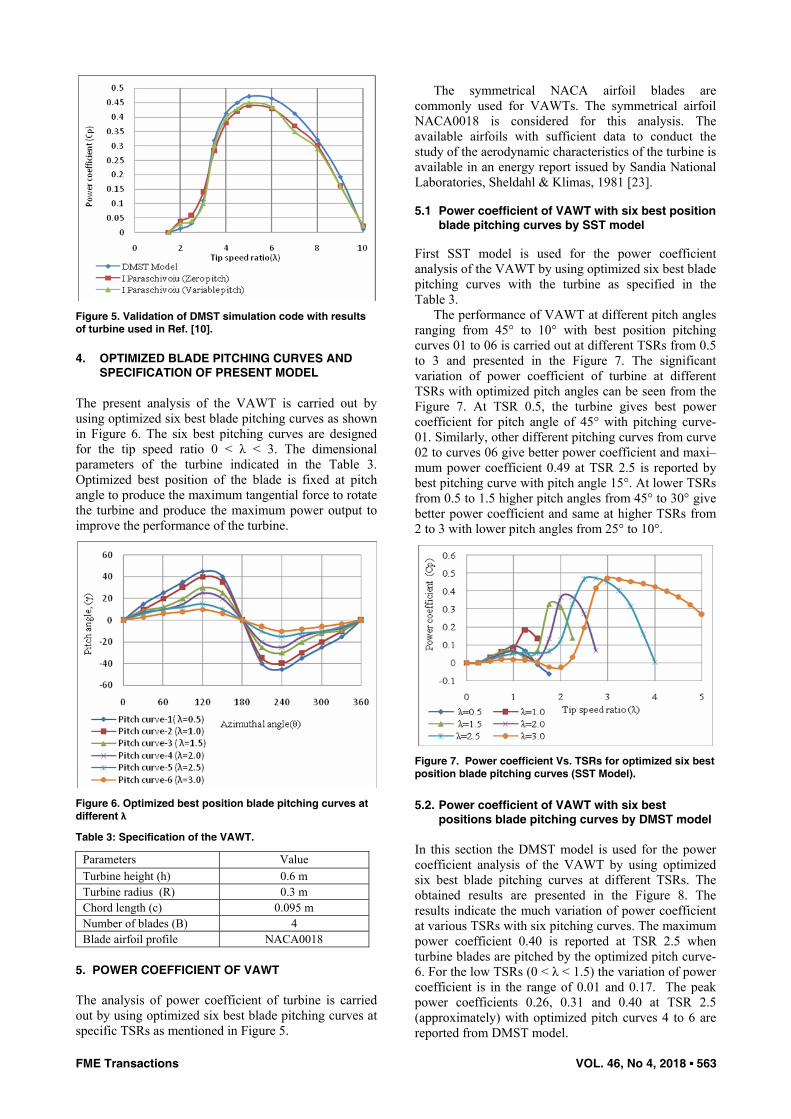
Figure 5. Validation of DMST simulation code with results of turbine used in Ref. [10]. 4. OPTIMIZED BLADE PITCHING CURVES AND
SPECIFICATION OF PRESENT MODEL The present analysis of the VAWT is carried out by using optimized six best blade pitching curves as shown in Figure 6. The six best pitching curves are designed for the tip speed ratio 0 < λ < 3. The dimensional parameters of the turbine indicated in the Table 3. Optimized best position of the blade is fixed at pitch angle to produce the maximum tangential force to rotate the turbine and produce the maximum power output to improve the performance of the turbine.
Figure 6. Optimized best position blade pitching curves at different λ
Table 3: Specification of the VAWT.
Parameters Value Turbine height (h) 0.6 m Turbine radius (R) 0.3 m Chord length (c) 0.095 m Number of blades (B) 4 Blade airfoil profile NACA0018
5. POWER COEFFICIENT OF VAWT The analysis of power coefficient of turbine is carried out by using optimized six best blade pitching curves at specific TSRs as mentioned in Figure 5.
The symmetrical NACA airfoil blades are commonly used for VAWTs. The symmetrical airfoil NACA0018 is considered for this analysis. The available airfoils with sufficient data to conduct the study of the aerodynamic characteristics of the turbine is available in an energy report issued by Sandia National Laboratories, Sheldahl & Klimas, 1981 [23].
5.1 Power coefficient of VAWT with six best position
blade pitching curves by SST model
First SST model is used for the power coefficient analysis of the VAWT by using optimized six best blade pitching curves with the turbine as specified in the Table 3.
The performance of VAWT at different pitch angles ranging from 45° to 10° with best position pitching curves 01 to 06 is carried out at different TSRs from 0.5 to 3 and presented in the Figure 7. The significant variation of power coefficient of turbine at different TSRs with optimized pitch angles can be seen from the Figure 7. At TSR 0.5, the turbine gives best power coefficient for pitch angle of 45° with pitching curve-01. Similarly, other different pitching curves from curve 02 to curves 06 give better power coefficient and maxi–mum power coefficient 0.49 at TSR 2.5 is reported by best pitching curve with pitch angle 15°. At lower TSRs from 0.5 to 1.5 higher pitch angles from 45° to 30° give better power coefficient and same at higher TSRs from 2 to 3 with lower pitch angles from 25° to 10°.
Figure 7. Power coefficient Vs. TSRs for optimized six best position blade pitching curves (SST Model).
5.2. Power coefficient of VAWT with six best
positions blade pitching curves by DMST model In this section the DMST model is used for the power coefficient analysis of the VAWT by using optimized six best blade pitching curves at different TSRs. The obtained results are presented in the Figure 8. The results indicate the much variation of power coefficient at various TSRs with six pitching curves. The maximum power coefficient 0.40 is reported at TSR 2.5 when turbine blades are pitched by the optimized pitch curve-6. For the low TSRs (0 < λ < 1.5) the variation of power coefficient is in the range of 0.01 and 0.17. The peak power coefficients 0.26, 0.31 and 0.40 at TSR 2.5 (approximately) with optimized pitch curves 4 to 6 are reported from DMST model.

564 ▪ VOL. 46, No 4, 2018 FME Transactions
Figure 8. Power coefficient Vs. TSRs for optimized six best position blade pitching curves (DMST Model).
The predicted power coefficient of turbine (h=0.6m, R=0.3m, c=0.095, B=4, AR=1.0 and σ =0.1591) at wind velocity 5 m/s with pitch angles varied from 10° to 45° (six best position pitch curves, Figure 6) is obtained by both SST and DMST model analysis and presented in the Figure 7 and Figure 8. It is observed that, all six best position blade pitching curves are suitable to produce maximum power from the turbine at TSRs ranging from 0.5 to 3. 5.3 Comparison of power coefficient between SST
and DMST model The result of power coefficient Vs.TSRs for optimized pitch curves 1-6 from SST and DMST models are obtained and their coparative results are presented in the figures from Figure 9 to Figure 14. It is clear from these figures that, power coefficient from SST model is higher than the DMST model for TSRs 1.5 < λ< 3. The very less variation of power coefficient in the range of TSRs 0 < λ < 1.5 is reported by the comparison of results of SST and DMST model. This is because SST model predicts higher power coefficient than the actual experimental results at high TSRs. In SST model analysis the wind variation across the turbine is not considered. This effect is increases with TSRs. In this model induced velocity is assumed uniform across the turbine. In the DMST model variation of induced velocity at upstream and downstream half is considered for the analysis of power coefficient. Therefore the results obtained from DMST model are less than those from SST model.
Figure 9. Power coefficient from SST and DMST model (Pitch curves-1)
Figure 10. Power coefficient from SST and DMST model (Pitch curves-2)
Figure 11. Power coefficient from SST and DMST model (Pitch curves-3)
Figure 12. Power coefficient from SST and DMST model (Pitch curves-4)
Figure 13. Power coefficient from SST and DMST model (Pitch curves-5)

FME Transactions VOL. 46, No 4, 2018 ▪ 565
Figure 14. Power coefficient from SST and DMST model (Pitch curves-6) 6. CONCLUSIONS In this research paper mathematical modelling and Matlab programming based on SST and DMST model is carried out to understand the power coefficient of the turbine.The following conclusions can be drawn from this research paper.
The maximum power coefficient can be obtained for variation of TSRs from 0.5 to 3 by using the six best position blade pitching curves with varying the pitch angle of the blades. For the present turbine from SST model, the maximum power coefficient of 0.49 is obtained by changing the pitch angles from 30° to 10° for variation of TSRs 1.8 to 3. High (about 45° to 40°) pitch angles with best position pitching curves 1 & 2 are preferred for TSRs below 1 (λ=1) in order to start the turbine by itself. The pitch angles from 30° to 10° with best position pitching curves 3 to 6 are suitable to gain the maximum power coefficient for TSRs in the range of 1.5 and 3. The maximum power coefficient (Cp) of 0.49 according to SST model and 0.40 according to DMST model is obtained from 5 m/s wind velocity at λ=2.5 for pitching curve-5 and pitching curve -6 respectively.
The SST model predicts higher power coefficient than the DMST model at high TSRs. The power coefficient from SST model is higher than the DMST model for TSRs 1.5 < λ < 3. The very less variation of power coefficient in the range of TSRs 0 < λ< 1.5 is reported by the comparison of the results for SST and DMST model.
ACKNOWLEDGEMENTS
The authors would like to be obliged to Board of Colleges and University Development (BCUD), Savitribai Phule Pune University, Pune for funds provided for this research project.
Also the author would like to appreciate the support provided by Mechanical Engineering Department, Dr. D. Y. Patil Institute of Technology, Pimpri, Pune, India during the computational programming work for this research project.
REFERENCES
[1] Rasuo, B., Dinulovic, M., Veg, A., Grbovic, A., Bengin, A.: Harmonization of new wind turbine rotor blades development process: A review,
Renewable and Sustainable Energy Reviews, Volume 39, pp. 874-882, November 2014.
[2] Biadgo, A.M., Aynekulu, G.: Aerodynamic Design of Horizontal Axis Wind Turbine Blades, FME Transactions, Vol. 45 No 4, pp 647-660, 2017.
[3] Rasuo, B., Bengin, A.: Optimization of Wind Farm Layout, FME Transactions, Vol. 38 No 3, pp 107-114, 2010.
[4] Rasuo, B., Bengin, A., Veg, A.: On Aerodynamic Optimization of Wind Farm Layout, PAMM, Vol. 10, Issue1, pp. 539–540, 2010.
[5] Beri, H., and Yao, Y.: Double multiple stream tube model and numerical analysis of vertical axis wind turbine. Scientific Research, Energy and Power Engineering, 3, 262-270, 2011.
[6] Carlos, M. X., Jose, C. P., and Michele, T.: Geothermal parameter influencing the aerodynamic efficiency of small scale self-pitch high- solidity VAWT. ASME, Vol. 138/031006-1, 2016.
[7] Islam, M., Ting, D. S.K., and Fartaj, A.: Aerodynamic models for Darrieus-type straight-bladed vertical axis wind turbines. Renewable and Sustainable Energy Reviews, 12, 1087-1109. 2008.
[8] Edwards, J. M., Lousis A. D., and Howell, R. J.: Novel experimental power curve determination and computational method for the performance analysis of vertical axis wind turbines, ASME, Vol.134/031008-1, 2012.
[9] Elkhoury, M., Kiwata,T., and Aoun, E.: Experimental and numerical investigation of three –dimensional vertical axis and wind turbine with variable –pitch. Journal of Wind Engineering and Industrial Aerodynamics, 139, 111-123, 2015.
[10] I. paraschivoiu, O. Trifu, and Saeed F.: H- Darrieus wind turbine with blade pitch control, International Journal of Rotating Machinery, Volume ID 5053343, 2009.
[11] Gang, D., and Wu, C. K.: Unsteady flow numerical simulation of vertical axis wind turbine. Procedia Engineering, 734-740, 2015.
[12] Howell, R., Qin, N., Edwards, J., and Durrani N.: Wind tunnel and numerical study of a small vertical axis wind turbine. Journal of Renewable Energy, 412-422, 2010.
[13] Cooper, P., and Kennedy, O. C.: Development and analysis of novel vertical axis wind turbine. Australian and New Zealand Solar Energy Society, 1-9, 2004.
[14] Jain, P., and Abhishek, A.: Performance prediction and fundamental understanding of small scale vertical axis wind turbine with variable amplitude blade pitching. Journal of Renewable Energy, 97-113, 2016.
[15] Kalakanda, A. S., and Nallapaneni, M. K.: Vertical axis wind turbine- aerodynamic modeling and its testing in wind tunnel. Procedia Computer Science, 1017-1023, 2016.
[16] Kirke, B. K., Benoit, P.: Predicted and measured performance of a vertical axis wind turbine with

566 ▪ VOL. 46, No 4, 2018 FME Transactions
passive variable pitch compared to fixed pitch. Journal of Wind Engineering, 1-27, 2016.
[17] Kirke, B. K., and Lazauskas, L.: Limitations of fixed pitch Darrieus hydrokinetic turbines and the challenge of variable pitch. Journal of Renewable Energy, 36, 893-897, 2011.
[18] Liang,Y., Zhang, L., and Zhang F.: Blade pitch control of straight-bladed vertical axis wind turbine, Springer, 23:1106-1114, 2016.
[19] Lixun, Z., Liang,Y. Erxiao, L., Zhang, S., Jian, G.: Vertical axis wind turbine with individual active blade pitch control. IEEE, 978-1-4577-0547-2/12, 2012.
[20] Paraschivoiu, I.: Double-multiple streamtube model for studying vertical axis wind turbine. Journal of Propulsion and Power, 4(4), 370-377,1948.
[21] ]Rathod, P., Khatik, K., Shah, K., Desai, H., Shah, J.: A review on combined vertical axis wind turbi-ne, International Journal of Innovative Research in Science, Engineering and Technology, 2007.
[22] Samanoudy, M., Ghorab, A. A.,Youssef, Z.: Effect of some design parameters on the performance of a Giromill vertical axis wind turbine, Ain Shams Engineering Journal, 1, 85-95, 2010.
[23] Sheldahl, R. E., Klimas, P.C.: Aerodynamics characteristics of Seven Symmetrical Airfoil Sections through 180-degree angle of attack for use in aerodynamic analysis of Vertical Axis Wind Turbines, Sandia National Laboratories, Technical report no. SAND, 80-2114, 1981.
[24] Zamani, M., Maghrebi, M. J., and Varedi, S. R.: Starting torque improvement using J-shaped straight-bladed Darrieus vertical axis wind turbine by means of numerical simulation. Journal of Renewable Energy, 109-126, 2016.
[25] Zhang, L., Liang, Y., LIU, X., and Jian, G.: Effect of blade pitch angle on aerodynamic performance of straight-bladed vertical axis wind turbine. Springer, 21:1417-1427, 2014.
NOMENCLATURE
ρ Density of air μ Dynamic viscosity m Mass flow rate c Blade chord length R Radius of turbine D Diameter of turbine h Height of turbine S Area of blades σ Turbine solidity
B Number of blades Cp Power coefficient Ct Torque coefficient A Swept area Fn Normal force Ft Tangential force F Total thrust of turbine T Instantaneous torque CD Drag coefficient CL Lift coefficient Cn Normal force coefficient Ct Tangential force coefficient Re Reynolds number V∞ Free stream velocity Va Induced velocity Vw Wake velocity Vr Relative velocity a Velocity induction factor θ Azimuth angle γ Blade pitch angle α Angle of attack u Blade velocity λ Tip speed ratio ω Angular velocity Pt Turbine power Pw Wind power I Interference factor
УТИЦАЈ НАЈБОЉЕГ ПОЛОЖАЈА ЛОПАТИЦЕ НА КОЕФИЦИЈЕНТ СНАГЕ ВЕТРОТУРБИНЕ СА ВЕРТИКАЛНОМ ОСОМ ОБРТАЊА ПРИ РАЗЛИЧИТОМ ОДНОСУ КОЕФИЦИЈЕНТА РАДА РОТОРА КОД SST И DMST МОДЕЛА
Р.К. Каваде, П.М. Ганегаонкар
Анализира се утицај најбољег положаја лопатице на коефицијент снаге ветротурбине са вертикалном осом обртања при различитом односу коефицијента рада ротора. SST и DMST модели се користе за анализу. Резултати показују да метод најбољег положаја лопатице побољшава капацитет само–покретања и коефицијент снаге турбине. Крива-1 најбољег положаја лопатице под углом од 45o даје максимални коефицијент снаге код коефицијента рада ротора 0,5, док крива-5 најбољег положаја лопатице под углом од 15o даје максимални коефицијент снаге код коефицијента рада ротора 2,5. Резултати добијени за оба модела су упоређени и приказани на крају рада.