effect of a kind of metal cation on corrosion mechanism of a3003 aluminum … · 2016-08-23 · and...
TRANSCRIPT

Effect of a Kind of Metal Cation on Corrosion Mechanism of A3003 Aluminum Alloy in Tap Water
Kyohei Otani1,*, Masatoshi Sakairi2 and Akira Kaneko3
1Graduate School of Engineering, Hokkaido University, Sapporo 060–8628, Japan2Faculty of Engineering, Hokkaido University, Sapporo 060–8628, Japan3Nikkei Research & Development Center, Nippon Light Metal Co. Ltd., Shizuoka 421–3291, Japan
Effect of a kind of metal cation on corrosion mechanism of A3003 aluminum alloy in tap water was investigated by electrochemical tech-niques and immersion corrosion tests. Corrosion rate of the aluminum alloy decreased with increase in a hardness of cation, except for Mg2+. XPS analyses showed metal cations, classi�ed as a hard acid in tap water were incorporated in hydroxides on the aluminum alloy. The results suggest that the incorporated cations have corrosion inhibitory effect (e.g., Ca2+ and Zn2+) or corrosion promotive effect (e.g., Mg2+). These different effects can be explained by difference in molar volume between hard metal cation’s hydroxide and aluminum hydroxide. [doi:10.2320/matertrans.M2016030]
(Received January 26, 2016; Accepted June 16, 2016; Published July 25, 2016)
Keywords: corrosion, aluminum alloy, oxide �lm, metal cation, tap water
1. Introduction
Aluminum alloys are widely used because of their high strength/weight ratios and their good corrosion resistance in many environments. The presence of protective �lms on the alloys is a key point for their high corrosion resistance. In general, the protective �lms are destroyed by chloride ions, and the corrosion rate of aluminum alloys therefore depends on the concentration of chloride ions in the environment. Cor-rosion sometimes occurs on aluminum alloys in tap water de-spite the low concentration of chloride ions in the tap water. A few studies have shown the corrosion behavior of alumi-num alloys in tap water1–6). Tohma et al. investigated the cor-rosion of aluminum alloys in model tap water and actual tap water7). However, they did not report quantitative effect of all ions in the tap water on the corrosion behavior of aluminum alloys.
It is well known that tap water also contains dilute metal cations, however, there have been few studies on the effects of metal cations on corrosion behavior of aluminum alloys in tap water. The authors expected that the metal cations in tap water may in�uence the corrosion mechanism of aluminum alloys. The HSAB (Hard and Soft Acids and Bases) concept8) is useful for understanding interactions between metal cat-ions in tap water and the protective �lm of aluminum alloys. In the HSAB concept, Lewis acids and bases9) are divided into “hard” and “soft”. Strong and stable bonds are formed between hard acids and hard bases and between soft acids and soft bases. There are oxygen ions in the outermost layer of the protective �lm, and hard acids therefore easily bond with the oxygen ions. However, the incorporation cannot be arranged linearly by the qualitative HSAB concept. The authors used hardness of cations, X, which based on HSAB concepts to explain the degree of the incorporation quantitatively10). The results showed that the corrosion rate of aluminum alloys tends to decrease with increase in X11–14). However, the effect of metal cations on the corrosion mechanism of the alloy was
not clari�ed.In this study, changes of the corrosion mechanism of an
A3003 aluminum alloy by the metal cations in model tap wa-ter were investigated by electrochemical measurements with electrochemical impedance spectroscopy (EIS) and immer-sion corrosion tests following surface analysis with scanning electron microscopy and energy dispersion spectroscopy (SEM-EDS) and X-ray photoelectron spectroscopy (XPS). Specimens with smooth surfaces were used to determine the changes in protective �lm structure, �ne depth pro�le, and corrosion inhibitory/promotive effects of hard metal cations on the �lms.
2. Experimental
2.1 SpecimensA3003-H24 aluminum alloy sheets were used as speci-
mens, and composition of the alloy is shown in Table 1. The sheets were cut into specimens with size of 7 × 7 mm for im-mersion corrosion tests and 10 × 10 mm for electrochemical measurements. A Pb-free solder wire was connected to each specimen for electrochemical measurements. The both speci-mens were molded in epoxy resin (Struers Ltd., EpoFix Res-in). The exposed surface of each molded specimen was ground with silicon carbide abrasive papers from #600 to #4000 and �nally polished by buf�ng. The polishing was im-portant for clarifying the surface state of the aluminum alloy. Before the immersion tests, the specimens were taken out from the epoxy resin. The specimens were ultrasonically cleaned in ethanol and then in highly puri�ed water.
2.2 SolutionsFour different salt solutions, 1 mol m−3 NaCl (Nasol),
* Corresponding author, E-mail: [email protected]
Table 1 Chemical composition of A3003-H24 aluminum alloy (mass%).
Cu Si Fe Mn Mg Zn Ti Al
0.11 0.36 0.55 1.08 <0.01 0.01 0.03 bal.
Materials Transactions, Vol. 57, No. 9 (2016) pp. 1539 to 1546 ©2016 The Japan Institute of Metals and Materials

0.5 mol m−3 CaCl2 (Casol), 0.5 mol m−3 MgCl2 (Mgsol), and 0.5 mol m−3 ZnCl2 (Znsol) were used as model tap water. The pH values of the solutions were approximately 6. For electro-chemical measurements, 0.5 kmol m−3 H3BO3 - 0.05 kmol m−3 Na2B4O7 (borate) was added to each solution as a supporting electrolyte, and the main metal cation in the solutions was Na+. All of the solutions were air-saturated. In this study, Nasol was regarded as a standard solution. The concentration of chloride ion in each solution was adjusted to 1 mol m−3, the same concentration as that in tap water. All chemicals were special grade and obtained from Kanto Chemical Co. Ltd. The hardness of cation, X, is expressed as follows10):
X = X0M + In
1/2 2/10 (1)
where X 0M is the electronegativity of metal atoms, and In is the total ionized potential from neutral metal atoms to a given oxidized state, n. The hardness of cations, X, calculated by eq. (1) increases in the order of Na+, Ca2+, Mg2+, and Zn2+ (Table 2).
2.3 Corrosion tests2.3.1 Immersion corrosion test
The specimens were immersed in the solutions for 2.59 Ms (30 d) and 86.4 ks (1 d) at 298 K. The bottles were open to the air during immersion test. The mass of each specimen was measured before and after the test. After the immersion corro-sion test, the surfaces of the specimens were observed by an optical microscope (WRAYMER INC., BM-3400TTRL), a laser scanning confocal microscope (LSCM, Lasertec Ltd., 1LM21D), and a scanning electron microscope (SEM, JEOL Ltd., JSL6510-LA). The area ratio between the pitted area and smooth surface area in an optical microscope image (area ratio of pits) was calculated by using image analysis software (Wayne, Rasband Image J)15,16). A cross section polisher (CP, JEOL Ltd., SM-09010) was used to prepare cross sections of the specimens. The surface of the specimens was analyzed by using an energy dispersion X-ray spectroscope (EDS) at-tached to the SEM and an XPS (JEOL Ltd., JPS-9200) using an Mg Kα X-ray source (1253.6 eV). The area analyzed by XPS was 1 × 1 mm, and depth pro�les were obtained by Ar ion sputtering. The sputtering time was converted to depth by applying a sputtering-rate model assuming a sputtering rate of SiO2.2.3.2 Electrochemical measurement
All electrochemical measurements were carried out in a three-electrode cell using a potentiostat (IVIUM TECHNOL-OGIES, Compactstat). Before the measurements, the work-ing electrodes were immersed in the solutions for 3.6 ks (1 h) at 298 K until steady open-circuit potential was reached. A Pt plate of 18 cm2 in size and an Ag/AgCl-saturated KCl elec-trode were used as counter and reference electrodes, respec-tively. Electrochemical impedance measurements were car-ried out under the frequency range from 10 kHz to 10 mHz
and a modulation amplitude of 10 mV. Reproducible data were obtained in all electrochemical tests.
3. Results
3.1 Long-term corrosionFigure 1 shows surface optical microscope images of the
specimens (a) before immersion and after immersion for 2.59 Ms (30 d) in (b) Nasol, (c) Casol, (d) Mgsol, and (e) Znsol. Smooth and pit-free surface is observed before the test, and small black dots in the images are intermetallic compounds (Fig. 1 (a)). It can be clearly seen that there are many large pits of more than 10 µm in diameter in the specimens after immersion in Nasol (Fig. 1 (b)) and Mgsol (Fig. 1 (d)). The diameter and the number of pits in the specimen after immer-sion in Casol are decreased (Fig. 1 (c)) in comparison with Fig. 1 (b). There is no pit in the specimen after immersion in Znsol (Fig. 1 (e)). Area ratios of the pits calculated by optical images are shown in Table 3. The area ratio of the pits de-creased with increase in X except for the specimen after im-mersion in Mgsol. Mass change rates in the immersion tests also decreased with increase in X except for the specimen af-ter immersion in Mgsol (Table 4).
Figure 2 shows surface SEM images of the specimens (a) before immersion and after immersion for 2.59 Ms (30 d) in (b) Nasol, (c) Casol, (d) Mgsol, and (e) Znsol. The specimen be-fore immersion has smooth surface with both black and white intermetallic compounds (Fig. 2 (a)). There is no pit in the
Table 3 Area ratio of the pits calculated by optical images (%).
Nasol Casol Mgsol Znsol
64.8 24.4 64.5 6.0
Table 2 Hardness of cations, X.
Nasol Casol Mgsol Znsol
1.01 2.59 3.54 4.64
Fig. 1 Surface optical microscope images of the specimens (a) before im-mersion and after immersion for 30 d in (b) Nasol, (c) Casol, (d) Mgsol, and (e) Znsol.
1540 K. Otani, M. Sakairi and A. Kaneko
specimen after immersion in Nasol (Fig. 2 (b)) and Mgsol (Fig. 2 (d)). These results are independent of the optical mi-croscope results in Fig. 1 (b) and (d) and indicate that optical-ly transparent corrosion products are formed on aluminum alloys. The specimen after immersion shows some pits and smooth surface in Casol (Fig. 2 (c)). It can be clearly seen that there was no pitting corrosion but that there was a large amount of corrosion products on the specimen after immer-sion in Znsol (Fig. 2 (e)). Figure 3 shows surface SEM image around the area where corrosion products were peeled off from the specimen after immersion in Nasol. There are areas
with pits (Area 1) and corrosion products (Area 2), and the corrosion product was assigned to aluminum oxide by EDS analysis.
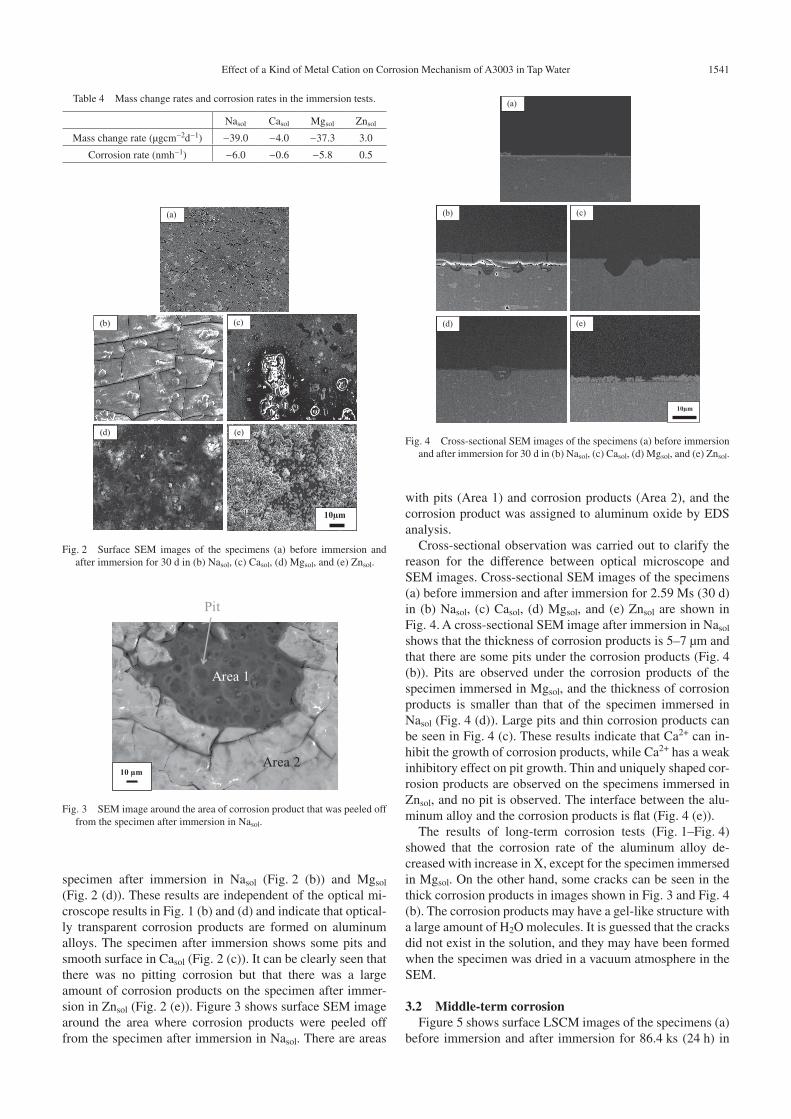
Cross-sectional observation was carried out to clarify the reason for the difference between optical microscope and SEM images. Cross-sectional SEM images of the specimens (a) before immersion and after immersion for 2.59 Ms (30 d) in (b) Nasol, (c) Casol, (d) Mgsol, and (e) Znsol are shown in Fig. 4. A cross-sectional SEM image after immersion in Nasol shows that the thickness of corrosion products is 5–7 µm and that there are some pits under the corrosion products (Fig. 4 (b)). Pits are observed under the corrosion products of the specimen immersed in Mgsol, and the thickness of corrosion products is smaller than that of the specimen immersed in Nasol (Fig. 4 (d)). Large pits and thin corrosion products can be seen in Fig. 4 (c). These results indicate that Ca2+ can in-hibit the growth of corrosion products, while Ca2+ has a weak inhibitory effect on pit growth. Thin and uniquely shaped cor-rosion products are observed on the specimens immersed in Znsol, and no pit is observed. The interface between the alu-minum alloy and the corrosion products is �at (Fig. 4 (e)).
The results of long-term corrosion tests (Fig. 1–Fig. 4) showed that the corrosion rate of the aluminum alloy de-creased with increase in X, except for the specimen immersed in Mgsol. On the other hand, some cracks can be seen in the thick corrosion products in images shown in Fig. 3 and Fig. 4 (b). The corrosion products may have a gel-like structure with a large amount of H2O molecules. It is guessed that the cracks did not exist in the solution, and they may have been formed when the specimen was dried in a vacuum atmosphere in the SEM.
3.2 Middle-term corrosionFigure 5 shows surface LSCM images of the specimens (a)
before immersion and after immersion for 86.4 ks (24 h) in
Table 4 Mass change rates and corrosion rates in the immersion tests.
Nasol Casol Mgsol Znsol
Mass change rate (µgcm−2d−1) −39.0 −4.0 −37.3 3.0
Corrosion rate (nmh−1) −6.0 −0.6 −5.8 0.5
Fig. 2 Surface SEM images of the specimens (a) before immersion and after immersion for 30 d in (b) Nasol, (c) Casol, (d) Mgsol, and (e) Znsol.
Fig. 3 SEM image around the area of corrosion product that was peeled off from the specimen after immersion in Nasol.
Fig. 4 Cross-sectional SEM images of the specimens (a) before immersion and after immersion for 30 d in (b) Nasol, (c) Casol, (d) Mgsol, and (e) Znsol.
1541Effect of a Kind of Metal Cation on Corrosion Mechanism of A3003 in Tap Water

(b) Nasol, (c) Casol, (d) Mgsol, and (e) Znsol. Gray intermetallic compounds (Al-Mn-Fe) and black intermetallic compounds (Al-Si) can be seen in the specimen (Fig. 5 (a)). There are a large pit and many small pits in the specimens immersed in Nasol (Fig. 5 (b)) and Mgsol (Fig. 5 (d)). On the other hand, no large pit is observed in the specimens immersed in Casol and Znsol, and the number of small pits is decreased with increase in X.
XPS surface analyses of the immersed specimens were car-ried out to investigate the incorporation of metal cations, and XPS narrow spectra of metal cations with depth can clarify the position of metal cations in the protective �lms. Figure 6 shows XPS narrow spectra of metal cations at different depths
of metal cations in specimens after immersion for 24 h in (a) Nasol, (b) Casol, (c) Mgsol, and (d) Znsol. There is no Na+ on the specimen after immersion in Nasol (Fig. 6 (a)).
Mg 2p peaks in Fig. 6 (c) indicates that magnesium com-pound precipitated on the specimen after immersion in Mgsol. This result and the LSCM result (Fig. 5 (d)) indicate that the precipitated Mg2+ has no ability to improve corrosion resis-tance of the protective �lm on the aluminum alloy. From the condition of the immersion tests and the obtained peaks in Fig. 6 (c), the possible magnesium compound is Mg(OH)2 (49.3 eV), MgO (50.8 eV), and MgCO3 (52.0 eV)17). The po-sition of the peaks (approximately 49.2 eV) in Fig. 6 (c) indi-cates that MgO and MgCO3 is not suitable as the precipitated compound. For the reason, it is estimated that the Mg(OH)2 precipitated on the specimen.
There are Ca 2p3/2 peaks and Zn 2p3/2 peaks in Fig. 6 (b) and (d), hence calcium compound and zinc compound would be precipitated on the specimens after immersion in Casol and Znsol. Therefore, the observed compound of metal cations might be incorporated into the protective �lm and incorpora-tion of Ca2+ and Zn2+ improves the corrosion resistance of the �lm on the aluminum alloy. From the condition of the tests and the obtained peaks in Fig. 6 (b), the possible calcium compound is CaCO3 (349.3 eV) and Ca(OH)2 (353.2 eV)18). From the position of the peaks (approximately 349.2 eV) in Fig. 6 (b), CaCO3 would precipitated on the specimens. The obtained peaks in Fig. 6 (d) suggest that the possible zinc compound is ZnO (1022.1 eV), ZnCO3 (1023.3 eV), and Zn(OH)2 (1023.5 eV)19). Tamura has reported that ZnO and ZnCO3 have large solubility in the solution with pH less than 720). Furthermore, Pourbaix diagram21) suggests that Zn(OH)2 is possible to precipitate on the specimen in Znsol with pH 6. From these reason, the zinc compound on the specimen would be Zn(OH)2.
Figure 7 (a) shows Al 2p narrow spectra at different depths of the specimen after immersion in Mgsol for 24 h. Curve �t-ting was performed to assign the peaks in Fig. 7 (a) by using previously reported data for Al (72.7 eV)22) and Aluminum hydroxide (75.7 eV)23). The identi�ed aluminum hydroxide was also con�rmed from O 1s narrow spectra of the same specimen as Fig. 7 (a). In Fig. 7 (b), the solid line is the XPS Al 2p spectrum at a depth of 25 nm in Fig. 7 (a), and the bro-ken line is calculated by a curve �tting. The �tted lines �t on both the broad and narrow peaks. In Fig. 7 (a), a broad peak of Al(OH)3 from 0 nm to 10 nm and a narrow peak of Al from 5 nm to 50 nm can be seen. These results indicate that 10-nm-thick corrosion products were formed on the aluminum alloy after immersion in Mgsol for 24 h.
Fig. 5 Surface LSCM images of the specimens (a) before immersion and after immersion for 24 h in (b) Nasol, (c) Casol, (d) Mgsol, and (e) Znsol.
Fig. 6 XPS narrow spectra of metal cations at each depth of the surface layer of the specimens after immersion for 24 h in (a) Nasol, (b) Casol, (c) Mgsol, and (d) Znsol.
Fig. 7 Al 2p narrow spectra at each depth of the specimen after immersion in Mgsol for 24 h.
1542 K. Otani, M. Sakairi and A. Kaneko

Figure 8 shows XPS depth pro�les of specimens after im-mersion for 24 h in (a) Nasol, (b) Casol, (c) Mgsol, and (d) Znsol. The intersection point between the black broken line [Al(OH)3] and black solid line [Al] indicates the approximate thickness of corrosion products. Al(OH)3 and aluminum were separated by previously described curve �tting. The value of the intersection point is more than 25 nm on the specimen after immersion in Nasol (Fig. 8 (a)). On the other hand, the values of the intersection point are less than 10 nm in the
solutions with hard metal cations such as Casol (Fig. 8 (b)), Mgsol (Fig. 8 (c)), and Znsol (Fig. 8 (d)). These results suggest that the hard metal cations have the ability to prevent the growth of corrosion products on an aluminum alloy.
3.3 Initial stage of corrosionEIS was carried out to clarify the effect of metal cations on
the surface states of the protective �lms. The surface state may not change during EIS measurements because of slow corrosion rates of the aluminum alloy in used solutions (Ta-ble 4). Figure 9 shows the results of EIS for (a) Bode plots and (b) Nyquist plots and �tted lines correspond to the plots of experimental values in the solutions, and it can be seen that
Fig. 8 XPS depth pro�les in composition of surface layer of the specimens after immersion for 24 h in (a) Nasol, (b) Casol, (c) Mgsol, and (d) Znsol.
Fig. 9 Results of EIS for the specimen immersed in the solutions for 1 h. (a) Bode plots and (b) Nyquist plots with �tted lines corresponding to the plots of experimental values. Fig. 10 Values of (a) Rsol, (b) Rct, and (c) CPE as a function of X.
1543Effect of a Kind of Metal Cation on Corrosion Mechanism of A3003 in Tap Water

impedance spectra change depending on the kinds of metal cations. Nyquist plots show capacitive loops, and the diame-ter of the loop indicates the electrical resistivity of the solu-tion/specimen interface on the specimen. The �tted lines were calculated by Randle’s equivalent circuit, and the �tted lines correspond to the plots of the experimental values (Fig. 9 (b)). This model was used for �tting and consisted of solution resistance (Rsol), charge-transfer resistance of the protective �lm (Rct), and constant phase element of the pro-tective �lm (CPE).
The values of (a) Rsol, (b) Rct, and (c) CPE as a function of X are shown in Fig. 10. Rct increased with increase in the hardness of cation except for Mg2+ (Fig. 10 (b)). These results correspond to previous results for both long-term corrosion and middle-term corrosion. In Fig. 10 (a) and (c), the values of Rsol and CPE are not changed by the hardness of cations. These results indicate that the metal cations only in�uence the charge transfer reaction.
4. Discussion
4.1 Initiation of localized corrosion of aluminum alloyThe effect of chloride ions on the protective �lm of alumi-
num alloys will be explained to understand the corrosion mechanism in tap water. Incorporation of the chloride ions into the protective �lm has been discussed in terms of surface attractive forces24–29). Alwitt et al. reported that the outermost layer of the protective �lm in chloride solution consisted of aluminum hydroxides, and the chloride ions easily incorpo-rate in the hydroxides due to the large electronegativity of chloride ions30,31). The incorporation of chloride ions into the outermost layer of the protective �lm was elucidated by Au-ger electron spectroscopy (AES)32). The incorporated chlo-ride ions �nally cause a localized dissolution on aluminum alloys.
4.2 Corrosion mechanism in solution containing metal cations with small X
Schematic representations of corrosion mechanism of the aluminum alloy in solution containing metal cations with small X such as Na+ are shown in Fig. 11. There is no incor-poration of metal cations on the aluminum alloy in the case of Nasol as shown by results of XPS analysis in Fig. 6 (b). The previous study showed that the protective �lm of an alumi-num alloy is multi-layer structure: hydroxides and oxide lay-er29). Chloride ions would be incorporated in the hydroxides (Fig. 11 (a)), and its incorporation may cause the formation of AlCl3 (Fig. 11 (b)). The formed AlCl3 dissolves in the solu-tion due to its high degree of solubility (Fig. 11 (c)). This dissolution of AlCl3 means that localized corrosion is initiat-ed on the aluminum alloy.
4.3 Corrosion mechanism in solutions containing metal cations with large X
Schematic representations of corrosion mechanism of the aluminum alloy in solution containing metal cations with large X (hard metal cation) such as Mg2+, Ca2+ and Zn2+ are shown in Fig. 12. According to the HSAB concept, the hard metal cations (hard acids) in the solution easily incorporate in the oxygen ions (hard bases) of the hydroxides on the alumi-
num alloy (Fig. 12 (a)), and then the incorporated metal cat-ions would form the hydroxide layer of metal cation on the aluminum alloy (Fig. 12 (b) and (d)). The results of this study suggest that the hydroxide layer of the metal cations have an inhibitory effect (Ca2+, Zn2+) or a promotive effect (Mg2+) on corrosion of the aluminum alloy. These different effects can be explained by the difference in molar volume between hard
Fig. 11 Corrosion mechanism of the aluminum alloy in the solutions con-taining metal cations with small X.
1544 K. Otani, M. Sakairi and A. Kaneko

metal cation’s hydroxide and aluminum hydroxide. Table 5 shows molar volumes of hydroxides of the metal cations used in this study and aluminum.
In the case of the hydroxide layer of the metal cations has the corrosion inhibitory effect (Ca2+, Zn2+), the difference in the molar volume between the hard metal cation’s hydroxide and aluminum hydroxide is small (Table 5). The small differ-ence in the molar volume means that difference of interatom-ic distance between metal ions and hydroxyl groups at the Zn-OH/Al-OH interface is small, therefore, little internal stress may be generated and few defects may occur at the in-terface (Fig. 12 (b)). The interface has few defects contributes to an increase in the corrosion resistance of the protective �lm on the aluminum alloy (Fig. 12 (c)).
In the case of the hydroxide layer of the metal cations has the corrosion promotive effect (Mg2+), the difference in molar volume between magnesium hydroxide and aluminum hy-droxide is large (Table 5). From the large difference in molar volume, internal stress may be generated at the Mg-OH/Al-OH interface, and the stress will cause many defects in the protective �lm (Fig. 12 (d)). Chloride ions penetrate the pro-tective �lm through the cracks, and localized corrosion will occur at the crack sites in the protective �lm (Fig. 12 (e)).
5. Summary
Effect of a kind of metal cation on corrosion mechanism of A3003 aluminum alloy in tap water were investigated by op-tical microscopy, SEM, LSCM, XPS, and electrochemical techniques.
(1) The corrosion rate of the aluminum alloy in the model tap water decreased with increase in metal cation hardness, except for Mg2+.
(2) XPS analysis showed that hard metal cations were in-corporated in the protective �lms of the aluminum alloy.
(3) Charge-transfer resistance increased with increase in hardness of cations, except for Mg2+.
(4) The different effects of hard metal cations can be ex-plained by difference in molar volume between hard metal cation’s hydroxide and aluminum hydroxide. This suggests that hardness and molar volume of hydroxide are useful to speculate the corrosion rate of an aluminum alloy in tap wa-ter.
Acknowledgments
This study was supported by Hokkaido University Clark Memorial Foundation and by the Salt Science Research Foundation and was conducted at Laboratory of XPS analy-sis, Hokkaido University, supported by “Nanotechnology Platform” Program of the Ministry of Education, Culture, Sports, Science and Technology (MEXT), Japan.
REFERENCES
1) K. Furumata, T. Suzuki, J. Kobayashi and O. Seri: JJILM 51 (2001) 242–245.
2) R. Takabeya: Boshoku Gijutsu 35 (1986) 623–632. 3) T. Sakaida, H. Ikeda and Z. Tanabe: Sumitomo Keikinzoku Giho 26
(1985) 221–229. 4) K. Tohma and Y. Takeuchi: JJILM 29 (1979) 498–504. 5) R.J. Gray, J.C. Griess, R.S. Crouse and J.H. DeVan: Microstructural
Science 6 (1978) 261–278. 6) I. Uchiyama, K. Ohno and E. Sato: Aruminyumu Kenkyu Kaishi 103
(1976) 67–68. 7) K. Tohma and Y. Takeuchi: JJILM 29 (1979) 498–504. 8) R.G. Pearson: J. Am. Chem. Soc. 85 (1963) 3533–3539. 9) G. N. Lewis: Valence and the Structure of Atoms and Molecules (The
chemical Catalog Co., New York, 1923). 10) M. Misono, E. Ochiai, Y. Saito and Y. Yoneda: J. Inorg. Nucl. Chem. 29
(1967) 2685–2691. 11) M. Sakairi, Y. Shimoyama and D. Nagasawa: Corrosion Scinece and
Technology 7 (2008) 168–172. 12) M. Sakairi, A. Kaneko, T. Kikuchi, Y. Seki and D. Nagasawa: Proceed-
ings of Eurocorr2009 (2009) NO. SS 17-0-7947. 13) K. Otani, M. Sakairi, T. Kikuchi and A. Kaneko: Zairyo-to-Kankyo 59
(2010) 330–331. 14) K. Otani, M. Sakairi, R. Sasaki, A. Kaneko and Y. Seki: J. Solid State
Electrochem. 18 (2014) 325–332. 15) W. S. Rasband: ImageJ, U. S. National Institutes of Health, Bethesda,
Maryland, USA, http://imagej.nih.gov/ij/, 1997–2012. 16) C.A. Schneider, W.S. Rasband and K.W. Eliceiri: Nat. Methods 9
(2012) 671–675. 17) D. Tie, F. Feyerabend, N. Hart, R. Willumeit and D. Hoeche: Adv. Eng.
Mater. 12 (2010) 699–704. 18) W. Gu, D.W. Bous�eld and C.P. Tripp: J. Mater. Chem. 16 (2006)
3312–3317. 19) G. Ballerini, K. Ogle and M.-G. Barthés-Labrousse: Appl. Surf. Sci.
253 (2007) 6860–6867.
Fig. 12 Corrosion mechanism of the aluminum alloy in the solutions con-taining metal cations with large X.
Table 5 Molar volumes of the hydroxides of metal cations used in this study and aluminum (cm3mol−1).
NaOH CaCO3 Mg(OH)2 Zn(OH)2 Al(OH)3
18.78 34.16 24.71 32.60 32.23
1545Effect of a Kind of Metal Cation on Corrosion Mechanism of A3003 in Tap Water

20) H. Tamura: Tetsu-to-Hagane 89 (2003) 1165–1169. 21) M. Pourbaix: Atlas of Electrochemical Equilibria in Aqueous Solu-
tions, (Pergamon Press Ltd., Oxford, 1966). 22) Y. Baba, T.A. Sasaki and I. Takano: J. Vac. Sci. Technol. A 6 (1988)
2945–2952. 23) M.R. Alexander, G.E. Thompson and G. Beamson: Surf. Interface
Anal. 29 (2000) 468–477. 24) T.P. Hoar: Corros. Sci. 7 (1967) 341–355. 25) E. McCafferty: Corros. Sci. 45 (2003) 1421–1438. 26) P.M. Natishan, E. McCafferty and G.K. Hubler: J. Electrochem. Soc.
133 (1986) 1061–1062.
27) P.M. Natishan, E. McCafferty and G.K. Hubler: J. Electrochem. Soc. 135 (1988) 321–327.
28) T.H. Nguyen and R.T. Foley: J. Electrochem. Soc. 127 (1980) 2563–2566.
29) M. Sakashita and N. Sato: Corrosion (Houston) 35 (1979) 351–355. 30) R.S. Alwitt: J. Electrochem. Soc. 121 (1974) 1322–1328. 31) R. S. Alwitt: Oxides and Oxide Films, 4, (Marcel Dekker, New York,
1976) pp. 169–253. 32) J. R. Galvele: Proc. of 4th Int. Symp. Passivity (The Electrochemical
Society, 1978) pp. 285–327.
1546 K. Otani, M. Sakairi and A. Kaneko