ee3561_unit 4(c)al-dhaifallah14351 ee 3561 : computational methods unit 4 : least squares curve...
TRANSCRIPT

EE3561_Unit 4 (c)AL-DHAIFALLAH1435 1
EE 3561 : Computational MethodsUnit 4:
Least Squares Curve Fitting
Dr. Mujahed Al-Dhaifallah (Term 342)
Reading Assignment : 17.1 - 17.3

Elementary Statistics A statistical sample is a fraction or a portion of
the whole (population) that is studied. For example Consider Table 1 which contains 14
measurements of the concentration of sodium chlorate produced in a chemical reactor operated at a pH of 7.0.
EE3561_Unit 4 (c)AL-DHAIFALLAH1435 2

Elementary Statistics One of the measures of the spread of the data is
the range of the data. The range is defined as the difference between the maximum and minimum value of the data as R
However, range may not give a good idea of the spread of the data as some data points may be far away from most other data points (such data points are called outliers).
EE3561_Unit 4 (c)AL-DHAIFALLAH1435 3

Elementary Statistics That is why the sum of the square of the
differences is considered a better measure. The sum of the squares of the differences, also called summed squared error (SSE), St , is given by
Since the magnitude of the summed squared error is dependent on the number of data points, an average value of the summed squared error is defined as the variance, σ2
EE3561_Unit 4 (c)AL-DHAIFALLAH1435 4

Elementary Statistics To bring the variation back to the same level of
units as the original data, a new term called standard deviation, σ , is defined as
Furthermore, the ratio of the standard deviation to the mean, known as the coefficient of variation is also used to normalize the spread of a sample.
EE3561_Unit 4 (c)AL-DHAIFALLAH1435 5

Example
EE3561_Unit 4 6

Example
EE3561_Unit 4 (c)AL-DHAIFALLAH1435 7

EE3561_Unit 4 (c)AL-DHAIFALLAH1435 8
MotivationGiven a set of experimental data
x 1 2 3
y 5.1 5.9 6.3
•The relationship between x and y may not be clear
•we want to find an expression for f(x)
1 2 3

EE3561_Unit 4 (c)AL-DHAIFALLAH1435 9
Curve Fitting Given a set of tabulated data, find a curve
or a function that best represents the data.
Given:1.The tabulated data2.The form of the function3.The curve fitting criteria
Find the unknown coefficients

EE3561_Unit 4 (c)AL-DHAIFALLAH1435 10
Selection of the functions
knownare)(
)()(
)(
)(
)(
0
0
2
xg
xgaxfGeneral
xaxfPolynomial
cxbxaxfQuadratic
bxaxfLinear
k
m
kkk
n
k
kk

EE3561_Unit 4 (c)AL-DHAIFALLAH1435 11
Decide on the criterion
2
,0
1. Least Squares
min ( )
2.Exact Matching (interplation)
( )
n
i ia b
i
i i
f x f
f f x
Chapter 17
Chapter 18

EE3561_Unit 4 (c)AL-DHAIFALLAH1435 12
Least Squares
xi x1 x2 …. xn
yi y1 y2 …. yn
Given
The form of the function is assumed to be known but the coefficients are unknown
iii exfy )(The difference is assumed to be the result of experimental error

EE3561_Unit 4 (c)AL-DHAIFALLAH1435 13
Determine the Unknowns
2
1
We want to find a, b to minimize
( , ) ( )
How do we obtain and to minimize ( , )?
n
i ii
a b f a bx
a b a b

EE3561_Unit 4 (c)AL-DHAIFALLAH1435 14
Determine the Unknowns
0),(
0),(
minimum for thecondition Necessary
b
ba
a
ba
EE3561_Unit 4 (c)AL-DHAIFALLAH1435 15
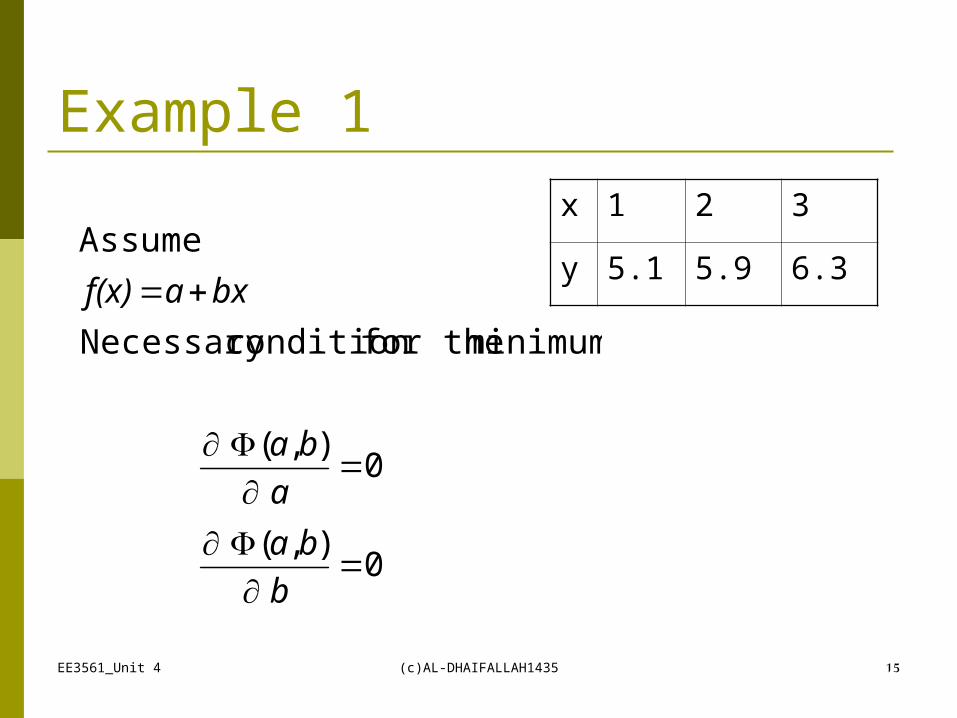
Example 1
0),(
0),(
minimum for thecondition Necessary
Assume
b
ba
a
ba
bxaf(x)
x 1 2 3
y 5.1 5.9 6.3

EE3561_Unit 4 (c)AL-DHAIFALLAH1435 16
Remember
1 1
1 1
( ) ( )
n n
i ik k
n n
i ik k
da x x
da
g x a g xa

EE3561_Unit 4 (c)AL-DHAIFALLAH1435 17
Example 1
N
kkk
N
kk
N
kk
N
kk
N
kk
k
N
kkk
N
kkk
yxbxax
ybxaN
xybxab
ba
ybxaa
ba
11
2
1
11
1
1
Equations Normal
20),(
20),(

EE3561_Unit 4 (c)AL-DHAIFALLAH1435 18
Example 1
N
kk
N
kk
N
kk
N
kk
N
kk
N
kk
N
kkk
xbyN
a
xxN
yxyxN
b
11
2
11
2
111
1
gives Equations Normal theSolving

EE3561_Unit 4 (c)AL-DHAIFALLAH1435 19
Example 1
i 1 2 3 sum
xi 1 2 3 6
yi 5.1 5.9 6.3 17.3
xi2 1 4 9 14
xi yi 5.1 11.8 18.9 35.8

EE3561_Unit 4 (c)AL-DHAIFALLAH1435 20
Example 1
60.04.5667
8.35146
3.1763
Equations Normal
11
2
1
11
baSolving
ba
ba
yxbxax
ybxaN
N
kkk
N
kk
N
kk
N
kk
N
kk

EE3561_Unit 4 (c)AL-DHAIFALLAH1435 21
Example 2
data. fit the to
)cos()ln()(
form theoffunction a find torequired isIt xecxbxaxf
x 0.24 0.65 0.95 1.24 1.73 2.01 2.23 2.52
y 0.23 -0.23 -1.1 -0.45 0.27 0.1 -0.29 0.24

EE3561_Unit 4 (c)AL-DHAIFALLAH1435 22
Example 2
EquationsNormal
c
cba
b
cba
a
cba
0),,(
0),,(
0),,(
minimum for thecondition Necessary

EE3561_Unit 4 (c)AL-DHAIFALLAH1435 23
Example 2
equations normal thesolve and sums theEvaluate
)()())((cos)()(ln
)(cos)()(cos)(cos)(cos)(ln
)(ln)()(ln)(cos)(ln)(ln
8
1
8
1
28
1
8
1
8
1
8
1
8
1
28
1
8
1
8
1
8
1
28
1
kkkk
k
k
x
kk
k
x
k
xk
x
kk
kkk
x
kk
kkk
kk
kkk
x
kkk
kk
kk
eyecexbexa
xyexcxbxxa
xyexcxxbxa

Example 2
EE3561_Unit 4 (c)AL-DHAIFALLAH143524
i 1 2 3 4 5 6 7 8 sum
xi .24 0.65 .95 1.24 1.73 2.01 2.23 2.52
yi 0.23 -0.23 -1.1 -0.45 0.27 0.1 -0.29 0.24
ln(xi) -1.4 -0.43 -0.05 0.22 0.55 0.7 0.8 0.92
cos(xi) 0.97 0.8 0.58 0.32 -0.16 -0.43 -0.61 -0.81
exi 1.27 1.92 2.59 3.46 5.64 7.46 9.3 12.42
(ln(xi))2 2.04 0.19 0.003 0.046 0.3 0.49 0.64 0.85 4.56
ln(x)cos(x) -1.39 -0.34 -0.03 0.07 -0.09 -0.3 -0.5 -0.75 -3.32
ln(xi) exi -1.81 -0.82 -0.13 0.74 3.09 5.21 7.46 11.49 25.2
ln(xi) yi -0.32 0.1 0.056 -0.1 0.15 0.07 -0.23 0.22 -0.06
(cos(xi))2 0.94 0.63 0.34 0.11 0.03 0.18 0.38 0.66 3.26
cos(xi)exi 1.23 1.52 1.5 1.12 -0.89 -3.17 -5.7 -10.1 -14.5
cos(xi)yi 0.22 -0.18 -0.64 -0.15 -0.04 -0.04 0.18 -0.2 -0.85
(exi)2 1.62 3.67 6.69 11.94 31.82 55.7 86.49
154.5 352.4
exiyi 0.29 -0.44 -2.84 -1.56 1.52 0.75 -2.7 2.98 -1.99

Example 2
EE3561_Unit 4 (c)AL-DHAIFALLAH1435 25
4.56 -3.32 25.2 -0.06
-3.32 3.26 -14.5 -0.85
25.2 -14.5 352.4 -1.99
a
b
c
Solve to get
-0.89
-1.11
0.0124
a
b
c

EE3561_Unit 4 (c)AL-DHAIFALLAH1435 26
How do you judge performance?
best? select theyou do How
data, fit the tofunctions moreor Given two
sense. square
least in thebest theissmaller in resulting
function The one.each for computethen
functioneach for parameters theDetermine
:
Answer

EE3561_Unit 4 (c)AL-DHAIFALLAH1435 27
Multiple RegressionExample:Given the following data
It is required to determine a function of two variables
f(x,t) = a + b x + c t to explain the data that is best
in the least square sense.
t 0 1 2 3
x 0.1 0.4 0.2 0.2
f(x,t) 3 2 1 2

EE3561_Unit 4 (c)AL-DHAIFALLAH1435 28
Solution of Multiple Regression
Construct , the sum of the square of the error and derive the necessary conditions by equating the partial derivatives with respect to the unknown parameters to zero then solve the equations.
t 0 1 2 3
x 0.1 0.4 0.2 0.2
f(x,t) 3 2 1 2

EE3561_Unit 4 (c)AL-DHAIFALLAH1435 29
Solution of Multiple Regression
02),,(
02),,(
02),,(
conditionsNecessary
),,(
),(
4
1
4
1
4
1
4
1
2
ii
iii
ii
iii
iiii
iiii
tfctbxac
cba
xfctbxab
cba
fctbxaa
cba
fctbxacba
ctbxatxf

EE3561_Unit 4 (c)AL-DHAIFALLAH1435 30
Nonlinear least squares
problems + More Examples of nonlinear least squares Solution of inconsistent equations Continuous least square problems

EE3561_Unit 4 (c)AL-DHAIFALLAH1435 31
data. fit thebest that form theoffuction a find bxae
ii
ii
i
bx
ii
bx
bx
ii
bx
ii
bx
ebayaeb
eyaea
yae
3
1
3
1
3
1
2
0
0
usingobtained are Equations Normal
Nonlinear Problem
Given x 1 2 3
y 2.4 5. 9

EE3561_Unit 4 (c)AL-DHAIFALLAH1435 32
data. fit thebest that form theoffuction a find bxae
solve) easier to( use willWe
using of Instead
)ln()ln(
bxln(a)ln(y)z Define
3
1
2
3
1
2
iii
ii
bx
ii
zbx
yae
yzandaLet
i
Alternative Solution(Linearization Method)
Given x 1 2 3
y 2.4 5. 9

EE3561_Unit 4 (c)AL-DHAIFALLAH1435 33
Inconsistent System of Equations
solution No
Equations of systemnt inconsiste is This
10
6
4
1.43
22
21
equations of system following theSolve
:Problem
2
1
x
x

EE3561_Unit 4 (c)AL-DHAIFALLAH1435 34
Inconsistent System of EquationsReasons
Inconsistent equations may occur because of presence of noise in input or output data, or modeling error, etc.
Solution if all lines intersect at one point

EE3561_Unit 4 (c)AL-DHAIFALLAH1435 35
Inconsistent System of EquationsFormulation as a least squares problem
error squaresleast theminimize to and Find
10
6
4
1.43
22
21
as equations thecan view We
21
3
2
1
2
1
xx
x
x

EE3561_Unit 4 (c)AL-DHAIFALLAH1435 36
Solution
12262.4936.6
)822416()62.3388()6.2484(0
)011.43(2.86)22(44)2(40
926.3628
)60248()6.2484()1882(0
)011.43(66)22(44)2(20
minimize to and Find
)011.43(6)22(4)2(
21
21
2121212
21
21
2121211
21
221
221
221
xx
xx
xxxxxxx
xx
xx
xxxxxxx
xx
xxxxxx

EE3561_Unit 4 (c)AL-DHAIFALLAH1435 37
Solution
0.9799 , 2.0048
:
12262.4936.6
926.3628
:equations Normal
21
21
21
xx
Solution
xx
xx

EE3561_Unit 4 (c)AL-DHAIFALLAH1435 38
data. fit thebest that b)/(ax1 form theoffuction a find
3
1
2
3
1
2
use willWe
bax
1 using of Instead
1
bax1
z Define
bax
1f(x)
iii
ii
ii
zbax
y
yzLet
y
Examples (Linearization Method)
Given x 1 2 3
y 0.23 .2 .14

Exercise
EE3561_Unit 4 (c)AL-DHAIFALLAH1435 39