ee limited annual report group and company financial ... f… · customers” driving customer...
TRANSCRIPT

Company number: 02382161
EE Limited
Annual Report
Group and Company Financial Statements
Year ended 31 December 2015

EE Limited
Contents
Directors and advisers ............................................................................................................................ 3
Strategic Report ...................................................................................................................................... 4
Directors’ Report ................................................................................................................................... 11
Directors’ statement of responsibilities .................................................................................................. 13
Independent auditor’s report to the members of EE Limited ................................................................ 14
Group income statement ....................................................................................................................... 16
Statements of comprehensive income .................................................................................................. 17
Statements of financial position ............................................................................................................ 18
Group statement of changes in equity .................................................................................................. 20
Company statement of changes in equity ............................................................................................. 21
Statements of cash flows ...................................................................................................................... 22
Notes to the Financial Statements ........................................................................................................ 24

EE Limited
3
Directors and advisers
Directors Marc David Allera – appointed 29 January 2016 Stephen Christopher Harris – appointed 29 January 2016 Stephen John Best – appointed 29 January 2016 Jeffrey Neil Langlands – appointed 29 January 2016 Mark Gareth Tipton – appointed 29 January 2016 John Howard Watson – appointed 29 January 2016 Olaf Swantee – resigned 29 January 2016 Neal Milsom – resigned 29 January 2016 Gervais Pellissier – resigned 29 January 2016 Thomas Dannenfeldt – resigned 29 January 2016 Thorsten Langheim - appointed 1 September 2015, resigned 29 January 2016 Arnaud Marie Julien Castille - appointed 1 September 2015, resigned 29 January 2016 Michail Tsamaz - resigned 1 September 2015 Delphine Ernotte Cunci - resigned 1 September 2015
Secretary James Blendis
Registered office Trident Place Mosquito Way Hatfield Hertfordshire AL10 9BW
Auditors Ernst & Young LLP 1 More London Place London SE1 2AF

EE Limited
4
Strategic Report
Introduction
EE Limited (“EE” or “the Group”) is the UK’s largest mobile communications provider with 31.5 million connections (2014: 30.9 million) and estimated mobile subscriber market share of 31% (2014: 32%) (source: Enders Analysis). The Group, which operates exclusively in the UK, offers mobile services (consisting of voice, messaging and data services) and fixed voice, TV and broadband services to both retail and business customers through multiple telecommunications technologies.
EE runs the UK’s biggest and fastest mobile network, having launched the UK’s first 4G mobile service in 2012, with 4G population coverage now exceeding 95%, complementing existing 3G and 2G coverage of 98% and 99% respectively.
The Group was formed on 1 April 2010 when Orange S.A. (“Orange”) and Deutsche Telekom A.G. (“DT”) combined their respective UK mobile businesses as a joint venture.
On 15 December 2014, DT and Orange entered into exclusive negotiations with BT Group plc (“BT”) to sell EE, based on an enterprise value of £12.5 billion. Regulatory approval for the transaction was granted on 15 January 2016 and the transaction completed 29 January 2016.
Business model
EE has made significant long term investments in building a nationwide mobile network, partly shared with another operator via the Mobile Broadband Networks Limited joint operation, and also in radio spectrum to enable 2G, 3G and 4G services.
Further investment is also required to acquire and retain customers, through both subsidised devices (smartphones, tablets and other connected devices) and third party commissions. These customers are then supported by an extensive customer service capability in the form of call centres, high street shops and the EE website.
Revenues are generated from fixed monthly payments made by postpaid customers, who typically join on two year contracts, and upfront payments for voice, text and data usage from prepaid customers. When calls and texts from EE customers are made to non-EE customers the receiving network charges EE an interconnect cost, similarly EE receives interconnect revenue for calls and texts received from other networks.
Approximately 30 Mobile Virtual Network Operators (MVNOs) use the EE network for their customers. EE receives revenues from these MVNOs via wholesale agreements.
EE also has fixed broadband customers, with the broadband and voice service provided via a wholesale agreement with BT Group plc. Many of these fixed broadband customers also buy fixed voice, mobile and TV services from EE.
Strategy
The Group’s objectives are to be a clear market leader, maximising value for its shareholders and customers, while at the same time contributing to the social and economic well-being of the UK. In pursuit of these objectives, the Group’s strategy is focussed on three core areas – “Our customers” driving customer loyalty, “Our company” ensuring operational excellence and “Our future” creating the platform for secure long term growth. This is supported by strong cash flows and a conservative financing structure.
The Group aims to be the number one for customer loyalty in the UK. It looks to deliver exceptional customer service through its retail networks, customer operations and on-line channels. The Group’s leading network infrastructure allows it to deliver superior coverage and capacity, positively differentiating its network experience in the wider mobile marketplace. The Group focuses relentlessly on its customers’ experience, driving their satisfaction and loyalty.
The Group continually invests in new capabilities to lead in the industry’s development, meet evolving customer demand and provide the platform from which to drive and optimise future growth opportunities. The Group is committed to the development of the next generation of mobile technology, 5G, being a core member of the 5G Innovation Centre at the University of Surrey, and is actively involved in the international standard setting process.

EE Limited
5
Strategic Report (continued)
Key performance indicators
The most significant financial and operational key performance indicators the Directors use to manage the group are:
Financial
Operating revenue is total revenue less revenue received from the sale of handsets and other devices to customers. It is a measure of the ongoing revenue generated by EE’s customers for the use of services provided by EE.
Adjusted EBITDA is total revenue less operating costs. It excludes management fees, exceptional items and depreciation & amortisation (which are non-cash costs) and is therefore a good indicator of controllable profit and cash generation.
Adjusted EBITDA margin is adjusted EBITDA divided by total revenue. One of the key targets set at the formation of EE was to improve the adjusted EBITDA margin to 25%; this was achieved in the year ended 31 December 2014.
Capital expenditure
Mobile telecommunications is an investment intensive business with rapidly changing technology driving continual fixed asset additions.
Operational
Customer base customers are the main driver of revenue for EE. The number of customers (“the base”) and their growth is closely monitored as a leading indicator of future revenue growth.
4G base EE was the first UK mobile network operator to launch 4G in 2012. EE has encouraged existing customers on 2G and 3G tariffs to move across to the new 4G service, and it has also used 4G as a key differentiator to attract new customers from competitors. 4G offers customers significantly faster data rates than 2G and 3G; this user benefit should increase loyalty and help drive future revenues.
Average Revenue Per User (“ARPU”) is an indicator of EE’s ability to drive revenues from new and existing customers, offset by the external pressures of price competition and price reductions imposed by the regulators.
Churn is the number of customers leaving in a period divided by the average customer base and is a measure of customer loyalty and satisfaction. As it is costly to acquire new customers, incurring device subsidy and commission costs, EE aims to minimise churn.
Operating Review
During 2015, EE built on its 4G leadership and the previous five years of successfully integrating Orange and T-Mobile. Adjusted EBITDA margin increased to 28.2% (2014: 25.1%) as adjusted EBITDA increased 12.1% year on year to £1,781 million (2014: £1,589 million). As at 31 December 2015 the 4G base was 14.1 million (31 December 2014: 7.7 million) with 4G network coverage now extended to 95% of the population. Operating revenue was stable year on year at £6,002 million (2014: £6,041 million) as the benefits from 4G adoption were offset by increased regulation of mobile call termination, non-geographic number charges and EU Roaming. The number of Business customers grew by 7% in 2015, as Business to Business (“B2B”) customers became increasingly aware of the benefits of 4G. The Machine to Machine (“M2M”) base was also up 13% year on year, with the Royal Mail Group announced as the first major customer on the new 4G M2M platform. The introduction of EE TV, fibre capability and competitive pricing helped the Fixed Broadband base grow 12% year on year to 933,000.

EE Limited
6
Strategic Report (continued)
Operating Review (continued)
The prepaid base declined 8% year on year, following the market trend of declining demand for prepaid services due to competitively priced postpaid offers. During the year the Group continued its capital expenditure programmes. Total expenditure on tangible fixed assets was £505 million (2014: £475 million), supporting an increase in 4G population coverage from 80% to 95%, and growth of the 4G base to 14.1 million. In December 2015 EE was awarded the contract to provide the UK’s emergency services 4G mobile communications network. This multi-year contract, with service starting in 2017, is the world’s first 4G emergency services network and will consolidate EE’s position as the UK’s premier mobile network.
Our customers
Over the year, EE added 437,000 net postpaid customers (2014: 551,000), increasing the postpaid proportion of the customer base (excluding M2M) to 63%. The 4G base reached 14.1 million, with an increase of 6.4 million customers in the year, supported by price range extension, success of EE branded devices, prepaid plans and innovations such as voice over wi-fi. Business adoption of 4G remains strong. EE has over 30 MVNO partners, including Virgin, BT and The Post Office. The M2M business grew rapidly in the year to 2.2 million connections. By the end of 2015 EE had 31.5 million network connections (2014: 30.9 million), including MVNO and M2M subscribers.
Churn was 1.1% per month for postpaid mobile customers in 2015 (2014: 1.2%), and 2.0% per month for total mobile customers in 2015 (2014: 2.1%).
Average revenue per user was £27.8 per month for postpaid mobile customers in 2015 (2014: £28.9 per month) reflecting price competition and regulatory cuts. At a total mobile level, combining post and prepaid customers, ARPU was stable year on year at £18.9 per month as the ratio of postpaid to prepaid customers increased.
EE will continue to leverage the network capacity to maximise connections on the network. Under a new theme of connectivity EE has launched a range of devices and services aimed at consumer and business markets, including the 4GEE Action Cam, in-car wi-fi, 4G Rapid Site and Connected Health. EE has launched a range of products for businesses aimed at connecting workers, their customers, and machines as the Internet of Things has an increasing impact on business. Key applications include the emergency services, where the new technology will reduce response times and facilitate the rapid communication of critical data.
Our company
EE made considerable progress in the year on improving customer service as evidenced by a continuous reduction in the volume of complaints to Ofcom (the independent regulator and competition authority for UK communications industries) and sustained low postpaid churn. The percentage of customer calls handled onshore has increased 10 percentage points year on year and customer self-serve logins per month, using the EE app and EE website, have increased 36% year on year. 500 new roles were also created in Fixed Broadband customer service to replicate the Mobile service improvements.
Continued optimisation of the Retail store estate resulted in an increase in store catchment area of 3%, ending the year with 563 shops (2014: 580 shops).
Our future
EE has made good progress in strengthening and monetising the Group’s network leadership. EE is the only UK network providing double speed 4G and greater capacity across 81% of the UK population, and 4G+ in Greater London. By December 2015, EE covered 95% of the population with 4G. Independent benchmarking by RootMetrics ranked EE number one for overall performance of any UK network in 2015. Independent testing by P3 also ranked EE overall number one operator in October 2015.

EE Limited
7
Strategic Report (continued)
Operating Review (continued)
Our future (continued)
EE will look to monetise both the quality and speed of its mobile internet experience and the quantity of mobile data, with EE Regular, EE Extra and EE Complete price plans, each with tiered data bundles. EE will seek to continue to successfully upgrade existing 2G and 3G customers to 4G.
Corporate Responsibility
With EE’s vision to deliver the best network and the best service to ensure our customers trust us with their digital lives, stakeholder trust is at the core of our corporate responsibility plan. The Group has a comprehensive issue management system that identifies and addresses key business sustainability risk areas such as child safety, supply chain and environmental impact. The Group also invests in our communities, working with the charity Go ON UK to help improve the digital skills of 1 million people through Techy Tea Parties and offering a range of print and online resources as well as skills-based customer service. The Group has addressed youth unemployment by bringing over 1,000 apprentices into the business since the scheme began 3 years ago. This scheme also received an award in the Deputy Prime Minister’s Opening Doors awards and has won the Business in the Community ‘Inspiring Young Talent’ award.
Results and financial position
The Group’s total revenue was stable at £6.3 billion (2014: £6.3 billion) for the year, with the impact of regulatory rate cuts and prepaid decline partially offset by growth in the postpaid customer base and fixed broadband and wholesale divisions. Adjusted EBITDA, which excludes restructuring and exceptional expenses, brand and management fees, was £1,781 million (2014: £1,589 million), to give an adjusted EBITDA margin of 28.2% (2014: 25.1%), as a move towards acquiring and retaining customers through EE’s own distribution channels contributed towards lower commercial costs. Improved adjusted EBITDA and exceptional expenses in 2015 contributed to operating profit of £507 million (2014: loss £152 million).
During the year the Group reached agreements on settlements with various operators relating to the provision for historic non-geographic number disputes. The Group recognised £20 million income in relation to a contract amendment and EE disposed of its investment in Weve Limited, resulting in a £4 million net loss.
The profit after tax for the year ended 31 December 2015 was £332 million (2014: loss £217 million). Tax expense in the year was £84 million (2014: £38 million income) as the Group moved from an operating loss in 2014 to an operating profit in 2015. Detailed results for the year are shown in the Group income statement on page 16.
Dividends declared and paid during the year totalled £650 million (2014: £551 million). This was equivalent to £29.48 per share (2014: £24.99 per share).
The net assets of the Group decreased from £8,921 million at 31 December 2014 to £8,652 million at 31 December 2015, mainly due to the dividends paid.
A significant source of liquidity for the Group comes from cash generated from trading activities; net cash provided by operating activities in the year was £1,273 million (2014: £1,188 million).
During the year the Group continued its capital expenditure programmes. Total expenditure on tangible fixed assets was £505 million (2014: £475 million), supporting an increase in 4G population coverage from 80% to 95%, and growth of the 4G base to 14.1 million.
Capital Structure
At the end of the year, the leverage ratio was 0.97x Net Debt to EBITDA, well within the financial policy of maintaining, in the medium term, a leverage ratio of below 1.75-2.00x.
Long-term funding for the Group is provided by Euro and Sterling denominated bonds issued by EE Finance plc under its Euro Medium Term Note programme, together with a sterling denominated bank facility and revolving credit facility provided by a consortium of Banks and a

EE Limited
8
Strategic Report (continued)
Capital Structure (continued)
European Investment Bank loan. The Group is exposed to Euro denominated interest rate payments on its Euro bonds; these interest obligations have been swapped to Sterling by entering into cross currency interest rate swaps as detailed further in Note 32 to the accounts.
Both Standard and Poor’s and Moody’s rate EE bonds as investment grade, BBB/positive and Baa2/positive respectively.
The main sources of liquidity include cash generated from operations, a syndicated loan facility provided by the above mentioned consortium of banks, and a working capital facility provided jointly by the Group’s shareholders.
Risk and uncertainties
The Group’s business is directly impacted by the external environment, and in particular the regulatory environment and competitive marketplace in which it operates.
The Group’s Risk Governance framework provides assurance that significant risks are identified and addressed. An active risk management process identifies, assesses, mitigates and reports on strategic, financial, operational and compliance risk.
The principal themes of risk for the Group are:
The level of competitive and consolidation activity in the telecommunications market;
Disruption to telecommunications networks, IT infrastructure and supply chain;
The impact of regulation;
Spectrum factors;
Customer privacy and security of data; and
Other financial risks.
The level of competitive & consolidation activity in the telecommunications market
Risk
The Group operates in a highly competitive marketplace within the UK, where there is possible consolidation between existing mobile network operators and other service providers seeking to strengthen their market position.
Impact
Failure to achieve a sustainable revenue stream could erode competitive position and reduce profitability, cash flow and the ability to invest for the future.
Mitigation
The Group will continue to invest to differentiate on network performance and customer service.
EE Limited
9
Strategic Report (continued)
Risk and uncertainties (continued)
Disruptions to telecommunications networks, IT infrastructure or supply chain
Risk
The Group is dependent on the secure and stable operation of its telecommunications networks and IT infrastructure as well as the continued provision of critical equipment and services through its supply chain.
Impact
Failures in the Group’s infrastructure, either through incident, disaster or malicious attack, could lead to the loss of customer or commercially sensitive data, or reduced availability of systems or services which may be critical to the operation and effectiveness of the Group. This could also result in damage to reputation, as well as a loss of revenue and customer confidence.
Supplier failures typically result in an increased cost and have the potential to adversely impact customer service and brand perception. If the Group were unable to find an alternative supplier, customer commitments could also be compromised, potentially leading to contractual breach, loss of revenue or penalties.
Mitigation
The Group attempts to mitigate the threat of malicious attack by employing measures including comprehensive monitoring of the telecommunications networks, backup systems and protective systems such as firewalls, virus scanners, and building security. Crisis and incident management processes are in place to manage and mitigate disaster events and other outages that occur, including the implementation of a Cyber Security Operations Centre to monitor and lead any response to cyber-attacks. The Group’s sourcing strategy includes supplier risk analysis and it regularly monitors suppliers for changes in commercial, financial or performance risks, whilst ensuring that business continuity plans are in place.
The impact of regulation
Risk The Group must comply with an extensive range of requirements that govern and regulate the licensing, construction and operation of its telecommunications networks and the provision of services in the UK and EU. Decisions by regulators can affect the Group’s business and operations and these effects are often adverse.
Impact There are several regulations that are having or will have an impact on the Group of which the most significant include regulations to eliminate roaming charges for calls within the EU, the UK’s implementation of the EU Consumer Rights Directive and regulation imposing various conditions on mobile termination charges.
Mitigation The Group has a team of regulatory specialists who, together with external advisors, monitor and review the scope for regulatory changes and the potential for future disputes. This team works with the relevant regulatory bodies to represent the Group’s interests and those of its customers and to drive for fair and proportionate regulation. The Group is also able to appeal any regulatory decisions where it believes errors have been made.
Spectrum factors
Risk
The Group needs to ensure that it acquires and maintains the right level and mix of spectrum through spectrum auctions, or after reallocations of spectrum by Ofcom.


EE Limited
11
Directors’ Report
The Directors present their report and the audited financial statements of the Group and Company for the year ended 31 December 2015.
Directors
The Directors, who held office during the year, and up to the approval of this report, are set out on page 3.
There are no Directors’ interests requiring disclosure under the Companies Act 2006.
Research and development
The Group works actively with its suppliers in developing the standards for future mobile communication services and equipment.
Going concern
The Group’s business activities, the factors likely to affect its future development and position, and the principal risks and uncertainties faced by the Group, are set out in the Strategic Report. The Directors have no reason to believe that a material uncertainty exists that may cast significant doubt about the ability of the Group to continue as a going concern.
The Group is expected to continue to generate positive operating cash flows for the foreseeable future and has a number of financing arrangements in place, together with support from its ultimate parent (BT Group plc), that it is reliant upon to remain a going concern.
On the basis of the assessment of the Group’s financial position, the Directors have a reasonable expectation that the Group will be able to continue in operational existence for the foreseeable future, and thus continue to adopt the going concern basis of accounting in preparing the Group and Company annual financial statements.
Events after the reporting period
On 25 January 2016 the Company paid a further interim dividend of £263 million. No liability is recorded in the financial statements in respect of the interim dividend, because it was not approved at the balance sheet date. On 5 February 2015 BT Group plc agreed definitive terms to acquire the group EE Limited and its subsidiaries for a headline price of £12.5 billion. The transaction was subject to approval by the shareholders of BT Group plc, which was received on 30 April 2015, and merger clearance, in particular from the UK Competition and Markets Authority, which was received on 15 January 2016. The transaction completed 29 January 2016. The transaction does not trigger any repayment of debt.
Financial risk management objectives
See Note 32 for financial risk management, objectives and policies.
Employee involvement
EE ensures employees under its direction and control are fully informed and involved in the business. Various communication methods were utilised during the year, including, regular face to face briefings and email updates from senior managers, EE’s intranet site, regular meetings held between local management and their teams and Splash. Splash is EE’s social news network that’s available to employees in EE and is accessible on app, mobile web, tablet, laptop and retail tills, providing the latest company news, senior management, and business area updates, along with community groups in an open social space.
Employee feedback and opinion is also actively canvassed via employee opinion surveys known internally as Pulse. Structured engagement plans are developed after each survey, both at company and functional level, as a means of continual enhancement of the process of informing, involving and engaging employees in the future. In addition, Engagement Champions are appointed for each functional area who are accountable for ensuring engagement plans remain on track and also ensuring additional feedback is given and opportunities taken between the main surveys. These are published for all employees to s ee

EE Limited
13
Directors’ statement of responsibilities
The Directors are responsible for preparing the Annual Report and the Group and Company financial statements in accordance with applicable United Kingdom law and those International Financial Reporting Standards as adopted by the European Union.
Under Company Law the Directors must not approve the Group and Company financial statements unless they are satisfied that they present fairly the financial position, financial performance and cash flows of the Group and Company for that period. In preparing the Group and Company financial statements the Directors are required to:
select suitable accounting policies in accordance with IAS 8: Accounting Policies, Changes in Accounting Estimates and Errors and then apply them consistently;
present information, including accounting policies, in a manner that provides relevant, reliable, comparable and understandable information;
provide additional disclosures when compliance with the specific requirements in IFRSs is insufficient to enable users to understand the impact of particular transactions, other events and conditions on the Group and Company’s financial position and financial performance;
state that the Group and Company have complied with IFRSs, subject to any material departures disclosed and explained in the financial statements;
make judgements and estimates that are reasonable and prudent; and
prepare the Group and Company financial statements on the going concern basis unless it is inappropriate to presume that the Group or Company will continue in business.
The Directors are responsible for keeping adequate accounting records that are sufficient to show and explain the Group and Company transactions, and disclose with reasonable accuracy at any time the financial position of the Group and Company, and enable them to ensure that the Group and Company financial statements comply with the Companies Act 2006. They are also responsible for safeguarding the assets of the Group and Company, and hence for taking reasonable steps for the prevention and detection of fraud and other irregularities.

14
Independent auditor’s report to the members of EE Limited
We have audited the financial statements of EE Limited for the year ended 31 December 2015 which comprise the Group income statement, the Statements of comprehensive income, the Statements of financial position, Statements of changes in equity, the Statements of cash flows and the related Notes 1 to 33. The financial reporting framework that has been applied in their preparation is applicable law and International Financial Reporting Standards (IFRSs) as adopted by the European Union and, as regards the Parent Company financial statements, as applied in accordance with the provisions of the Companies Act 2006.
This report is made solely to the Company’s members, as a body, in accordance with Chapter 3 of Part 16 of the Companies Act 2006. Our audit work has been undertaken so that we might state to the Company’s members those matters we are required to state to them in an auditor’s report and for no other purpose. To the fullest extent permitted by law, we do not accept or assume responsibility to anyone other than the Company and the Company’s members as a body, for our audit work, for this report, or for the opinions we have formed.
Respective responsibilities of directors and auditor
As explained more fully in the Directors’ Statement of Responsibilities set out on page 13, the directors are responsible for the preparation of the financial statements and for being satisfied that they give a true and fair view. Our responsibility is to audit and express an opinion on the financial statements in accordance with applicable law and International Standards on Auditing (UK and Ireland). Those standards require us to comply with the Auditing Practices Board’s Ethical Standards for Auditors.
Scope of the audit of the financial statements
An audit involves obtaining evidence about the amounts and disclosures in the financial statements sufficient to give reasonable assurance that the financial statements are free from material misstatement, whether caused by fraud or error. This includes an assessment of: whether the accounting policies are appropriate to the Group’s and the Parent Company’s circumstances and have been consistently applied and adequately disclosed; the reasonableness of significant accounting estimates made by the directors; and the overall presentation of the financial statements. In addition, we read all the financial and non-financial information in the Annual Report to identify material inconsistencies with the audited financial statements and to identify any information that is apparently materially incorrect based on, or materially inconsistent with, the knowledge acquired by us in the course of performing the audit. If we become aware of any apparent material misstatements or inconsistencies we consider the implications for our report.
Opinion on financial statements
In our opinion:
the financial statements give a true and fair view of the state of the Group’s and of the Parent Company’s affairs as at 31 December 2015 and of the Group’s profit for the year then ended;
the Group financial statements have been properly prepared in accordance with IFRSs as adopted by the European Union;
the Parent Company financial statements have been properly prepared in accordance with IFRSs as adopted by the European Union and as applied in accordance with the provisions of the Companies Act 2006; and
the financial statements have been prepared in accordance with the requirements of the Companies Act 2006.
Opinion on other matter prescribed by the Companies Act 2006
In our opinion the information given in the Strategic Report and the Directors’ Report for the financial year for which the financial statements are prepared is consistent with the financial statements.


EE Limited
16
Group income statement For the year ended 31 December 2015
2015) 2014)
Notes
£m)
£m)
Revenue 7 6,311, 6,327,
External purchases 8 (3,955) (4,160)
Other operating income 10 52, 30,
Other operating expense 10 (275) (322)
Staff costs 11 (457) (432)
Amortisation and depreciation 17, 18 (1,165) (1,182)
Restructuring expenses 13 (4) (77)
Exceptional expenses 14 -) (336)
Group operating profit/(loss) 507) (152)
Finance income 15 2, 1,
Finance expense 15 (92) (99)
Finance costs net (90) (98)
Share of loss of associates and joint ventures ) (1) (5)
Profit/(loss) before tax
416)
(255)
Income tax 16 (84) 38)
Profit/(loss) for the year attributable to the equity holders of the parent
332)
(217)
EE Limited
17
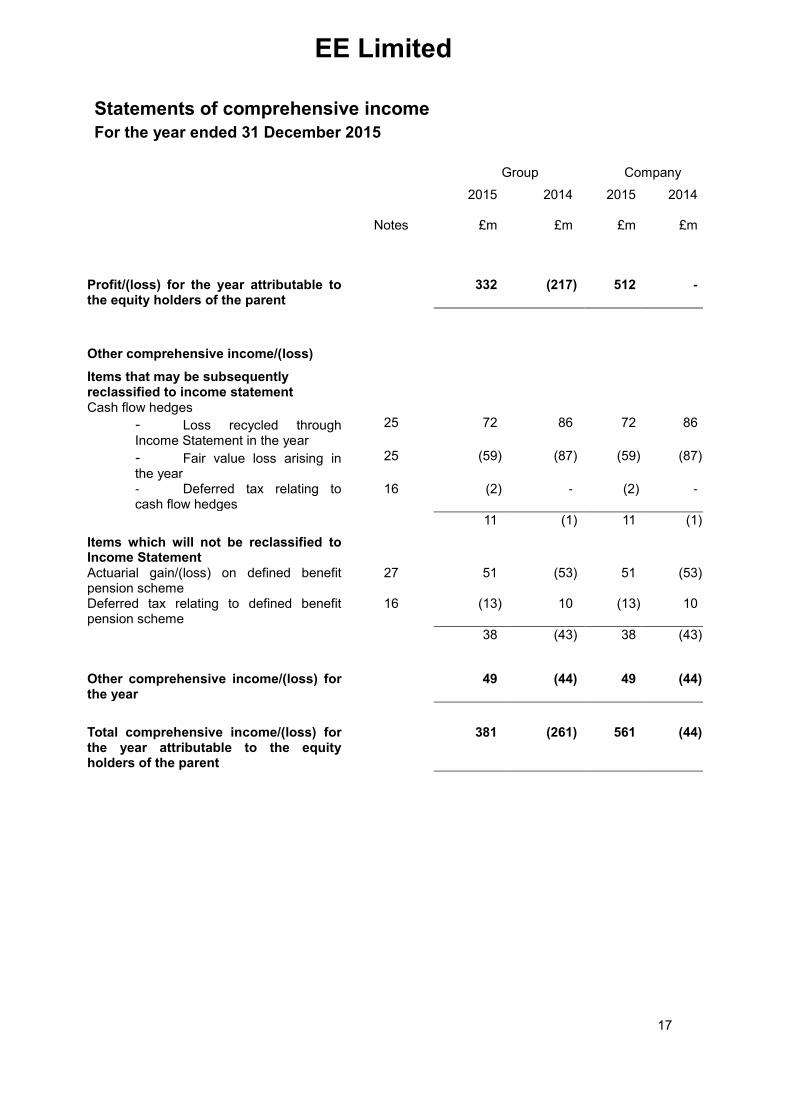
Statements of comprehensive income For the year ended 31 December 2015
Group Company
Notes
2015)
£m)
2014)
£m)
2015)
£m)
2014)
£m)
Profit/(loss) for the year attributable to the equity holders of the parent
332) (217) 512) -)
Other comprehensive income/(loss)
Items that may be subsequently reclassified to income statement
Cash flow hedges - Loss recycled through Income Statement in the year
25
72)
86)
72)
86)
- Fair value loss arising in the year
25 (59) (87) (59) (87)
- Deferred tax relating to cash flow hedges
16 (2) -) (2) -)
11) (1) 11) (1)
Items which will not be reclassified to Income Statement
Actuarial gain/(loss) on defined benefit pension scheme
27 51) (53) 51) (53)
Deferred tax relating to defined benefit pension scheme
16 (13) 10) (13) 10)
38) (43) 38) (43)
Other comprehensive income/(loss) for the year
49) (44) 49) (44)
Total comprehensive income/(loss) for the year attributable to the equity holders of the parent
381) (261) 561) (44)

EE Limited
18
Statements of financial position As at 31 December 2015
Company number: 02382161 Group Company
2015) 2014) 2015) 2014)
Notes
£m)
£m)
£m)
£m)
Non-current assets Intangible assets 17 9,203) 9,789) 3,384) 3,739) Property, plant and equipment 18 2,346) 2,337) 2,346) 2,337) Associates and joint ventures 19 -) 3) 13) 19) Deferred tax asset 16 120) 219) 268) 417) Derivative financial instruments
25
-)
7)
-)
7)
Other non-current assets 21 54) 22) 54) 22)
Total non-current assets 11,723) 12,377) 6,065) 6,541) Current assets Inventories 20 66) 77) 66) 76) Trade and other receivables 21 926) 992) 928) 994) Derivative financial instruments
25
9)
2)
9)
2)
Other financial assets 24 44) -) 44) -) Cash and cash equivalents 22 394) 411) 388) 405)
Total current assets 1,439) 1,482) 1,435) 1,477)
Total assets
13,162)
13,859)
7,500)
8,018)
Current liabilities Trade and other payables 23 (2,072) (2,230) (2,075) (2,234) Provisions 26 (68) (204) (68) (204) Interest bearing loans and borrowings
24
(437)
-)
(2,042)
(2,082)
Derivative financial instruments
25
-)
(10)
-)
(10)
) ) ) ) Total current liabilities (2,577) (2,444) (4,185) (4,530) Non-current liabilities Derivative financial instruments
25
(64)
(26)
(64)
(26)
Provisions 26 (151) (204) (151) (204) Interest bearing loans and borrowings
24
(1,605)
(2,082)
-)
-)
Pension liability 27 (95) (159) (95) (159) Other non-current liabilities 23 (18) (23) (18) (23)
Total non-current liabilities (1,933) (2,494) (328) (412)
Total liabilities (4,510) (4,938) (4,513) (4,942) Total net assets 8,652) 8,921) 2,987) 3,076)


EE Limited
20
Group statement of changes in equity For the year ended 31 December 2015
Share)
capital Share)
premium account
Capital) contribution)
reserve)
New) basis)
reserve)
Retained) earnings)
Cash flow) hedge)
reserve)
Total)
£m) £m) £m) £m) £m) £m) £m) At 31 December 2013
22) 1,638) 196) 11,063) (3,192) 6) 9,733)
Loss for the financial year
-) -) -) -) (217) -) (217)
Actuarial loss on defined benefit pension scheme
-) -) -) -) (53) -) (53)
Deferred tax relating to defined benefit pension scheme
-) -) -) -) 10) -) 10)
Cash flow hedges
Losses recycled through the Income Statement
-) -) -) -) -) 86) 86)
Fair value loss arising in the year
-) -) -) -) -) (87) (87)
Other comprehensive loss
-)
-)
-)
-)
(260)
(1)
(261)
Dividends declared and paid
-) -) -) -) (551) -) (551)
At 31 December 2014
22) 1,638) 196) 11,063) (4,003) 5) 8,921)
Profit for the financial year
-) -) -) -) 332) -) 332)
Actuarial gain on defined benefit pension scheme
-) -) -) -) 51) -) 51)
Deferred tax relating to defined benefit pension scheme
-) -) -) -) (13) -) (13))
Cash flow hedges
Losses recycled through the Income Statement
-) -) -) -) -) 72) 72)
Fair value loss arising in the year
-) -) -) -) -) (59) (59)
Deferred tax relating to cash flow hedges
-) -) -) -) -) (2) (2)
Other comprehensive income
-)
-)
-)
-)
370)
11)
381)
Dividends declared and paid
-) -) -) -) (650) -) (650)
At 31 December 2015
22)
1,638)
196)
11,063)
(4,283)
16)
8,652)

EE Limited
21
Company statement of changes in equity For the year ended 31 December 2015
Share
capital Share
premium account
Capital) contribution)
reserve)
Retained) earnings)
Cash flow) hedge)
reserve)
Total)
£m £m £m) £m) £m) £m) At 31 December 2013
22 1,638
196) 1,809) 6) 3,671)
Profit for the financial year
-) -) -) -) -) -)
Actuarial loss on defined benefit pension scheme
-) -) -) (53) -) (53)
Deferred tax relating to defined benefit pension scheme
-) -) -) 10) -) 10)
Cash flow hedges
Losses recycled through the Income Statement
-) -) -) -) 86) 86)
Fair value loss arising in the year
-) -) -) -) (87) (87)
Other comprehensive loss
-)
-)
-)
(43)
(1)
(44)
Dividends declared and paid
-) -) -) (551) -) (551)
At 31 December 2014
22 1,638
196) 1,215) 5) 3,076)
Profit for the financial year
-) -) -) 512) -) 512)
Actuarial gain on defined benefit pension scheme
-) -) -) 51) -) 51)
Deferred tax relating to defined benefit pension scheme
-) -) -) (13) -) (13)
Cash flow hedges
Losses recycled through the Income Statement
-) -) -) -) 72) 72)
Fair value loss arising in the year
-) -) -) -) (59) (59)
Deferred tax relating to cash flow hedges
-) -) -) -) (2) (2)
Other comprehensive income
-)
-)
-)
550)
11)
561)
Dividends declared and paid
-) -) -) (650) -) (650)
At 31 December 2015
22
1,638
196)
1,115)
16)
2,987)

EE Limited
22
Statements of cash flows For the year ended 31 December 2015
Group)) Company
2015) 2014) 2015) 2014)
Notes £m) £m) £m) £m)
Operating activities
Profit/(loss) for the year 332) (217) 512) -)
Adjustments to reconcile the profit/(loss) for the year to cash generated from operations
Depreciation and amortisation 17, 18 1,165) 1,182) 934) 916) Change in other provisions (excluding discount unwind)
26 (196) 6) (196) 6)
Difference between pension contributions and amounts recognised in the income statement
(13)
(37)
(13)
(37)
Income tax 16 84) (38) 134) 16) Net finance expense 15 90) 98) 90) 98) Share of loss of associates and joint ventures
1) 5) -) -)
Write-down of associates and joint ventures 19 1) -) 5) -) Loss on disposal of non-current assets Loss on disposal of investment
17, 18 19
5) 3)
-) -- -
5) 3)
-) -)
Changes in working capital requirements
Decrease in inventories 20 11) 8) 10) 9) Decrease in trade and other receivables 21 34) 155) 34) 153) (Decrease)/Increase in trade and other payables
23 (163) 105) (164) 104)
Cash generated from operations 1,354) 1,267) 1,354) 1,265)
Interest income received -) -) -) -) Interest paid and interest rates effects on derivatives
(82) (81) (82) (81)
Income tax received -) 2) -) 2)
Net cash provided by operating activities 1,272) 1,188) 1,272) 1,186)
Investing activities
Proceeds from sale of non-current assets 1) -) 1) -)
Purchases of property, plant and equipment and intangible assets
17, 18 (594) (596) (594) (596)
Purchase of subsidiary 19 -) (10) -) (12) Investment in joint arrangements 19 (2) (4) (2) (4) Dividends received from associates and joint ventures
19 -) 2)
-) -)
Net cash used in investing activities (595) (608) (595) (612)

EE Limited
23
Statements of cash flows (continued)
For the year ended 31 December 2015
Group
Company 2015) 2014) 2015) 2014)
Notes £m) £m) £m) £m)
Financing activities
Proceeds from non-current borrowings 24 -) -) -) -)
Cash collateral paid 24 (44) (41) (44) (41)
Dividends paid 29 (650) (551) (650) (551)
Net cash used in financing activities (694) (592) (694) (592)
Net change in cash and cash equivalents
22
(17)
(12)
(17)
(18)
Cash and cash equivalents at the beginning of the year
22
411)
423)
405-
423-
Cash and cash equivalents at the end of the year
22
394)
411)
388-
405-

EE Limited
24
Notes to the Financial Statements
1. Corporate information
The financial statements of the Group and Company for the year ended 31 December 2015 were authorised for issue in accordance with a resolution of the Directors on 12 February 2016. The statements of financial position were signed on behalf of the board by Stephen Harris. The Company is a limited company incorporated and domiciled in the United Kingdom. The registered office is located at Trident Place, Mosquito Way, Hatfield, Hertfordshire, AL10 9BW.
2.1 Basis of preparation
The financial statements of the consolidated Group and the Company have been prepared on a going concern basis and in accordance with International Financial Reporting Standards (IFRS) as issued by the International Accounting Standards Board (IASB) as adopted by the European Union, and with the Companies Act 2006.
As permitted by Section 408(3) of the Companies Act 2006, no income statement is presented for the Company, however the Company’s income statement has been approved by the Board of Directors. The Company profit after tax for the year ended 31 December 2015 was £512 million (2014: loss of £0 million).
The Group and Company financial statements are prepared in British Pounds and all values are rounded to the nearest million pounds (£m) except when otherwise indicated.
Going concern
The Group’s business activities, the factors likely to affect its future development and position, and the principal risks and uncertainties faced by the Group, are set out in the Strategic Report. The Directors have no reason to believe that a material uncertainty exists that may cast significant doubt about the ability of the Group to continue as a going concern.
The Group is expected to continue to generate positive operating cash flows for the foreseeable future and has a number of financing arrangements in place, together with support from its ultimate parent (BT Group plc), that it is reliant upon to remain a going concern.
On the basis of the assessment of the Group’s financial position, the Directors have a reasonable expectation that the Group will be able to continue in operational existence for the foreseeable future, and thus continue to adopt the going concern basis of accounting in preparing the Group and Company annual financial statements.
Significant estimates and judgements
The preparation of the Group’s consolidated financial statements requires management to make judgements, estimates and assumptions that affect the reported amounts of revenues, expenses, assets and liabilities. Uncertainty about these assumptions and estimates could result in outcomes that require a material adjustment in future periods, to the carrying amounts of assets or liabilities affected.
Judgements
Depreciation and Amortisation of Assets
The Group has a number of tangible and intangible assets held on the Statement of financial position. Such assets are held as assets under construction until such a time as they are fully constructed, brought into use and capable of operating in the manner as intended by management. The key judgement made by management is determining the timing of when the asset is brought into use and capable of operating in the manner as intended by management.
At this point, the assets are depreciated or amortised in line with their determined useful economic life. Details of the judgements and assumptions which form the basis of the Group's depreciation and amortisation policies are set out in notes 2.3.i) (Intangible Assets), 2.3.j) (Property, Plant and Equipment), and notes 17 and 18.
Taxation
Uncertainties exist with respect to the interpretation of complex tax regulations, changes in tax laws, and the amount and timing of future taxable income. Consequently, the determination of the

EE Limited
25
Notes to the Financial Statements (continued)
2.1 Basis of preparation (continued)
Significant estimates and judgements (continued)
Taxation (continued)
Group’s taxation position requires the Directors to make significant judgements.
Differences arising between the actual results and the assumptions made, or future changes to such assumptions could necessitate future adjustment to tax income and expense already recorded.
Deferred tax assets are recognised for unused tax losses to the extent that it is probable that taxable profit will be available, against which the losses can be utilised. Significant management judgement is required to determine the amount of deferred tax assets that can be recognised, based upon the expected timing and the level of future profit.
Estimates and assumptions
The Group based its estimates and assumptions on parameters available when the consolidated financial statements were prepared. Existing circumstances and assumptions about future developments however may change due to market circumstances, or circumstances arising beyond the control of the Group. Such changes are reflected in the assumptions when they occur.
Provisions
The estimate of the amount of the provision corresponds to the expenditure likely to be incurred by the Group to settle its obligation. If a reliable estimate cannot be made of the amount of the obligation, no provision is recorded and the obligation is deemed to be a contingent liability. The estimates and assumptions that have a significant risk of causing a material adjustment to the carrying amounts of the provisions within the next financial year are as follows:
Onerous lease provision: This represents the rent and rates for surplus leasehold properties less any anticipated income from sub-letting the properties. Assumptions are made about the value of future payments and receipts based on market conditions and the timing concerning any future sub-letting of space. The provision is calculated at net present value using a discounted cash flow model.
Asset Retirement Obligation (ARO): The Group is required to dismantle equipment and restore sites and properties under operating leases. This estimate is revised annually. Estimation uncertainty arises as a result of assumptions surrounding future amounts required to settle obligations, discounted cash flows and the timing of exiting leasing arrangements.
Network share and other: This represents the liabilities arising from restructuring obligations relating to network share agreements and one off costs relating to the restructuring of the Group. Estimation uncertainty arises as a result of the use of forecasts of both operational costs and vacant site rentals (which are long term in nature), discount factors used in net present value calculations, assumptions around the outcome of ongoing legal disputes with other network operators and the timing of future cash flows. The Directors, having taken legal advice have established provisions according to the facts of each case.
Goodwill and intangible asset impairment
Goodwill is subject to an annual impairment test which in turn is subject to management estimation in relation to the fair value less costs of disposal valuation. Further detail regarding the assumptions are referenced in note 17.

EE Limited
26
Notes to the Financial Statements (continued)
2.1 Basis of preparation (continued)
Significant estimates and judgements (continued)
Employee long-term benefits
The acquisition of the Group by BT in January 2016 did not cause acceleration of any existing incentive schemes at 31 December 2015.
The present value of the pension obligations depends on a number of factors that are determined on an actuarial basis using a number of assumptions. The assumptions used in determining the net cost for pensions include the discount rate and mortality assumptions. Any changes in these assumptions will impact the carrying amount of pension obligations. Additional information is disclosed in note 27.
Classification of Joint Arrangements
The Group holds interests in a number of joint arrangements, comprising both a joint operation and joint ventures.
Joint Operations
The Group’s joint operation, Mobile Broadband Network Limited (“MBNL”), is structured in a separate incorporated company. The Group holds 50% of the interest in the arrangement and, under the joint arrangement agreement, unanimous consent is required from all parties to the agreement for all significant relevant activities. MBNL operates solely for the benefit of the parties to the joint arrangement and all of MBNL’s output is to those parties. The Group and other parties to the agreement have a direct share in all of the assets employed by the arrangement and is liable for its share of the liabilities incurred through the terms of the contractual arrangement. MBNL relies on the parties to the agreement on a continuous basis for the settlement of liabilities.
On consideration of the facts and circumstances the Group has determined this arrangement to be classified as a joint operation.
Fair value of financial instruments
When the fair value of financial assets and financial liabilities recorded in the statement of financial position cannot be derived from active markets, their fair value is determined using valuation techniques including the discounted cash flow model. The inputs to these models are taken from observable markets where possible, but where this is not feasible a degree of judgement is required in establishing fair values. Estimation uncertainties arise from assumptions on liquidity risk, credit risk and volatility.

EE Limited
27
Notes to the Financial Statements (continued)
2.2 Basis of consolidation
The consolidated financial statements comprise the financial statements of EE Limited and its subsidiaries as at 31 December 2015.
Subsidiaries that are controlled exclusively by the Group, directly or indirectly, are fully consolidated. Control is deemed to exist when the Group has all of the following:
power over the entity;
exposure, or rights, to variable returns from its involvement with the entity; and
the ability to use its power over the entity to affect the amount of the Group’s returns.
The financial statements of the subsidiaries are prepared using consistent accounting policies.
All intra-group balances, income and expenses and unrealised gains and losses resulting from intra-group transactions are eliminated in full.
2.3 Summary of significant accounting policies
a) Goodwill and business combinations
Goodwill is initially measured at cost being the excess of the aggregate of the consideration transferred over the net fair value of the identifiable assets acquired and liabilities assumed.
After initial recognition, goodwill is measured at cost less any accumulated impairment losses. Goodwill is not amortised but tested for impairment at least once a year, or more frequently when there is an indication that it may be impaired. For the purpose of impairment testing, goodwill is allocated to the cash generating unit (“CGU”) that is expected to benefit from the combination.
A CGU is defined as the smallest identifiable group of assets that generates cash inflows that are largely independent of the cash inflows from other assets or groups of assets.
An impairment loss for goodwill is recorded in the income statement as a deduction from operating profit and is never reversed subsequently.
To determine whether an impairment loss should be recognised, the carrying value of the assets and liabilities of the CGUs or groups of CGUs is compared to their recoverable amount. The recoverable amount of a CGU is the higher of its fair value less costs of disposal and its value in use.
Fair value less costs of disposal is the best estimate of the amount obtainable from the sale of a CGU in an arm’s length transaction between knowledgeable, willing parties, less the costs of disposal.
Value in use is the present value of the future cash flows expected to be derived from the CGUs or groups of CGUs. Cash flow projections are based on economic and regulatory assumptions, licence renewal assumptions and forecast trading conditions drawn up by the Group’s management.

EE Limited
28
Notes to the Financial Statements (continued)
2.3 Summary of significant accounting policies (continued)
b) Interests in Joint Arrangements
Companies that are controlled jointly by the Group and a limited number of other shareholders through a contractual arrangement are classified as joint arrangements.
Under IFRS 11 ‘Joint Arrangements’, investments in joint arrangements are classified as either joint operations or joint ventures, depending on the contractual rights and obligations that each investor has, rather than the legal structure of the arrangement. The Group has assessed the nature of its joint arrangements and determined that it has both a joint operation and joint ventures.
(i) Interests in Joint Operations
The Group recognises its direct rights to (and its share of) jointly held assets, liabilities, revenues and expenses of joint operations. These have been incorporated in the financial statements under the appropriate headings.
(ii) Interests in Joint Ventures
The Group reports its interests in joint ventures using the equity method whereby an equity investment is initially recorded at cost and subsequently adjusted to reflect the Group’s share of the net assets.
Any goodwill arising on the acquisition of the Group’s interest in a joint venture is included in the carrying value of the investment and neither amortised nor individually tested for impairment. The overall investment is reviewed for indicators of impairment on an annual basis.
When a Group entity transacts with its joint venture, profits and losses resulting from the transactions with the joint venture are recognised in the Group’s consolidated financial statements only to the extent of interests in the joint venture that are not related to the Group.
c) Interests in Associates
Companies over which the Group exercises significant influence (generally corresponding to an ownership interest of 20% to 50%) are classified as associates.
The results, assets and liabilities of associates are included in the Group’s financial statements using equity accounting, whereby an equity investment is initially recorded at cost and subsequently adjusted to reflect the Group’s share of the net assets.
d) Foreign currency translation
The Group’s consolidated financial statements are presented in British Pounds, which is also the functional currency of the parent company and all other Group entities unless otherwise stated.
Transactions in foreign currencies are converted into the functional currency at the exchange rate at the transaction date.
Monetary assets and liabilities are re-measured at each reporting date at the functional currency exchange rate as at that date and the resulting translation differences are recorded in the income statement:
(i) in operating income for commercial transactions;
(ii) in finance income or finance costs for financial transactions.
Both for transactions qualifying for fair value hedge accounting and for economic hedging, changes in fair value of currency derivatives that can be attributed to changes in exchange rate are accounted for under other operating income / expense when the underlying hedged item is an operating transaction and under finance income / expense when the underlying hedged item is a financing transaction. For cash flow hedges of a highly probable forecast transaction, changes in fair value are booked in equity to the extent that the hedge is effective and reclassified to the Group income statement when the hedged item affects the Group income statement.

EE Limited
29
Notes to the Financial Statements (continued)
2.3 Summary of significant accounting policies (continued)
e) Revenue recognition
Revenue includes:
amounts invoiced for airtime and related services supplied to subscribers (excluding airtime income billed in advance), together with airtime income earned but not invoiced;
amounts invoiced for interconnect in respect of calls terminating on the EE network, together with interconnect income earned but not invoiced;
income from the sale of connected handsets and related accessories supplied to subscribers within the period;
income from the sale of handsets and related accessories delivered to intermediaries within the period; and
income from pre-paid customers which is deferred in the consolidated statement of financial position on purchase by the customer and released to the Group income statement as calls are made.
Payments to customers, including payments to dealers and agents (discounts, provisions) are recognised as a decrease in revenue. If the payment provides a benefit in its own right and can be reliably measured, the payments are recognised as expenses.
Revenues from the Group’s activities are recognised and presented as follows, in accordance with IAS18 ‘Revenue’.
i) Separable components of packaged and bundled offers
Numerous service offers by the Group include two components: equipment (e.g. a mobile handset) and a service (e.g. a talk plan). For the sale of multiple products or services, the Group evaluates all deliverables in the arrangement to determine whether they represent separate units of accounting using the framework of the Emerging Issues Task Force no. 08-01 ‘Accounting for Revenue Arrangements with Multiple Deliverables’ (EITF 08-01) as permitted by IAS 8.12.
A delivered item is considered a separate unit of accounting if (i) it has value to the customer on a standalone basis, and (ii) there is objective and reliable evidence of the fair value of the undelivered item(s).
The total fixed or determinable amount of the arrangement is allocated to the separate units of accounting based on their relative fair value. However, when an amount allocated to a delivered item is contingent upon the delivery of additional items or meeting specified performance conditions, the amount allocated to that delivered item is limited to the non-contingent amount.
Sales of bundled offers in the mobile business frequently include a handset and a telecommunications service contract. The handset is considered to have value on a standalone basis to the customer, and there is objective and reliable evidence of fair value for the telecommunications service to be delivered. As the amount attributable to the handset generally exceeds the amount received from the customer at the date the handset is delivered, revenue recognised for the handset sale is generally limited to the amount of the arrangement that is not contingent upon the rendering of telecommunication services, i.e. the amount paid by the customer for the handset.
For offers that cannot be separated into identifiable components, revenues are recognised in full over the life of the contract. The main example is connection to the service: this does not represent a separately identifiable transaction from the subscription and communications, and connection fees are therefore recognised over the average expected life of the contractual relationship.

EE Limited
30
Notes to the Financial Statements (continued)
2.3 Summary of significant accounting policies (continued)
e) Revenue recognition (continued)
ii) Equipment sales
Revenues from equipment sales are recognised when the significant risks and rewards of ownership are transferred to the buyer.
iii) Equipment rental
In accordance with IFRIC 4: Determining Whether an Arrangement Contains a Lease, equipment for which a right of use is granted is analysed in accordance with IAS 17 ‘Leases’.
Equipment lease revenues are recognised on a straight-line basis over the life of the lease agreement, except in the case of finance leases which are accounted for in accordance with IAS 17. Additional information is disclosed in Note 2.3h).
iv) Revenue share arrangements
The accounting for revenue sharing arrangements and supply depends on the analysis of the facts and circumstances surrounding these transactions. To determine if the revenue must be recognised on a gross or a net basis, an analysis is performed using the following criteria:
1. the Group is the primary obligor of the arrangement;
2. the Group bears inventory risk;
3. the Group has a reasonable latitude in establishing price with the customer for the service;
4. the Group has discretion in supplier selection;
5. the Group is involved in the determination of service specifications; and
6. the Group bears the credit risk.
Therefore, revenue-sharing arrangements (premium rate number, special numbers, etc.) are recognised:
gross when the Group has a reasonable latitude in setting prices and determining the key features of the content (service or product) sold to the end customer; and
net of amounts due to the service provider when the latter is responsible for the service and for setting the price to be paid by subscribers.
Similarly, revenues from the sale or supply of content (audio, video, games, etc.) via the Group’s various communications systems (mobile, PC, etc.) are recognised:
gross when the Group is deemed to be the primary obligor in the transaction with respect to the end customer (i.e. when the customer has no specific recourse against the content provider), when the Group bears the inventory risk and has a reasonable latitude in the selection of content providers and in setting prices charged to the end customer; and
net of amounts due to the content provider when the latter is responsible for supplying the content to the end customer and for setting the price to subscribers.
v) Service revenues
Revenues from telephone service and internet access subscription fees as well as those from the wholesale access revenues are recognised on a straight-line basis over the subscription period.
Revenues from charges for incoming and outgoing telephone calls as well as those from the wholesale of traffic are recognised in revenue when the service is rendered.

EE Limited
31
Notes to the Financial Statements (continued)
2.3 Summary of significant accounting policies (continued)
e) Revenue recognition (continued)
vi) Business contracts
The Group offers customised solutions to its business customers. Commercial discounts may be granted under the related contracts, if certain conditions are fulfilled, and are usually recorded as a deduction from revenue based upon the specific terms of each contract.
Costs associated with migrating business customers from other networks onto the Group network are recognised in expenses when they are incurred, except in the case of contracts that include an early termination compensation clause.
vii) Promotional offers
Revenues are stated net of discounts. For certain commercial offers where customers are offered a free service over a certain period in exchange for signing up for a fixed period (time-based incentives), the total revenue generated under the contract is spread over the fixed, non-cancellable period.
viii) Penalties
All the Group’s commercial contracts contain service level commitments (delivery time, service reinstatement time). These service level agreements cover commitments given by the Group on the order process, the delivery process, and after sales services.
If the Group fails to comply with one of these commitments, it pays compensation to the end-customer, usually in the form of a price reduction which is deducted from revenues. Such penalties are recorded when it becomes probable that they will be due based on the non-achievement of contractual terms.
ix) Subscriber acquisition and retention costs
Subscriber acquisition and retention costs, other than loyalty programs costs, are recognised as an expense for the period in which they are incurred, that is to say on acquisition or renewal. In some cases, contractual clauses with retailers provide for a profit-sharing based on the recognised and paid revenue; this profit-sharing is expensed when the related revenue is recognised.
x) Loyalty programs
Credits awarded to customers are treated as a separable deliverable component of the transaction that triggered the acquisition of credit.
An element of the invoiced revenue is allocated to the credit based on its value taking into account an estimated utilisation rate, and deferred until the date on which the credits are definitively converted into benefits. The credit’s value is defined as the excess discount over the sales incentive that would be granted to any new customer.
The amount deferred is considered to be the fair value of the credits as required by IFRIC 13.
f) Advertising and related costs
Advertising, promotion, sponsoring, communication and brand marketing costs are charged to selling and distribution costs in the Group income statement as incurred.
g) Borrowing costs
The Group capitalises borrowing costs that are directly attributable to the construction or acquisition of qualifying assets. A qualifying asset is one that takes a substantial period of time to get ready for its intended use. The Group considers a period in excess of 12 months to be a substantial period of time for this purpose.

EE Limited
32
Notes to the Financial Statements (continued)
2.3 Summary of significant accounting policies (continued)
h) Finance and operating leases
Assets acquired under leases that transfer the risks and rewards of ownership to the Group (finance leases) are recorded as assets and an obligation in the same amount is recorded in liabilities.
Any lease arrangement that is not identified as a finance lease is classified as an operating lease. Rentals under operating leases are charged on a straight-line basis over the lease term, even if the payments are not made on such a basis. Benefits received and receivable as an incentive to sign an operating lease are recognised as a reduction of the rental expense over the lease term.
i) Intangible assets
On formation of the Group, fair values were applied to all identifiable intangible assets, recognised in the consolidated statement of financial position at the date of the combination.
Intangible assets acquired subsequent to the formation of the Group are initially recognised at cost.
Customer relationships
The following useful economic lives have been applied to the identified customer relationship assets:
Pre-pay relationships 4 years
Post-pay relationships 9 years
Mobile Virtual Network Operator relationships (“MVNO”)
6 to 14 years (based upon contract period)
New customer relationships entered into following the formation of the Group are not capitalised, and any associated costs are charged through the Group income statement as incurred.
Spectrum – 2G & 3G
The fair value of the spectrum to operate mobile telephone networks determined at the date of combination on 1 April 2010 (2G and 3G spectrum) is amortised through the Group income statement on a straight-line basis from the date of combination for the remaining spectrum period, which does not exceed 11 years from the date of combination.
Spectrum – 4G
The Group acquired £620 million of additional (4G) spectrum in the year ended 31 December 2013. This intangible asset was first available for use in October 2014, due to requisite technologies first being deployed in the network. Amortisation of this intangible asset commenced upon the asset being available for use, and is charged through the Group income statement on a straight-line basis over the remaining term of the licence (until 2033).
Other – Software and research and development costs
The Group’s research and development projects mainly concern:
upgrading the network architecture or functionality; and
developing service platforms aimed at offering new services to the Group’s customers.

EE Limited
33
Notes to the Financial Statements (continued)
2.3 Summary of significant accounting policies (continued)
i) Intangible assets (continued)
Other – Software and research and development costs (continued)
These projects generally give rise to the development of software that does not form an integral part of the network’s tangible assets. Under IAS 38, software that machinery cannot function without, is considered integral to the related hardware and is capitalised as property, plant and equipment. When the software is not an integral part of the hardware it is treated as an intangible asset.
Development costs are recognised as intangible assets when the following conditions are met:
the intention to complete the intangible asset and use or sell it and the ability of adequate technical and financial resources for this purpose;
the probability for the intangible asset to generate future economic benefits for the Group; and
the reliable measurement of the expenditure attributable to the intangible asset during its development.
Research costs and development costs not fulfilling the above criteria are expensed as incurred. Capitalised development costs are presented in the same way as software on the “intangible assets” line. They are amortised on a straight-line basis over their expected useful life generally not exceeding 3 years. Software is amortised on a straight-line basis over its expected useful life which does not exceed 5 years.
Website development costs are capitalised when all of the following conditions are met:
it is probable that the website will be successfully developed, the Group has adequate resources (technical, financial and other) and has the intention of and the ability to complete the site and use or sell it;
the website will generate future economic benefits; and
the Group has the ability to reliably measure the expenditure attributable to the website during its development.
Capitalised costs are amortised on a straight-line basis over its expected useful life which does not exceed 5 years.
Expenditure incurred after the website has been completed is recorded as an expense, except where it enables the website to generate future additional economic benefits provided it can be reliably estimated and attributed to the website.
Other – Licences
Purchased licences are capitalised as intangibles at cost. They are then amortised over the licence period.
Other – rights to use
Where the Group enters into a supplier service contract which entitles the Group to a ‘right of use’ for certain assets, relevant payments are capitalised as intangibles. These costs are amortised on a straight line basis over the life of the contract.
j) Property, plant and equipment
On formation of the Group, fair values were applied to all identifiable property, plant and equipment, recognised in the consolidated statement of financial position at the date of the combination.
Property, plant and equipment acquired or constructed subsequent to formation of the Group is initially recognised at cost.

EE Limited
34
Notes to the Financial Statements (continued)
2.3 Summary of significant accounting policies (continued)
j) Property, plant and equipment (continued)
Cost
The cost of tangible assets corresponds to their purchase or production cost, including costs directly attributable to bringing the asset to the location and condition necessary for it to be capable of operating in the manner intended by management. It also includes the initial estimate of the costs of dismantling and removing the item and restoring the site on which it is located, representing the obligation incurred by the Group.
The cost of networks includes design and construction costs, as well as capacity improvement costs. The total cost of an asset is allocated among its different components and each component accounted for separately, when the components have different useful lives or when the pattern in which their future economic benefits are expected to be consumed by the entity varies. Depreciation is then revised accordingly. Maintenance and repair costs are expensed as incurred, except where they serve to restore or increase the asset’s productivity or prolong its useful life.
Network share assets
Certain assets have been contributed to a network share arrangement by both the Group and Hutchison 3G UK Limited, with legal title remaining with the contributor. This is considered to be a reciprocal arrangement, and the Group’s share of the assets were initially recognised at fair value within tangible assets, and depreciated according to Group policy. Subsequent additions since the formation of EE have been recognised at cost. For further information see note 18.
Depreciation
Property, plant and equipment are depreciated to write off their cost less any residual value on a basis that reflects the pattern in which their future economic benefits are expected to be consumed.
Therefore, the straight-line basis is usually applied over the following estimated useful lives:
Freehold land: Not depreciated
Freehold buildings: 50 years
Short-term leasehold improvements: shorter of 10 years or lease term
Network: 5 to 20 years
Fixtures, fittings and equipment: 3 to 6 years
These useful lives are reviewed annually and are adjusted if current estimated useful lives are different from previous estimates. These changes in accounting estimates are recognised prospectively.

EE Limited
35
Notes to the Financial Statements (continued)
2.3 Summary of significant accounting policies (continued)
k) Impairment of non-current assets other than goodwill
In the case of a decline in the recoverable amount of an item of property, plant and equipment or an intangible asset to below its net book value, due to events or circumstances occurring during the period (such as obsolescence, physical damage, significant changes to the manner in which the asset is used, worse than expected economic performance, a drop in revenues or other external indicators) an impairment loss is recognised.
The recoverable amount of an asset is the higher of its fair value less costs to sell and its value in use, assessed by the discounted cash flows method, based on management’s best estimate of the set of economic conditions. The impairment loss recognised is equal to the difference between the net book value and the recoverable amount.
l) Financial assets and liabilities
Financial assets and liabilities are recognised initially at fair value. They are subsequently measured either at fair value or amortised cost using the effective interest method, in accordance with the IAS 39 category they belong to. The effective interest rate is the rate that discounts estimated future cash payments through the expected contractual term, or the most probable expected term of the financial instrument, to the net carrying amount of the financial liability. This calculation includes all fees and points paid or received between parties to the contract.
Loans and receivables
This category mainly includes trade receivables, cash, some cash collateral, as well as other loans and receivables. These instruments are recognised at fair value upon origination and are subsequently measured at amortised cost by the effective interest method. Short-term receivables with no stated interest rate are measured at original invoice amount unless there is any significant impact resulting from the application of an implicit interest rate.
If there is any objective evidence of impairment of these assets, the value of the asset is reviewed at each balance sheet date. An impairment loss is recognised in the income statement when the financial asset carrying amount is higher than its recoverable amount.
Recognition and measurement of financial liabilities
Financial liabilities at amortised cost
With the exception of financial liabilities carried at fair value, borrowings and other financial liabilities are recognised upon origination at fair value of the sums paid or received in exchange for the liability, and subsequently measured at amortised cost using the effective interest method. Interest-free payables are booked at their nominal value.
Transaction costs that are directly attributable to the acquisition or issue of the financial liability are deducted from the liability’s carrying value. The costs are subsequently amortised over the life of the debt, by the effective interest method.
Within the Group, some financial liabilities at amortised cost, including borrowings, are subject to hedge accounting. These relate mostly to fixed rate borrowings hedged against changes in interest rate and currency value (fair value hedge) and to foreign currency borrowings in order to hedge future cash flows against changes in currency value (cash flow hedge).
Derivative financial instruments and hedge accounting
The Group uses derivative financial instruments such as forward currency contracts and interest rate swaps to hedge its foreign currency and interest rate risks respectively. Such derivative financial instruments are initially recognised at fair value on the date on which a derivative contract is entered into and are subsequently re-measured at fair value. Derivatives are carried as financial assets when the fair value is positive and as financial liabilities when the fair value is negative.
EE Limited
36
Notes to the Financial Statements (continued)
2.3 Summary of significant accounting policies (continued)
l) Financial assets and liabilities (continued)
Derivative financial instruments and hedge accounting (continued)
Any gains or losses arising from changes in the fair value of derivatives are taken directly to profit or loss in the Group income statement except for the effective portion of cash flow hedges which is recognised in other comprehensive income.
For the purposes of hedge accounting, hedges are classified as:
Fair value hedges when hedging the exposure changes in the fair value of a recognised asset or liability or an unrecognised firm commitment.
Cash flow hedges when hedging the exposure to variability in cash flows which is either attributable to a particular risk associated with a recognised asset or liability or a highly probable forecast transaction or the foreign currency risk in an unrecognised firm commitment.
At the inception of a hedging relationship, the Group formally documents and designates the hedge relationship for which the Group wishes to apply hedge accounting and the risk management objective and strategy for undertaking the hedge. The documentation includes identification of the hedging instrument, the hedged item or transaction, the nature of the risk being hedged and how the entity will; assess the effectiveness of changes in the hedging instruments fair value in offsetting the exposure to changes in the hedged item’s fair value or the cash flows attributable to the hedged risk. Such hedges are expected to be highly effective in achieving offsetting changes in fair value or cash flows and are assessed on an ongoing basis to determine that they have actually been effective throughout the financial reporting periods for which they were designated.
Cash flow hedges
The effective portion of the gain or loss on the hedging instrument is recognised directly in other comprehensive income in the cash flow hedge reserve, while any ineffective portion is recognised in the income statement.
The Group uses forward currency contracts as hedges to its exposure to foreign currency risk in forecast transactions and firm commitments. The ineffective portion relating to foreign currency contracts is recognised in finance costs.
Amounts recognised in other comprehensive income are transferred to profit or loss when the hedged transaction affects profit or loss, such as when the hedged financial income or expenses is recognised or when a forecast sale occurs.
If the forecast transaction or firm commitment is no longer expected to occur, the cumulative gain or loss previously recognised in equity is transferred to the income statement. If the hedging instrument expires or is sold, terminated or exercised without replacement or rollover, or if its designation as a hedge is revoked, any cumulative gain or loss previously recognised in other comprehensive income remains in other comprehensive income until the forecast transaction or firm commitment affects profit or loss.
m) Equipment inventories
Network maintenance equipment and equipment to be sold to customers are stated at the lower of cost or net realisable value, taking into account expected revenues from the sale of packages comprising a mobile handset and a subscription. Cost corresponds to purchase or production cost determined by the first in first out cost method.
n) Provisions
A provision is recognised when the Group has a present obligation towards a third party and it is probable that an outflow of resources embodying economic benefits will be required to settle the obligation. The obligation may be legal, regulatory, contractual, or it may represent a constructive obligation. Constructive obligations arise from the Group’s actions whereby an established

EE Limited
37
Notes to the Financial Statements (continued)
2.3 Summary of significant accounting policies (continued)
n) Provisions (continued)
pattern of past practice, published policies or a sufficiently specific current statement create a valid expectation on the part of other parties that the Group will discharge certain responsibilities.
The estimate of the amount of the provision corresponds to the expenditure likely to be incurred by the Group to settle its obligation. If a reliable estimate cannot be made of the amount of the obligation, no provision is recorded and the obligation is deemed to be a contingent liability.
Contingent liabilities are disclosed in the notes to the financial statements. They correspond to:
possible obligations that are not recognised because their existence will be confirmed only by the occurrence or non-occurrence of one or more uncertain future events not wholly within the Group’s control; or
present obligations arising from past events that are not recognised because it is not probable that an outflow of resources embodying economic benefits will be required to settle the obligation or because the amount of the obligation cannot be measured with sufficient reliability.
o) Employee benefits
The Group operates both a defined benefit pension scheme, and a defined contribution pension scheme. Both schemes are accounted for in accordance with IAS 19: Employee benefits.
Defined Contribution Scheme
This scheme is open to all employees and the contributions payable are expensed to the Group income statement when service is rendered.
Defined Benefit Scheme
This scheme was closed to future accrual from 30 June 2014.
The Group’s net obligation in respect of the defined benefit scheme is calculated by estimating the amount of future benefit that employees have earned in return for their service to date. That benefit is discounted to determine its present value, and the fair value of any plan assets is deducted. The discount rate used is the yield at the reporting date on AA credit rated bonds that have maturity dates approximating the terms of the Group’s obligations. The calculation is performed by a qualified actuary using the projected unit credit method. The net obligation recognised in the consolidated statement of financial position is the present value of the defined benefit obligation less the fair value of the scheme’s assets.
The Group income statement charge is split between an operating charge and a net interest charge. The operating charge reflects the service costs which are spread systematically over the working lives of the employees. The net interest charge is calculated by applying the discount rate to the net defined benefit liability at the start of each annual reporting period. Actuarial gains and losses are recognised in full in the period in which they occur and are presented in the consolidated statement of comprehensive income.
p) Current income tax
Current income tax assets and liabilities for the current and prior periods are measured at the amount expected to be recovered from or paid to the tax authorities. The tax rates and tax laws used to compute the amount are those that are enacted or substantively enacted by the reporting date.
Current income tax relating to items recognised directly in equity is recognised in equity and not in the Group income statement.
q) Deferred taxes
Deferred tax is provided using the liability method on temporary differences at the reporting date between the tax bases of assets and liabilities and their carrying amounts for financial reporting purposes.

EE Limited
38
Notes to the Financial Statements (continued)
2.3 Summary of significant accounting policies (continued)
q) Deferred taxes (continued)
Deferred tax assets and liabilities are recognised for all taxable temporary differences, except;
where the deferred tax asset or liability arises from the initial recognition of goodwill or of an asset or liability in a transaction that is not a business combination and, at the time of the transaction, affects neither the accounting profit nor taxable profit or loss;
in respect of deferred tax assets arising from deductible temporary differences associated with investments in subsidiaries, associates and interests in joint arrangements, which are recognised only to the extent that it is probable that the temporary differences will reverse in the foreseeable future and taxable profit will be available against which the temporary differences can be utilised.
in respect of deferred tax liabilities arising from taxable temporary differences associated with investments in subsidiaries, associates and interests in joint arrangements, where the timing of the reversal of the temporary differences can be controlled and it is probable that the temporary difference will not reverse in the foreseeable future.
Deferred tax assets are recognised for all deductible temporary differences, carry forward of unused tax credits and unused tax losses, to the extent that it is probable that taxable profit will be available against which the deductible temporary differences, and the carry forward of unused tax credits and unused tax losses can be utilised.
The carrying amount of the deferred tax assets is reviewed at each reporting date and reduced to the extent that it is no longer probable that sufficient taxable profit will be available or allow all or part of the deferred tax asset to be utilised. Unrecognised deferred tax assets are reassessed at each reporting date and are recognised to the extent that it has become probable that future taxable profit will allow the deferred tax asset to be recovered.
Deferred tax assets and liabilities are measured at the tax rates that are expected to apply in the year when the asset is realised or the liability is settled, based on tax rates (and tax laws) that have been enacted or substantively enacted at the reporting date.
Deferred tax relating to items recognised directly in equity is recognised in the consolidated statement of comprehensive income or the consolidated statement of changes in equity.
Deferred tax assets and deferred tax liabilities are offset, if a legally enforceable right exists to set off current income tax assets against current income tax liabilities and the deferred tax relates to the same taxable entity and the same tax authority.
r) Cash and cash equivalents
Cash and cash equivalents in the consolidated statement of financial position comprise cash at bank and in hand, overdrafts and amounts held in the cash pooling accounts with the shareholders.
s) Exceptional expenses
Exceptional expenses are material costs that are incurred outside of the normal course of business, which are anticipated to only occur in one accounting period.

EE Limited
39
Notes to the Financial Statements (continued)
3. New and revised IFRSs applied
The Group will normally adopt new standards at the effective date.
No new or revised IFRSs became effective for the accounting period commencing on 1 January 2015 which had a material impact on the financial statements for the year ending 31 December 2015.
4. New and revised IFRSs that have been issued but are not yet effective
The following is a list of standards/interpretations that have been issued and are effective for accounting periods commencing on or after 1 January 2016 and we consider may have a material impact on the Group and Company financial statements:
IFRS 9 ‘Financial Instruments’
IFRS 9 ‘Financial Instruments’ was published in July 2014. It is applicable to financial assets and financial liabilities, and covers the classification, measurement, impairment and de-recognition of financial assets and financial liabilities together with a new hedge accounting model.
The standard is effective for annual periods beginning on or after 1 January 2018.
The Group is in the process of quantifying the impact of the new standard.
IFRS 15 ‘Revenue from Contracts with Customers’
IFRS 15 sets out the requirements for recognising revenue from contracts with customers. The standard requires entities to apportion revenue earned from contracts to the individual performance obligations on a relative standalone selling basis, based on a 5-step model to be applied to all contracts with customers. The standard was published in May 2014 and is effective for annual periods beginning on or after 1 January 2018.
The Group is in the process of quantifying the impact of the new standard, and based on work performed to date it has been assessed that revenue will be accelerated due to greater apportionment of consideration from customers to upfront handset and device revenue.
IFRS 16 ‘Leases’
IFRS 16 ‘Leases’ was published in January 2016. The standard provides a single lessee accounting model, requiring lessees to recognise assets and liabilities for all leases unless the lease term is 12 months or less or the underlying asset has a low value.
The standard is effective for annual periods beginning on or after 1 January 2019.
The Group is in the process of quantifying the impact of the new standard.
5. Segment Information
The Group supplies communication services and products to the UK market, through a national telecommunications network. This is considered to be a single group of services and products provided by an inter-dependent asset infrastructure, to one geographical area. The Group has focused upon integration since the combination of the T-Mobile and Orange businesses in 2010 and produces all operating results, forecasts and budgets at the consolidated level for the purposes of allocating resources. Operationally the Group has demonstrated its unity to its customers by providing free roaming across the one EE branded network. Due to these factors there are not considered to be separable identifiable operating segments for which financial information can be presented.

EE Limited
40
Notes to the Financial Statements (continued)
6. EBITDA and Adjusted EBITDA
Year ended)
31 December) Year ended 31)
December) 2015) 2014) £m) £m)
Profit/(loss) before tax 416) (255)
Add back:
Net finance costs 90, 98,
Amortisation and depreciation 1,165, 1,182,
Share of loss of joint ventures and associates 1) 5)
EBITDA
1,672,
1,030,
Add back:
Management and brand fees 105) 146)
Restructuring expenses 4, 77,
Exceptional expenses -) 336)
Adjusted EBITDA
1,781)
1,589)
EBITDA is not a financial measure defined by IFRS as a measurement of financial performance and may not be comparable to other similarly-titled indicators used by other companies. EBITDA and adjusted EBITDA are provided as additional information only and should not be considered as a substitute for operating profit or net cash provided by operating activities.
The Group’s management believes that EBITDA (Earnings before Interest, Tax, Depreciation and Amortisation, and share of profits (losses) of associates and joint ventures) and adjusted EBITDA (EBITDA excluding management and brand fees and restructuring and exceptional expenses) are meaningful for investors because they provide an analysis of operating results and profitability using the same measures used by management. As a consequence, EBITDA and adjusted EBITDA are presented in addition to operating profit.
EBITDA and adjusted EBITDA, are two of the key measures of operating profitability used to i) implement investments and resource-allocation strategy, and ii) assess the performance of the management.

EE Limited
41
Notes to the Financial Statements (continued)
7. Revenue
Year ended 31)) Year ended 31)) December 2015)) December 2014)) £m £m
Mobile service revenue 5,514 5,619
Fixed and wholesale revenue 488 422
Operating revenue 6,002 6,041
Equipment revenue 309 286
Total revenue 6,311 6,327
8. External purchases
External purchases comprise:
commercial expenses, which include purchases of handsets and other products sold, retail fees and commissions, and advertising, promotional, sponsoring costs;
service fees and inter-operator costs;
other network charges and IT charges which include outsourcing fees relating to technical operation and maintenance and IT; and
other external purchases, which include overheads, real estate fees, equipment and call centre outsourcing fees, net of capitalised goods and service costs.
Year ended
31 December Year ended
31) December 2015 2014 £m £m
Commercial expenses 2,267 2,419
Service fees and inter-operator costs 931 1,003
Other network charges, IT charges 323 312
Other external purchases 434 426
Total external purchases 3,955 4,160

EE Limited
42
Notes to the Financial Statements (continued)
9. Auditor’s remuneration
The remuneration of the auditor is analysed as follows:
Year ended 31) December
Year ended 31) December
2015 2014 £’000 £’000
Fees payable to the Company’s auditor and its associates for the audit of the Company’s annual accounts
1,188 1,080
Fees payable to the Company’s auditor and its associates for other services:
- the audit of the Company’s subsidiaries pursuant to legislation
37 37
- half year review 100 100
- other assurance services 318 76
1,643 1,293
In addition Ernst & Young LLP received £28,000 (2014: £28,000) for the audit of the Group’s pension scheme.
10. Other operating income/expense Group
)
Other operating income
Year ended 31) December
Year ended 31) December
2015 2014 £m £m Other operating income 52 30
Total other operating income 52 30
Included in other operating income is £20 million in relation to a contract amendment.

EE Limited
43
Notes to the Financial Statements (continued)
10. Other operating income / expense (continued)
Group
Other operating expense
Year ended 31) December
Year ended 31) December
2015 2014 £m £m Property rates 71 60
Spectrum fees 31 28
Bad debt expense 60 83
Management and brand fees 105 146
Foreign exchange losses on trade payables 3 5
Loss on disposal of non-current assets 5 -
Total other operating expense 275 322
11. Employees
The average number of staff (including Directors) employed under contracts of service during the year is as follows: Year ended
31) December Year ended
31) December 2015 2014 No. No. Operations 1,394 1,502 Selling and distribution 4,218 4,078 Customer care and administration 6,518 6,986
12,130 12,566
The costs incurred in respect of these employees are: Year ended)
31) December) Year ended)
31) December) 2015) 2014) £m) £m) Wages and salaries 426) 425) Social security costs 48) 49) Pension costs - Defined benefit 1) 8) - Defined contribution 23) 23) - Curtailment gain -) (28) Own work capitalised (development costs) (41) (45)
Total employee cost 457) 432)

EE Limited
44
Notes to the Financial Statements (continued)
11. Employees (continued)
In addition to the above, £0 million (2014: £20 million) of employee costs are included in restructuring expenses (note 13).
12. Directors’ emoluments
The Directors, deemed to be key management personnel, received the following remuneration in respect of services rendered to the Group: )
Year ended 31) December
Year ended
31) December 2015 2014 £’000 £’000 Remuneration 2,675 2,617 Pension costs 64 110 Amounts accrued under long term incentive schemes 3,364 768 Amounts accrued for compensation for loss of office 1,386 -
Total emoluments 7,489 3,495
Employer’s National Insurance contributions in respect of key management personnel were £1,022,463 (2014: £465,000).
The emoluments in relation to the highest paid Director are as follows:
) Year ended
31) December
Year) ended
31) December 2015 2014 £’000 £’000 Total emoluments 6,314 2,438 Pension costs 41 68
6,355 2,506
Retirement benefits in the form of defined contribution schemes are accruing for two directors at 31 December 2015 (31 December 2014: two).
13. Restructuring expenses
Year ended
31 December Year ended
31 December 2015 2014 £m £m Lease exit costs -) 31 Employee costs -) 20 Other 4) 26
Total restructuring expenses 4) 77
Other includes the disposal of the investment Weve Limited and network integration and brand costs – including advertising, rebranding and closure of retail stores.

EE Limited
45
Notes to the Financial Statements (continued)
14. Exceptional expenses Year ended
31) December Year ended
31) December 2015 2014 £m £m Phones 4U contract termination expense - 336
Total exceptional expenses - 336
Following Phones 4U Limited entering Administration and EE’s subsequent termination of its agreements in September 2014, there was an accelerated recognition of prepaid customer investment costs for future services to be delivered by Phones 4U which would have previously been expensed over future periods. This exceptional, non-cash transaction, was treated as a one-off item in the full year 2014 results.
15. Finance income and expense Year ended)
31) December) Year ended)
31) December) 2015) 2014) £m) £m) Finance income Finance income 1) 1) Foreign exchange gains 1) -)
Total finance income 2) 1)
Finance expense Finance costs (calculated using effective interest rate) on financial liabilities measured at amortised cost
(79)
(82)
Net pension interest cost (6) (6) Unwinding of discount (7) (10) Foreign exchange losses -) (1)
Total finance expense (92) (99)
16. Taxation
(a) Income tax charged in the Group income statement Year ended)
31 December) Year ended)
31 December) 2015) 2014) £m) £m) Current income tax: UK corporation tax -) -) Adjustments in respect of previous periods -) (2)
Total current income tax income -) (2)
Deferred tax: Origination and reversal of temporary differences 97) (39) Adjustments in respect of previous periods (13) 3)
Total deferred tax expense/(income) 84) (36)
Income tax expense/(income) in the Group income statement
84)
(38)

EE Limited
46
Notes to the Financial Statements (continued)
16. Taxation (continued)
(b) Income tax charged in the consolidated statement of comprehensive income
Year ended)
31 December) Year ended)
31 December) 2015) 2014) £m) £m) Deferred tax related to items charged or credited directly to the consolidated statement of comprehensive income:
Deferred tax on actuarial gain/(loss) on pension liability 13) (10)
Deferred tax on cash flow hedges 2) -)
Deferred tax expense/(income) in the consolidated statement of comprehensive income
15)
(10)
(c) Reconciliation of the total income tax expense
The income tax expense for the year differs from the average standard rate of corporation tax in the UK of 20.25% (2014: 21.5%). The differences are reconciled below:
Year ended)
31 December) Year ended)
31 December) 2015) 2014) £m) £m) Accounting profit/(loss) before income tax 416) (255)
Accounting profit/(loss) multiplied by the UK average standard rate of corporation tax of 20.25% (2014: 21.5%)
84)
(55)
Non-deductible expenses 13, 16, Impact of tax rate change on the deferred tax asset -, -, Current income tax adjustments in respect of previous periods
-, (2)
Deferred tax adjustments in respect of previous periods (13) 3)
Total income tax expense/(income) at the effective tax rate of 20.3% (2014: 14.82%)
84)
(38)
(d) Change in Corporation Tax rate
Announcements were made during 2015 by the Chancellor of the Exchequer of proposed changes to corporation tax rates that will have an effect on future tax charges of the Group. A reduction to 19%, effective from 1 April 2017, and a further reduction to 18% effective from 1 April 2020 were enacted on 18 November 2015.

EE Limited
47
Notes to the Financial Statements (continued)
16. Taxation (continued)
(e) Deferred tax asset/(liability)
The deferred tax in the consolidated statement of financial position, calculated using the appropriate prevailing corporate tax rate applicable in the period the deferred tax asset / (liability) is expected to reverse is as follows:
31 December)
31 December)
31 December)
31 December)
2015) 2014) 2015) 2014) Group) Group) Company) Company) £m) £m) £m) £m) Deferred tax liability Accelerated tax depreciation (210) (253) (62) (55) Cash flow hedges (3) (1) (3) (1)
(213) (254) (65) (56)
31 December)
31 December)
31 December)
31 December) 2015) 2014) 2015) 2014) Group) Group) Company) Company) £m) £m) £m) £m) Deferred tax asset Trading tax losses 302) 422) 302) 422) Pension scheme liabilities 16) 31) 16) 31) Provisions deductible on a paid basis
15)
20)
15)
20)
333) 473) 333) 473)
Disclosed in the consolidated statement of financial position
Net deferred tax asset 120) 219) 268) 417)
The Group offsets deferred tax assets and liabilities if and only if it has a legally enforceable right to set off income tax assets and current income tax liabilities and the deferred tax assets and deferred tax liabilities relate to income taxes levied by the same tax authority. The deferred tax assets and liabilities listed above relate to income tax levied by HM Revenue and Customs in the UK.
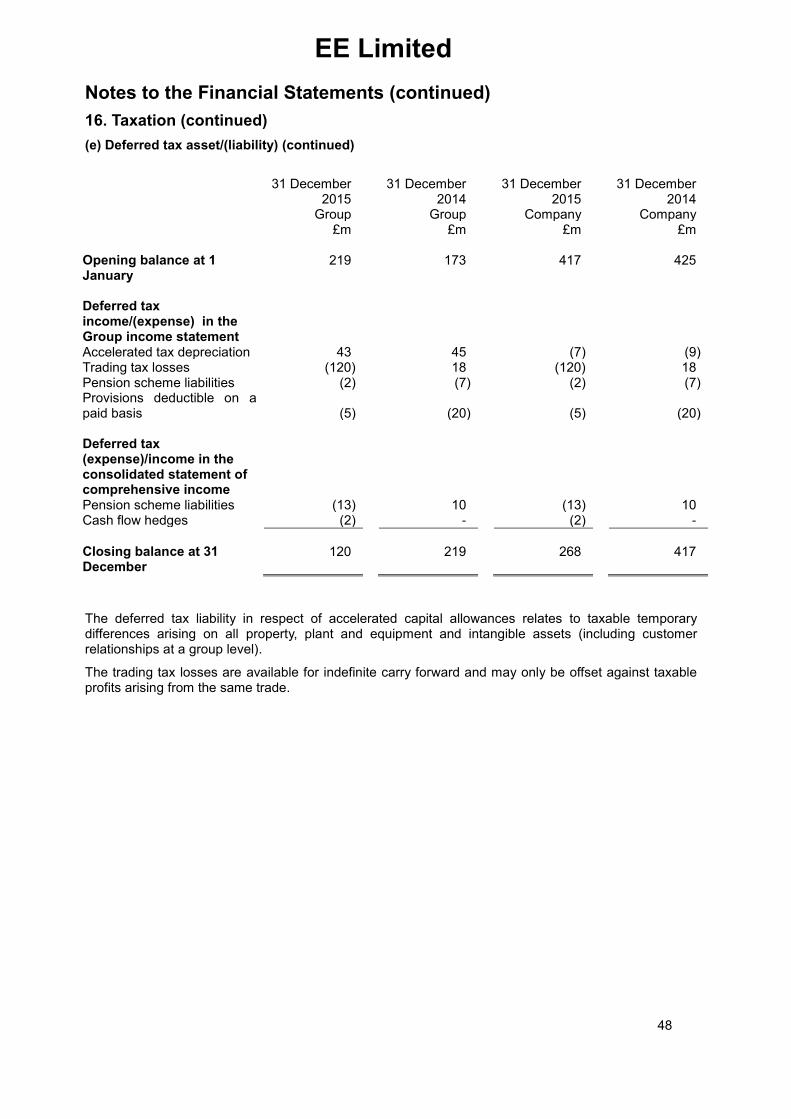
EE Limited
48
Notes to the Financial Statements (continued)
16. Taxation (continued)
(e) Deferred tax asset/(liability) (continued)
31 December)
31 December)
31 December)
31 December)
2015) 2014) 2015) 2014) Group) Group) Company) Company) £m) £m) £m) £m) Opening balance at 1 January
219)
173)
417)
425)
Deferred tax income/(expense) in the Group income statement
Accelerated tax depreciation 43) 45) (7) (9) Trading tax losses (120) 18) (120) 18) Pension scheme liabilities (2) (7) (2) (7) Provisions deductible on a paid basis
(5)
(20)
(5)
(20)
Deferred tax (expense)/income in the consolidated statement of comprehensive income
Pension scheme liabilities (13) 10) (13) 10) Cash flow hedges (2) -) (2) -)
Closing balance at 31 December
120)
219)
268)
417)
The deferred tax liability in respect of accelerated capital allowances relates to taxable temporary differences arising on all property, plant and equipment and intangible assets (including customer relationships at a group level).
The trading tax losses are available for indefinite carry forward and may only be offset against taxable profits arising from the same trade.

EE Limited
49
Notes to the Financial Statements (continued)
17. Intangible assets
Group Goodwill) Customer) relationships)
Spectrum) Other) Total)
£m) £m) £m) £m) £m)
Cost:
At 31 December 2013 5,692) 2,600) 4,302) 1,045) 13,639)
Additions 5) 5) -) 116) 126)
At 31 December 2014 5,697) 2,605) 4,302) 1,161) 13,765)
Additions -) -) -) 89) 89)
Disposals -) -) -) (1) (1)
At 31 December 2015 5,697) 2,605) 4,302) 1,249) 13,853)
Amortisation:
At 31 December 2013 -) (1,384) (1,256) (605) (3,245)
Charge during the year -) (261) (343) (127) (731)
At 31 December 2014 -) (1,645) (1,599) (732) (3,976)
Charge during the year -) (228) (368) (78) (674)
At 31 December 2015 -) (1,873) (1,967) (810) (4,650)
Net book value at 31 December 2015
5,697) 732) 2,335) 439) 9,203)
Net book value at 31 December 2014
5,697) 960) 2,703) 429) 9,789)
Net book value at 31 December 2013
5,692) 1,216) 3,046) 440) 10,394)

EE Limited
50
Notes to the Financial Statements (continued)
17. Intangible assets (continued) Company
Goodwill)
Spectrum)
Other)
Total)
£m) £m) £m) £m)
Cost:
At 31 December 2013 637) 4,302) 938) 5,877)
Additions -) -) 121) 121)
At 31 December 2014 637) 4,302) 1,059) 5,998)
Additions -) -) 89) 89)
Disposals -) -) (1) (1)
At 31 December 2015 637) 4,302) 1,147) 6,086)
Amortisation:
At 31 December 2013 -) (1,256) (538) (1,794)
Charge during the year -) (343) (122) (465)
At 31 December 2014 -) (1,599) (660) (2,259)
Charge during the year -) (368) (75) (443)
At 31 December 2015 -) (1,967) (735) (2,702)
Net book value at 31 December 2015
637) 2,335) 412) 3,384)
Net book value at 31 December 2014
637) 2,703) 399) 3,739)
Net book value at 31 December 2013
637) 3,046) 400) 4,083)
Goodwill – Group and Company
Group goodwill arose upon the combination of the businesses that formed the Group in 2010.
In 2014 the Group recognised a further £4.8 million of goodwill following the acquisition of the remaining share capital in Mainline Communications Group Plc.
Company goodwill arose prior to the formation of the Group.
Impairment test for goodwill and intangible assets
Goodwill is not ascribed a useful economic life, but, as required by IAS 36: Impairment of Assets, is subject to an annual impairment review. The impairment review for the Group was performed as at 31 October 2015, and resulted in no impairment to the carrying value of goodwill.
The Group has determined that the business comprises a single operating segment to which all the goodwill is allocated. The method used for establishing the recoverable amount for 2015 is fair value less costs of disposal, whereas in the prior year the recoverable amount was based on the value in use calculation derived from conventional discounted cash flow projections.
In prior years, a value in use calculation was used because there were no transactions or prospective transactions of comparable size in the UK market. However pursuant to the terms of the share purchase agreement signed 5 February 2015, Orange and DT agreed to sell to BT 100% of their shares in EE Limited. Therefore in 2015 a revised approach to the impairment review was proposed to use a fair value less costs of disposal basis of calculation.

EE Limited
51
Notes to the Financial Statements (continued)
17. Intangible assets (continued)
Impairment test for goodwill and intangible assets (continued)
IFRS 13 ‘Fair Value Measurement’ includes a fair value hierarchy that categorises into three levels the inputs to valuation techniques used to measure fair value. The valuation of the Group falls within level 2 inputs where quoted prices are not available but the fair value is based on observable market data, being the share purchase agreement. This states a total purchase price equivalent to £12.5 billion on a cash and debt free basis less the costs to sell the Group.
The method used for establishing the recoverable amount in 2014 was a value in use calculation which is the present value of the future cash flows expected to be derived from the CGUs or groups of CGUs. Cash flow projections are based on economic and regulatory assumptions, licence renewal assumptions and forecast trading conditions drawn up by the Group’s management, as follows:
cash flow projections are based on five-year business plans;
cash flow projections beyond that timeframe are extrapolated by growth rate to perpetuity reflecting the expected long-term growth in the market; and
the cash flows obtained are discounted using appropriate rates for the type of business and the countries concerned.
Measurement of the cash-generating unit is based upon historical information, together with financial plans which have been approved by management and are used for internal purposes. A 5 year forecast period was used because management considered that by the end of this period a reliable and sustainable cash flow would emerge on which to base the terminal value. Cash flows beyond this planning horizon are extrapolated using appropriate growth rates.
The value in use projections in 2014 used a long term growth rate of 1%, and a pre-tax discount rate of 9.37%. The discount rate used was based upon an estimated cost of capital (calculated using the capital asset pricing model) taking into account relevant sector information.
The key assumptions which affect the cash flow forecast of the business include the development of the UK market and its size, the Group’s share of the market, customer revenues, operating margins and network maintenance expenditure. Any significant future changes in these assumptions could have an impact on the value in use. Based on the assessment of sensitivities the Group does not believe that any reasonably possible changes in assumptions would lead to impairment.
The impairment test for the Company goodwill did not identify any indicators of impairment.
Customer relationships - Group
In accordance with IAS 36, an assessment at the reporting date was performed to assess whether any indication of impairment existed for the customer relationships. No indicators of impairment were identified.
Spectrum – Group and Company
In accordance with IAS 36, an assessment at the reporting date was performed to assess whether any indication of impairment existed for the Spectrum. No indicators of impairment were identified.
Other – Group and Company
In accordance with IAS 36, an assessment at the reporting date was performed to assess whether any indication of impairment existed for the other intangible assets. No indicators of impairments were identified.
As at 31 December 2015, other intangible assets include assets under construction of £162 million (2014: £151 million). The impairment test did not identify any indicators of impairment for these assets.

EE Limited
52
Notes to the Financial Statements (continued)
18. Property, plant and equipment
Group and Company Freehold) land &)
buildings )
Short term leasehold
improvements Restated
Network
Fixtures) &) fittings Restated)
Total)
£m) £m) £m) £m) £m)
Cost:
At 31 December 2013 53) 155) 3,283) 106) 3,597)
Additions -) 6) 431) 38) 475)
Disposals -) (1) (91) (2) (94)
At 31 December 2014 53) 160) 3,623) 142) 3,978)
Additions -) -) 456) 49) 505)
Disposals (2) (18) (280) (1) (301)
At 31 December 2015 51) 142) 3,799) 190) 4,182)
Depreciation:
At 31 December 2013 (6) (58) (1,164) (56) (1,284)
Charge during the year (4) (20) (405) (22) (451)
Disposals -) 1) 91) 2) 94)
At 31 December 2014 (10) (77) (1,478) (76) (1,641)
Charge during the year (2) (31) (435) (23) (491)
Disposals 2) 16) 277) 1) 296)
At 31 December 2015 (10) (92) (1,636) (98) (1,836)
Net book value at 31 December 2015
41) 50) 2,163) 92) 2,346)
Net book value at 31 December 2014
43) 83) 2,145) 66) 2,337)
Net book value at 31 December 2013
47) 97) 2,119) 50) 2,313)

EE Limited
53
Notes to the Financial Statements (continued)
18. Property, plant and equipment (continued)
Network Share Arrangement
The Group and Hutchison 3G UK Limited share a 3G network and the costs of backhaul and civil engineering for 4G rural sites. The Net Book Value (“NBV”) of the Group’s investment in this shared operation is £585 million at 31 December 2015 (2014: £623 million) and is shown within network assets.
Included in Group network assets is £186 million (2014: £182 million), which is the Group’s share of MBNL network assets.
Fully depreciated assets
Included above are fully depreciated assets with an original cost of £249 million (2014: £138 million) which are still in use.
Assets under construction
As at 31 December 2015, included within Network assets are £232 million (2014: £211 million) of assets under construction. This includes assets located on both unilateral and shared network sites.
Prior year restatement
During the year the Group reassessed the depreciation charged to individual assets. This resulted in depreciation charges (£22 million) for prior years being reclassified between categories of asset. There is no impact on the overall depreciation charged in each period.

EE Limited
54
Notes to the Financial Statements (continued)
19. Subsidiaries, associates and joint arrangements
a) Interests in subsidiaries
The Group's subsidiary undertakings, unless otherwise stated, throughout the year were as follows: Name Country of
incorporation Year end Principal
activities Percentage shareholding
EE Finance Plc UK 31 December Finance
Company 100%
Mainline Communications Group Limited
UK 31 August Communication Distribution
100%
Mainline Digital Communications Limited *
UK 31 August Communication Distribution
100%
Mobilise Telecoms Limited *
UK 31 August Communication Distribution
100%
M-viron Limited *
UK 31 August Communication Distribution
100%
Mainline Limited *
UK 31 August Communication Distribution
100%
Orange Services India Private Limited
India 31 March Management support
100%
EE Communications (South Africa) Proprietary Limited
South Africa 31 December Management support
100%
EE Pension Trustee Limited UK 31 December Pension Trustee 100%
Orange FURBS Trustees Limited *
UK 31 December Pension Trustee 100%
Orange Personal Communications Services Limited
UK 31 December Non-trading 100%
EE (Group) Limited * UK 31 December Dormant 100%
Orange Home UK Limited * UK 31 December Dormant 100%
Everything Everywhere Limited UK 31 December Dormant 100%
EE Services Limited UK 31 December Dormant 100%
Skeegle Holdings Limited (incorporated August 2015)
UK 31 December Dormant 100%
Skeegle App Limited (incorporated September 2015) *
UK 31 December Dormant 100%
Skeegle Operations Limited (incorporated September 2015) *
UK 31 December Dormant 100%
* Subsidiaries are held by subsidiary entities in the group

EE Limited
55
Notes to the Financial Statements (continued)
19. Subsidiaries, associates and joint arrangements (continued)
a) Interests in subsidiaries (continued)
All subsidiaries have share capital consisting of ordinary shares. The subsidiaries with non-coterminous year ends are consolidated using the last relevant audited financial statements, adjusted for subsequent material transactions, where the year end of the subsidiary is within 3 months of the year end of the Group. Where the year end is outside of 3 months of the Group’s reporting period, the latest management accounts of the subsidiary are used, adjusted for subsequent material transactions.
All subsidiaries have a functional currency of British Pounds except for Orange Services India Private Limited, which has a functional currency of Indian Rupees and EE Communications (South Africa) Proprietary Limited which has a functional currency of South African Rand.
Orange Services India Private Limited reports to the year ending 31 March to comply with the Indian fiscal year. Mainline Communications Group PLC reports to the year ending 31 August.
On 18 August 2015, a 100% subsidiary Skeegle Holdings Limited was incorporated. Subsequently two further 100% subsidiaries of Skeegle Holdings Limited were incorporated on 10 September 2015, Skeegle App Limited and Skeegle Operations Limited, which have been consolidated into the Group’s consolidated statement of financial position. b) Interests in associates and joint arrangements
i) Joint Operations
The Group and Hutchison 3G UK Limited (together “the Companies”) each have a 50% share in the joint operation Mobile Broadband Network Limited (“MBNL”). MBNL’s ongoing purpose is the consolidation of the legacy networks, acquiring assets relevant to the shared network on behalf of the Companies, managing network and operational services as their agent in respect of the Shared Network and unilateral deployments (being network assets or services specific to one company only). The Group is committed to incurring 50% of costs in respect of restructuring the Shared Network.
Guarantees for the joint operation are given by DT and Hutchison Whampoa Limited. DT and Orange have agreed between them to manage any potential liability by arrangements between themselves.
The principal place of business of the joint operation is in the UK.
ii) Interests in Associates and Joint Ventures
Set out below are the associates and joint ventures of the Group as at 31 December 2015 which, in the opinion of the directors, are individually not material to the Group. The entities listed below have share capital consisting solely of ordinary shares, which are held directly by the Group. The country of incorporation or registration is also their principal place of business, and the proportion of ownership interest is the same as the proportion of voting rights held.
The Group's associate and joint venture undertakings throughout the year were as follows:
Those associates and joint ventures with non-coterminous year ends are equity accounted using the last relevant audited financial statements, adjusted for subsequent material transactions.
Name Year end Nature of relationship
Principal activities Percentage shareholding
Midland Communications Distribution Limited
31 October
Joint Venture
Communication distribution
35%
Digital Mobile Spectrum Limited 31 December
Associate Corrective support for Freeview services
affected by deployment of 4G
(800 MHz)
25%

EE Limited
56
Notes to the Financial Statements (continued)
19. Subsidiaries, associates and joint arrangements (continued)
On 1 May 2015, the Group disposed of its investment in Weve Limited, a joint venture in which it held a 33.3% shareholding, for no consideration. This resulted in a net loss of £4 million.
Reconciliation of the impact of individually immaterial associates and joint ventures on equity and financial performance:
Group 31 December) 2015)
31 December) 2014)
£m) £m)
Balance at the beginning of the year 3) 6)
Aggregate amounts of the Group’s share of:
Increase in investment in the year 2) 14)
Impairment in investment in the year (1) -))
(Loss) from continuing activities (1) (5)
Dividends received -) (2)
Associates consolidated as subsidiaries following acquisition -) (10)
Disposal of investments in the year (3) -)
Balance at the end of the year -)
3)
On 18 December 2014, the Group purchased the remaining 74% share capital of Mainline
Communications Group PLC, gaining control of the entity and hence it was classified as a subsidiary (2013: Joint Venture, 26% holding), and consolidated into the Group’s Consolidated Statement of Financial Position.
Company 31 December)
2015) 31 December)
2014)
£m) £m)
Balance at the beginning of the year 19) 3)
Increase in investment in the year 2) 16)
Impairment in investment in the year (5)
Disposal of investment in the year (3) -))
Balance at the end of the year 13)
19)
Control of Mainline Communications Group PLC was acquired 18 December 2014 at which time the entity was classified as a subsidiary (prior to transaction it was classified as a joint venture).

EE Limited
57
Notes to the Financial Statements (continued)
20. Inventories
Group
Company
31)) December)) 31 December) 31 December) 31 December)
2015) 2014) 2015) 2014) £m) £m) £m) £m)
Inventories of handsets 66) 77) 66) 76)
Gross value 83) 93) 83) 92)
Provision for obsolescence (17) (16) (17) (16)
Total inventories at the lower of cost and net realisable value
66) 77) 66) 76)
The amount of inventory included within external purchases was £1,290 million (2014: £1,273 million). This includes write-downs on new inventory of £2 million (2014: £2 million).
21. Trade and other receivables – Group and Company
Group Company
31) December)
31) December)
31) December)
31) December)
2015) 2014) 2015) 2014)
Current: £m) £m) £m) £m)
Trade receivables 689) 770) 691) 772)
Prepaid external purchases 227) 212) 227) 212)
Other assets and prepaid operating expenses
10) 10) 10) 10)
Total trade and other receivables 926) 992) 928) 994)
31) December)
31) December)
31) December
31) December)
2015) 2014) 2015) 2014) Non-current: £m) £m) £m) £m)
Prepayments 54) 22) 54) 22)

EE Limited
58
Notes to the Financial Statements (continued)
21. Trade and other receivables – Group and Company (continued)
As at 31 December 2015, trade receivables at nominal value of £96 million (2014: £114 million) were determined to be impaired because of poor payment history or insolvency of the debtor and fully provided for.
Movements in the provision for impairment of trade receivables were as follows:
Group and Company 31)
December) 31)
December) 2015) 2014) £m) £m)
Opening balance 114, 124,
Utilisation (92) (103)
Increase in provision 75) 106)
Decrease in provision (1) (13)
Closing balance 96, 114,
Trade receivables that were past due but not impaired may be analysed as follows:
Group Company
31) December)
2015)
31) December)
2014)
31) December)
2015)
31) December)
2014)
£m) £m) £m) £m)
Neither past due nor impaired 642, 711, 644, 713,
Past due but not impaired
30 days 36, 16, 36, 16,
60 days 11, 43, 11, 43,
689) 770) 691) 772)
The carrying amounts for trade and other receivables approximate to their fair value.

EE Limited
59
Notes to the Financial Statements (continued)
22. Cash and cash equivalents
Group
Company
31) December)
31) December)
31 December
31 December
2015) 2014) 2015 2014
£m) £m) £m £m
Cash at Bank 60) 52) 54 46
Cash Pooling 334) 359) 334 359
394) 411) 388 405
Cash and cash equivalents also include the cash pooling account. On a daily basis the Group upstreams or downstreams cash to/from each Shareholder (DT and Orange) on an equal 50:50 basis. The account also earns interest at the overnight LIBOR rate minus 15 basis points.
23. Trade and other payables – Group and Company
Group Company
31 December
31) December)
31) December)
31) December)
2015 2014) 2015) 2014) Current:
£m £m) £m) £m)
Trade payables 1,522 1,722) 1,525) 1,726)
VAT payable 186 152) 186) 152)
Other taxes 1 1) 1) 1)
Employee related payables 67 66) 67) 66)
Deferred income 250 238) 250) 238)
Interest payable 35 34) 35) 34)
Other 11 17) 11) 17)
2,072 2,230) 2,075) 2,234)
31 December
31) December)
31) December)
31) December)
2015 2014) 2015) 2014)
Non-current:
£m £m) £m) £m)
Other 18 23) 18) 23)
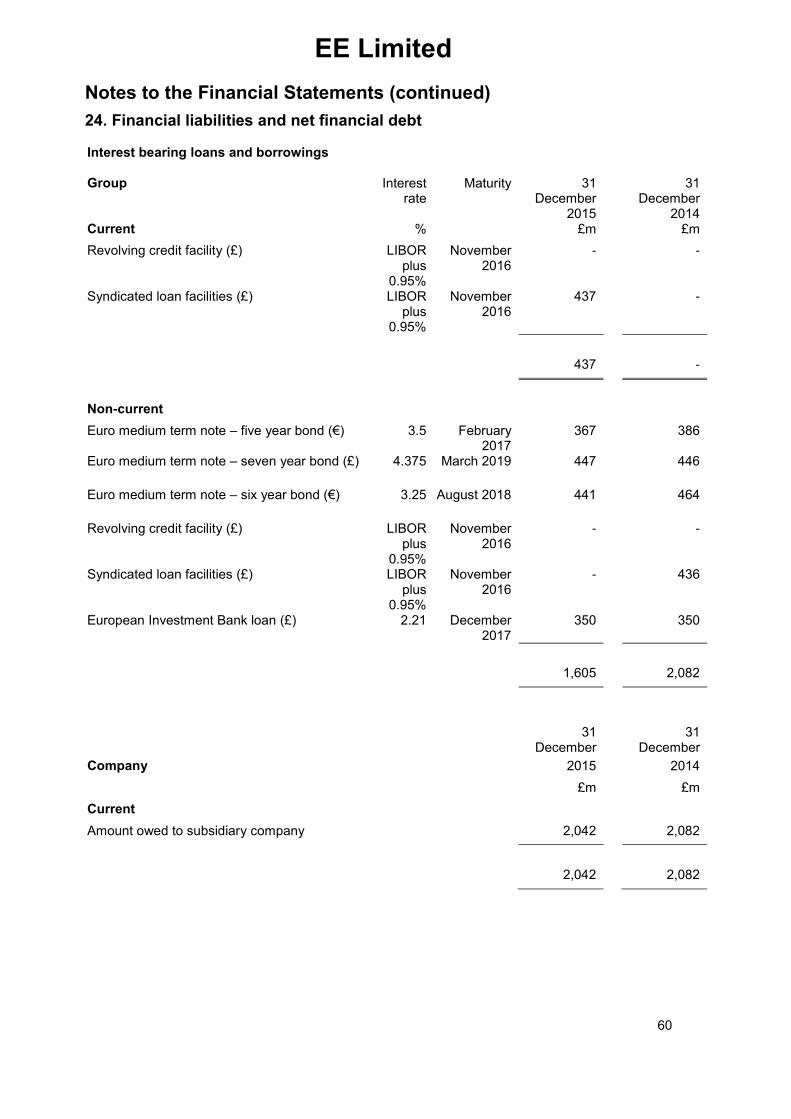
EE Limited
60
Notes to the Financial Statements (continued)
24. Financial liabilities and net financial debt Interest bearing loans and borrowings
Group
Interest
rate
Maturity
31
December 2015
31
December 2014
Current % £m £m
Revolving credit facility (£) LIBOR plus
0.95%
November 2016
- -
Syndicated loan facilities (£) LIBOR plus
0.95%
November 2016
437 -
437 -
Non-current
Euro medium term note – five year bond (€)
3.5 February 2017
367 386
Euro medium term note – seven year bond (£)
4.375 March 2019 447 446
Euro medium term note – six year bond (€)
3.25 August 2018 441 464
Revolving credit facility (£) LIBOR plus
0.95%
November 2016
-
-
350
-
436
350
Syndicated loan facilities (£) LIBOR plus
0.95%
November 2016
European Investment Bank loan (£) 2.21 December 2017
1,605 2,082
31
December
31
December
Company 2015 2014
£m £m
Current
Amount owed to subsidiary company 2,042 2,082
2,042 2,082

EE Limited
61
Notes to the Financial Statements (continued)
24. Financial liabilities and net financial debt (continued)
Interest rates charged by the subsidiary company mirror the rates on the Group liabilities above.
Euro Medium Term Note programme
The corporate bonds issued under the Euro Medium Term Note programme are traded on the London Stock Exchange main market.
The Group and Company have capitalised £17 million of costs that were directly attributable to the bond issuances. These are being expensed through the Income Statement over the life of the bonds using the effective interest rate method.
In relation to the two bond issuances denominated in Euros, the Group and Company also entered into cross currency interest rate swaps to hedge the exposure to foreign exchange movements. The hedging relationships have been formally designated as cash flow hedges and accounted for in accordance with the accounting policies of the financial statements for the year. Under the terms of the credit support agreements entered into with the swap counterparties, the Group receives or pays collateral based upon the mark to market valuation of the swap.
Cash collateral received/paid
Cash collateral is received or paid depending upon the valuation of derivative financial instruments. Interest accrues at the Sterling Overnight Interbank Rate (“SONIA”) and Euro Overnight Interbank Rate (“EONIA”). During the year to 31 December 2015, the Group and Company paid cash collateral of £44 million, increasing the asset to £44 million (2014: £0 million).
Net financial debt
Net financial debt used by the Group is defined within the Group’s bank covenant agreements. It corresponds to financial liabilities (nominal amount - translated at the year-end closing rate) excluding operating payables, less:
(i) cash collateral paid on derivative instruments; and (ii) cash and cash equivalents and financial assets at fair value:
31)
December) 31)
December)
Group 2015) 2014)
£m) £m)
Euro 500m 3.5% note due 2017 (€) 368) 388)
Euro 600m 3.25% note due 2018 (€) 442) 466)
Euro £450m 4.375% note due 2019 (£) 450) 450)
Finance lease liability 4) 5)
Syndicated bank loans 438) 438)
European Investment Bank Loan 350) 350)
Financial liabilities 2,052) 2,097)
Less: Cash collateral paid Cash & cash equivalents
(44)
(394)
-)
(411)
Net financial debt 1,614) 1,686)

EE Limited
62
Notes to the Financial Statements (continued)
24. Financial liabilities and net financial debt (continued)
31 December)
31 December)
Company 2015) 2014)
£m) £m)
Current
Amount owed to subsidiary company 2,048) 2,092)
Finance lease liability 4) 5)
Financial liabilities 2,052) 2,097)
Cash collateral paid (44) -)
Cash & cash equivalents (388) (405)
Net financial debt 1,620) 1,692)
The year on year movement in the Euro denominated debt is due to the movement in the relevant foreign exchange rate (EUR/GBP) from 2014 to 2015. No new debt has been issued in 2015 (2014: £nil).
25. Financial instruments
31 December) 31 December)
2015) 2014)
£m) £m)
Derivative assets – Group and Company
Current
Forward foreign currency contracts 9) 2)
Total current derivative assets
9)
2)
Non-current
Cross currency interest rate swaps – cash flow hedge -) 7)
Total non-current derivative assets -) 7)

EE Limited
63
Notes to the Financial Statements (continued)
25. Financial instruments (continued)
31)
December) 31)
December) 2015) 2014)
£m) £m)
Derivative liabilities – Group and Company
Current
Forward foreign currency contracts -) (10)
Total current derivative liabilities -) (10)
Non-current
Cross currency interest rate swaps – cash flow hedge (64) (26)
Total non-current derivative liabilities
(64)
(26)
Cash flow hedges
To hedge the exposure of some of its operating cash flows in foreign currencies, the Group has set up risk hedging policies. Financial risk management is described in note 32.
Currency Hedged nominal
amount (£m) Maturity date
of hedged item Hedging
instrument Hedged risk
EUR 284 2016 Forward FX contracts
Purchases in Euros
USD 50 2016 Forward FX contracts
Purchases in Dollars
Cross currency interest rate swaps are utilised to mitigate risks associated with variable rate loans designated in foreign currency. These are as follows:
Notional Rate Maturity
£m %
Cross-currency interest rate swaps 887 € Receivable 3.36
£ Payable 3.81
2017 - 2018
The notional principal amount of cross-currency interest rate swaps as at 31 December 2015 was
£887 million (2014: £887 million).

EE Limited
64
Notes to the Financial Statements (continued)
25. Financial instruments (continued)
Gains and losses associated with hedging activities are as follows:
31 December) 31 December)
2015) 2014)
£m) £m)
Loss recycled through income statement 72) 86)
Loss recognised in equity during the year (59) (87)
Deferred tax relating to cash flow hedges (2) -)
11)
(1))
The losses recycled through the income statement have been taken through finance expense (£43 million) (2014: £62 million), external purchases (£27 million) (2014: £19 million) and other operating expense (£2 million) (2014: £5 million).
Financial assets and liabilities by category
All the Group’s financial assets and liabilities are held at amortised cost with the exception of derivative financial instruments which are held at fair value.

EE Limited
65
Notes to the Financial Statements (continued)
25. Financial instruments (continued)
Group As at 31 December 2015
Designated as) cash flow)
hedges)
Loans, receivables) and financial)
liabilities at) amortised cost) Total)
£m) £m) £m)
Current assets
Cash and cash equivalents -) 394) 394)
Other financial assets -) 44) 44)
Trade receivables -) 689) 689)
Forward foreign currency contracts 9) -) 9)
Non-current assets
Cross currency interest rate swaps -) -) -)
Current liabilities
Trade payables -) (1,522) (1,522)
Forward foreign currency contracts -) -) -)
Borrowings -) (437) (437)
Non-current liabilities
Cross currency interest rate swaps (64) -) (64)
Borrowings -) (1,605) (1,605)
Total (55) (2,437) (2,492)
As at 31 December 2014
Current assets
Cash and cash equivalents -) 411) 411)
Trade receivables -) 770) 770)
Forward foreign currency contracts 2) -) 2)
Non-current assets
Cross currency interest rate swaps 7) -) 7)
Current liabilities
Trade payables -) (1,722) (1,722)
Forward foreign currency contracts (10) -) (10)
Non-current liabilities
Cross currency interest rate swaps (26) -) (26)
Borrowings -) (2,082) (2,082)
Total (27) (2,623) (2,650)

EE Limited
66
Notes to the Financial Statements (continued)
25. Financial instruments (continued)
Company As at 31 December 2015
Designated as) cash flow)
hedges)
Loans, receivables) and financial)
liabilities at) amortised cost) Total)
£m) £m) £m)
Current assets
Cash and cash equivalents -) 388) 388)
Other financial assets -) 44) 44)
Trade receivables -) 691) 691)
Forward foreign currency contracts 9) -) 9)
Non-current assets
Cross currency interest rate swaps -) -) -)
Current liabilities
Trade payables -) (1,525) (1,525)
Forward foreign currency contracts -) -) -)
Borrowings -) (2,042) (2,042)
Non-current liabilities
Cross currency interest rate swaps (64) -) (64)
Total (55) (2,444) (2,499)
As at 31 December 2014
Current assets
Cash and cash equivalents -) 405) 405)
Trade receivables -) 772) 772)
Forward foreign currency contracts 2) -) 2)
Non-current assets
Cross currency interest rate swaps 7) -) 7)
Current liabilities
Trade payables -) (1,725) (1,725)
Forward foreign currency contracts (10) -) (10)
Borrowings -) (2,082) (2,082)
Non-current liabilities
Cross currency interest rate swaps (26) -) (26)
Total (27) (2,630) (2,657)

EE Limited
67
Notes to the Financial Statements (continued)
25. Financial instruments (continued)
Fair value
The Group uses the following hierarchy for determining and disclosing the fair value of financial instruments by valuation technique:
Level 1: quoted (unadjusted prices in active markets for identical assets or liabilities).
Level 2: other techniques for which all inputs that have a significant effect on the recorded fair value are observable, either directly or indirectly.
Level 3: techniques that use inputs that have a significant effect on the recorded fair value, which are not based upon observable market data.
The following table sets out a comparison of the carrying amounts and fair values of all non-current financial liabilities which are carried in the balance sheet at values other than fair value.
31 December 2015
Non-current
Carrying value
£m
Fair value £m
Level 1 £m
Level 2 £m
Level 3 £m
Financial liabilities
Euro medium term note – five year bond (€)
367 381 381 - -
Euro medium term note – seven year bond (£)
447 480 480 - -
Euro medium term note – six year bond (€)
441 473 473 - -
Syndicated loan facilities - - - - -
European Investment Bank loan 350 357 - 357 -
Total 1,605 1,691 1,334 357 -
31 December 2014
Non-current
Carrying value
£m
Fair value £m
Level 1 £m
Level 2 £m
Level 3 £m
Financial liabilities
Euro medium term note – five year bond (€)
386 410 410 - -
Euro medium term note – seven year bond (£)
446 484 484 - -
Euro medium term note – six year bond (€)
464 503 503 - -
Syndicated loan facilities 436 438 - 438 -
European Investment Bank loan 350 372 - 372 -
Total 2,082 2,207 1,397 810 -
The Company has a short term financial liability in place with EE Finance Plc with a carrying value of £2,042 million. The fair value of the liabilities is included at the amount which would be paid to transfer a liability in an orderly transaction between market participants at the balance sheet date. The following methods and assumptions were used to create the values:

EE Limited
68
Notes to the Financial Statements (continued)
25. Financial instruments (continued)
Cash and short term deposits, trade receivables, trade payables and other current liabilities approximate to their carrying value, largely because of their short term nature. Accordingly, they are excluded from the above table.
Long term fixed rate borrowings are evaluated by the Group and the fair value for disclosure purposes is estimated by discounting the future contractual cash flows at the current market interest rates available to the Group.
Fair value of quoted notes and bonds is based upon price quotations at the reporting date. The fair value of unquoted instruments, loans from banks, obligations under finance leases and other non-current financial liabilities is estimated by discounting cash flows based upon rates available for debt currently available on similar terms, credit risk and remaining maturities.
As at 31 December 2015 the Group held the following financial instruments carried at fair value in the statement of financial position:
31 December 2015 Level 1) Level 2) Level 3) Total)
Group and Company £m) £m) £m) £m)
Financial assets
Foreign exchange rate forward contracts -) 9) -) 9)
Derivatives in effective hedges -) -) -) -)
Financial liabilities
Foreign exchange rate forward contracts -) -) -) -)
Cross currency interest rate swaps -) (64) -) (64)
Total -) (55) -) (55)
31 December 2014 Level 1) Level 2) Level 3) Total)
Group and Company £m) £m) £m) £m)
Financial assets
Foreign exchange rate forward contracts -) 2) -) 2)
Derivatives in effective hedges -) 7) -) 7)
Financial liabilities
Foreign exchange rate forward contracts -) (10) -) (10)
Cross currency interest rate swaps -) (26) -) (26)
Total -) (27) -) (27)
The fair value of interest rate swaps is calculated as the present value of estimated future cash flows.
The fair value of forward currency contracts has been based upon discounted market forward currency
exchange rates at the balance sheet date.

EE Limited
69
Notes to the Financial Statements (continued)
26. Provisions – Group and Company
Onerous)
Leases) £m)
ARO) £m)
Network) share and)
other) £m)
Total) £m)
At 31 December 2014 64) 131) 213) 408)
Increase in year 29) 5) 44) 78)
Decrease in year -) (23) (6) (29)
Utilisation (39) (20) (186) (245)
Discount unwind 1) 5) 1) 7)
At 31 December 2015 55) 98) 66) 219)
Analysis of provisions by maturity:
At 31 December 2015
Short term 23) 27) 18) 68)
Long term 32) 71) 48) 151)
55) 98) 66) 219)
At 31 December 2014
Short term 26) 23) 155) 204)
Long term 38) 108) 58) 204)
64) 131) 213) 408)
Onerous lease provision
This represents the rent and rates for surplus leasehold properties less any anticipated income from
sub-letting the properties. The future obligations, for periods up to 15 years, under the lease
contracts being the difference between rentals paid and the sub lease rentals received have been
provided for at their net present value.
Asset Retirement Obligation (ARO)
The Group is required to dismantle equipment and restore sites and properties under operating
leases. The ARO provision is based on the best estimate of the amount required to settle the
obligation. It is discounted by applying a discount rate that reflects the passage of time. This
estimate is revised annually and adjusted against the asset to which it relates, which is then subject
to an impairment assessment. These costs are expected to be incurred over a period of up to 20
years.
Network share and other
This represents future operational costs and vacant site rentals arising from restructuring
obligations relating to network share agreements, both before and after the combination of the T-
Mobile and Orange businesses. The liabilities have been discounted to present value. These costs
are expected to be incurred over a period of up to 20 years.
Also included are the costs of employee redundancy or one-off costs following restructuring within
the Group. These costs are expected to be incurred within 12 months of recognition of the
provision.

EE Limited
70
Notes to the Financial Statements (continued)
26. Provisions – Group and Company (continued)
On 9 July 2014, the Supreme Court issued its ruling on the ongoing legal dispute regarding non-
geographic numbers between BT and various mobile operators and on 3 December 2014 it issued
its final Order. On 17 December 2014, a payment was made in accordance with the Supreme
Court Order. During the year, the Group reached agreements on settlements with various operators
relating to the provision for historic non-geographic number disputes, resulting in the provision
reducing significantly in the year.
27. Pensions – Group and Company
Defined contribution pension scheme
The pension cost for the defined contribution scheme, which represents contributions payable by the Group, amounted to £23 million (2014: £23 million). Included in other creditors is £2 million (2014: £2 million) in respect of contributions payable to the scheme.
Defined benefit pension scheme
The following summarises the movement in the EE Pension Trustee Limited pension scheme (“the DB pension scheme”) – a defined benefit scheme – for the twelve months ended 31 December 2015. The DB pension scheme was established on 1 March 2000 with benefits based on final remuneration and length of service. Assets are held in a separately administered trust. A full actuarial valuation of the defined benefit scheme using the projected unit basis was carried out as at 31 December 2014 by actuaries Mercer. The EE Defined Benefit pension scheme was closed to future accrual from 30 June 2014.
Profile of the Scheme
The defined benefit obligation includes benefits for deferred members and current pensioners.
Approximately 92% to deferred members and 8% to current pensioners.
The Scheme duration is an indicator of the weighted-average time until benefit payments are made.
For the Scheme as a whole, the duration is approximately 30 years reflecting the approximate split
of the defined benefit obligation between deferred members and current pensioners.
The scheme is administered by a separate board of Trustees which is legally separate from the
Company. The Trustees are composed of representatives of both the employer and employees. The
Trustees are required by law to act in the interest of all relevant beneficiaries and are responsible
for the investment policy with regard to the assets plus the day to day administration of the benefits.
Funding requirements
UK legislation requires that pension schemes are funded prudently. A funding valuation of the
Scheme is currently being carried out by a qualified actuary as at 31 December 2015. The last
funding valuation of the Scheme as at 31 December 2012 showed a deficit of approximately £130
million.
The Company is currently paying deficit contributions of £20 million per annum which, along with
investment returns from return-seeking assets, is expected to make good this shortfall by 31
October 2018. Prior to the closure of the scheme, the Company also paid contributions of 9.9%
(from 1 January to 31 March 2014) and 13% (1 April to 30 June 2014) of pensionable salaries in
respect of current accrual in the year.

EE Limited
71
Notes to the Financial Statements (continued)
27. Pensions – Group and Company (continued)
The main financial assumptions used in the actuarial valuation of the pension scheme were as follows:
31 December
31 December
2015 2014
% %
Inflation assumptions – RPI 3.1 3.0
Inflation assumptions – CPI 2.2 2.1
Rate of increase in salaries 4.1 4.0
Rate of increase for pensions in payment – accrued pre 6 April 2006 3.0 3.1
Rate of increase for pensions in payment – accrued post 6 April 2006 2.2 2.2
Discount rate 4.1 3.8
The mortality assumptions used were as follows: 31
December 31
December 2015 2014
Years Years
Longevity at age 65 for current pensioners 22.5 22.7
Longevity at age 65 for future pensioners (member age 45 today) 24.7 25.0
Summary of scheme assets: 31)
December) 31)
December) 2015) 2014) Value) Value) £m) £m) Investments quoted in active markets UK equity and unit trusts
Cash and cash equivalents
153
7)
121
12)
Unquoted investments Corporate bonds, derivatives and hedge funds
326)
348)
Property 84 61
Fair value of the scheme assets
570)
542)
Present value of scheme obligations (665) (701)
Liability in the Group and Company statements of financial position
(95)
(159)

EE Limited
72
Notes to the Financial Statements (continued)
27. Pensions – Group and Company (continued)
Reconciliation of present value of scheme obligations:
31 December)) 2015))
31) December) 2014)
£m)) £m)
At 1 January 701) 582)
Current and past service cost (including curtailment gain) 1) (20)
Interest cost 27) 27)
Benefits paid (7) (7)
Actuarial (gain)/loss (57) 119)
At 31 December 665) 701)
Reconciliation of fair value of scheme assets:
31 December)) 2015))
31) December) 2014)
£m)) £m)
At 1 January 542) 439)
Interest on plan assets 20) 21)
Return on plan assets (excluding amounts included in net interest expense)
(5) 66)
Benefits paid (7) (7)
Company contributions 20) 23)
At 31 December 570) 542)
The scheme assets do not include any of the Group and Company’s own financial instruments, or any property occupied by the Group.
The actual return on plan assets was a £16 million gain (2014: £87 million gain). Movement in the deficit in the year: 31) December) 31) December)) 2015))
£m)) 2014)
£m)
Opening deficit in the scheme at 1 January (159)) (143)
Current and past service cost (including curtailment gain) (1)) 20)
Contributions 20)) 23)
Other finance (loss) (6)) (6)
Actuarial gain/(loss) 51)) (53)
Closing deficit in scheme at 31 December (95) (159)

EE Limited
73
Notes to the Financial Statements (continued)
27. Pensions – Group and Company (continued)
The following amounts were recognised in the Group and Company performance statements:
Year ended 31) December)
Year ended 31) December)
2015) 2014)
£m) £m)
Operating cost
Current service cost 1) 8)
Past service cost (including curtailments) -) (28)
Pension costs 1) (20)
Financing cost
Interest on net defined benefit liability 6) 6)
Analysis of the amounts that are recognised in the Group and Company statements of comprehensive income: 31 December)) 31 December)
2015)) 2014)
£m)) £m)
Return on scheme assets excluding amounts recognised in interest income
(5)) 66)
Actuarial gains/(losses) arising from changes in the financial assumptions
49)) (124)
Actuarial gains arising from the changes in the demographic assumptions
7)) 5)
Actuarial gain/(loss) recognised in the consolidated statement of comprehensive income
51)) (53)
Under the current schedule of contributions the Group is expected to contribute £20 million to the scheme in the twelve months to 31 December 2016.
The effect of a 0.25% movement in the discount rate used of 4.1% (2014: 3.8%) would be as follows:
2015 2014
Discount rate 3.9% 4.4% 3.6% 4.1%
£m £m £m £m
Deficit in scheme at end of year 145 43 217 107
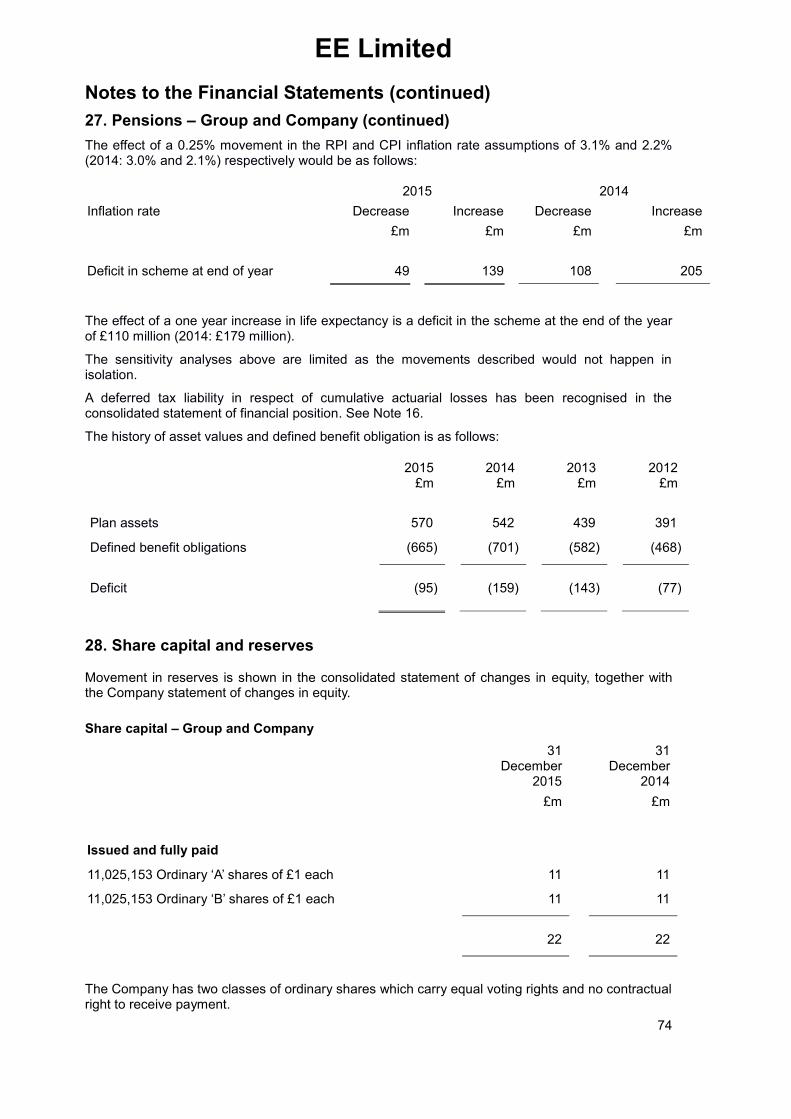
EE Limited
74
Notes to the Financial Statements (continued)
27. Pensions – Group and Company (continued)
The effect of a 0.25% movement in the RPI and CPI inflation rate assumptions of 3.1% and 2.2% (2014: 3.0% and 2.1%) respectively would be as follows:
2015 2014
Inflation rate Decrease Increase Decrease Increase
£m £m £m £m
Deficit in scheme at end of year 49 139 108 205
The effect of a one year increase in life expectancy is a deficit in the scheme at the end of the year of £110 million (2014: £179 million).
The sensitivity analyses above are limited as the movements described would not happen in isolation.
A deferred tax liability in respect of cumulative actuarial losses has been recognised in the consolidated statement of financial position. See Note 16.
The history of asset values and defined benefit obligation is as follows:
2015) £m)
2014) £m)
2013) £m)
2012) £m)
Plan assets 570) 542) 439) 391)
Defined benefit obligations (665) (701) (582) (468)
Deficit
(95)
(159)
(143)
(77)
28. Share capital and reserves
Movement in reserves is shown in the consolidated statement of changes in equity, together with the Company statement of changes in equity.
Share capital – Group and Company
31 December
31 December
2015 2014
£m £m
Issued and fully paid
11,025,153 Ordinary ‘A’ shares of £1 each 11 11
11,025,153 Ordinary ‘B’ shares of £1 each 11 11
22 22
The Company has two classes of ordinary shares which carry equal voting rights and no contractual right to receive payment.

EE Limited
75
Notes to the Financial Statements (continued)
28. Share capital and reserves (continued)
Share premium account – Group and Company
On 23 March 2010 a special resolution was passed to reduce the share premium account at that time. On 24 March 2010 a share premium of £1,638 million was recognised, along with the issue of the £1 ordinary ‘A’ shares above.
Capital contribution reserve – Group and Company
The capital contribution reserve relates to a cash contribution from the shareholders without the issue of additional shares.
New basis reserve - Group
The new basis reserve arises on consolidation and includes all previously recognised retained earnings of the subsidiaries contributed to the Group as well the fair value adjustments made on formation of the new reporting entity as at 1 April 2010.
Cash flow hedge reserve – Group and Company
The Group uses hedge accounting for its foreign currency transactions. The effective part of the hedged item is taken to the cash flow hedge reserve.
29. Dividends paid
Year ended 31 December
Year ended 31 December
Group and Company 2015 2014
£m £m
Dividends declared and paid
650
551
Dividend per share (£ / share)
£29.48
£24.99
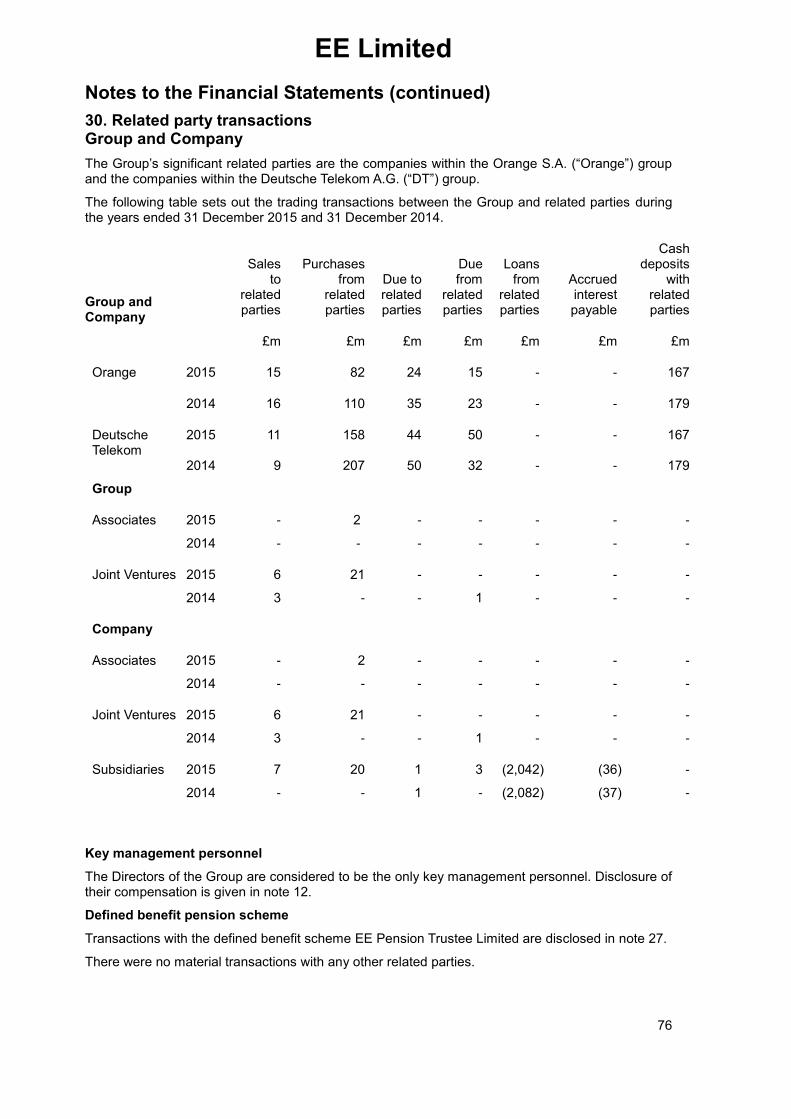
EE Limited
76
Notes to the Financial Statements (continued)
30. Related party transactions Group and Company
The Group’s significant related parties are the companies within the Orange S.A. (“Orange”) group and the companies within the Deutsche Telekom A.G. (“DT”) group.
The following table sets out the trading transactions between the Group and related parties during the years ended 31 December 2015 and 31 December 2014.
Group and Company
Sales
to related parties
Purchases from
related parties
Due to related parties
Due from
related parties
Loans) from)
related) parties)
Accrued) interest) payable)
Cash deposits
with related parties
£m £m £m £m £m) £m) £m
Orange 2015 15 82 24 15 -) -) 167
2014 16 110 35 23 -) -) 179
Deutsche Telekom
2015 11 158 44 50 -) -) 167
2014 9 207 50 32 -) -) 179
Group
Associates 2015
2014
-
-
2
-
-
-
-
-
-)
-)
-)
-)
-
-
Joint Ventures 2015
2014
6
3
21
-
-
-
-
1
-)
-)
-)
-)
-
-
Company
Associates 2015
2014
-
-
2
-
-
-
-
-
-)
-)
-)
-)
-
-
Joint Ventures 2015
2014
6
3
21
-
-
-
-
1
-)
-)
-)
-)
-
-
Subsidiaries 2015
2014
7
-
20
-
1
1
3
-
(2,042)
(2,082)
(36)
(37)
-
-
Key management personnel
The Directors of the Group are considered to be the only key management personnel. Disclosure of their compensation is given in note 12.
Defined benefit pension scheme
Transactions with the defined benefit scheme EE Pension Trustee Limited are disclosed in note 27.
There were no material transactions with any other related parties.

EE Limited
77
Notes to the Financial Statements (continued)
31. Capital and financial commitments
Finance leases – Group and Company Future minimum lease payments under finance leases and hire purchase contracts are as follows: 31)
December) 31)
December) 2015) 2014) £m) £m) Not later than one year 2) 2)
After one year but not more than five years 2) 3)
After five years -) -)
4) 5)
The present value of minimum lease payments is analysed as follows: 31)
December) 31)
December) 2015) 2014) £m) £m) Not later than one year 2) 2)
After one year but not more than five years 2) 3)
After five years -) -)
4) 5)
Operating leases – Group and Company
Future minimum rentals payable under non-cancellable operating leases are as follows: 31)
December) 31)
December) 2015) 2014) £m) £m) Not later than one year 240) 251)
After one year but not more than five years 679) 686)
After five years 329) 426)
1,248) 1,363)
Operating leases primarily relate to mast sites, office space and retail shops.
Lease payments for operating leases expensed in the year was £282 million (year ended 31 December 2014: £293 million).
Purchase commitments – Group and Company
The Group has £252 million of device commitments (2014: £258 million).
Capital commitments – Group and Company
The Group and Company has £437 million of capital commitments at 31 December 2015 (2014:
£461 million), including their share of the MBNL joint arrangement's capital commitments of £27
million (2014: £31 million).
Other commitments – Group and Company
The Group and Company has £532 million of service commitment at 31 December 2015 (2014:
£764 million).
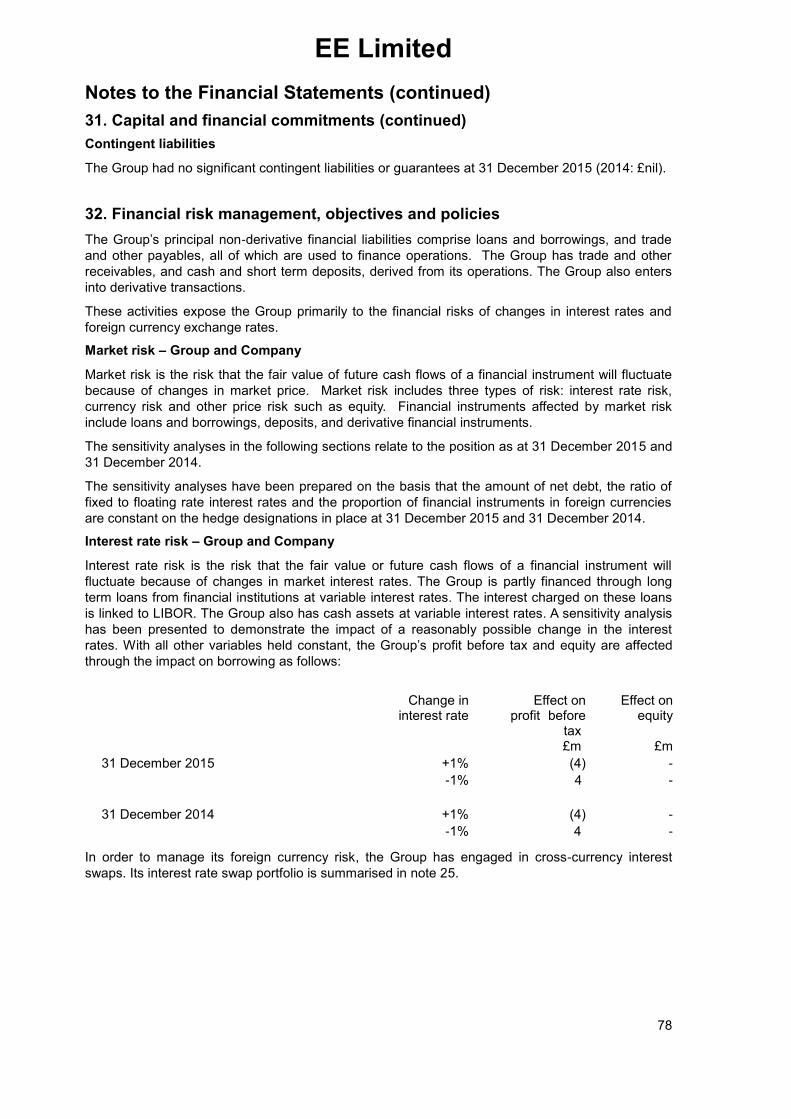
EE Limited
78
Notes to the Financial Statements (continued)
31. Capital and financial commitments (continued)
Contingent liabilities
The Group had no significant contingent liabilities or guarantees at 31 December 2015 (2014: £nil).
32. Financial risk management, objectives and policies
The Group’s principal non-derivative financial liabilities comprise loans and borrowings, and trade
and other payables, all of which are used to finance operations. The Group has trade and other
receivables, and cash and short term deposits, derived from its operations. The Group also enters
into derivative transactions.
These activities expose the Group primarily to the financial risks of changes in interest rates and
foreign currency exchange rates.
Market risk – Group and Company
Market risk is the risk that the fair value of future cash flows of a financial instrument will fluctuate
because of changes in market price. Market risk includes three types of risk: interest rate risk,
currency risk and other price risk such as equity. Financial instruments affected by market risk
include loans and borrowings, deposits, and derivative financial instruments.
The sensitivity analyses in the following sections relate to the position as at 31 December 2015 and
31 December 2014.
The sensitivity analyses have been prepared on the basis that the amount of net debt, the ratio of
fixed to floating rate interest rates and the proportion of financial instruments in foreign currencies
are constant on the hedge designations in place at 31 December 2015 and 31 December 2014.
Interest rate risk – Group and Company
Interest rate risk is the risk that the fair value or future cash flows of a financial instrument will
fluctuate because of changes in market interest rates. The Group is partly financed through long
term loans from financial institutions at variable interest rates. The interest charged on these loans
is linked to LIBOR. The Group also has cash assets at variable interest rates. A sensitivity analysis
has been presented to demonstrate the impact of a reasonably possible change in the interest
rates. With all other variables held constant, the Group’s profit before tax and equity are affected
through the impact on borrowing as follows:
Change in interest rate
Effect on profit) before
tax)
Effect on) equity)
£m) £m) 31 December 2015 +1% (4) -)
-1% 4, -)
31 December 2014 +1% (4) -) -1% 4) -)
In order to manage its foreign currency risk, the Group has engaged in cross-currency interest
swaps. Its interest rate swap portfolio is summarised in note 25.

EE Limited
79
Notes to the Financial Statements (continued)
32. Financial risk management, objectives and policies (continued)
Financial liabilities and assets – Group and Company
The interest rate profiles of financial liabilities (excluding finance leases) based on their nominal
amounts were as follows:
31 December 2015 31 December 2014
Financial liabilities
Fixed
£m
Floating
£m
Total
£m
Fixed
£m
Floating
£m
Total
£m
Sterling 800 438 1,238 800 438 1,238
Euro at year end rates 810 - 810 854 - 854
1,610 438 2,048 1,654 438 2,092
Fixed rate borrowings had a weighted average interest rate of 3.4% at 31 December 2015 (2014: 3.4%) with the weighted average time for which rates are fixed being 2.3 years (2014: 3.2 years). Floating rate borrowings and cash deposit interest rates are based upon LIBOR.
31 December 2015 31 December 2014
Financial assets
Floating
£m
Non-
interest
bearing
£m
Total
£m
Floating
£m
Non-
interest
bearing
£m
Total
£m
Sterling 378 60 438 359 52 411
378 60 438 359 52 411
Foreign currency risk is the risk that the fair value or future cash flows of a financial instrument will
fluctuate because of changes in foreign exchange rates. The Group’s exposure to the risk of
changes in foreign exchange rates relates primarily to operating activities when revenues and
expenses are denominated in a currency other than the Group’s functional currency.
As at 31 December 2015 the Group had £810 million (2014: £854 million) of long term loans
designated in Euros. The foreign currency risk attached to these loans is managed using cross
currency interest rate swaps. This is described under interest rate risk in note 25.
The Group mitigates its exposure to short term foreign currency risk by the treasury policy of
hedging transactions that are expected to occur within a 12 month period.
Due to the policy of hedging foreign currency transactions for purchases of inventories for resale
and capital equipment, there is reduced risk arising from foreign exchange.

EE Limited
80
Notes to the Financial Statements (continued)
32. Financial risk management, objectives and policies (continued)
A sensitivity analysis of the Group’s and the Company’s exposure to foreign exchange risk, based
on balances as at the year ended 31 December 2015, is as follows: )
31 December 2015 31 December 2014 Income)
statement) gain/(loss))
Effect on)
equity)
Income) statement) gain/(loss))
Effect on)
equity)
£m) £m £m £m) EUR strengthens +10% vs GBP 32) -) -))) -) EUR weakens -10% vs GBP (26) -) -))) -) EUR strengthens +5% vs GBP -) -) 15) -) EUR weakens -5% vs GBP -) -) (13) -) USD strengthens +10% vs GBP 6 ) -) -))) -) USD weakens -10% vs GBP (4) -) -))) -)
USD strengthens +5% vs GBP -) -) 2) -) USD weakens -5% vs GBP -) -) (2) -)
The above sensitivity analysis excludes foreign currency risk attached to long term loans
designated in Euros.
Equity price risk – Group and Company
The Group does not hold listed or unlisted equity securities except for associates and joint ventures
as disclosed in note 19 and therefore there is minimal exposure to equity price risk.
Credit risk – Group and Company
Credit risk is the risk of loss resulting from counterparty default arising on all credit exposures. The
Group is exposed to credit risk from its operating activities (primarily for trade receivables), and
from financing activities including deposits with banks, foreign exchange transactions and other
financial instruments.
The Group manages its credit risk by generally requiring that customers satisfy credit worthiness
criteria. The amount of exposure to any individual counterparty is subject to a limit, which is
reassessed regularly.
Credit risk related to the derivatives held for trading that are fair valued through the Group income
statement are subject to the maximum exposure amount shown in note 25 and in the liquidity table
below.
The carrying amount of financial assets represents the maximum exposure to credit risk. The maximum Group exposure to credit risk at the reporting dates: 31
December 31
December 2015 2014 £m £m Trade and other receivables 689 770 Cash at bank and in hand 394 411 Cash collateral 44 -
The disclosure regarding financial assets that are past due or impaired is given in note 21.
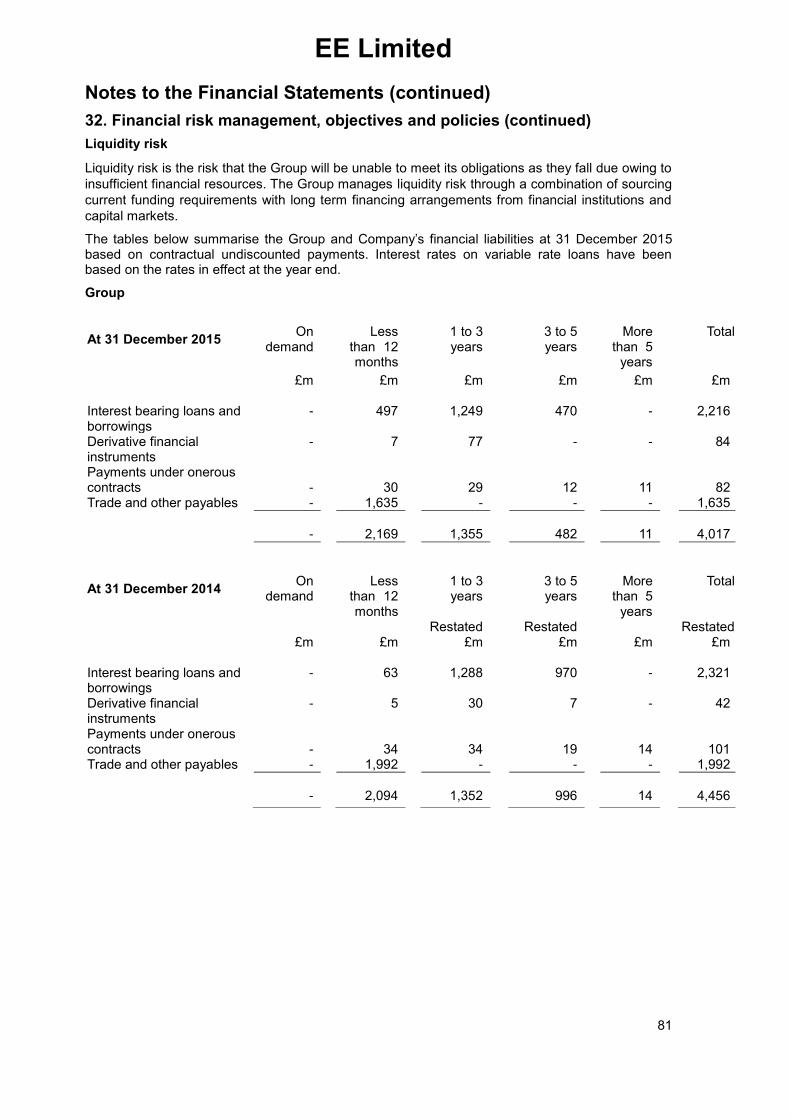
EE Limited
81
Notes to the Financial Statements (continued)
32. Financial risk management, objectives and policies (continued)
Liquidity risk
Liquidity risk is the risk that the Group will be unable to meet its obligations as they fall due owing to
insufficient financial resources. The Group manages liquidity risk through a combination of sourcing
current funding requirements with long term financing arrangements from financial institutions and
capital markets.
The tables below summarise the Group and Company’s financial liabilities at 31 December 2015 based on contractual undiscounted payments. Interest rates on variable rate loans have been based on the rates in effect at the year end.
Group
At 31 December 2015
On demand
Less than) 12 months
1 to 3 years
3 to 5 years
More than 5
years
Total
£m £m £m £m £m £m) Interest bearing loans and borrowings
- 497 1,249 470 - 2,216)
Derivative financial instruments
- 7 77 - - 84)
Payments under onerous contracts
-
30
29
12
11
82)
Trade and other payables - 1,635 - - - 1,635)
- 2,169 1,355 482 11 4,017)
At 31 December 2014
On demand
Less than) 12 months
1 to 3 years
Restated
3 to 5 years
Restated
More than 5
years
Total
Restated £m £m £m £m £m £m) Interest bearing loans and borrowings
- 63 1,288 970 - 2,321)
Derivative financial instruments
- 5 30 7 - 42)
Payments under onerous contracts
-
34
34
19
14
101)
Trade and other payables - 1,992 - - - 1,992)
- 2,094 1,352 996 14 4,456)
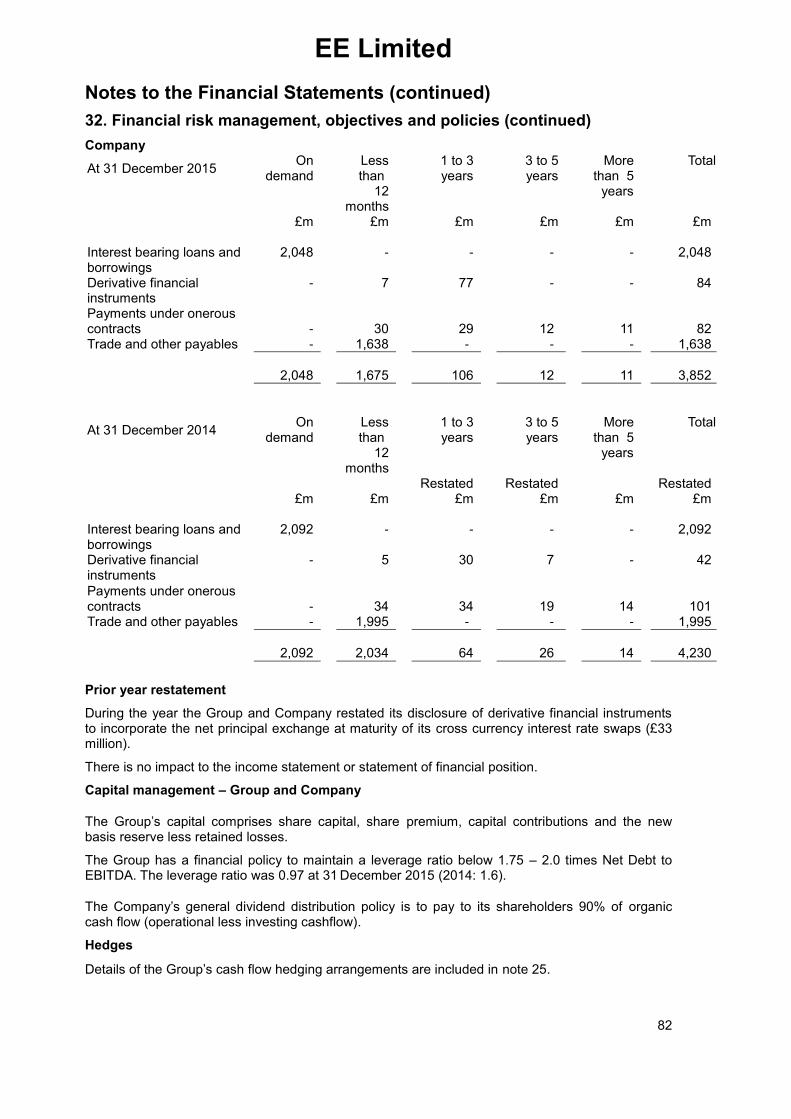
EE Limited
82
Notes to the Financial Statements (continued)
32. Financial risk management, objectives and policies (continued)
Company
At 31 December 2015
On demand
Less than)
12 months
1 to 3 years
3 to 5 years
More than 5
years
Total
£m £m £m £m £m £m) Interest bearing loans and borrowings
2,048 - - -) - 2,048)
Derivative financial instruments
- 7 77 -) - 84)
Payments under onerous contracts
-
30
29
12)
11
82)
Trade and other payables - 1,638 -) -) - 1,638)
2,048 1,675 106 12) 11 3,852)
At 31 December 2014
On demand
Less than)
12 months
1 to 3 years
Restated
3 to 5 years
Restated
More than 5
years
Total
Restated) £m £m £m £m £m £m) Interest bearing loans and borrowings
2,092 - - -) - 2,092)
Derivative financial instruments
- 5 30 7) - 42)
Payments under onerous contracts
-
34
34
19)
14
101)
Trade and other payables - 1,995 -) -) - 1,995)
2,092 2,034 64 26) 14 4,230)
Prior year restatement
During the year the Group and Company restated its disclosure of derivative financial instruments to incorporate the net principal exchange at maturity of its cross currency interest rate swaps (£33 million).
There is no impact to the income statement or statement of financial position.
Capital management – Group and Company
The Group’s capital comprises share capital, share premium, capital contributions and the new basis reserve less retained losses.
The Group has a financial policy to maintain a leverage ratio below 1.75 – 2.0 times Net Debt to EBITDA. The leverage ratio was 0.97 at 31
December 2015 (2014: 1.6).
The Company’s general dividend distribution policy is to pay to its shareholders 90% of organic cash flow (operational less investing cashflow).
Hedges
Details of the Group’s cash flow hedging arrangements are included in note 25.

EE Limited
83
33. Events after the reporting period
Group and Company
On 25 January 2016 the Company paid a further interim dividend of £263 million. No liability is recorded in the financial statements in respect of the interim dividend, because it was not approved at the balance sheet date. On 5 February 2015 BT Group plc agreed definitive terms to acquire the group EE Limited and its subsidiaries for a headline price of £12.5 billion. The transaction was subject to approval by the shareholders of BT Group plc, which was received on 30 April 2015, and merger clearance, in particular from the UK Competition and Markets Authority, which was received on 15 January 2016. The transaction completed 29 January 2016. The transaction does not trigger any repayment of debt.
On 29 January 2016 following completion of the BT acquisition, a number of transaction related bonus and settlement arrangements became payable.