ee 460 l communications - university of nevada, las vegas
TRANSCRIPT

DEPARTMENT OF ELECTRICAL AND COMPUTER ENGINEERING 1
EE 460 L COMMUNICATIONS
LABORATORY 7: BASE BAND DIGITAL COMMUNICATION
DEPARTMENT OF ELECTRICAL AND COMPUTER ENGINEERING
UNIVERSITY OF NEVADA, LAS VEGAS
1. OBJECTIVE & BACKGROUND
The goal of this experiment is to help understand how digital signals are aligned, encoded and
transmitted, and various approaches to implement that process.
2. COMPONENTS & EQUIPMENT
• TIMS set and configurable modules
• Multimeter, Function Generator, Oscilloscope and Power Supply
3. LAB DELIVERIES
PRELAB:
1. Go over the baseband encoding/decoding process in the following link.
• http://eelabs.faculty.unlv.edu/docs/labs/ee460L/BaseBandDigitalComm.pdf
LAB EXPERIMENTS:
1. ‘Snapshot’ display
Examine a SEQUENCE GENERATOR module, and read about it in the TIMS User Manual. A suitable
arrangement for the examination of a SEQUENCE GENERATOR is illustrated in Figure 5. Notice that the
length of the sequence is controlled by the settings of a DIP switch, SW2, located on the circuit board. See
the following (or Appendix) to this experiment for details.
EE 460L COMMUNICATIONS
DEPARTMENT OF ELECTRICAL AND COMPUTER ENGINEERING 2
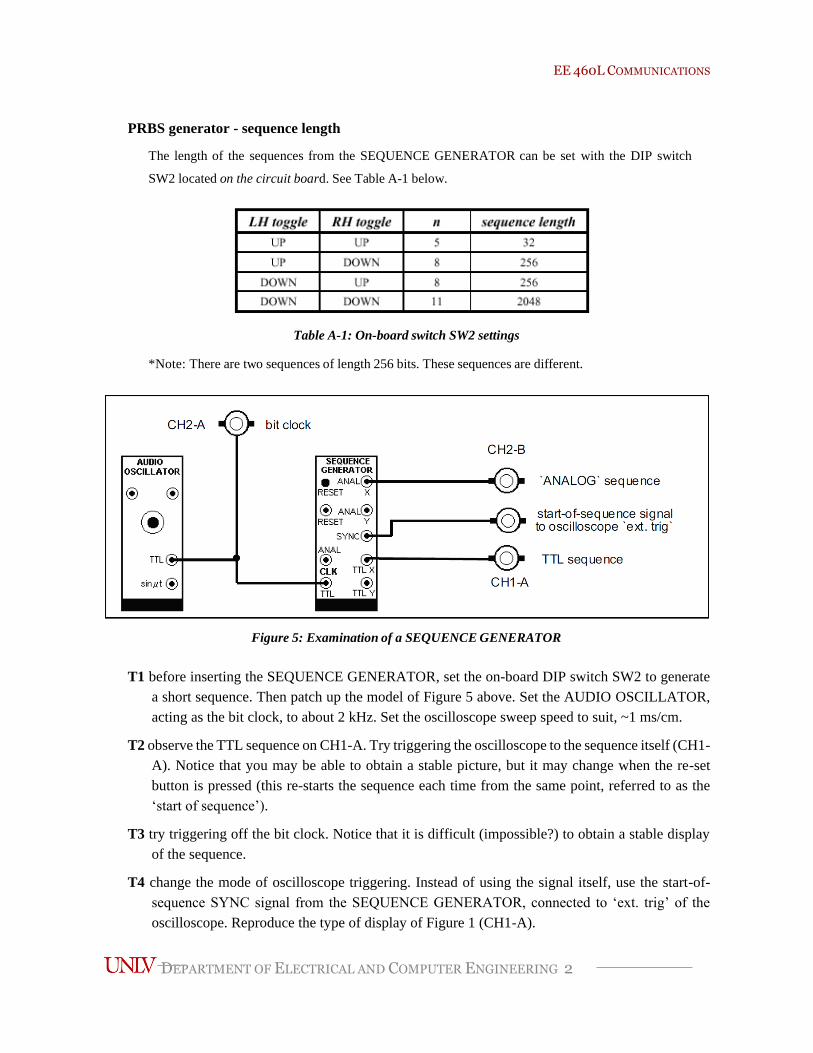
PRBS generator - sequence length
The length of the sequences from the SEQUENCE GENERATOR can be set with the DIP switch
SW2 located on the circuit board. See Table A-1 below.
Table A-1: On-board switch SW2 settings
*Note: There are two sequences of length 256 bits. These sequences are different.
Figure 5: Examination of a SEQUENCE GENERATOR
T1 before inserting the SEQUENCE GENERATOR, set the on-board DIP switch SW2 to generate
a short sequence. Then patch up the model of Figure 5 above. Set the AUDIO OSCILLATOR,
acting as the bit clock, to about 2 kHz. Set the oscilloscope sweep speed to suit, ~1 ms/cm.
T2 observe the TTL sequence on CH1-A. Try triggering the oscilloscope to the sequence itself (CH1-
A). Notice that you may be able to obtain a stable picture, but it may change when the re-set
button is pressed (this re-starts the sequence each time from the same point, referred to as the
‘start of sequence’).
T3 try triggering off the bit clock. Notice that it is difficult (impossible?) to obtain a stable display
of the sequence.
T4 change the mode of oscilloscope triggering. Instead of using the signal itself, use the start-of-
sequence SYNC signal from the SEQUENCE GENERATOR, connected to ‘ext. trig’ of the
oscilloscope. Reproduce the type of display of Figure 1 (CH1-A).
EE 460L COMMUNICATIONS
DEPARTMENT OF ELECTRICAL AND COMPUTER ENGINEERING 3
T5 increase the sequence length by re-setting the on-board switch SW2. Re-establish
synchronization using the start-of-sequence SYNC signal connected to the ‘ext. trig’ of the
oscilloscope. Notice the effect upon the display.
T6 have a look with your oscilloscope at a yellow analog output from the SEQUENCE
GENERATOR. The DC offset has been removed, and the amplitude is now suitable for
processing by analog modules. Observe also that the polarity has been reversed with respect to
the TTL version. This is just a consequence of the internal circuitry; if not noticed it can cause
misunderstandings!
2. Band limiting
The displays you have seen on the oscilloscope are probably as you would have expected them to be!
That is, either ‘HI’ or ‘LO’ with sharp, almost invisible, transitions between them. This implies that there
was no band limiting between the signal and the viewing instrument.
If transmitted via a low pass filter, which could represent a bandlimited (baseband) channel, then there
will be some modification of the shape, as viewed in the time domain.
For this part of the experiment you will use a TUNEABLE LPF to limit, and vary, the bandwidth.
Because the sequence will be going to an analog module it will be necessary to select an ‘analog’ output
from the SEQUENCE GENERATOR.
T7 select a short sequence from the SEQUENCE GENERATOR.
T8 connect an analog version of the sequence (YELLOW) to the input of a TUNEABLE LPF.
T9 on the front panel of the TUNEABLE LPF set the toggle switch to the WIDE position. Obtain
the widest bandwidth by rotating the TUNE control fully clockwise.
T10 with the oscilloscope still triggered by the ‘start-of-sequence’ SYNC signal, observe both the
filter input and output on separate oscilloscope channels. Adjust the gain control on the
TUNEABLE LPF so the amplitudes are approximately equal.
T11 monitor the filter corner frequency, by measuring the CLK signal from the TUNEABLE LPF
with the FREQUENCY COUNTER. Slowly reduce the bandwidth, and compare the difference
between the two displays. Notice that, with reducing bandwidth.
a) Identification of individual bits becomes more difficult
b) There is an increasing delay between input and output
Remember that the characteristics of the filter will influence the results of the last Task
3. Two generator alignment
In the next experiment entitled BER measurement in the noisy channel you will find out why it is
important to be able to align two sequences. In this experiment you will find out how to do it.
EE 460L COMMUNICATIONS
DEPARTMENT OF ELECTRICAL AND COMPUTER ENGINEERING 4
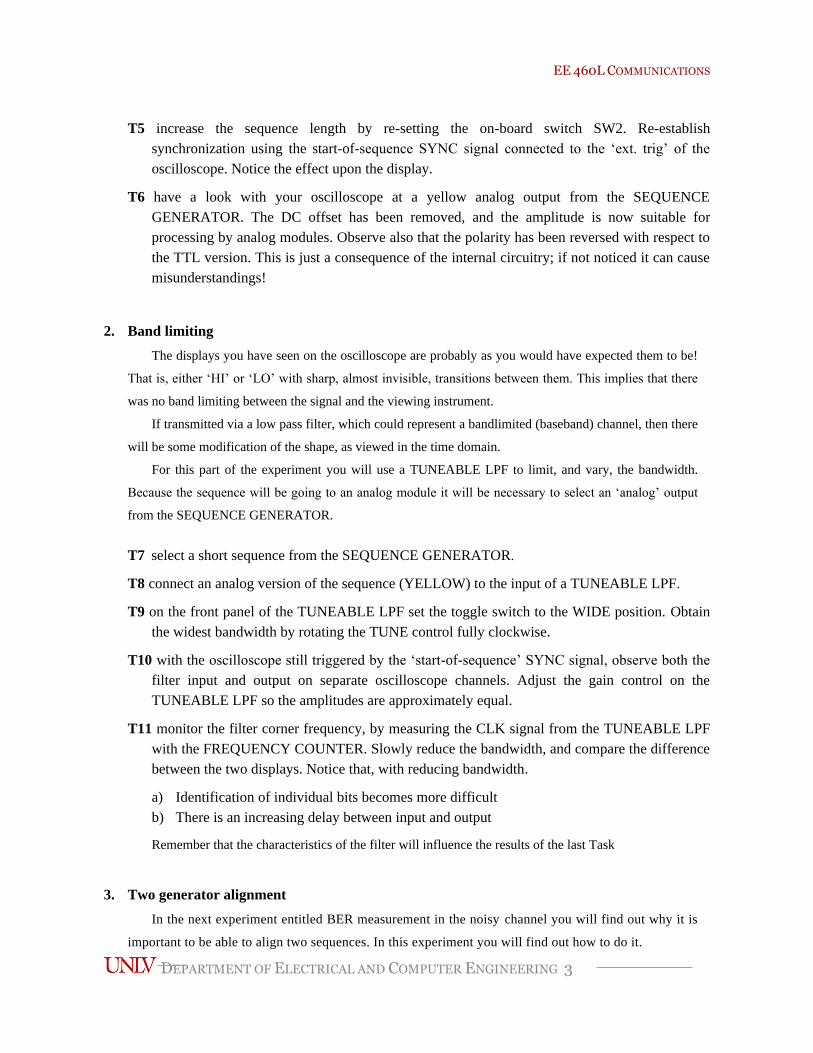
Two SEQUENCE GENERATOR modules may be coupled so that they deliver two identical,
aligned, sequences.
• that they should deliver the same sequence it is sufficient that the generator circuitry be identical
• that they be at the same rate it is necessary that they share a common bit clock
• that they be aligned requires that they start at the same time.
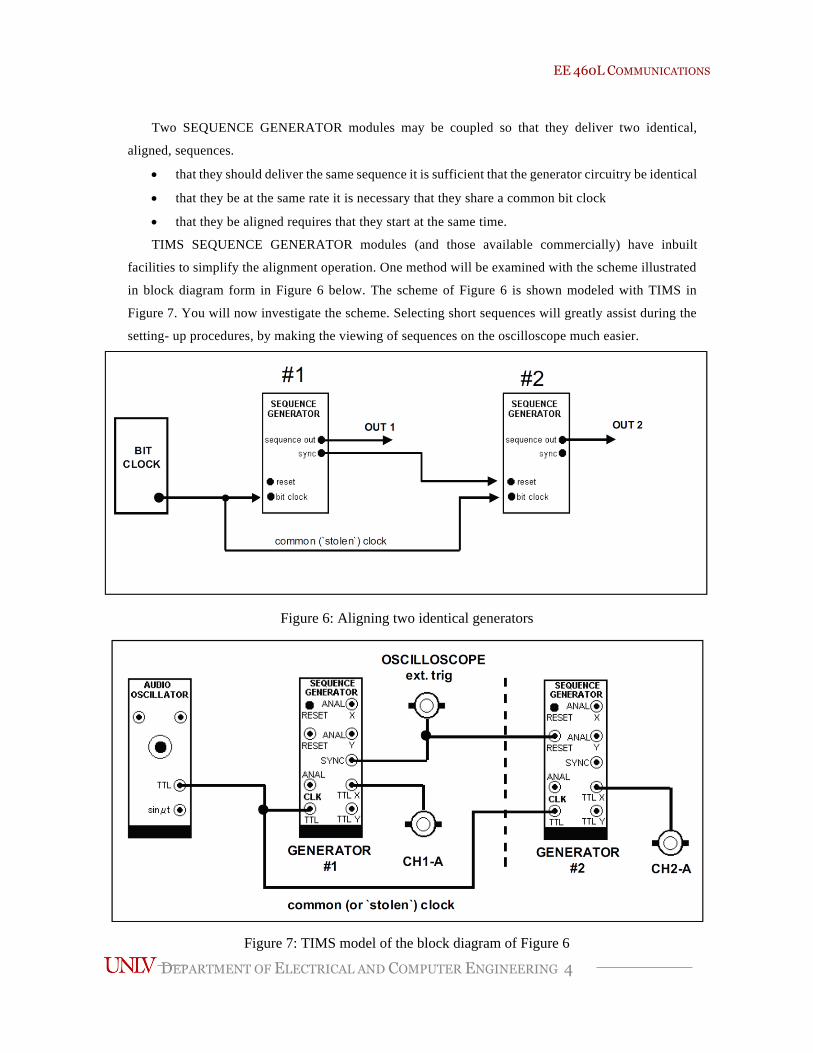
TIMS SEQUENCE GENERATOR modules (and those available commercially) have inbuilt
facilities to simplify the alignment operation. One method will be examined with the scheme illustrated
in block diagram form in Figure 6 below. The scheme of Figure 6 is shown modeled with TIMS in
Figure 7. You will now investigate the scheme. Selecting short sequences will greatly assist during the
setting- up procedures, by making the viewing of sequences on the oscilloscope much easier.
Figure 6: Aligning two identical generators
Figure 7: TIMS model of the block diagram of Figure 6

EE 460L COMMUNICATIONS
DEPARTMENT OF ELECTRICAL AND COMPUTER ENGINEERING 5
T12 before plugging in the SEQUENCE GENERATOR modules, set them both to the same short
sequence.
T13 patch together as above, but omit the link from the ‘GENERATOR #1’ SYNC to
‘GENERATOR #2’ RESET. Do not forget to connect the ‘start-of-sequence’ SYNC signal of
the GENERATOR #1 to the ‘ext. trig’ of the oscilloscope.
T14 press the ‘GENERATOR #2’ RESET push button several times. Observe on the oscilloscope
that the two output sequences are synchronized in time,but the data bits do not line-up correctly.
Try to synchronize the sequences manually by repeating this exercise many times. It is a hit-and-
miss operation, and is likely to be successful only irregularly.
T15 connect the SYNC of the ‘GENERATOR #1’ to the RESET of the ‘GENERATOR #2’. Observe
on the oscilloscope that the two output sequences are now synchronized in time and their data
are aligned.
T16 break the synchronizing path between the two generators. What happens to the alignment.
Once the two generators are aligned, they will remain aligned, even after the
alignment link between them is broken. The bit clock will keep them in step.
The above scheme has demonstrated a method of aligning two generators, and was seen to perform
satisfactorily. But it was in a somewhat over simplified environment.
What if the two generators had been separated some distance, with the result that there was a delay between
sending the SYNC pulse from GENERATOR #1 and its reception at GENERATOR #2?
The sequences would be offset by the time delay
In other words, the sequences would not be aligned.
4. Two sequence alignment
Except for the alternating pattern of ‘1’ and ‘0’ in the frame marker slot, you might have expected nothing
else in the frame (all zeros), because the input analog signal is at zero volts. But you do not now the coding
scheme.
1. One connection for the bit clock
2. Another connection for the start-of-sequence command
Consider a transmitter and a receiver separated by a transmission medium. Then:
1. There would be an inevitable transmission time delay
2. The two signal paths are not conveniently available
It may be difficult (impossible?) to align the two generators, at remote sites. But it is possible, and
frequently required, that a local generator can be aligned with a received sequence (from a similar generator).
The sliding window correlator is an example of an arrangement which can achieve this end.

EE 460L COMMUNICATIONS
DEPARTMENT OF ELECTRICAL AND COMPUTER ENGINEERING 6
Sliding window correlator
Consider the arrangement shown in block diagram form in Figure 8 below.
The detector is present to re-generate TTL pulses from the bandlimited received signal. We will assume
this regeneration is successful.
The regenerated received sequence (which matches, but is a delayed version of the transmitted sequence)
is connected to one input of a clocked X-OR logic gate.
The receiver PRBS generator (using a stolen bit clock in the example) is set to generate the same sequence
as its counterpart at the transmitter. Its output is connected to the other input of the clocked X-OR gate. The
clock ensures that the comparison is made at an appropriate instant within a bit clock period.
Figure 8 - Sliding window correlator
At each bit clock period there is an output from the X-OR gate only if the bits differ. In this case the
receiver generator will be RESET to the beginning of the sequence.
This resetting will take place repeatedly until there are no errors. Thus, every bit must be aligned. There
will then be no further output from the X-OR gate.
Once alignment has been achieved, it will be maintained
even when the RESET signal to the receiver generator is broken.
It is the common bit clock which maintains the alignment. Because of the nature of this X-OR comparison
technique the arrangement is called a sliding window correlator.
The patching arrangement to model Figure 8 is shown in Figure 9 below.

EE 460L COMMUNICATIONS
DEPARTMENT OF ELECTRICAL AND COMPUTER ENGINEERING 7
Figure 9: Modeling the sliding window correlator
T17 before patching up select the shortest length sequence on each SEQUENCE GENERATOR.
T18 patch together as above. Do not close the link from the X-OR output of the ERROR
COUNTING UTILITIES module to the RESET of the RECEIVER GENERATOR.
T19 view CH1-A and CH2-A simultaneously. The two output sequences are synchronized in time
but the data bits are probably not aligned. Press the RESET push button of the RECEIVER
GENERATOR repeatedly. Notice that once in a while it is possible to achieve alignment. With a
longer sequence this would be a rare event indeed.
T20 switch to CH1-B; observe the error sequence produced by the X-OR operation on the two data
sequences.
T21 now close the alignment link by connecting the error signal at the X-OR output to the RESET
input of the RECEIVER GENERATOR.
T22 confirm that the error sequence is now zero. Confirm that, if the RESET push button of the
RECEIVER GENERATOR is repeatedly pressed, the error signal appears for a short time and
then disappears.
T23 repeat the previous Task with a long sequence. Note that the system takes a longer time to
acquire alignment.
T24 having achieved alignment, disconnect the error signal from the RESET input of the RECEIVER
GENERATOR, and observe that the two sequences remain in alignment.

EE 460L COMMUNICATIONS
DEPARTMENT OF ELECTRICAL AND COMPUTER ENGINEERING 8
5. Eye pattern
T25 set up the model of Figure 10. The AUDIO OSCILLATOR serves as the bit clock for the
SEQUENCE GENERATOR. A convenient rate to start with is 2 kHz. Select CHANNEL #1. Select
a short sequence (both toggles of the on-board switch SW2 UP).
Figure 10: Viewing snap shots and eye patterns
T26 synchronize the oscilloscope to the ‘start-of-sequence’ synchronizing signal from the SEQUENCE
GENERATOR. Set the sweep speed to display between 10 and 20 sequence pulses (say 1 ms/cm).
This is the ‘snap shot’ mode. Both traces should be displaying the same picture, since CHANNEL
#1 is a ‘straight through’ connection.
The remaining three channels (#2, #3, and #4) in the BASEBAND CHANNEL FILTERS module
represent channels having the same slot bandwidth 3 (40 dB stop band attenuation at 4 kHz), but otherwise
different transmission characteristics, and in particular, different 3 dB frequencies. Graphs of these characteristics
are shown in Appendix.
You should also prepare a TUNEABLE LPF to use as a fourth channel, giving it a 40 dB attenuation at 4
kHz. To do this:
T27 using a sinusoidal output from an AUDIO OSCILLATOR as a test input:
a) Set the TUNE and GAIN controls of the TUNEABLE LPF fully clockwise. Select the NORM
bandwidth mode.
b) Set the AUDIO OSCILLATOR to a frequency of, say, 1 kHz. This is well within the current filter
passband.
c) Note the output amplitude on the oscilloscope.
d) Increase the frequency of the AUDIO OSCILLATOR to 4 kHz.
e) Reduce the bandwidth of the TUNEABLE LPF (rotate the TUNE control anti-clockwise) until the
output amplitude falls 100 times. This is a 40 dB reduction relative to the passband gain.

EE 460L COMMUNICATIONS
DEPARTMENT OF ELECTRICAL AND COMPUTER ENGINEERING 9
Snap-shot assessment
Now it is your task to make an assessment of the maximum rate, controlled by the frequency of the AUDIO
OSCILLATOR, at which a sequence of pulses can be transmitted through each filter before they suffer
unacceptable distortion. The criterion for judging the maximum possible pulse rate will be your opinion that you
can recognize the output sequence as being similar to that at the input.
It is important to remember that the four filters have the same slot bandwidth (i.e., 4 kHz, where the
attenuation is 40 dB) but different 3 dB bandwidths.
To relate the situation to a practical communication system you should consider the filters to represent the
total of all the filtering effects at various stages of the transmission chain, i.e., transmitter, channel, and the receiver
right up to the input of the decision device.
T28 record your assessment of the maximum practical data rate through each of the four channels.
At the very least your report will be a record of the four maximum transmission rates. But it is also interesting
to compare these rates with the characteristics of the filters. Perhaps you might expect the filter with the
widest passband to provide the highest acceptable transmission rate?
Eye pattern assessment
Now you will repeat the previous exercise, but, instead of observing the sequence as a single trace, you
will use eye patterns. The set-up will remain the same except for the oscilloscope usage and sequence length.
So far you have used a short sequence, since this was convenient for the snapshot display. But for eye
pattern displays a longer sequence is preferable, since this generates a greater number of patterns. Try it.
T29 change the oscilloscope synchronizing signal from the start-of-sequence SYNC output of the
SEQUENCE GENERATOR to the sequence bit clock. Increase the sequence length (both toggles
of the on-board switch SW2 DOWN). Make sure the oscilloscope is set to pass DC. Why? Try AC
coupling, and see if you notice any difference.
T30 select CHANNEL #2. Use a data rate of about 2 kHz. You should have a display on CH2-A similar
to that of Figure 11 below.
Figure 11: A ‘good’ eye pattern

EE 460L COMMUNICATIONS
DEPARTMENT OF ELECTRICAL AND COMPUTER ENGINEERING 10
Figure 12: Compare with Figure 11; A faster data rate
T31 increase the data rate until the eye starts to close. Figure 12 shows an eye not nearly as clearly
defined as that of Figure 11.
T32 take some time to examine the display, and consider what it is you are looking at! There is one
‘eye’ per bit period. Those shown in Figure 11 are considered to be ‘wide open’. But as the data
rate increases the eye begins to close.
The actual shape of an eye is determined (in a linear system) primarily by the filter (channel) amplitude
and phase characteristics (for a given input waveform). Timing jitter will have an influence too.
The detector must make a decision, at an appropriate moment in the bit period, as to whether or not the
signal is above or below a certain voltage level. If above it decides the current bit is a HI, otherwise a LO.
By studying the eye you can make that decision. Should it not be made at the point where the eye is wide
open, clear of any trace? The moment when the vertical opening is largest?
You can judge, by the thickness of the bunch of traces at the top and bottom of the eye, compared with the
vertical opening, the degree-of-difficulty in making this decision.
T33 determine the highest data rate for which you consider you would always be able to make the
correct decision (HI or LO). Note that the actual moment to make the decision will be the same for
all bits, and relatively easy to distinguish. Record this rate for each of the four filters.
You have now seen two different displays, the snapshot and the eye pattern.
It is generally accepted that the eye pattern gives a better indication of the
appropriate instant the HI or LO decision should be made, and its
probable success, than does the snapshot display. Do you agree?
Noise and other impairments will produce the occasional transition which will produce a trace within the
apparently trace-free eye. This may not be visible on the oscilloscope, but will none-the-less cause an error.
Turning up the oscilloscope brilliance may reveal some of these transitions.
Such a trace is present in the eye pattern of Figure 12.
An oscilloscope, with storage and other features (including in-built signal analysis!), will reveal even more
information.
It does not follow that the degradation of the eye worsens as the clock rate is increased. Filters can be
designed for optimum performance at a specific clock rate, and performance can degrade if the clock rate
is increased or reduced.
Theory predicts a maximum transmission rate of 2 pulses per Hz of baseband bandwidth available. On the
basis of your results, what do you think?

EE 460L COMMUNICATIONS
DEPARTMENT OF ELECTRICAL AND COMPUTER ENGINEERING 11
6. Line codes
Figure 13 shows a simplified model of Figure 3. There is no source encoding or decoding, no baseband
channel, and no detection. For the purpose of the experiment this is sufficient to confirm the operation of the
line code modules.
Figure 13: Simplified model of Figure 3
When a particular code has been set up, and the message successfully decoded without error, the BUFFER should
be included in the transmission path. By patching it in or out it will introduce a polarity change in the channel.
If there is no change to the message output, then the code in use is
insensitive to polarity reversals.
Note that the LINE-CODE DECODER requires, for successful decoding, an input signal of amplitude near the
TIMS ANALOG REFERENCE LEVEL (±2 volt p-p). In normal applications this is assured, since it will obtain
its input from the DECISION MAKER.
T34 Procedure
There are no step-by-step Tasks for you to perform. Instead, it is left to you to ensure that (in the
approximate order indicated):
1. You read the TIMS Advanced Modules User Manual for more details of the LINE-CODE
ENCODER and LINE-CODE DECODER modules than is included here.
2. You select a short sequence from the transmitter message source
3. At least initially you synchronize the oscilloscope to show a snapshot of the transmitter sequence.
Later you may be interested in eye patterns?

EE 460L COMMUNICATIONS
DEPARTMENT OF ELECTRICAL AND COMPUTER ENGINEERING 12
4. Examine each code in turn from the encoder, confirming the transformation from TTL is as
expected. On the other hand, and far more challenging, is to determine what the law of each
transformation is without help from a Textbook or other reference.
5. Of significant interest would be an examination of the power spectra of each of the coded signals.
For this you would need data capturing facilities, and software to perform spectral analysis.
Write down what you see and learn from these two modules.
Resetting of the LINE-CODE ENCODER and the LINE-CODE DECODER after the master clock is
connected, or after any clock interruption, is strictly not necessary for all codes. But it is easier to do it
for all codes rather than remember for which codes it is essential.
POSTLAB REPORT:
Include the following elements in the report document: Section Element
1 Theory of operation Include a brief description of every element and phenomenon that appear during the experiments.
2 Prelab report
1. None
3
Results of the experiments
Experiments Experiment Results
T1 ~ T34 Photos and screenshots of major steps in the experiment.
4
Answer the questions
Questions Questions
1 Why would a storage oscilloscope provide a more reliable eye pattern display?
2 Why introduce the complications of line encoding in a digital transmission system?
explain what is meant when two sequences are ‘synchronized’ and ‘aligned’
3 explain what is meant when two sequences are ‘synchronized’ and ‘aligned’
5 Conclusions Write down your conclusions, things learned, problems encountered during the lab and how they were
solved, etc.
6
Images Paste images (e.g. scratches, drafts, screenshots, photos, etc.) in Postlab report document (only .docx, .doc
or .pdf format is accepted). If the sizes of images are too large, convert them to jpg/jpeg format first, and
then paste them in the document.
Attachments (If needed) Zip your projects. Send through WebCampus as attachments, or provide link to the zip file on Google Drive
/ Dropbox, etc.
4. REFERENCES & ACKNOWLEDGEMENT
1. TIMS student experiment instruction manuals
2. http://eelabs.faculty.unlv.edu/docs/guides/TIMS_User_Manual.pdf

EE 460L COMMUNICATIONS
DEPARTMENT OF ELECTRICAL AND COMPUTER ENGINEERING 13
I appreciate the help from faculty members and TAs during the composing and revision of this
instruction manual. I would also thank students who provide valuable feedback so that we can
offer better higher education to the students.
5. APPENDIX
PRBS generator - sequence length
The length of the sequences from the SEQUENCE GENERATOR can be set with the DIP switch
SW2 located on the circuit board. See Table A-1 below.
Table A-1: On-board switch SW2 settings
*Note: There are two sequences of length 256 bits. These sequences are different.