edwards, john michael (2013) binding interactions of...
TRANSCRIPT

Edwards, John Michael (2013) Binding interactions of the mRNA regulator CELF1. PhD thesis, University of Nottingham.
Access from the University of Nottingham repository: http://eprints.nottingham.ac.uk/13453/1/JEdwards_ethesis.pdf
Copyright and reuse:
The Nottingham ePrints service makes this work by researchers of the University of Nottingham available open access under the following conditions.
This article is made available under the University of Nottingham End User licence and may be reused according to the conditions of the licence. For more details see: http://eprints.nottingham.ac.uk/end_user_agreement.pdf
For more information, please contact [email protected]

Binding Interactions of the mRNA Regulator
CELF1
By John Michael Edwards, MChem (Hons)
Thesis submitted to the University of Nottingham for the degree of
Doctor of Philosophy
September 2012

i
Abstract
CELF1 is an RNA binding protein with regulatory roles in translation, alternative
splicing and mRNA degradation. This protein is of particular interest as its
upregulation is believed to be involved in the pathogenesis of type 1 myotonic
dystrophy. CELF1 functions by binding to a specific sequence in the 3’
untranslated region of its target mRNAs. This sequence has been termed the
“EDEN” motif, but the exact requirements for binding of CELF1 were not well
defined. In this study we therefore aimed to determine the sequence requirements
for an RNA substrate to form a high affinity interaction with CELF1, and
characterise the structure of the resulting complex. The CELF1 protein is
composed of three structured RNA recognition motifs separated by flexible
linkers. Our strategy was to investigate the RNA binding properties of each
domain in isolation, and then the requirements for tandem binding of the domains
in order to build up the complete “EDEN” motif capable of forming a high
affinity complex with the wild type protein.
This has been accomplished using NMR spectroscopy to map the chemical shift
perturbations in each domain on binding to a range of RNA substrates. ITC was
also used to investigate the binding affinities of each domain, and the
enhancement of affinity when domains bind in tandem. By these methods we
have refined the sequence requirements for simultaneous binding of all domains
of CELF1, and designed RNA substrates which will bind with higher affinity than
any previously reported. We have also shown the potential involvement of RNA
secondary structure in forming the CELF1 binding site, and identified two
possible examples of this in natural mRNA targets.
CELF1 binding triggers deadenylation of its target mRNAs and this is suspected
to be via a mechanism involving recruitment of poly (A) ribonuclease. These two
proteins have been shown to interact, but no structural information was available
to show which domains were interacting, or whether CELF1 was capable of

ii
forming a ternary complex with both RNA and poly(A) ribonuclease. Since the
ribonuclease exists as a 146 kDa dimer, the complex of it with CELF1 was an
ambitious target for NMR. In this study we demonstrate that high resolution
NMR data can be acquired on this key regulatory complex. Using this we go on
to confirm the interaction between these two proteins, and that the domains
involved in binding suggest a ternary complex is possible.

iii
Acknowledgments
Firstly I would like to thank my supervisor Professor Mark Searle for introducing
me to this project, and for his constant support and encouragement throughout my
PhD. Thanks also go to Dr. Jonas Emsley and Dr. Cornelia de Moor both for their
earlier work on the CELF1 protein which made this project possible, and for
many useful discussions from their continuing investigations into this protein
system. Special thanks go to Dr. Emilie Malaurie for the original vectors
containing the CELF1 and t187 constructs, and for her advice and assistance
during the early stages of the project.
Special thanks go to Dr. Jed Long for his patience and time spent training me in
molecular biology and biophysical techniques. Thanks also go to Dr. Huw
Williams for his help with the NMR, computer systems and molecular modelling,
and to Dr. Neil Oldham for help with the mass spectrometry. I would also like to
thank Dr. Chan Li for his help in the collection of the SAXS data.
I thank the other members of the Searle group past and present both for their help
in the lab and for their friendship, in particular Jennifer Adlington, Liz Morris,
Tom Garner, Katherine Portman, Jonathon Phillips and Alex Cousins. I would
also like to thank two undergraduate project students, Joanne Bailey and Zoe Le
Gray-Wise, for their contributions. Thanks also go to everyone else in lab A20.
I would like to thank the BBSRC and the University of Nottingham for funding.
Finally I would like to thank my family, in particular my parents, for their support
throughout my PhD.

iv
Table of Contents
Acknowledgments ......................................................................................................... iii
Abbreviations ................................................................................................................ xi
1 Introduction ................................................................................................................ 1
1.1.1 Deadenylation ............................................................................................ 2
1.2 Structure of the CELF Proteins ........................................................................... 4
1.2.1 RNA Recognition Motifs ............................................................................. 4
1.2.2 Structure of CELF1 ...................................................................................... 6
1.2.3 NMR and X-ray Crystallography Data Available for CELF1 ......................... 7
1.3 Target RNA Sequences of CELF1 ....................................................................... 10
1.4 Link between CELF1 and Myotonic Dystrophy ................................................. 15
1.5 MBNL1 .............................................................................................................. 19
1.6 Dimerisation of CELF1 ...................................................................................... 19
1.7 Phosphorylation of CELF1 ................................................................................. 20
1.8 Interactions of CELF1 with Poly (A) Ribonuclease ............................................ 20
1.9 Aims and Objectives ......................................................................................... 21
2 Biophysical Techniques ............................................................................................ 23
2.1 Protein NMR ..................................................................................................... 23
2.1.1 Transverse Relaxation Optimized Spectroscopy (TROSY) ........................ 24
2.1.2 NMR Assignment of Proteins ................................................................... 25
2.1.3 Protein Backbone Assignment Using 3D Heteronuclear NMR Experiments
27
2.2 NMR Titrations ................................................................................................. 35
2.3 Isothermal Titration Calorimetry (ITC) ............................................................. 37
2.4 Small Angle X-ray Scattering ............................................................................. 42

v
2.5 Mass Spectrometry........................................................................................... 46
3 Materials and Methods ............................................................................................ 49
3.1 Protein Sequences ............................................................................................ 49
3.2 Sterilization ....................................................................................................... 51
3.3 Buffers .............................................................................................................. 52
3.4 Overnight Cultures ........................................................................................... 53
3.4.1 Glycerol Stocks ......................................................................................... 53
3.5 Overexpression ................................................................................................. 53
3.6 Sonication ......................................................................................................... 53
3.7 Metal Affinity Chromatography ....................................................................... 54
3.8 His-Tag Removal by Thrombin Cleave .............................................................. 56
3.9 Gel Filtration ..................................................................................................... 56
3.10 Desalting ........................................................................................................... 58
3.11 Storage and Stability ......................................................................................... 58
3.12 Production of Isotopically Labelled Protein ..................................................... 58
3.13 Test Growths .................................................................................................... 59
3.14 SDS-PAGE Gels .................................................................................................. 60
3.15 Molecular Biology ............................................................................................. 61
3.15.1 Plasmids .................................................................................................... 61
3.15.2 Site Directed Mutagenesis ........................................................................ 62
3.15.3 Cloning ...................................................................................................... 64
3.15.4 Restriction Digest...................................................................................... 64
3.15.5 Ligation ..................................................................................................... 66
3.15.6 Production of Deletion Constructs ........................................................... 66
3.15.7 Sequencing ............................................................................................... 68
3.15.8 Production of Calcium Competent Cells ................................................... 68
3.15.9 Transformation ......................................................................................... 69

vi
3.15.10 Agar Plates ............................................................................................ 69
3.15.11 Agarose Gels ......................................................................................... 70
3.16 NMR Acquisition ............................................................................................... 70
3.16.1 Data Analysis ............................................................................................ 71
3.16.2 Sample Preparation .................................................................................. 71
3.16.3 1D experiments ........................................................................................ 71
3.16.4 HSQC Experiments .................................................................................... 72
3.16.5 3D Experiments ........................................................................................ 72
3.16.6 15N Heteronuclear NOE ............................................................................. 76
3.16.7 Paramagnetic Relaxation Enhancement................................................... 76
3.17 X-ray Crystallography ....................................................................................... 77
3.18 Size Exclusion Chromatography ....................................................................... 78
3.19 SAXS .................................................................................................................. 78
3.20 ITC ..................................................................................................................... 79
3.21 Mass Spectrometry........................................................................................... 80
3.22 Molecular Modelling ........................................................................................ 80
4 RNA Interactions of the Isolated RRMs of CELF1 ..................................................... 84
4.1.1 Purification of RRM1 ................................................................................ 85
4.1.2 NMR Assignment of RRM1 ....................................................................... 86
4.1.3 Purification of RRM2 ................................................................................ 89
4.1.4 NMR Assignment of RRM2 ....................................................................... 91
4.1.5 Purification of RRM3 ................................................................................ 94
4.1.6 NMR Assignment of RRM3 ....................................................................... 95
4.2 Interaction of CELF1 RRMs with Guanine-Rich Elements ................................. 98
4.2.1 Interactions of RRM1 with Guanine-Rich Elements ................................. 99
4.2.2 Removal of one UGU site from the EDEN7 RNA Substrate .................... 108
4.2.3 Interactions of RRM2 with Guanine-Rich Elements ............................... 110

vii
4.2.4 RRM3 ...................................................................................................... 115
4.2.5 Summary of NMR Titrations with GRE Sequences ................................. 115
4.3 Interactions of CELF1 RRMs with CUG Repeat RNA Substrates ..................... 116
4.3.1 RRM1 ...................................................................................................... 117
4.3.2 Comparison of RRM1 Interaction with UGU and UGC Sites ................... 118
4.3.3 Interactions of RRM2 with CUG Repeat RNAs ........................................ 121
4.3.4 Summary of Interactions between the CELF1 domains and CUG Repeat
RNAs 124
4.4 Interaction of CELF1 RRMs with Adenosine-Rich Elements ........................... 124
4.4.1 RRM1 ...................................................................................................... 124
4.4.2 RRM2 ...................................................................................................... 125
4.5 Determination of Complex Stoichiometry by ESI Mass Spectrometry ........... 127
4.5.1 RRM1 ...................................................................................................... 127
4.5.2 RRM2 ...................................................................................................... 130
4.6 Conclusions ..................................................................................................... 132
5 Tandem RNA Binding of the two N-terminal Domains of CELF1 ............................ 134
5.1.1 Purification of a Construct of the N-terminal domains of CELF1 ........... 135
5.1.2 Comparison of the Isolated Domains and t187 Spectra ........................ 137
5.1.3 Assignment of the 15N TROSY Spectrum ................................................. 140
5.2 Interactions of the N-terminal Domains of CELF1 with Tandem UGU Sites in
Guanine Rich Elements ............................................................................................... 140
5.2.1 Interaction of the N-terminal Domains of CELF1 with the EDEN15 GRE.
142
5.2.2 Interaction of the N-terminal Domains of CELF1 with the EDEN11 GRE.
145
5.2.3 Interaction of the N-terminal Domains of CELF1 with the EDEN7 GRE. . 146
5.2.4 Systematic Investigation of Spacing Requirements for Tandem Binding of
the N-terminal domains of CELF1 ........................................................................... 149
5.2.5 Interaction of the N-terminal Domains of CELF1 with GRE Sequences .. 150

viii
5.3 Enhanced Affinity when Binding Multiple Domains of CELF1 in Tandem ...... 153
5.3.1 Dependence of Binding Affinity on the Separation between UGU Sites 157
5.4 Determining the Stoichiometry of Complexes with GRE Substrates by Mass
Spectrometry .............................................................................................................. 161
5.5 Investigation of Binding Affinity Enhancement in Tandem binding to UGC and
UAU Sites .................................................................................................................... 164
5.5.1 Tandem Binding to UGC Sites ................................................................. 165
5.5.2 Tandem Binding to Adenosine Rich Elements ........................................ 168
5.6 Investigating the Involvement of Unstructured Regions Flanking RRM1 and
RRM2 in RNA Binding ................................................................................................. 170
5.6.1 Evidence for Conformational Flexibility from 15N Heteronuclear NOEs . 171
5.6.2 Investigation of Involvement of the RRM2 C-Terminus Using an Extended
CELF1 Construct ...................................................................................................... 173
5.7 Summary of Cooperative Binding by the N-terminal Domains of CELF1 to RNA
targets 179
6 Optimal RNA Targets of Full Length CELF1 ............................................................. 181
6.1 Introduction .................................................................................................... 181
6.2 Purification of Wild Type CELF1...................................................................... 182
6.2.1 Production of a Stable Construct Containing all three Domains ............ 190
6.2.2 Production of Deletion Mutants Using a Single Step PCR ...................... 190
6.3 Expression and Purification of RRM123 ......................................................... 193
6.3.1 NMR Characterisation of RRM123 ......................................................... 195
6.3.2 15N Heteronuclear NOE ........................................................................... 197
6.4 Interactions of RRM123 with the EDEN11 GRE .............................................. 199
6.4.1 ITC of the EDEN11 GRE Binding to RRM123 ........................................... 202
6.5 CELF1 Recognition of the EDEN15 GRE .......................................................... 203
6.6 Design of a High Affinity EDEN Motif ............................................................. 206
6.6.1 NMR Studies of the EDEN-2U/4U Complex with RRM123 ..................... 207
6.6.2 Size Exclusion Chromatography ............................................................. 211

ix
6.6.3 RRM123 Binding to an RNA Substrate Containing a Hairpin Loop ......... 213
6.6.4 ITC of RRM123 Binding to EDEN-2U/4U and EDEN-2U/HL ..................... 215
6.6.5 Comparison of ITC Data shows Two Distinct Binding Schemes ............. 218
6.7 Refining the Criteria for an EDEN Motif ......................................................... 219
6.7.1 EDEN4U/2U ............................................................................................ 220
6.7.2 Involvement of RNA Secondary Structure in CELF1 Binding .................. 221
6.7.3 Determination of the Minimal Binding Sequence for CELF1 .................. 223
6.7.4 Investigation of a Two Domain Construct of RRM2 and RRM3 .............. 225
6.7.5 Summary of ITC Data for all RNA Substrates .......................................... 229
6.8 Conclusions ..................................................................................................... 230
7 Characterisation of a Complex of CELF1 with a High Affinity EDEN Motif ............. 231
7.1 Arrangement of the Domains on the RNA Substrate ..................................... 232
7.2 Modelling RRM123 in Complex with a High Affinity RNA Substrate .............. 234
7.3 Paramagnetic Relaxation Enhancement ........................................................ 238
7.3.1 Paramagnetic Relaxation Enhancement in RRM1 on binding to MTSL
Labelled UGUU ....................................................................................................... 240
7.3.2 PRE on labelling of the EDEN-2U/4U substrate with MTSL .................... 244
7.4 Small Angle X-ray Scattering ........................................................................... 247
7.4.1 Guinier Plots ........................................................................................... 247
7.4.2 Kratky Plots ............................................................................................. 248
7.4.3 Predicted Envelope ................................................................................. 249
7.5 Refining the Model ......................................................................................... 252
7.6 Conclusions ..................................................................................................... 253
8 CELF1 Phosphorylation and Interactions with Poly(A) Ribonuclease ..................... 254
8.1 Phosphorylation ............................................................................................. 254
8.2 Dimerisation of CELF1 .................................................................................... 260
8.3 Poly(A) Ribonuclease ...................................................................................... 261
8.4 Aims ................................................................................................................ 263

x
8.5 Expression and Purification of Poly(A) Ribonuclease ..................................... 263
8.6 NMR Studies of Poly(A) Ribonuclease ............................................................ 266
8.7 Interactions of CELF1 with Poly(A) Ribonuclease ........................................... 268
8.7.1 Isolation of the PARN RRM ..................................................................... 274
8.7.2 Supplementary Biophysical Techniques ................................................. 276
8.8 Conclusions ..................................................................................................... 277
9 Conclusions ............................................................................................................. 279
9.1 Future Work ................................................................................................... 284
10 References .......................................................................................................... 287
11 Appendix ............................................................................................................. 312
11.1 Primers ........................................................................................................... 312
11.2 NMR Assignments .......................................................................................... 313
11.2.1 RRM1 Wild Type Assignment ................................................................. 313
11.2.2 RRM1 S28D Assignment ......................................................................... 316
11.2.3 RRM2 Assignment .................................................................................. 319
11.2.4 RRM3 Assignment .................................................................................. 322

xi
Abbreviations
A: Adenine
AFM: Atomic Force Microscopy
ARE: A/U rich elements
BMRB: Biomagnetic Resonance Bank
BSA: Bovine Serum Albumen
bp: Base pairs
C: Cytosine
CELF1: CUGBP1 and Elav-Like Factor 1
CSP: Chemical Shift Perturbation
CUG-BP1: CUG repeat binding protein 1
DAN: Deadenylating Nuclease
DM1: Type 1 Myotonic Dystrophy
DM2: Type 2 Myotonic Dystrophy
DNA: Deoxyribonucleic Acid
DTT: Dithiothreitol
EDEN: Embryonic Deadenylation Element
EDEN-BP: Embryonic Deadenylation Element Binding Protein
EDTA: Ethylene Diamine Tetraacetic Acid
elav: Embryonic Lethality and Abnormal Visual system
ESI-MS: Electrospray Ionisation Mass Spectrometry

xii
G: Guanine
GRE: Guanine/Uridine Rich Element
HSQC: Heteronuclear Single Quantum Coherence
IMAC: Immobilised Metal Ion Affinity Chromatography
IPTG: Isopropyl thiogalactopyranoside
ITC: Isothermal Titration Calorimetry
kDa: KiloDaltons
LB: Luria Broth
M: Molar
MS: Mass Spectrometry
mRNA: Messenger RNA
MTSL: S-(2,2,5,5-tetramethyl-2,5-dihydro-1H-pyrrol-3-yl)methyl
methanesulfonothioate
MWCO: Molecular Weight Cutoff
NaCl: Sodium Chloride
NMR: Nuclear Magnetic Resonance
NOE: Nuclear Overhauser Effect
NOESY: Nuclear Overhauser Effect Spectroscopy
OD: Optical Density
PAGE: Polyacrylamide Gel Electrophoresis
PCR: Polymerase Chain Reaction
PDB: Protein Data Bank
PRE: Paramagnetic Relaxation Enhancement

xiii
RDC: Residual Dipolar Coupling
Rg: Radius of Gyration
RMSD: Root Mean Square Deviation
RNA: Ribonucleic Acid
RNP: Ribonucleoprotein Domain
rpm: Revolutions per minute
RRM: RNA Recognition Motif
SAXS: Small Angle X-Ray Scattering
SDS: Sodium Dodecyl Sulphate
TEMED: N,N,N,N-Tetramethylethylenediamine
Tm: Melting temperature
TOCSY: Total Correlation Spectroscopy
TROSY: Transverse Relaxation Optimized Spectroscopy
U: Uracil
UTR: Untranslated region
UV: Ultra Violet

xiv
Amino Acid Codes
Amino
Acid Name
3 Letter
Code
1
Letter
Code
Amino Acid
Name
3 Letter
Code
1
Letter
Code
Alanine Ala A Leucine Leu L
Arginine Arg R Lysine Lys K
Asparigine Asn N Methionine Met M
Aspartic
Acid
Asp D Phenylalanine Phe F
Cysteine Cys C Proline Pro P
Glutamine Gln Q Serine Ser S
Glutamic
Acid
Glu E Threonine Thr T
Glycine Gly G Tryptophan Trp W
Histidine His H Tyrosine Tyr Y
Isoleucine Ile I Valine Val V

1
1 Introduction
The CELF proteins are a family of RNA binding proteins with regulatory roles in
translation, alternative splicing and deadenylation. The term CELF stands for
CUG-BP and ETR-3-like factor, referring to earlier terms for the founder
members CELF1 and CELF2. Four additional members of this protein family
have been identified, based primarily on sequence similarity. Some of these
proteins had previously been grouped into the “Bruno-like” family of proteins,
named after a homologous protein in Drosophila, which was later determined to
be equivalent to the CELF family1, 2, 3, 4
. CELF proteins are found in most animals
and plants, but not in yeast or bacteria. The CELF family of proteins is divided
into two subfamilies: CELF1 - 2 and CELF3 – 6, with at least one protein from
each subfamily present in all plants and animals. All six CELF proteins are found
in humans. The focus of this study is on the CELF1 protein, which is of particular
interest due to its involvement in type 1 myotonic dystrophy (DM1)5. CELF1 was
originally identified as a human RNA binding protein by its ability to bind to a
(CUG)8 RNA substrate6, 7
and hence is referred to in most earlier work as CUG
binding protein 1 (CUG-BP1).
CELF1 was initially shown to be involved in the alternative splicing of mRNAs
in the nucleus8, 9,
10
. It was however noted to be found in both the nucleus and the
cytoplasm11
and so was suspected to have additional functions to regulating
alternative splicing which were dependent on its environment. These additional
functions were first identified in the Xenopus Laevis homolog of CELF1, which
was determined to cause rapid deadenylation of certain mRNAs when in the
cytoplasm. This homolog of the protein was therefore originally named EDEN-
BP (Embryonic Deadenylation Element – Binding Protein)12
. It was later
demonstrated to bind to a U/G rich sequence termed the “Embryonic
Deadenylation Element” or EDEN motif in the 3’ untranslated region of mRNAs.
This triggers deadenylation and translational repression of the mRNA, by a

2
mechanism which is believed to involve the recruitment of poly(A) ribonuclease
(PARN)13
.
1.1.1 Deadenylation
Almost all eukaryotic protein-encoding mRNAs have a poly (A) tail at the 3' end,
the structure of which is shown in Figure 1.1. When released from the nucleus
mRNAs have a uniform poly (A) tail length, which is about 250 nucleotides in
most mammals. Once in the cytoplasm different mRNAs are affected by a range
of deadenylases and regulatory proteins, resulting in variable length poly (A)
tails. The length of the poly (A) tail affects the susceptibility of the mRNA to
degradation, and hence the efficiency with which it is translated. Regulation of
gene expression is therefore achieved by regulation of the length of these poly
(A) tails14, 15, 16
.
Figure 1.1: Outline of the deadenylation process and its role in mRNA regulation. Top left is shown the
structure of a section of the poly(A) tail. To the right is shown the structure of a typical mRNA, with a
PABP bound to the poly(A) tail. If an RNA sequence recognised by CELF1 is present (the Embryonic
Deadenylation Element or EDEN motif), CELF1 can bind and triggers rapid shortening of the poly(A) tail.
The mechanism by which CELF1 triggers deadenylation has not been confirmed, but may involve
recruitment of poly(A) ribonuclease. Shortening of the poly(A) tail reduces the efficiency of the mRNA
translation, and increases its susceptibility to degradation.

3
The 3' ends of mRNAs are protected from degradation by exonucleases by poly
(A) binding proteins (PABPs)17
. Removal of these (or the 5' cap) is required for
degradation to occur18, 19
. These PABPs have also been determined to promote
recruitment of the small ribosomal subunit via an interaction with eukaryotic
translation initiation factor 4F (eIF4F), encouraging translational initiation20
.
Increasing the length of the poly (A) tail that the PABPs can bind to will therefore
increase the efficiency of the mRNA’s translation. Conversely shortening of the
poly (A) tail reduces the efficiency of its translation, as well as making the
mRNA more vulnerable to degradation.
In Xenopus, CELF1 was identified as a translational repressor, which functions
by binding to a specific motif in the 3’ untranslated regions of its target mRNAs.
CELF1’s target RNA motif was termed the “Embryonic Deadenylation Element”
or EDEN motif12, 21
. This binding event triggers rapid deadenylation, and hence
translational repression and degradation of the bound mRNA. Due to the
uncertainties in the sequence requirements for CELF1 binding the exact criteria
for an EDEN motif are not well defined, which prevents easy identification of all
mRNAs regulated by this protein. While an EDEN motif alone is sufficient for
deadenylation to occur, additional elements present in the 3’ UTR have been
reported to increase the efficiency of the process. Possible auxiliary elements
include a triply repeated AUU motif in the 3’ UTR of the mRNA or a repeating
AUUUA motif22
.
Human and Xenopus CELF1 have a very high degree of sequence conservation.
They have an 88% sequence identity overall, with an even higher degree of
conservation within the three structured domains of the protein. The two proteins
have been demonstrated to be functionally interchangeable, and hence the
additional role of human CELF1 as a deadenylation factor was identified23
. Based
on this it is presumed that these proteins are recognising the same mRNA
targets22
. Clarifying the nature of the EDEN motif is of particular interest, since
upregulation of CELF1 has been linked to type 1 myotonic dystrophy, and the

4
phenotype of this disease is believed to be at least partially due to the
misregulation of CELF1’s target mRNAs7, 24, 25, 26, 27
.
1.2 Structure of the CELF Proteins
All six members of the CELF family of proteins have the same overall domain
arrangement. The proteins each contain three structured domains, all of which are
RNA recognition motifs (RRMs). In the CELF proteins RRM1 and 2 are
generally located relatively close to the N-terminus of the protein, with a short
flexible linker between them. RRM3 is typically located near the C-terminus of
the protein, with between 180 and 220 residues of unstructured protein between it
and RRM2. This unstructured region has been termed the “divergent domain”, as
differences in it are used to divide the CELF family into the two subfamilies.
It was unclear whether the “divergent domain” linking RRM2 and RRM3 plays
any direct role in binding to the RNA, or whether it simply allows the RRMs
sufficient freedom of movement relative to each other to adopt the appropriate
conformation for binding. Deletion of this linker region in CELF1 has been
reported to result in a loss of RNA binding in a yeast three-hybrid assay, but the
construct used not only removed the linker, but also significantly truncated the
adjacent RRM2 and RRM3 domains28, 29
. The resulting disruption to the fold of
these two structured domains may therefore be responsible for the reported loss of
binding, rather than the removal of the RRM2 – RRM3 linker itself.
1.2.1 RNA Recognition Motifs
RNA Recognition Motifs (RRMs) are one of the most abundant classes of protein
domains in eukaryotes. They are also known as RNA binding domains (RBDs) or
ribonucleoprotein domains (RNPs). RRMs are also found in prokaryotes but they
are rarer, and prokaryotic proteins generally do not contain multiple RRMs30
. In

5
contrast almost half of those eukaryotic proteins containing an RRM have
multiple RRM domains, with as many as six in a single protein31
. There are
around 500 human proteins which are currently known to contain at least one
RRM32
. The number of nucleotides that can be recognised by an individual RRM
varies, with examples known that bind as few as two33, 34, 35
, and as many as
eight36
. Multiple RRMs working in combination allow longer RNA sequences to
be recognised, and can dramatically increase the overall binding affinity into the
nanomolar range37, 38
.
The classic RRM protein fold consists of a four-stranded antiparallel beta-sheet
packed against two alpha helices. The overall topology is β1 - α1 - β2 - β3 - α2 -
β4. The first and third strands of the beta sheet contain highly conserved aromatic
residues, which usually form key parts of the binding surface for the RNA by
stacking interactions with the RNA bases39, 40
. There are some known variations
on the classic RRM fold, such as the addition of a third alpha helix at the N or C
terminus of the domain. The N and C-terminal regions of RRMs are generally
unstructured, but can still play a role in binding the RNA by folding over the
exposed side of the RNA strand and holding it in place against the beta sheet31, 41,
42, 43
Despite their name RRMs are not always restricted to interacting with RNA and
can also be involved in binding DNA44
, and in protein - protein interactions45
. In
some cases this competes with, or completely prevents conventional interactions
of the RRM with RNA by obstructing the normal binding surface. There are
however known examples of RRMs which can bind to both proteins and RNA
simultaneously due to the interactions occurring via different binding surfaces.

6
1.2.2 Structure of CELF1
Human CELF1 has the same basic arrangement of three RRMs as the other CELF
family members. RRM1 and 2 are located near the N-terminus of the protein,
separated by approximately 8 residues of relatively unstructured linker. RRM3 is
near the C-terminus of the protein, separated from RRM2 by around 215 residues,
which are believed to be completely unstructured. Human CELF1 is a 486 amino
acid protein with a total mass of 52.1 kDa. The Xenopus Laevis homolog has an
additional three amino acids in the flexible linker between RRM2 and RRM3,
increasing the total mass to 52.7 kDa. The exact arrangement of the RRMs is
shown in Figure 1.2.
Figure 1.2: Arrangement of the RRMs in the CELF1 protein sequence. Numbers indicate the approximate
limits of the structured regions.
In general RRMs have two major conserved regions, which have been termed
RNP1 (in β-strand 3) and RNP2 in β-strand 146, 47
. RNP1 is defined as: K/R – G –
F/Y – G/A – F/Y -V/I/L – X – F/Y, where X is any amino acid. RNP2 is defined
as I/V/L – F/Y – I/V/L – X – N – L. These RNP1 and 2 motifs are to some extent
conserved in all three RRMs of CELF1, but there are some notable deviations
from the normal pattern of residues.
RNP2: I/V/L – F/Y – I/V/L – X – N – L
RRM1: M – F – V – G – Q – V

7
RRM2: L – F – I – G – M – I
RRM3: L – F – I – Y – H - L
RNP1: K/R – G – F/Y – G/A – F/Y -V/I/L – X – F/Y
RRM1: K – G – C – C – F – V – T – F
RRM2: R – G – C – A – F – V – T – F
RRM3: K – C – F – G – F – V – S – Y
RRM1 and RRM2 in particular show significant differences in these regions, as
one of the key conserved aromatic residues is missing. The first aromatic residue
in RNP1 has been replaced with a cysteine, which is conserved between RRM1
and RRM2. A phenylalanine residue is however present at this position in RRM3.
RRM3 also has an additional tyrosine residue in the RNP2 region, as opposed to a
conserved glycine residue in RRM1 and RRM2. These additional aromatic
residues permit different potential stacking interactions with the RNA bases, and
so RRM3 may have distinct differences in interactions with RNA compared to the
other two domains. One other deviation from the classic RNP regions is the lack
of a conserved asparigine in RNP2, which is the case for all the three RRMs.
1.2.3 NMR and X-ray Crystallography Data Available for CELF1
Structural data for some domains of CELF1 had already been published prior to
this study, and additional NMR and x-ray crystallography data appeared during
its course. In 2004, Jun et al. published NMR assignments and a solution
structure for the N-terminal region of CELF1, specifically residues 14 - 187 of the
human CELF1 protein incorporating the whole of RRM1 and RRM248
. The

8
structures of these domains are shown in Figure 1.3. In 2009 Tsuda et al.
published NMR solution structures of an isolated RRM3 construct (residues 377 -
480), both unbound and in complex with the RNA substrate UGUGUG49
. Shown
in Figure 1.4 are their NMR solution structures for RRM3 in isolation, and in
complex with the RNA sequence UGUGUG. (PDB ID: 2CPZ and 2RQ4)
Figure 1.3: Structure of the N-terminal domains of CELF1 by Jun et al. (PDB ID: 2DHS). RRM1 on is on the
left, RRM2 on the right. The similarities in the fold of each domain can be seen. Given the high level of
sequence conservation between them it is expected that the structure of the CELF1 domains is the same
in homologous proteins, such as in Xenopus Laevis. This image was produced using the program
MOLMOL50
.
9
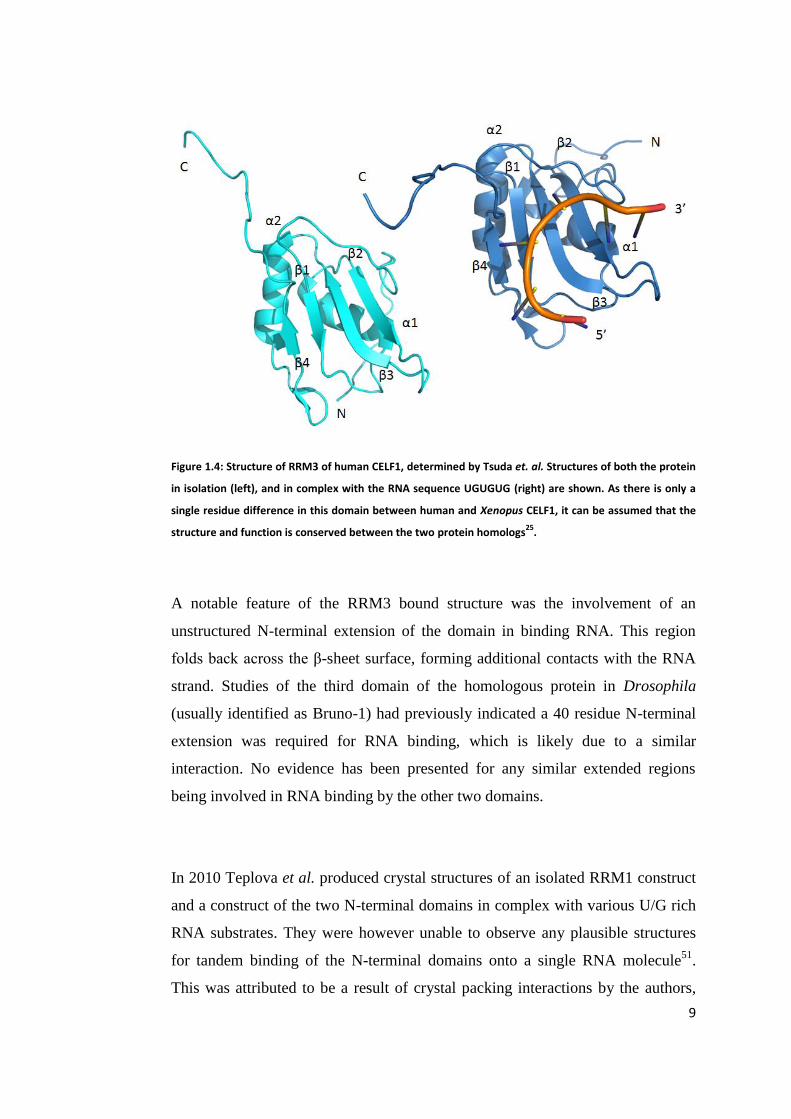
Figure 1.4: Structure of RRM3 of human CELF1, determined by Tsuda et. al. Structures of both the protein
in isolation (left), and in complex with the RNA sequence UGUGUG (right) are shown. As there is only a
single residue difference in this domain between human and Xenopus CELF1, it can be assumed that the
structure and function is conserved between the two protein homologs25
.
A notable feature of the RRM3 bound structure was the involvement of an
unstructured N-terminal extension of the domain in binding RNA. This region
folds back across the β-sheet surface, forming additional contacts with the RNA
strand. Studies of the third domain of the homologous protein in Drosophila
(usually identified as Bruno-1) had previously indicated a 40 residue N-terminal
extension was required for RNA binding, which is likely due to a similar
interaction. No evidence has been presented for any similar extended regions
being involved in RNA binding by the other two domains.
In 2010 Teplova et al. produced crystal structures of an isolated RRM1 construct
and a construct of the two N-terminal domains in complex with various U/G rich
RNA substrates. They were however unable to observe any plausible structures
for tandem binding of the N-terminal domains onto a single RNA molecule51
.
This was attributed to be a result of crystal packing interactions by the authors,

10
rather than any inherent problem with binding both domains simultaneously to
the RNA substrates in solution. Teplova et al. also reported attempts to model the
tandem binding of the two N-terminal domains by analogy to the known
structures of HuD and PABP. These proteins have similar pairs of RRMs
separated by comparable flexible linkers of 10 – 12 residues, but have two
distinct binding modes. When PABP binds the two RRMs are arranged side by
side, allowing the β-sheets to form a relatively flat surface with the RNA
substrate bound across it in a linear arrangement. In contrast in HuD the RRMs
are rotated with respect to each other, introducing a sharp turn into the RNA
backbone. Plausible models of the N-terminal domains of CELF1 bound to the
RNA substrate could be constructed for either arrangement due to the flexibility
of both the linker between the domains, and the spacer between their target sites
in the RNA sequence. It was concluded that more data was required on the
tandem binding of the domains to distinguish between these models.
The region of the protein between residues 187 and 385 (the “divergent domain”)
has no NMR or x-ray crystallography data available, but is believed to be
completely unstructured. There is also no structure incorporating more than two
of the three CELF1 domains, and so no information as to how RRM3 might work
together with the N-terminal domains in order to recognise the RNA substrate.
1.3 Target RNA Sequences of CELF1
CELF1 has been shown to interact with three distinct types of RNA sequence:
UG rich elements28
, CUG repeats52
and AU rich elements53, 54
. While a (CUG)8
probe was the first RNA sequence identified to bind to CELF1, UG rich
sequences, in particular those containing UGU trinucleotides, were later found to
bind with a much higher affinity29, 55
. Isothermal titration calorimetry conducted
by Tsuda et al. on RRM3 in isolation showed a strong preference for UG repeats

11
over CUG or AU repeats, the latter two showing no significant interaction49
. The
reported interactions of CELF1 with CUG and AU repeats must therefore involve
one or both of the N-terminal domains of the protein. The comparison of the
residues in the RNA binding surfaces of each RRM of CELF1 showed that
RRM3 is the most distinct of the three domains, with two additional aromatic
residues. It would therefore not be surprising if its preferred target sequences
were also distinct.
Some natural mRNA sequences have been empirically determined to be targets of
CELF1 by observation of binding to the protein, and subsequent deadenylation
and translational repression of the mRNA in a reporter assay. In 2006 Moraes et
al. reported that sections of the RNAs TNFα and c-fos were capable both of
binding to CELF1, and inducing rapid shortening of an attached poly(A) tail
suggesting that these sequences contain functional EDEN motifs56
. These
sequences are however 250 bases in length, and the size of the RNA binding
surfaces of CELF1 means that only a small section of these sequences can
possibly be being recognised. Both RNAs contain multiple UGUX sites, with
eight in TNFα and nine in c-fos. This is higher than would be expected for a
randomly generated RNA sequence, which would average 2.9 of these sites in
250 bases. The authors tentatively suggested the section near the start of the c-fos
sequence: UGUUCAUUGUAAUGUU as a possible binding site for CELF1 as it
contains three of these UGUX sites in close proximity, one for each RRM.

12
Figure 1.5: RNA sequences of known CELF1 targets c-fos, c-mos and TNFα.. UGU(U/G) sites are
highlighted, as are A/U rich regions which have been reported to increase deadenylation efficiency.
Sequences reproduced from Moraes et al. 2006.56
In TNFα by comparison the UG rich regions are scattered and the shortest section
incorporating three UGUX sites is more than 40 nucleotides in length. It is
therefore unclear how the three RRMs of CELF1 are recognising this sequence. A
possibility considered was that some secondary structure is present in this
sequence which can bring distant UGU sites into close proximity allowing a
single CELF1 protein to bind to them.
In 2008 Graindorge et al. carried out an analysis of mRNAs which were co-
purified with CELF1 from Xenopus cells. More than 150 associated RNAs were
identified, and a UGUX repeat was found to be the most highly conserved
feature. The sequence UGUUUGUUUGUUUGU (which was termed EDEN15)
was identified as a consensus sequence. The fourth UGU site and the nucleotides
separating the UGU sites were somewhat less conserved than the rest of the

13
sequence57
. Also in 2008 Vlasova et al. identified the consensus sequence
UGUUUGUUUGU as a possible CELF1 binding site, which was commonly
present in short lived mRNAs58, 59
. In 2010 Rattenbacher et al. reported further
studies of human CELF1 mRNA targets, producing a consensus sequence of
UGUGUGUGUGU, with some flexibility for G -> U substitution between UGU
sites60
. These three sequences are all consistent with CELF1 targeting a repeating
UGU motif, with the nucleotides separating the UGU sites being of lesser
importance. The 11 nucleotide sequence UGUUUGUUUGU has therefore been
proposed as a functional EDEN motif, and has been termed the “Guanine Rich
Element” (GRE) 57-58
.
A limitation of these analyses is that they only demonstrated that the GRE and
similar sequences were being bound by at least some of the domains of CELF1,
not that they were sufficient to trigger deadenylation and hence translational
repression when present in an mRNA. Both Vlasova et al. and Rattenbacher et al.
demonstrated that certain RNA sequences containing the GRE trigger
deadenylation, and so represent functional EDEN motifs. However the GRE was
only a small part of these sequences which in all cases were at least 50
nucleotides in length, and contained additional UGU sites outside of the GRE.
Figure 1.6: These are the RNA sequences which were shown to trigger deadenylation in these two
studies, and so must contain functional EDEN motifs. All of them contain a GRE and/or an extended UG

14
repeating region. Mutation of the central G in all UGU trinucleotides to C was demonstrated to render
the EDEN motif non-functional for all of the sequences except PPIC-GU, where these mutations were not
conducted.
In Figure 1.6 are shown the complete sequences which were demonstrated to
contain functional EDEN motifs in these two studies. While each does contain
either the GRE or a lengthy UG repeat, there are a minimum of six possible UGU
sites in each sequence. There is also a wide range of possible spacing between
UGU sites, and no indication which sites are being occupied by the three domains
of CELF1. There was therefore insufficient evidence to conclude that the GRE
alone was sufficient for binding of all three domains of CELF1, or to serve as a
functional EDEN motif capable of triggering deadenylation. An extended version
of the c-jun sequence had previously been shown to be a functional EDEN motif
in Xenopus22
.
During the course of this study Teplova et al. reported crystal structures showing
that both RRM1 and RRM2 were capable of recognising the RNA sequence
UGUU. If the EDEN11 GRE sequence is capable of binding all three domains of
CELF1 simultaneously, then at least one of the three domains would have to be
binding to a UGU site rather than a UGUU site. Their model of the tandem
interaction of the N-terminal domains also highlighted the importance of the
spacing between the binding sites of each domain. Depending on whether a
domain was recognising a UGU or a UGU(U/G) site, it would have only a single
nucleotide, or no spacer at all between it and the neighbouring binding site on the
GRE substrate. These short or non-existent spacers between the binding sites
seemed likely to result in steric clashes between the RRMs. To predict whether
any given sequence can bind CELF1 it was therefore important to clarify not only
the minimum site required for each domain to bind, but also the spacing between
the sites that would permit the domains to bind in tandem.
Proposed EDEN Motif RNA Sequence

15
c-fos ARE56
UGUUCAUUGUAAUGUU
EDEN1557
UGUUUGUUUGUUUGU
EDEN11 GRE58
UGUUUGUUUGU
UG Repeat60
UGUGUGUGUGU
Table 1-1: This table shows short RNA sequences which have been proposed as EDEN motifs. The
underlined nucleotides are suggested to be critical to binding, with the nucleotides separating them
being less conserved. While longer sequences containing these motifs have been demonstrated to trigger
deadenylation, it has not been shown that any of these alone are sufficient to function as an EDEN motif.
They may therefore represent only part of the minimum EDEN motif. While all have been demonstrated
to bind CELF1, no structural data has been published to show whether this is involving simultaneous
binding of all three RRMs, or only a subset of them.
1.4 Link between CELF1 and Myotonic Dystrophy
Myotonic dystrophy type 1 (DM1), also known as Steinert's disease, is the most
common form of muscular dystrophy, affecting around 1 in 8000 people. The
major symptoms are progressive muscle atrophy, myotonia (an inability to relax a
contracted muscle) and cardiac conduction defects61
. At a molecular level
misregulation of alternative splicing of some mRNAs has been observed in cases
of DM1. Incorrect splicing patterns have been found in more than 20 different
mRNAs in DM1 tissues, mostly in skeletal muscle and the brain. These include
the mRNAs for the insulin receptor, the tau protein and the CLC-1 muscle
chloride channel. Not all of these mis-spliced mRNAs have been correlated with
the symptoms of DM1, though the mis-splicing of the CLC-1 mRNA is
associated with myotonia. In CLC-1 exon 7a is inappropriately incorporated,
which results in a truncated and non-functional form of the CLC protein62, 63
.
Overexpression of CELF1 in mouse models reproduces these splicing defects, as
well as the other features of the DM1 phenotype64, 65, 66
. Correction of the CLC-1
splicing defect in a mouse model with a myotonic phenotype restored normal
chloride transport and hence normal function67
.

16
DM1 is an inherited disorder, caused by an expanded region of CUG repeats in
the 3' UTR of the dystrophia-myotonica protein kinase gene (DMPK) of
chromosome 1968, 69, 70, 71, 72, 73
. Healthy individuals have been observed to have
up to 38 repeats of CUG at this position. Symptoms of DM1 have been observed
in individuals with as few as 50 repeats, and cases with more than 4000 CUG
repeats are known. There is a strong correlation between the number of repeats
and the severity of the DM1 symptoms74, 75
. The age of onset of DM1 is also
strongly correlated to the number of repeats76
. The most severe and early onset
form of the disease is associated with a minimum of 1500 repeats. The number of
these repeats is unstable, and can increase through generations77
. Type 2
myotonic dystrophy (DM2) has similar symptoms to DM1, but is caused by an
expanded CCUG repeating motif in the unrelated ZNF9 gene78, 79
. Between 100
and 11000 CCUG repeats have been observed in DM2 cases.
In both DM1 and DM2 these expanded RNAs form aggregates in the nucleus, and
it has been concluded that the symptoms of the disease are a result of the presence
of these mutant RNAs, rather than effects directly related to the DMPK and ZNF9
genes80, 81
.
Antisense transcripts, consisting of a CAG repeating sequence may also be
expressed in DM1 cells. Expression of long CAG repeating RNAs has been
shown to induce toxicity in animal models82, 83
. Both the sense and antisense
transcripts also have the potential to undergo non-ATG initiated transcription,
resulting in the production of long chains of a single amino acid type
(polyglutamine and polyleucine)84
. These would be expected to aggregate, giving
another possible source of cellular toxicity85, 86
. Polyglutamine aggregates have
been observed in DM1 tissues, so may play some role in the disease pathogenesis.

17
The expanded RNAs are not exported from the nucleus to the cytoplasm, instead
aggregating into insoluble foci. Electron microscopy and crystallography have
shown that the extended CUG repeats of DM1 form stable hairpin structures.
These are composed of normal Watson-Crick base pairing between C and G bases
separated by mismatched U-U pairs87, 88
. While CELF1 is known to bind at least
with a low affinity to long CUG repeating sequences, it has not been detected in
these foci. The RNA splicing protein muscle blind-like (MBNL1) has been found
to bind to the double stranded sections of these RNAs, and is sequestered into the
foci89, 90
. This has lead to the hypothesis that CELF1 is not involved in binding to
these CUG repeat RNAs in vivo at all and so is not directly involved in DM1
pathogenesis, but this is inconsistent with the observed effects of CELF1
upregulation in mouse models. It has however been found that very short CUG
RNAs do not form foci but still result in the DM1 phenotype, suggesting the foci
are a symptom rather than a direct cause of DM1. The possibility that the foci
only contain a fraction of the CUG RNAs has been raised to explain this
observation91
. If this is the case then direct binding of CELF1 to extended CUG
RNAs may be occurring, and playing a role in DM1 pathogenesis.
This theory is supported by size exclusion chromatography of CELF1 extracts
from DM1 cells, which give an apparent molecular weight for the protein in
excess of 150 kDa. This is in contrast to the protein from wild type cells with a
mass of just over 50 kDa, and was found to be sensitive to the presence of
RNases indicating this shift is due to binding to a long RNA sequence91
. Almost
all of the CELF1 protein in DM1 cells was found to be in the form of this RNA
complex. CELF1 has been shown to be incapable of binding to double stranded
RNA in vitro. Electron microscopy of CUG RNA hairpins showed CELF1 would
only bind to single stranded sections at the ends of the hairpin, not to the double
stranded stem92
. It can be hypothesized that binding to MBNL1 encourages
formation of double stranded RNA, displacing CELF1. This would account for
the complete absence of CELF1 in the insoluble foci, despite it being almost
saturated by soluble non-focus CUG RNA.

18
CELF1 and MBNL1 appear to be antagonistic proteins. Sequestering of MBNL1
in the insoluble foci effectively results in increased CELF1 activity. The half-life
of CELF1 is normally quite short (estimated at 3 hours in vivo), but is likely to be
increased by up to a factor of five by binding to the longer lived single stranded
CUG RNA93
. It has been suggested that CELF1 upregulation in DM1 is due to
the protein being hyperphosphorylated by protein kinase C (PKC) and hence
stabilized94
. The mechanism of this PKC activation is unknown, and it is possible
that PKC upregulation is an effect of CELF1 upregulation rather than a cause.
A recent paper by Masuda et al. (2012) suggests a more direct mechanism for
CELF1 upregulation in DM1 cells. In cross-linked immunoprecipitation assays
with CELF1 and MBNL1, they note that the CELF1 mRNA appears to have an
MBNL1 target site in its 3’ untranslated region (UTR). They also noted a possible
CELF1 target (or EDEN motif) in the 3’ UTR of the MBNL1 mRNA. Since both
of these proteins ultimately trigger the degradation, and hence repression of their
target mRNAs, this implies that CELF1 and MBNL1 directly regulate each other.
When MBNL1 is sequestered by the expanded CUG repeat RNA in DM1 cells,
this will reduce its repression of its target mRNAs, including CELF1. CELF1 will
therefore be upregulated, even without any extension of its half life via
phosphorylation, or binding to soluble CUG RNAs. Hyperphosphorylation by
PKC may be exacerbating the condition by stabilizing the already elevated levels
of CELF1, but this may not be the direct cause it was originally thought to be.
This has implications for the treatment of DM1. Potential therapies for DM1 have
so far focused on disruption of the MBNL1/CUG repeat RNA interaction95, 96, 97
.
This mutual regulation suggests that if CELF1 could be sequestered or otherwise
inactivated, it should not only restore normal splicing patterns, but also
upregulate MBNL1 directly. CELF1 therefore represents a potential drug target
for treatment of DM1.

19
1.5 MBNL1
Muscle Blind-Like 1 (MBNL1) is an RNA binding protein known to regulate
alternative splicing of mRNA. It has recently been reported to also be involved in
translational repression, similar to CELF1. The interplay of these two regulatory
proteins, particularly in the context of type 1 myotonic dystrophy is of interest.
The MBNL1 protein has 388 amino acid residues, and a total mass of 41.8 kDa. It
is composed of four small CCCH - type zinc finger domains, arranged in pairs.
Domains 1 and 2 are located near the N-terminus, while 3 and 4 are roughly in
the middle of the protein chain. X-ray crystal structures of all four domains are
available (Teplova et al. 2008), and the rest of the protein is believed to have no
significant secondary structure98
.
These four zinc finger motifs recognize a YGCY motif, where Y is either of the
pyrimidine bases99, 100
. Immunoprecipitation assays by Masuda et al. identified a
somewhat different MBNL1 target motif of CU(G/C)C, consistent with earlier
reports101
. The extended CUG RNA sequences in DM1 satisfy both sets of
criteria, and have been shown to sequester MBNL1 along the double stranded
sections of the resulting CUG hairpins. Both MBNL1 and CELF1 are regulators
of alternative splicing, but analysis of the distribution of their target motifs
around introns and exons shows distinct patterns for the two proteins. EDEN
motifs were found to be concentrated immediately before and after alternative
exons. MBNL1 motifs in contrast are less common in these regions, and more
enriched in the exon regions themselves102
.
1.6 Dimerisation of CELF1
Xenopus CELF1 has been reported to undergo dimerisation in a yeast two-hybrid
assay, and it has been suggested that this might have a role in recognition of
RNA54, 103
. No evidence of dimerisation has been reported in the literature for

20
human CELF1. It is not clear if the yeast two-hybrid observation is due to the
formation of a true dimer, or if it could be the result of two CELF1 proteins
binding onto a single RNA molecule of the RNA substrate.
1.7 Phosphorylation of CELF1
Shortly after its discovery CELF1 was shown to be a phosphoprotein11, 104
.
Protein kinase C (PKC), as mentioned previously, can stabilise CELF1 by
hyperphosphorylating the protein in DM1 cells. However the protein is also
predicted to have phosphorylation sites for several other phosphatases105
. It has
been suggested that phosphorylation of CELF1 may therefore play an important
role in regulating its RNA binding preferences, and interactions with other
proteins106, 107, 108
. Phosphorylation has been demonstrated to occur at Ser28 and
Ser302, with some reported effects on the RNA binding properties of CELF1106,
109. It has been proposed that phosphorylation at Ser28 may serve as a “switch”
altering CELF1’s preferred target from the U/G rich sequences so far identified to
a C/G rich sequence. A specific example is a reported increase binding affinity to
the cyclin D1 mRNA sequence shown below when the phosphomimetic mutation
S28D is made to CELF1109
.
Cyclin D1:
5'-CCCAGCCAGGACCCACAGCCCUCCCCAGCUGCCCAGGAAGAGCCCCAGCC-3'
This sequence is very distinct from any other CELF1 consensus sequence in the
literature, as it is G/C rich and with very few uracils. If this concept of a Ser28
switch is correct, it is possible that the “EDEN motif” may actually vary
depending on the phosphorylation state of CELF1.
1.8 Interactions of CELF1 with Poly (A) Ribonuclease

21
CELF1 has been reported to interact with poly(A) ribonuclease (PARN), also
known as DAN (deadenylating nuclease)56
. This interaction was observed even in
the absence of RNA, suggesting the two proteins bind directly to each other.
Since the function of PARN is to shorten the poly(A) tail of mRNAs, it presents a
possible mechanism for how CELF1 triggers deadenylation of its mRNAs. If
CELF1 can interact with both PARN and its mRNA targets simultaneously, it can
therefore recruit the deadenylase to the mRNA. PARN has been successfully
purified110
, and the structures of all of its domains are known from x-ray
crystallography111, 112
. So far no structural data has been reported to indicate
which regions of the proteins are involved in the interaction with CELF1. NMR
data has previously been collected on an isolated construct of the RRM (residues
430 – 516), but not on any larger sections of the protein.
1.9 Aims and Objectives
The primary aim of this study was to determine the sequence requirements for
high affinity CELF1 binding. While a few potential high affinity CELF1 targets
had been identified (e.g. the GRE and EDEN15 consensus sequences), the criteria
for an “EDEN motif” were still not well defined. It was also unknown what role
each domain of CELF1 played in recognising RNA. Our aims were therefore:
1) Express and purify constructs of each domain of CELF1 in isolation.
Using these, determine the minimum RNA sequence requirements for
each domain to bind. NMR and ITC can be used to investigate whether
each domain requires a UGU(U/G) site, or if the shorter UGU site is
sufficient. Also we aimed to investigate which domains are involved in
the reported interactions of CELF1 with CUG repeats and AREs.
2) Using a construct containing the two N-terminal domains of CELF1,
determine the spacing required between UGU or UGU(U/G) sites in a
sequence for tandem binding of the two domains onto a single RNA

22
molecule. Confirm by ITC that this tandem interaction results in an
enhanced binding affinity compared to the isolated RRMs. Investigate
whether a similar enhancement in binding affinity is seen for tandem
interactions with CUG repeats and AREs. We also aimed to check for any
involvement of N- and C-terminal extensions of RRM1 and RRM2 in
RNA binding, similar to that seen for RRM3.
3) Express and purify a construct containing all three RRMs of CELF1,
ideally the full length wild type protein. NMR titrations can then be used
to determine whether all three RRMs are capable of binding onto the
EDEN15 and GRE sequences, and so whether these represent complete
and functional EDEN motifs. If these sequences are not capable of
simultaneous interaction with all three domains, we aimed to design
sequences that can form a high affinity complex. By investigating the
minimum sequence that will still bind all three RRMs, we can determine
the criteria for a functional EDEN motif. We also aimed to determine by
ITC whether binding affinity is enhanced for simultaneous binding of all
three domains.
4) Using the criteria determined for the EDEN motif, rationalise those
sequences already reported to be functional EDEN motifs, and show
which regions of these long sequences are actually recognised by CELF1.
5) Characterise the structure of CELF1 in complex with a high affinity
EDEN motif, ideally using a combination of NMR and x-ray
crystallography.
6) Investigate whether phosphorylation at Ser28 is serving as a “switch”,
altering the RNA binding preferences of CELF1. Using NMR and ITC on
a phosphomimetic mutant (S28D) we will determine if phosphorylation
does change the target from UG rich sequences to CG rich sequences as
suggested.
7) Investigate the reported interaction between poly(A) ribonuclease and
CELF1. To this end we aimed to express and purify full length wild type

23
PARN, and conduct preliminary NMR studies of the protein in isolation,
and in the presence of wild type CELF1. PARN forms a homodimer with
a mass of 146 kDa, and so a complex with CELF1 could be as large as
200 kDa. This system is therefore a challenging target for NMR, and our
first aim was to determine whether high resolution NMR data could be
collected on this key regulatory complex. If it proved possible to acquire
high resolution NMR data, we aimed to observe chemical shift
perturbations from interaction of the proteins, and so determine which
domains of both the CELF1 and PARN proteins are involved in their
interaction.
2 Biophysical Techniques
2.1 Protein NMR
NMR spectroscopy is an established technique for both structural determination
of proteins, and observing their interactions with other molecules. It has a major
advantage over techniques such as ITC and mass spectrometry in that it can
provide information on a residue by residue basis, rather than just the overall
properties of the protein. NMR can also provide detailed structural data of
proteins in biologically relevant aqueous solutions, without the need for
crystallization. This allows dynamic aspects of protein systems to be investigated,
which would not necessarily be evident from crystal structures113, 114
. Over 8000
structures derived from NMR data are present in the protein data bank,
representing a significant fraction of all protein structures so far solved. Large
proteins (with masses of greater than ~35 kDa) have historically been challenging
for NMR, but the development of techniques such as TROSY, selective isotopic
labelling of amino acid types, and improvements in spectrometer field strength
have greatly increased the size of the systems that can be investigated by this
technique115, 116
. Proteins of several hundred amino acids have been successfully
24
assigned, and high resolution spectra have been collected for proteins in
complexes in excess of 800 kDa in mass117, 118
.
In protein NMR the 1H-
15N HSQC, which correlates
1H and
15N chemical shifts,
is a particularly useful experiment since it shows a single peak for each residue in
the protein119
. Each amino acid gives a single peak from the backbone NH, with
the exception of proline where the nitrogen has no hydrogen bonded to it. Some
additional peaks are also produced by NH and NH2 groups in the side chains of
amino acids (specifically tryptophan, arginine, asparigine, glutamine and lysine).
The 1H-
15N HSQC can therefore serve as a “fingerprint” for the protein, with each
peak providing information on the environment of each residue. If the
environment of a residue changes, for example when a ligand binds to the protein
or if the protein conformation is altered, then the chemical shifts will change and
the peak for the residue will move in the 1H-
15N HSQC.
2.1.1 Transverse Relaxation Optimized Spectroscopy (TROSY)
The size of the proteins and other macromolecules that could be studied by NMR
was initially quite limited. Prior to the development of the TROSY technique by
Pervushin et al. in 1997 very few solution NMR structures for proteins larger than
20 kDa were produced120
. NMR of larger proteins has two inherent problems.
Firstly larger proteins inevitably result in more signals on any given spectrum,
leading to spectral crowding and overlapping peaks. Secondly larger proteins
have lower transverse relaxation times (T2). The rapid loss of magnetization
therefore results in very low intensity signals for large proteins.
In the case of amide protons there are two major relaxation mechanisms: the
chemical shift anisotropy of the protons (CSA), and dipole-dipole interactions
between the proton and nitrogen spins (DD). CSA relaxation is proportional to
B02, while DD relaxation is independent of magnetic field strength. At high

25
magnetic fields, such as in the 600 and 800 MHz spectrometers used in this study,
these effects are of comparable magnitude. In a 1H-
15N HSQC spectrum with no
decoupling a peak from an amide proton is split into four by coupling between the
1H and
15N nuclei, as shown in Error! Reference source not found., with
each of the four components having different relaxation rates and linewidths.
These differences are the result of constructive and destructive interference
between the CSA and DD relaxation mechanisms. The normal decoupling process
for an HSQC collapses these four components into a single peak, averaging the
relaxation rates. The TROSY experiment instead selects for the component (DD-
CSA), which has the slowest relaxation rate and hence the narrowest linewidth121,
122, 123,
115
The TROSY experiment has only 50% of the inherent sensitivity of the HSQC
since the signal from the faster relaxing components is discarded. However in
proteins larger than ~20 kDa, this is more than compensated for by the narrower
line widths. The effect is dependent on the field strength (as CSA relaxation is
proportional to Bo2), with optimal results for
15N amide groups at 1 GHz. Use of
this technique has allowed NMR studies of much larger proteins and complexes
than was previously possible115
.
2.1.2 NMR Assignment of Proteins
In order to extract most of the useful information from an NMR spectrum such as
a 1H-
15N HSQC it is necessary to know which peak corresponds to which residue
in the protein. Without this only the general properties of the whole protein such
as its size and whether it is folded into a rigid structure can be determined.
Matching each peak to a specific residue is known as “assigning” the spectrum,
and there are a number of possible methods for accomplishing this.

26
The simplest method is to use 2D homonuclear experiments, specifically the Total
Correlation Spectroscopy (TOCSY) and Nuclear Overhauser Effect Spectroscopy
(NOESY) experiments. The TOCSY experiment shows correlations from
magnetisation transfer through bonds by scalar coupling of spins. The NOESY
experiment shows through-space magnetisation transfer rather than directly
through bonds. By observing cross-peaks between the backbone NH of a residue
and its neighbouring residues it is possible to “walk” along the protein backbone.
Different amino acids give different patterns of side chain proton peaks, and once
the type of each amino acid in a chain is known, it is then possible to match the
chain to a specific section of the protein sequence124
.
This method has the advantage that it does not require any expensive isotopic
labelling of the protein, but it is generally unsuitable for large proteins (larger
than ~10 - 15 kDa) as signals from each residue are only separated by their proton
chemical shift. As the size of the protein increases the odds of it containing
multiple residues with the same proton chemical shift also increases. Overlapped
signals can make connectivities extremely difficult to determine, and this problem
is exacerbated by the tendency to broader linewidths for larger proteins. With 15
N
labelled protein the signals can be separated by their 15
N chemical shift as well as
the proton shift in 3D experiments such as the HSQC-NOESY and HSQC-
TOCSY. This reduces the issue of overlapping signals to some extent125, 126
.
To assign larger proteins a different strategy using 3D heteronuclear NMR
experiments is preferred, in which peaks are separated in the carbon and nitrogen
dimensions as well as the proton dimension, reducing spectral crowding and
overlap even further127
. These experiments require the protein to be isotopically
labelled with both 13
C and 15
N. The more abundant 12
C is not detectable by NMR
as it has a spin of zero. 14
N is detectable by NMR as it has a net spin of 1, but
quadrupolar interactions result in extreme broadening of its signals in large
molecules making it impractical to acquire high resolution data. The 13
C and 15
N
27
nuclei both have spins of ½ and so are suitable for high resolution NMR studies.
The natural abundance of these isotopes is low (1.11% for 13
C and 0.37% for
15N), and their sensitivity is lower than for
1H, so it is necessary to produce
proteins enriched with these isotopes. This is usually accomplished by
recombinant expression in a medium where only suitably labelled carbon and
nitrogen sources are present128
.
Once isotopically labelled material is available 3D heteronuclear experiments
such as the HNCACB129
, HNCO130
, HNCA131
, HN(CA)CO132
and
HN(CO)CACB130, 133
can be carried out. The name of each experiment refers to
which of the nearby carbon nuclei are correlated to each backbone amide group.
The exact magnetization transfer pathways and how the experiments can be used
to assign the 1H-
15N HSQC spectrum of a protein are explained in the following
sections. TROSY versions of all of these 3D heteronuclear experiments exist, and
allow high quality spectra to be collected for large proteins134, 135
. All of the
protein assignments in this study were determined using this strategy of 3D
heteronuclear NMR experiments on proteins labelled with both 13
C and 15
N.
2.1.3 Protein Backbone Assignment Using 3D Heteronuclear NMR
Experiments
In the HNCACB experiment magnetization is transferred from the NH proton to
the 15
N and then to the Cα and Cβ of both the i and i-1 residues. It is then
transferred back to the 15
N and the NH proton in order to be detected, as shown in
Figure 2.1129
. The spectrum therefore usually shows four peaks correlated to each
NH. The Cα and Cβ of the same residue as the NH (residue i) usually result in
high intensity peaks, and are of opposite phases. There are also peaks for the Cα
and Cβ of the preceding residue (residue i-1) which are generally of weaker
intensity and may not be visible in experiments with a poor signal to noise ratio.
An alternative experiment exists (CBCANH) in which the magnetization is
transferred from the Hα and Hβ of both the i and i-1 residues to the corresponding
Cα and Cβ, and then to the NH136
. The same set of peaks is observed as in the

28
HNCACB experiment, but the sensitivity is generally inferior for proteins with
short T2 relaxation times127
.
Figure 2.1: Magnetisation transfer during an HNCACB experiment. Atoms highlighted in red indicate
those observed in the spectrum. On the right is shown an example of the resulting pattern of peaks seen
in this experiment for each atom in the amino acid. The signals from the Cα and Cβ of residue i-1 are
generally less intense than those from residue i due to the lower efficiency of the transfer from the
nitrogen to the Cα.
The HNCACB experiment can be paired with the HN(CO)CACB experiment, in
which the magnetization is transferred to the carbonyl before being transferred to
the Cα (see Figure 2.2). This results in a spectrum which shows only the Cα and
Cβ of the preceding residue (i-1) to that containing the NH133
. Overlaying these
spectra removes any ambiguity in the HNCACB experiment as to which peaks
correspond to the i and i-1 residues. The only exception to these patterns is if
either the i or i-1 residue is a glycine, in which case there will be no Cβ signal for
that residue.

29
Figure 2.2: Transfer of magnetization in the HN(CO)CACB experiment. Atoms in red are observed in the
spectrum. Atoms in blue have magnetization transferred through them, but are not observed in the
spectrum.
Locating a different residue which has Cα and Cβ chemical shifts in the
HNCACB spectrum matching those seen in the HN(CO)CACB spectrum for the
first residue allows it to be assigned as the preceding residue in the protein chain.
In this manner the correlations can be tracked from residue i to i-1 along the
backbone of the protein. Alternatively the protein backbone can be traced in the
opposite direction (from residue i to i+1) by identifying the Cα and Cβ shifts of
residue i from the HNCACB spectrum, and matching those to Cα and Cβ shifts in
the HN(CO)CACB spectrum for a different residue, which can then be confirmed
as residue i+1 in the chain. An example of this assignment method is shown in
Figure 2.3.
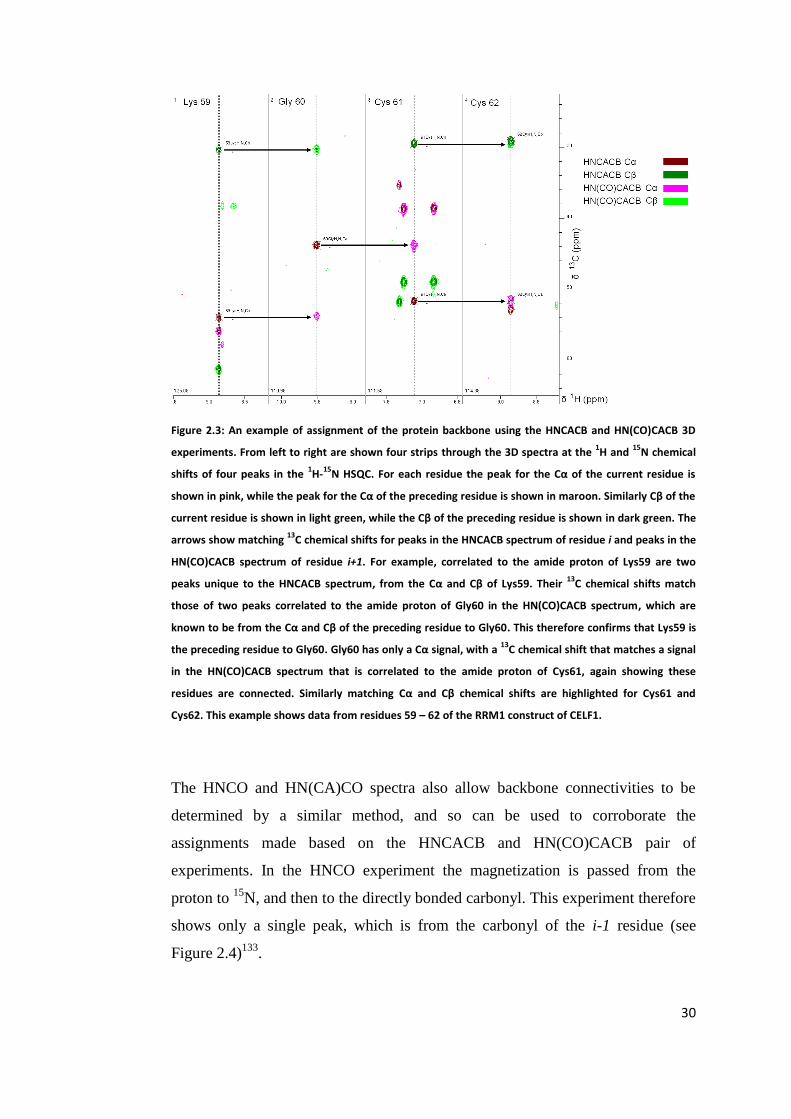
30
Figure 2.3: An example of assignment of the protein backbone using the HNCACB and HN(CO)CACB 3D
experiments. From left to right are shown four strips through the 3D spectra at the 1H and
15N chemical
shifts of four peaks in the 1H-
15N HSQC. For each residue the peak for the Cα of the current residue is
shown in pink, while the peak for the Cα of the preceding residue is shown in maroon. Similarly Cβ of the
current residue is shown in light green, while the Cβ of the preceding residue is shown in dark green. The
arrows show matching 13
C chemical shifts for peaks in the HNCACB spectrum of residue i and peaks in the
HN(CO)CACB spectrum of residue i+1. For example, correlated to the amide proton of Lys59 are two
peaks unique to the HNCACB spectrum, from the Cα and Cβ of Lys59. Their 13
C chemical shifts match
those of two peaks correlated to the amide proton of Gly60 in the HN(CO)CACB spectrum, which are
known to be from the Cα and Cβ of the preceding residue to Gly60. This therefore confirms that Lys59 is
the preceding residue to Gly60. Gly60 has only a Cα signal, with a 13
C chemical shift that matches a signal
in the HN(CO)CACB spectrum that is correlated to the amide proton of Cys61, again showing these
residues are connected. Similarly matching Cα and Cβ chemical shifts are highlighted for Cys61 and
Cys62. This example shows data from residues 59 – 62 of the RRM1 construct of CELF1.
The HNCO and HN(CA)CO spectra also allow backbone connectivities to be
determined by a similar method, and so can be used to corroborate the
assignments made based on the HNCACB and HN(CO)CACB pair of
experiments. In the HNCO experiment the magnetization is passed from the
proton to 15
N, and then to the directly bonded carbonyl. This experiment therefore
shows only a single peak, which is from the carbonyl of the i-1 residue (see
Figure 2.4)133
.

31
Figure 2.4: Magnetization transfer in the HNCO experiment. The short pathway results in this experiment
having the highest sensitivity of this set.
In the HN(CA)CO experiment the magnetization is passed from 15
N to both the i
and i-1 Cα instead, and from there onto the directly bonded carbonyls. The
spectrum therefore has two peaks, one from the carbonyl of residue i, and one
from i-1 (see Figure 2.5)132
.

32
Figure 2.5: Magnetization transfer pathway in the HN(CA)CO experiment. While the magnetization is
transferred via the Cα, only the carbonyls are observed in the spectrum. The transfer from the nitrogen
to the directly bonded Cα in residue i is generally more efficient than to the i-1 Cα, so the residue I
carbonyl usually gives a more intense signal.
The carbonyl chemical shifts cannot be used to identify the residue type since no
amino acids have particularly distinctive shifts, but can help resolve situations
where multiple residues have very similar Cα and Cβ shifts. An example of this is
shown in Figure 2.6.

33
Figure 2.6: An example of using the HNCO and HN(CA)CO spectra for backbone assignment. As the
HN(CA)CO spectrum shows peaks for both the i and i-1 residue, while the HNCO spectrum only shows the
i-1, it is again possible to find matching 13
C chemical shifts and track the connectivity along the protein
backbone. A strip through the 3D spectra is shown for each residue at the 1H and
15N chemical shifts
corresponding to their signal in the 1H-
15N HSQC. Phe43 shows a single peak correlated to the amide
proton in the HNCO spectrum, and two in the HN(CA)CO spectrum. The peak that only appears in the
HN(CA)CO spectrum is from the carbonyl of Phe43. The peak appearing on both spectra is from the
carbonyl of the preceding residue. An arrow indicates the matching 13
C chemical shifts of the Phe43
carbonyl and the peaks known to be from the carbonyl of the previous residue to Gly44. This confirms
the residues are connected, and similarly matching chemical shifts are highlighted for Gly44, Asn45 and
Val46. This example shows data from residues 43 – 46 of the RRM3 construct of CELF1.
Since they have no amide proton and so are not visible in the 1H-
15N HSQC,
prolines in the sequence create breaks in the chain of connected residues. Weak or
missing signals from other residues in the 1H-
15N HSQC will also cause breaks,
so normally the connectivity cannot be tracked all the way from the C-terminus to
N-terminus. Instead a series of shorter sections are assigned and combined to give
the complete assignment of the protein.
This method has so far produced a set of short chains of connected residues, but
as yet the position of each chain in the protein sequence, and hence the exact
assignment of each NH signal in the 1H-
15N HSQC has not been determined. To

34
unambiguously assign a signal to a specific residue requires examination of the
exact Cα and Cβ chemical shifts seen in the HNCACB spectrum. Certain amino
acid residues have distinctive shifts which allow the amino acid type for a
specific residue to be determined. For example, glycine is unique in that it has no
Cβ and so has fewer peaks than other residues in the HNCACB spectrum. The Cα
also has a distinctive shift of 45 ± 2 ppm allowing glycine residues to be
immediately recognised (such as Gly60 in Figure 2.3). Other distinctive residue
types are alanine (which has a uniquely low Cβ chemical shift of 18 ± 3 ppm) as
well as serine and threonine (which are the only residues with larger Cβ shifts
than Cα shifts).
Unique patterns of these distinctive residues can then be identified in the
sequential chains so far produced, and matched to the sequence of the protein. For
example, the t187 construct of CELF1 contains the sequence TFTT from residues
154 - 157. This is the only instance of two adjacent threonine residues in the
protein sequence. When two residues adjacent in the chain were determined to be
threonines by their unusual Cβ shifts they could therefore be specifically assigned
as Thr156 and Thr157. This “locked in” this particular chain section allowing all
the other residues in it to be assigned as well. The assignment could then be
confirmed by the presence of another threonine two residues before Thr156, and
by checking the other residues in the chain had plausible Cα and Cβ shifts for
their assigned amino acid type. These were verified using the reference chemical
shifts in CCPNMR Analysis version 2.0.137
The assignment could be extended out from these known residues, but not beyond
the proline residues at positions 143 and 180 which have no NH signal, and hence
no known chemical shift information. Other distinctive residues, such as the
adjacent alanine residues at positions 71 and 72 were therefore necessary to build
up the full assignment of the protein. Use of this strategy can provide assignments
for the HN, NH, CO, Hα, Cα and Cβ (if present) atoms of each amino acid in the
protein. Assignment of any additional side chain atoms can be assisted by 3D
experiments such as the HCCH-TOCSY if required138
.

35
2.2 NMR Titrations
The exact chemical shifts observed for an amide group in the protein are sensitive
to the surrounding environment. If that environment changes, for example when a
ligand binds to the surface of the protein, then the chemical shifts of nearby
residues will change significantly. Movement of peaks in the NMR spectra
therefore can be used to confirm whether a given ligand does or does not bind to
the protein. From the 1H-
15N HSQC information can also be collected on a per-
residue basis, identifying which residues are most disrupted upon binding to the
ligand. This method can be used to map the binding surfaces of the protein139
.
Depending whether the exchange between free and bound forms is fast or slow on
the NMR timescale, two different effects may be seen. If the rate constant k is
greater than the frequency difference between the exchanging sites (δν) then the
process is said to be in fast exchange. In fast exchange the peak for each
backbone NH appears with chemical shifts that are a population weighted average
of the shifts for the bound and unbound states. These peaks therefore move
gradually over the course of the titration as shown in Figure 2.7.
Figure 2.7: Example of a titration with signals in fast exchange. The peaks gradually move over the course
of the titration allowing their assignments to be tracked from point to point. Data is from a titration of a

36
construct of RRM1 of CELF1 with the RNA substrate UGUUUGU, and shows a region of the 1H-
15N HSQC
containing three peaks. Gly60 and Cys62 are in fast exchange. Gly21 is in intermediate exchange with
very weak signals for some of the intermediate points.
An alternative is slow exchange, where k < δν, in which case the intensity of
affected peaks from the unbound protein will decrease over the course of the
titration, and a new set of peaks from these residues in the bound protein will
appear. An example of this is shown in Figure 2.8. A disadvantage of titrations in
slow exchange is that the assignments cannot simply be tracked from the free
form to the bound form throughout the titration. In crowded regions of the
spectrum it is often unclear which residues new peaks from the bound form
correspond to without collecting additional 3D heteronuclear data and reassigning
them. While it can be stated that the residues for which the peaks from the free
form are lost on titration are involved in the binding, this cannot be quantified
without assignment of the bound form. An intermediate situation where k is
comparable to δν can occur, in which case the peak will both lose intensity and
move, as can be seen for Gly21 in Figure 2.7.
Figure 2.8: An example of an NMR titration with some residues in slow exchange. In blue is shown the
spectrum of the unbound protein. In red is the spectrum when the titration with RNA is at saturation
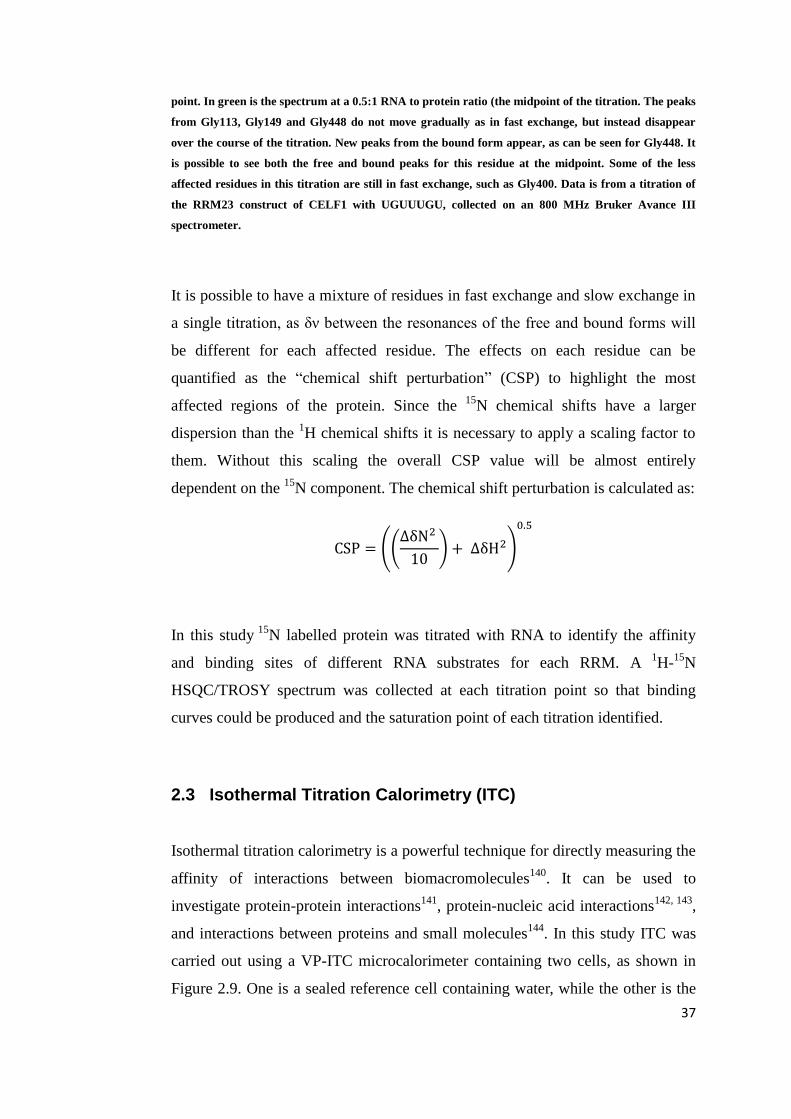
37
point. In green is the spectrum at a 0.5:1 RNA to protein ratio (the midpoint of the titration. The peaks
from Gly113, Gly149 and Gly448 do not move gradually as in fast exchange, but instead disappear
over the course of the titration. New peaks from the bound form appear, as can be seen for Gly448. It
is possible to see both the free and bound peaks for this residue at the midpoint. Some of the less
affected residues in this titration are still in fast exchange, such as Gly400. Data is from a titration of
the RRM23 construct of CELF1 with UGUUUGU, collected on an 800 MHz Bruker Avance III
spectrometer.
It is possible to have a mixture of residues in fast exchange and slow exchange in
a single titration, as δν between the resonances of the free and bound forms will
be different for each affected residue. The effects on each residue can be
quantified as the “chemical shift perturbation” (CSP) to highlight the most
affected regions of the protein. Since the 15
N chemical shifts have a larger
dispersion than the 1H chemical shifts it is necessary to apply a scaling factor to
them. Without this scaling the overall CSP value will be almost entirely
dependent on the 15
N component. The chemical shift perturbation is calculated as:
CSP = ((∆δN2
10) + ∆δH2)
0.5
In this study 15
N labelled protein was titrated with RNA to identify the affinity
and binding sites of different RNA substrates for each RRM. A 1H-
15N
HSQC/TROSY spectrum was collected at each titration point so that binding
curves could be produced and the saturation point of each titration identified.
2.3 Isothermal Titration Calorimetry (ITC)
Isothermal titration calorimetry is a powerful technique for directly measuring the
affinity of interactions between biomacromolecules140
. It can be used to
investigate protein-protein interactions141
, protein-nucleic acid interactions142, 143
,
and interactions between proteins and small molecules144
. In this study ITC was
carried out using a VP-ITC microcalorimeter containing two cells, as shown in
Figure 2.9. One is a sealed reference cell containing water, while the other is the
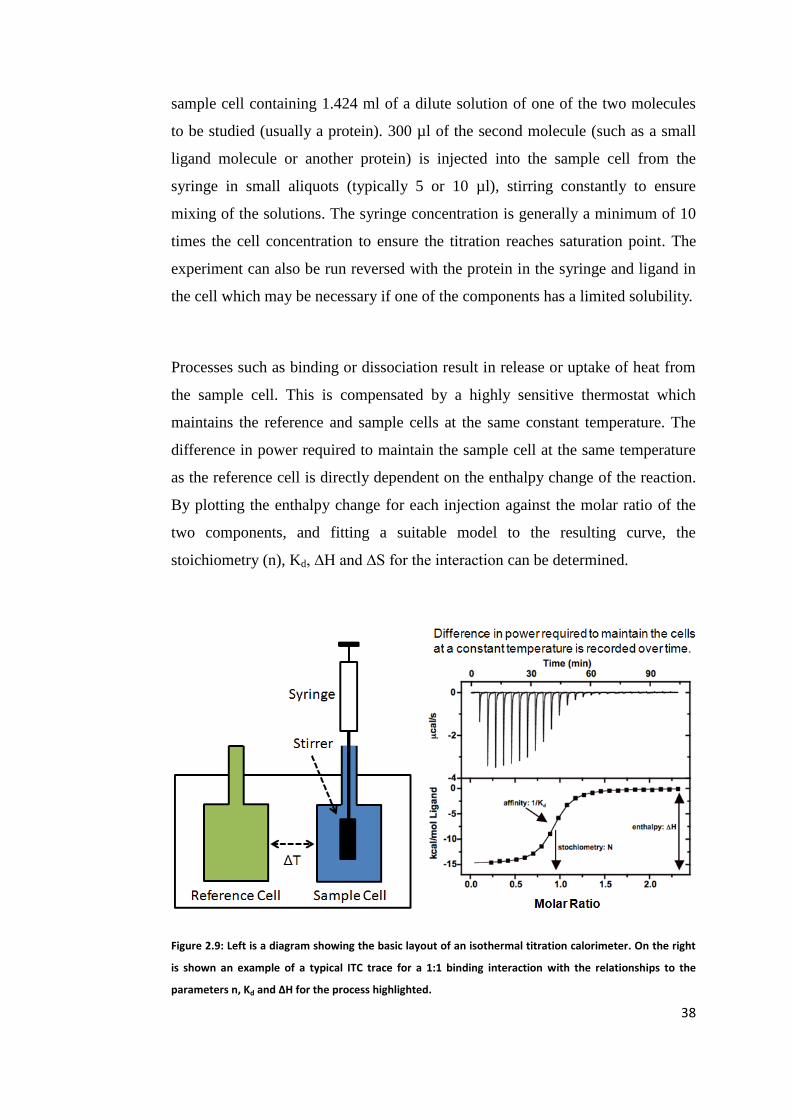
38
sample cell containing 1.424 ml of a dilute solution of one of the two molecules
to be studied (usually a protein). 300 µl of the second molecule (such as a small
ligand molecule or another protein) is injected into the sample cell from the
syringe in small aliquots (typically 5 or 10 µl), stirring constantly to ensure
mixing of the solutions. The syringe concentration is generally a minimum of 10
times the cell concentration to ensure the titration reaches saturation point. The
experiment can also be run reversed with the protein in the syringe and ligand in
the cell which may be necessary if one of the components has a limited solubility.
Processes such as binding or dissociation result in release or uptake of heat from
the sample cell. This is compensated by a highly sensitive thermostat which
maintains the reference and sample cells at the same constant temperature. The
difference in power required to maintain the sample cell at the same temperature
as the reference cell is directly dependent on the enthalpy change of the reaction.
By plotting the enthalpy change for each injection against the molar ratio of the
two components, and fitting a suitable model to the resulting curve, the
stoichiometry (n), Kd, ∆H and ∆S for the interaction can be determined.
Figure 2.9: Left is a diagram showing the basic layout of an isothermal titration calorimeter. On the right
is shown an example of a typical ITC trace for a 1:1 binding interaction with the relationships to the
parameters n, Kd and ΔH for the process highlighted.

39
Also in Figure 2.9 is shown an example of raw ITC data for a simple 1:1 binding
case. This particular example shows an exothermic reaction, so each injection
results in a release of heat, and hence a brief reduction in the power required to
maintain the sample cell at a constant temperature. This appears as a negative
peak on the ITC trace. As more of the ligand is injected the protein in the cell will
approach saturation. Fewer protein molecules are unoccupied and free to bind
ligands and release heat with each injection, so the magnitude of the peaks
declines to zero. Eventually the protein is completely saturated, no further
interaction can occur, and so no significant change is seen from further ligand
injections. Integration of each peak with respect to time gives the area under it
which is equal to n∆H for the injection, and can be plotted against the molar ratio
of the two components.
For a simple 1:1 binding case, the enthalpy of the reaction is the difference
between the magnitudes of the initial and final injections. Ideally the final
injections will result in no significant enthalpy change, though buffer mismatches
can result in the baseline of the trace reaching a plateau above or below zero. The
stoichiometry of the reaction is the ligand/protein ratio at the inflection point of
the curve, and the gradient of the curve at that point is equal to 1/Kd. In the event
of a buffer mismatch the experiment can be repeated without the protein in the
cell to produce a ligand into buffer trace which can be subtracted from the main
titration trace as a baseline correction145
.
In a reaction at equilibrium the rate of formation of the complex is defined as k1
and the rate of dissociation of the complex is defined as k-1. The dissociation
constant Kd is a useful measure of the affinity of an interaction, and can be
calculated as:
Kd = k-1/k1

40
ITC can accurately determine Kd values between several hundred micromolar and
10 nanomolar146, 147
. For higher affinity binding the curve becomes a step
function, with very few points defining the shape around the inflection point. This
prevents accurate determination of the gradient at the inflection point, and hence
Kd. Reducing the concentration of both protein and ligand will result in a
shallower curve, but this also reduces the absolute magnitude of each peak and
hence the signal to noise ratio for the experiment. This renders ITC unsuitable for
direct measurement of Kd values less than ~10 nM. In some cases it is possible to
calculate Kd values for very high affinity ligands from competition experiments
with lower affinity ligands. Very low affinity binding cannot be measured because
the concentration of the ligand would have to be impractically high in order for
the titration to reach saturation point. ITC has the disadvantage of requiring a
relatively large amount of material compared to techniques such as surface
plasmon resonance (SPR). For the titrations in this study concentrations of 125 –
250 µM were required for the component in the syringe. From the Kd values, the
binding stoichiometry (n) and ∆H it is possible to calculate ∆G and ∆S for the
interaction using the equations:
∆G = -RTlnKa (where Ka = 1/Kd)
∆G = ∆H - T∆S.
Where R = 8.314 JK-1
mol-1
(the gas constant) and T is the temperature in
kelvin148
.
The software package Origin 7.0 was used to fit binding curves to the ITC data
collected throughout this study. Since the volume of solution in the cell changes
over the course of the titration the concentration of the macromolecule in the cell
is not a constant. The model adjusts for this change in concentration at each point
in the titration using the equation:

41
𝑀𝑡 = 𝑀𝑡0
(1 −∆𝑉2𝑉0
)
(1 +∆𝑉2𝑉0
)
Where Mt is the current concentration of macromolecule in the cell, Mt0 is the
initial concentration macromolecule in the cell, Vo is the initial cell volume and
ΔV is the volume added from the syringe. Similarly the adjusted concentration of
the ligand at each point (Xt) can be calculated from hypothetical concentration of
the ligand if there was no volume change (Xt0) using the equation:
𝑋𝑡 = 𝑋𝑡0(1 −∆𝑉
2𝑉0)
These adjusted values are then used in Origin's binding model for a simple 1:1
interaction to calculate the total heat content of the solution (Q) at each point as
follows:
Ka = Binding constant
n = Number of binding sites on each macromolecule in the cell.
Vo = Cell volume
ΔH = molar enthalpy change for ligand binding
𝑄 = (𝑛𝑀𝑡∆𝐻𝑉0
2) (1 + (
𝑋𝑡
𝑛𝑀𝑡) + (
1
𝑛𝐾𝑎𝑀𝑡) − ((1 +
𝑋𝑡
𝑛𝑀𝑡+
1
𝑛𝐾𝑎𝑀𝑡)
2
−4𝑋𝑡
𝑛𝑀𝑡))
0.5
From this equation the model can calculate Q at each point in the experiment for
specified values of n, Ka and ΔH. The experimental data however is measuring
the change in Q for each injection. The heat released by the ith injection is:

42
∆𝑄𝑖 = 𝑄𝑖 + (𝑑𝑉𝑖
𝑉0) (𝑄𝑖 +
𝑄𝑖−1
2) − 𝑄𝑖−1
Where Vi is the volume of the ith injection. From an initial estimate of the values
of n, ΔH and Ka an iterative fitting process using a non-linear regression method
is then conducted to determine the closest fitting values to the experimental
data144
.
2.4 Small Angle X-ray Scattering
Small angle X-ray scattering (SAXS) is a technique which can be used for
studying the general structure of biomacromolecules in solution. It does not allow
high resolution structures to be produced but it can be used to construct a low
resolution 3D model showing the average size and shape of the particles. SAXS
has a resolution range of approximately 10 – 250 Å149
. This is usually not
sufficient to resolve secondary structure elements, but it can determine the
relative orientation of large structured domains. This technique can also provide
the radius of gyration of the protein or complex from a Guinier plot, and general
information about its overall flexibility from a Kratky plot150
.
In a SAXS experiment a monochromatic beam of x-rays is directed through the
sample. These x-rays are scattered by the particles in the sample, typically
through a very small angle. A large fraction of the x-rays are not scattered, and
simply pass straight through the sample to the detector, so a tightly focused (or
collimated) x-ray beam is required. Since the buffer will also cause some
scattering, it is usual to repeat the experiment with a blank sample containing
only the buffer solution. This scattering curve can then be subtracted from the
curve for the real sample, leaving only the SAXS profile of the macromolecules
in the solution. As the properties measured are averaged over all the particles in
the sample SAXS requires the sample to be monodisperse (i.e. it must be ensured
that all of the scattering particles are identical, and non-interacting). The presence
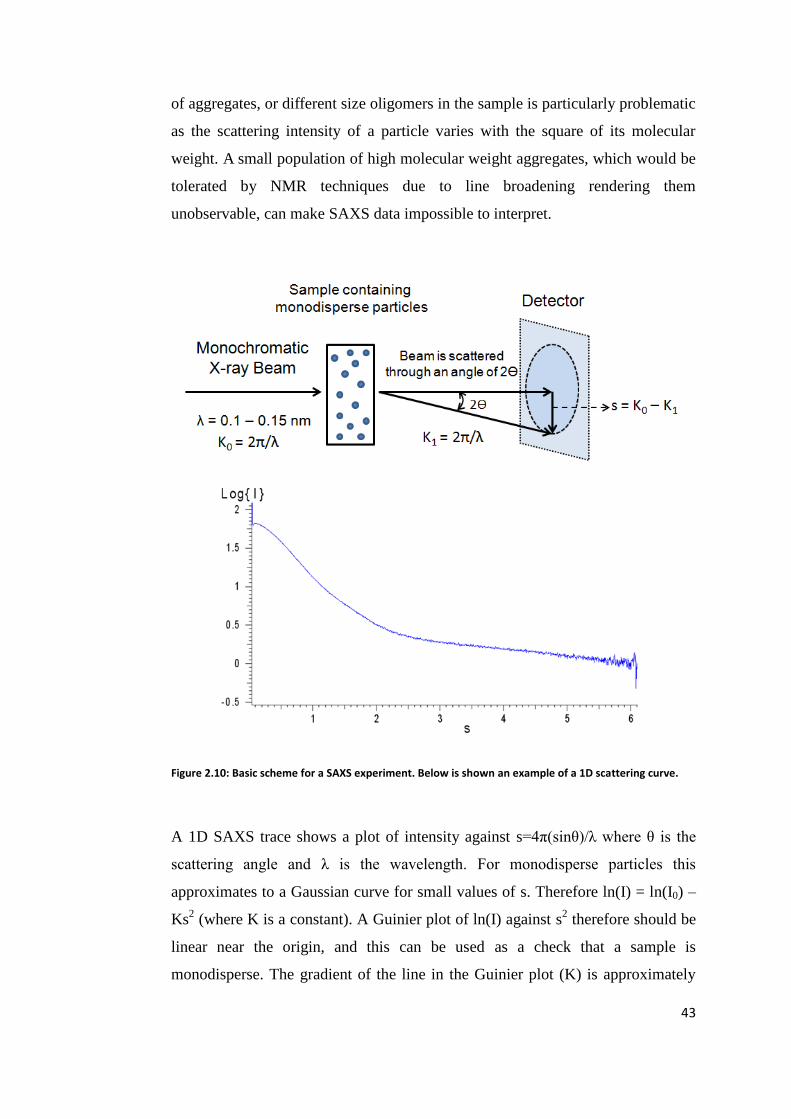
43
of aggregates, or different size oligomers in the sample is particularly problematic
as the scattering intensity of a particle varies with the square of its molecular
weight. A small population of high molecular weight aggregates, which would be
tolerated by NMR techniques due to line broadening rendering them
unobservable, can make SAXS data impossible to interpret.
Figure 2.10: Basic scheme for a SAXS experiment. Below is shown an example of a 1D scattering curve.
A 1D SAXS trace shows a plot of intensity against s=4π(sinθ)/λ where θ is the
scattering angle and λ is the wavelength. For monodisperse particles this
approximates to a Gaussian curve for small values of s. Therefore ln(I) = ln(I0) –
Ks2 (where K is a constant). A Guinier plot of ln(I) against s
2 therefore should be
linear near the origin, and this can be used as a check that a sample is
monodisperse. The gradient of the line in the Guinier plot (K) is approximately

44
equal to -Rg2/3, where Rg is the radius of gyration of the protein. Collecting this
information at multiple concentrations can detect any aggregation of the protein,
since the apparent radius of gyration would then vary depending on the
concentration150
.
A Kratky plot of Is2 plotted against s provides qualitative information about the
overall structure and flexibility of a particle in solution151
. In general a Kratky
plot for a rigid globular protein takes the form of a Gaussian curve. An unfolded
protein typically shows a plateau for high values of s, without a clearly defined
peak. A protein with multiple structured domains separated by flexible linkers
generally shows a mixture of these schemes, potentially with multiple peaks152
.
A major advantage of SAXS is that it operates on solution samples, and does not
require crystallization of the protein. Difficulties producing crystals of sufficient
quality for diffraction studies can be a major barrier to x-ray crystallography.
CELF1 constructs containing all three RRMs have failed to produce diffraction
quality crystals, hence the use of solution techniques such as NMR and SAXS to
examine the structure of the larger complexes. SAXS also has the advantage that
it can provide structural information on very large protein complexes, where
NMR becomes impractical due to signal broadening from rapid relaxation, and
signal overlap. Sample preparation is straightforward, and does not require
isotopic labelling or large quantities of material.
A limitation of SAXS is that the scattering curves produced are one-dimensional.
This can result in ambiguities when producing a 3D model of the particle, as there
may be many models consistent with the 1D SAXS data. For example, SAXS is
not capable of determining chirality. Enantiomers appear identical as only
information on the distances between scattering centres is measured. The SAXS
model of a particle inevitably is of a low resolution, typically 10 Å or larger, so
this technique is generally used to complement other techniques such as NMR
and X-ray crystallography153
.

45

46
2.5 Mass Spectrometry
In mass spectrometry a sample is ionised, and the resulting measurements are
therefore for a sample in the gas phase. There are several possible methods for
ionising a sample, the most commonly used being electrospray ionisation (ESI)
and matrix-assisted laser desorption/ionisation (MALDI)154
. For all experiments
in this study, ESI was the ionisation method used.
In electrospray ionisation the sample is pumped through an extremely narrow
capillary, across the tip of which a high voltage is applied. An additional
nebulising gas (nitrogen) flows around the outside of the capillary and into the
mass spectrometer. This results in the formation of extremely small charged
droplets, which decrease in size as the volatile solvent evaporates. As these
droplets shrink they release sample ions, which pass through an intermediate
vacuum region before entering the high vacuum of the mass analyser. The mass to
charge ratio (m/z) of the ions determines their velocity, and hence the time
required to reach the detector. In time of flight mass spectrometry this is used to
calculate the m/z of the sample ions155
. ESI results in sample ions with a range of
charge states (ions with equal mass, but different charges which appear as discreet
peaks in the mass spectrum). This is in contrast with MALDI which generally
results in only a single charge state for each species156, 157
.
The number of populated charge states, and the overall average charge provide
some indication of how folded a protein is. This is because they are dependent on
the solvent exposed surface area of the protein during the early stages of
desolvation. This will be larger for an unfolded protein than for a structured
protein of the same mass. Unfolded proteins therefore show a wider range of
different charge states, and a higher average charge than structured proteins158,
159
.
Mass spectrometry measures the mass to charge ratio (m/z) of the ions produced

47
and so the mass of a protein. This makes it a rapid method to confirm the identity
of a protein. This technique has the advantage that it can be used on very low
sample concentrations (< 1 µM), and so requires very little material. It can also be
used to investigate much larger protein complexes than techniques such as NMR,
capable of observing complexes in the MDa range160
. Mass spectrometry data can
usually be collected in a matter of minutes, making it considerably faster than ITC
or multidimensional NMR. Binding stoichiometries can be determined simply
based on the mass of the bound complex, if it remains intact in the gas phase.
A major limitation of ESI-MS is the need to remove NaCl and similar salts from
the sample. Even in very small quantities, these lead to the formation of sodium
adducts. Proteins with different numbers of attached sodium ions have slightly
different masses, resulting in poorly defined broad signals from which it may not
be possible to calculate an accurate mass for the protein itself. A similar problem
is encountered for ESI-MS of nucleic acids.
Since it measures the mass to charge ratio rather than simply the mass of an ion,
mass spectrometry can have problems distinguishing between protein oligomers
and monomers. While a protein dimer has twice the mass of the monomer, it will
also tend to have twice the charge resulting in the same overall m/z value. For
ionisation methods such as ESI that generate a range of charge states it is however
possible to determine the presence of dimers. The dimeric species will result in an
extra set of peaks between those of the monomeric species with m/z values
implying half-integer values of z. These are the odd numbered charge states of the
dimeric species. An example of this in ESI-MS is shown in Figure 2.11.
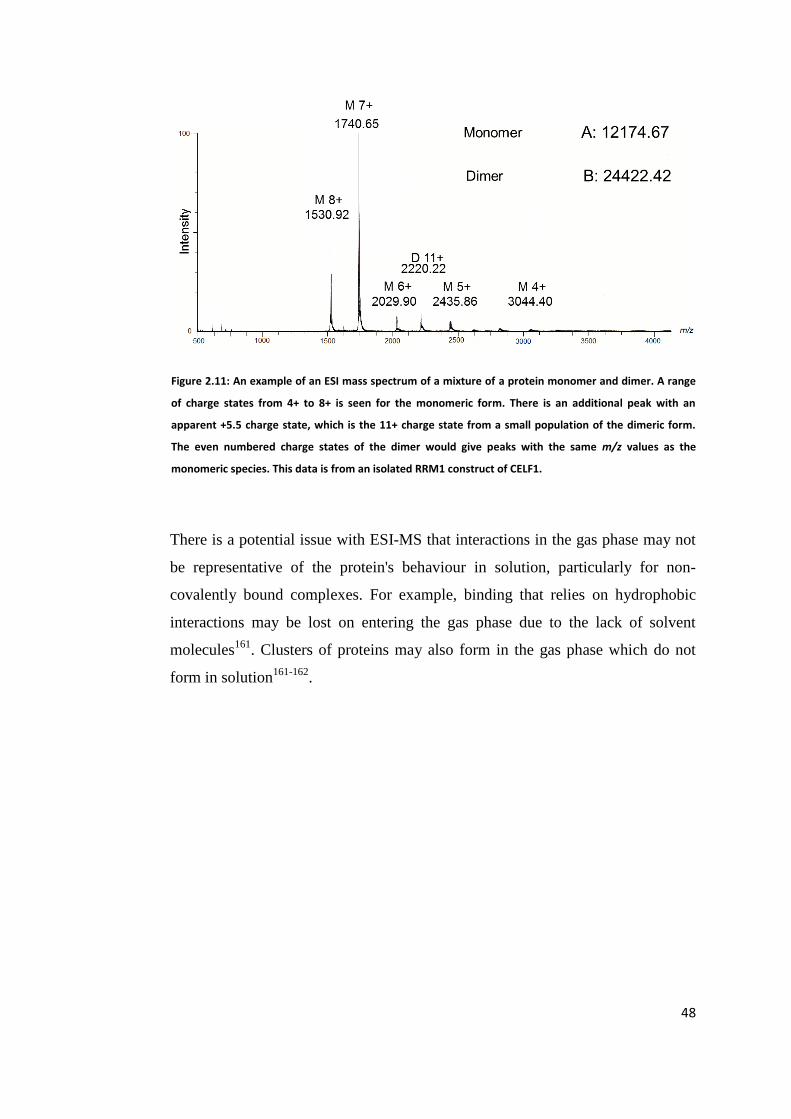
48
Figure 2.11: An example of an ESI mass spectrum of a mixture of a protein monomer and dimer. A range
of charge states from 4+ to 8+ is seen for the monomeric form. There is an additional peak with an
apparent +5.5 charge state, which is the 11+ charge state from a small population of the dimeric form.
The even numbered charge states of the dimer would give peaks with the same m/z values as the
monomeric species. This data is from an isolated RRM1 construct of CELF1.
There is a potential issue with ESI-MS that interactions in the gas phase may not
be representative of the protein's behaviour in solution, particularly for non-
covalently bound complexes. For example, binding that relies on hydrophobic
interactions may be lost on entering the gas phase due to the lack of solvent
molecules161
. Clusters of proteins may also form in the gas phase which do not
form in solution161-162
.

49
3 Materials and Methods
3.1 Protein Sequences
The genes for Xenopus Laevis CELF1 and Xenopus Laevis poly (A) ribonuclease
had been previously cloned into the pET28 and pET33 plasmids respectively by
Dr Emilie Malaurie, who also produced the t187 and t242 constructs of CELF1
cloned into the pET28b vector (shown in Figure 3.1).
Figure 3.1: Plasmid map of the pET-28b vector.
All other constructs used in these studies were derived from these plasmids. The
protein sequences are as follows:

50
Wild Type CELF1 (Xenopus Laevis)
MNGTMDHPDHPDPDSIKMFVGQVPRSWSEKELRELFEQYGAVYEINVLRDRSQNPPQSK
GCCFITFYTRKAALEAQNALHNMKVLPGMHHPIQMKPADSEKNNAVEDRKLFIGMVSKN
CNENDIRAMFSPFGQIEECRILRGPDGMSRGCAFVTFTTRSMAQMAIKSMHQAQTMEGC
SSPIVVKFADTQKDKEQKRMTQQLQQQMQQLNAASMWGNLTGLNSLAPQYLALLQQTA
SSGNLNSLSGLHPMGAEYGTGMTSGLNAIQLQNLAALAAAASAAQNTPSAGAALTSSSSPL
SILTSSGSSPSSNNSSINTMASLGALQTLAGATAGLNVNSLAGMAAFNGGLGSSLSNGTGST
MEALSQAYSGIQQYAAAALPSLYNQSLLSQQGLGAAGSQKEGPEGANLFIYHLPQEFGDQD
LLQMFMPFGNVVSSKVFIDKQTNLSKCFGFVSYDNPVSAQAAIQSMNGFQIGMKRLKVQL
KRSKNDSKPY
Poly (A) Ribonuclease (Xenopus Laevis)
MEITRSNFKDTLPKVYKAIEEADFLAIDGEFSGISDGPSVSTLTNGFDTPEERYTKLKKHSMEF
LLFQFGLCTFNYDNTEAKYLMKSFNFYIFPKPFNRNSPDKKFVCQSSSIDFLANQGFDFNKV
FRNGIPYLNQEEERVLRDQYEDRRSQSNGASTMSYISPNSSKTPVSIPDEQKGFIDKVVERV
EDFLKNEQKSMNVEPCTGYQRKLIYQTLNWKYPRGIHVETVESEKKERYIVISKVDEEERKR
MEQQKQAKEREELDDAVGFSRIIQAISSSGKLVVGHNMLLDVMHTIHQFFCQLPDELNEFK
EVTNCVFPRVLDTKLMASTNPFKEIIYNTSLAELEKRLKEAPFKPPKVDSAEGFQSYNTASEQ
LHEAGYDAYITGLCFISMANYLGSFLSPPKDYVSCRSKIVRPFFNKLFLMRIMDIPYLNLEGPD
LQPKRDNVLHVTFPKEWKTSDLYQLFSAFGNIQVSWIDDTSAFVSLSQPEQVQIAVNTSKYA
ESYRIQTYAEYIEKKNDESQTKRKWAEDGWKDLERKRLKTQYNSYIPQNPVFYGNCFAPSFA
VKRSMSPIQEEAASDDTEEVHTHENDPSNPGATEQGKKPKNHKRQKIDSAPPETSDGGSS
VLFEVPDTW
All constructs were fused to an N-terminal histidine tag (consisting of six
histidine residues in a row), with a thrombin cleavage site between the tag and the

51
protein allowing its removal where necessary. Removal of the tag with thrombin
leaves an additional six amino acids (GSHMAS) attached to the N-terminus of
the protein. This allowed the proteins to be purified by metal affinity
chromatography.
3.2 Sterilization
All glassware, pipette tips, media and buffers were sterilized by autoclaving for
15 minutes at 121°C (using a Phillip Harris Status Autoclave). Universals, petri
dishes and other disposables were supplied in sterile condition by the
manufacturers. Any reagents that could not be autoclaved due to heat sensitivity
(e.g. kanamycin, IPTG) were sterilized by filtering through a 0.22 µm sterile filter
immediately before use.
Workspaces were cleaned using 100% ethanol before growths or other cell work
was conducted. All sterile work was carried out by a Bunsen burner flame.
Glassware used in growths and other cell work was sterilised with Trigene for 20
minutes, or by autoclaving in the case of the 2 L flasks. Disposable materials
were autoclaved prior to incineration.

52
3.3 Buffers
The following table shows the buffers which were used for cell lysis, purification
and NMR experiments for each protein construct.
Buffer Composition Constructs
Lysis buffer A 25 mM potassium phosphate,
50 mM NaCl, pH 7.0
RRM1, RRM2, RRM3,
t187, t242
Lysis buffer B 25 mM potassium phosphate,
200 mM NaCl, pH 7.0
RRM123, RRM23
Lysis Buffer C 25 mM potassium phosphate,
50 mM NaCl, 4 M Urea, pH
7.0
Wild Type CELF1
Lysis Buffer D 20 mM potassium phosphate,
500 mM NaCl, 10% v/v
glycerol, 5 mM imidazole, pH
7.9.
Wild Type Poly (A)
Ribonuclease
Anion Exchange A 25 mM potassium phosphate,
50 mM NaCl, 10% v/v
glycerol, 200 µM EDTA, pH
7.0
Wild Type Poly (A)
Ribonuclease
Anion Exchange B 25 mM potassium phosphate,
2 M NaCl, 10% v/v glycerol,
200 µM EDTA, pH 7.0
Wild Type Poly (A)
Ribonuclease
NMR Buffer A 25 mM potassium phosphate,
50 mM NaCl, 10% v/v D2O,
pH 7.0
RRM1, RRM2, RRM3,
t187, t242
NMR Buffer B 25 mM potassium phosphate,
200 mM NaCl, 10% v/v D2O,
pH 7.0
RRM123, RRM23
NMR Buffer C 25 mM potassium phosphate,
50 mM NaCl, 200 mM Urea
10% v/v D2O, pH 7.0
Wild Type CELF1, Wild
Type Poly (A)
Ribonuclease

53
3.4 Overnight Cultures
15 ml of overnight cultures were grown in autoclaved Luria-Bertani broth
(Sigma. 10 g/L tryptone, 5 g/L yeast extract, 10 g/l NaCl). E. Coli. XL1-Blue and
BL21 (DE3) strains were used throughout. All constructs used in this study were
in either a pET28 or pET33 vector both of which incorporate kanamycin
resistance. 30 µg/ml kanamycin was therefore used as an antibiotic control.
Cultures were grown for ~16 hours at 37˚C and an agitation rate of 180 rpm.
3.4.1 Glycerol Stocks
Glycerol stocks were produced from overnight cultures by mixing 0.4 ml of cell
culture in LB with 0.4 ml of autoclaved 30% (v/v) glycerol in sterile eppendorfs.
All glycerol stocks were stored at -80°C.
3.5 Overexpression
1 L baffled flasks of LB were each inoculated using one 15 ml overnight culture,
containing 30 µg/ml of kanamycin as antibiotic control. These 1 L cultures were
incubated at 37°C, with an agitation rate of 180 rpm, until the OD at 595 nm was
in the range 0.6 - 0.8. At this point 1 ml of 1 M IPTG was added to each flask to
induce protein overexpression in E. Coli BL21 (DE3). The flasks were then
incubated overnight (~16 hours) at 30°C, 180 rpm, unless otherwise specified.
Cells were harvested by centrifugation at 3000 g for 15 minutes. The supernatant
was then discarded and the pelleted cells stored at -20°C.
3.6 Sonication
54
For all constructs except CELF1 Wild Type and PARN deadenylase, a cell pellet
from 1 litre of cell culture was resuspended in 10 ml of lysis buffer (50 mM
NaCl, 25 mM phosphate, pH 7.0) from here referred to as buffer A. One EDTA-
free protease inhibitor tablet (manufactured by Roche) was added to prevent
protein degradation. The suspension was then sonicated at 10 microns for 10
minutes with 30 second breaks on ice every 30 seconds. Cell debris was pelleted
by centrifugation at 35000 g for 30 minutes. The supernatant was then loaded
onto an IMAC column.
For the purification of CELF1 wild type, cell lysis was carried out in 4 M urea,
200 mM NaCl, 25 mM phosphate, pH 7.0 buffer. Under these conditions the
fragmentation of the linker between RRM2 and 3 was substantially reduced. The
purification of poly (A) ribonuclease used a different lysis buffer (20 mM
potassium phosphate, 500 mM NaCl, 10% v/v glycerol, 5 mM imidazole, pH 7.9)
which was based on the 2006 paper by Nilsson et al.
3.7 Metal Affinity Chromatography
The attachment of a six histidine tag to the protein allows it to undergo a high
affinity interaction with metal ions such as Ni2+
and Co2+
. The His-Pur affinity
column (Pierce, Thermo Scientific) uses Co2+
ions attached to the surface of glass
beads in a resin. The His-tagged proteins in the cell lysate can therefore be
selectively bound to this solid column matrix. After washing to remove non-
specifically binding proteins the His-tagged protein can be eluted, usually by
addition of a high concentration of imidazole to compete for the metal binding
sites. The protein can also be eluted by reduction of the pH to less than 6.0, but
acidic conditions may not be tolerated by some proteins.

55
A His-tag binding cobalt column was prepared by addition of 1 ml of His-Pur
resin to a Talon PD10 column (GE Life Sciences), washing with 20 column
volumes of water and finally 20 column volumes of buffer A. The supernatant
from the sonication step was then added to this column, which was capped and
tumbled at 4°C for 2 hours to allow binding of the protein to the beads. After two
hours the supernatant was drained off the column under gravity, leaving the His-
tagged protein bound to the cobalt resin.
For the t187, t242, RRM1, RRM2 and RRM3 constructs, the IMAC column stage
of the purification was conducted as follows. After the supernatant was drained
from the cobalt column, the beads were washed with 25 ml of a high salt buffer
(25 mM phosphate, 2 M NaCl, pH 7.0) to remove any RNA or DNA bound to the
protein. This was followed by a 25 ml low imidazole wash to remove non-
specifically binding proteins (25mM phosphate, 100 mM NaCl, 10 mM
imidazole, pH 7.0). The protein was finally eluted from the column using 750
mM imidazole, 25 mM phosphate, 100 mM NaCl pH 7.0 elution buffer. This was
collected in 2 ml fractions which were tested for protein content by SDS-PAGE.
The proteins were normally eluted in the first 6 ml of elution buffer. Protein
containing fractions were then recombined for the thrombin cleave step. The
RRM123 construct was purified by the same protocol except that the His-tag was
not removed from the protein, which was immediately gel-filtered.
For CELF1 wild type, centrifugation to remove cell debris and binding to the
IMAC column was carried out as for the other constructs. After allowing time for
protein to bind to the column a high salt wash (25 ml 2 M NaCl, 2 M urea, 25
mM phosphate) was applied, followed by a dilute imidazole wash (25 ml of 200
mM NaCl, 2 M urea, 25 mM phosphate, 1 mM imidazole). The protein was
eluted in 0.5 M Imidazole, 2 M NaCl, 1 M urea, 25 mM phosphate and collected
in 2 ml aliquots. The thrombin cleave step was omitted, so EDTA was added to
the elution fractions to a concentration of 5 mM, and the eluted protein was
immediately gel filtered using the protocol in section 3.9.

56
3.8 His-Tag Removal by Thrombin Cleave
All proteins constructs incorporated a thrombin cleave site (LVPRGS) between
the 6-His-tag and the protein. Elution fractions from the IMAC column were
transferred to a centrifugal concentrator (3 kDa molecular weight cutoff), and
diluted up to 20 ml with buffer A. This was then spun at 4000 g until the volume
had been reduced by 50%, at which point it was again diluted to 20 ml with
buffer A. This was repeated until the imidazole concentration of the solution was
reduced to less than 0.1 M, as a higher concentration could interfere with the
thrombin cleave step. The protein solution was then transferred to a universal, and
5 units of thrombin were added. The universal was agitated overnight at room
temperature to cleave the His-tag from the protein. Mass spectrometry was used
to confirm the tag had been successfully removed. Due to solubility and stability
issues the His-tag was not removed from RRM123, wild type CELF1 or poly(A)
ribonuclease. In the purification protocol for these proteins the elution fractions
from the IMAC were immediately loaded onto a gel filtration column.
3.9 Gel Filtration
Gel filtration separates out any impurities left after the metal affinity
chromatography stage based on their different molecular masses and also the
overall shape of the proteins. It also serves to buffer exchange the protein from
the high imidazole elution buffer to an imidazole-free phosphate buffer. Initial
purifications of t187 and all purifications of t242, RRM123, CELF1 wild type
and PARN deadenylase were carried out using a Superdex 200 gel filtration
column (GE Life Sciences). RRM1, RRM2, RRM3 and later purifications of t187
were gel filtered using a Superdex 75 column due to the lower mass of these
constructs.

57
Gel filtration columns were pre-equilibrated with 400 ml of 30 mM potassium
phosphate, 100 mM NaCl, pH 7.0 buffer. Protein solutions were centrifuged at
4000 g for 10 minutes, or filtered through a 0.2 µm filter prior to loading onto the
column in order to remove any insoluble material. Gel filtration columns were
run at 3 ml/min unless otherwise specified. 10 ml fractions were collected, and
those containing protein were identified by 280 nm absorbance except in the case
of RRM2. Since the RRM2 construct contains no tryptophan or tyrosine it has no
significant 280 nm absorbance, so it was necessary to locate the protein by SDS-
PAGE. RRM3 also showed limited absorbance at 280 nm due to the absence of
tryptophan in the construct. Normal elution fractions for all constructs are shown
in the table below.
Protein
Construct
Gel Filtration
Column
Elution Fractions
T187 Superdex 200 260 - 270 ml
Superdex 75 180 - 200 ml
T242 Superdex 200 240 - 260 ml
RRM1 Superdex 75 210 - 220 ml
RRM2 Superdex 75 230 - 250 ml
RRM23 Superdex 75 190 – 210 ml
RRM123 Superdex 200 220 – 240 ml
Those gel filtration fractions containing protein were frozen with liquid nitrogen
and lyophilised.

58
3.10 Desalting
Lyophilised protein from the gel filtration step was redissolved in MilliQ water
and centrifuged at 4000 g for 10 minutes to remove any insoluble material before
loading onto 5x5 ml HiTrap desalting column (Amersham Biosciences). The
column was pre-equilibrated with degassed and filtered MilliQ water. The salt
content of the elution fractions was monitored based on conductivity, while
protein content was monitored based on 280 nm absorbance. Liquid nitrogen was
used to freeze the relevant desalted fractions for lyophilisation.
3.11 Storage and Stability
Lyophilised protein was stored at -20°C. Protein solutions requiring long-term
storage were kept at -80°C. RNA and DNA solutions were stored dissolved in
nuclease-free water at -20°C.
3.12 Production of Isotopically Labelled Protein
For the production of 15
N labelled protein the growth was carried out in minimal
media rather than LB. M9 Minimal media was prepared by dissolving 6 g
dipotassium hydrogen phosphate, 3 g sodium dihydrogen phosphate, 0.5 g of
NaCl, 0.3 g anhydrous magnesium sulphate and 0.015 g calcium chloride in 1 L
of water. The media was then autoclaved to sterilise it. 1 g of 15
N labelled
ammonium chloride and 4 g of glucose were dissolved in 40 ml of MilliQ water
and added to the media using a 0.2 µm syringe filter to sterilise the solution.
These were the only nitrogen and carbon sources in the media. In addition 10 mg
of biotin and 10 mg of thiamine were added.

59
Four 15 ml overnight cultures were prepared for each 1 litre flask. Prior
innoculating the M9 minimal media the cells were harvested by centrifugation at
1000 g for 10 minutes. The cells were then resuspended in 15 ml of M9 minimal
media and incubated at 37°C 200 rpm for 30 minutes. The cells were then added
to the 1 litre flasks, which were incubated at 37°, 180 rpm until the OD at 595 nm
reached 0.6 – 0.8. Protein expression was then induced by addition of 1 ml of 1 M
IPTG per litre. The remainder of the expression and purification protocol was
identical to that for LB growths.
To produce samples with both 15
N and 13
C labelling, the 4 g of glucose was
replaced with 2 g of 13
C labelled glucose. The growths normally required an
additional 2 hours before induction (until an O.D. of approximately 0.6 was
reached) to compensate for the lower glucose concentration.
3.13 Test Growths
10 ml growths were used as a small scale test for successful induction of protein
expression and solubility. 10 ml of LB in a universal was inoculated with BL21
(DE3) cells containing the relevant protein construct. The appropriate antibiotic
control (normally kanamycin at 30 µg/ml) was added to these. These test growths
were incubated at 37ºC. When the O.D. of the growths reached 0.6 a 1 ml SDS-
PAGE gel sample was taken, and the growths were induced with 10 µl 1 M IPTG.
Test inductions were carried out at multiple temperatures (e.g. 37°C, 30°C and
25°C) to determine the optimum conditions for overexpression of soluble protein.
1 ml SDS-PAGE samples were then taken at intervals so the levels of protein in
the soluble and total fractions could be monitored.
These SDS-PAGE samples were prepared by resuspending the cells in 300 µl of
buffer A and sonicating them for 10 seconds, followed by a 10 second break on
ice, followed by a final 10 seconds of sonication. 20 µl gel samples were taken

60
from this total fraction, and the remainder was centrifuged at 13,000 g for 10
minutes to pellet all insoluble proteins. 20 µl of the supernatant was then taken
from the soluble protein fraction. SDS-PAGE was carried out as specified in
section 3.14 to determine the most suitable temperature and duration to maximise
the yield of soluble protein.
3.14 SDS-PAGE Gels
Approximate quantities and molecular weights of proteins in samples at various
stages in the purification were determined using a Min-Protean®3 SDS-PAGE
system (BioRad). 15% polyacrylamide gels were used for the t242, t187 and
isolated RRM constructs. 20% gels were used for RRM123, wild type CELF1
and PARN deadenylase. The 15% resolving layer was prepared from 1.7 ml 30%
protogel, 0.85 ml 1.5 M Tris.HCl pH 8.8, 0.034 ml 10% m/v sodium dodecyl
sulphate (SDS), 0.816 ml MilliQ water. Immediately before pouring 40 µl of 100
mg/ml ammonium persulfate and 10µl TEMED were added to start the
polymerisation reaction. The stacking gel was prepared from 0.266 ml 30%
protogel, 0.5 ml 0.5 M Tris.HCl pH 6.8, 0.02 ml 10% SDS, 1.21 ml MilliQ water.
30 µl of 100 mg/ml ammonium persulfate and 10 µl TEMED were added
immediately prior to pouring the gel. The stacking layer was added over the
resolving layer once it had set and was cast around a Teflon comb to form ten
sample wells, each with a volume of approximately 12 µl.
Samples were prepared by adding 0.5 sample volumes of loading buffer (100 mM
Tris, pH 6.8, 4% SDS (w/v), 0.2% bromophenol blue (w/v), 20% glycerol (v/v),
200 mM DTT), and heating for 5 minutes at 90ºC. 10 µl of sample was then
loaded into the sample wells. 5 µl of low molecular weight markers (either Sigma
Low Range Markers or Novex Prestained Protein Standard (Invitrogen)) were run
in one lane of each gel as a reference. The mass of each protein in the reference
markers is listed in the table below.

61
Sigma Low Molecular Weight Markers:
Protein Mass (kDa)
Albumin 66
Ovalbumin 45
Glyceraldehyde-3-Phosphate Dehydrogenase 36
Carbonic Anhydrase 29
Trypsinogen 24
Trypsin Inhibitor 20
α-lactalbumin 14.2
Apoprotinin 6.5
A Biorad SDS-PAGE kit was used to run the gel in SDS buffer (25 mM Tris,
0.25 M glycine, 0.1% v/v SDS). Gels were run at 180 V for approximately 1
hour. Coomassie Brilliant Blue protein stain was used to stain gels (0.25% w/v
Brilliant Blue R-250 (Fisher) 45% v/v methanol, 10% v/v glacial acetic acid) for
1 hour. Destaining was carried out with a mix of 10% v/v glacial acetic acid and
25% v/v methanol, over the course of at least 24 hours. Images of the gels were
collected using a Syngene gel documentation system.
3.15 Molecular Biology
3.15.1 Plasmids
Both the pET28 and pET33 vectors (Novagen) are based on the system developed
by Studier et al163, 164, 165
. This encodes a T7 promoter sequence upstream of a
multiple cloning site (MCS) into which the gene to be expressed can be cloned.

62
This T7 promoter is specific to the bacteriophage T7 RNA polymerase, which is
not found elsewhere in prokaryotes. The plasmid also encodes the lac repressor
protein, a lac operator and an antibiotic resistance gene (in both of these vectors
this is kanamycin resistance). Expression of the gene of interest can only occur if
the T7 RNA polymerase is present, and the lac operator is not being repressed.
The strain of host cells used throughout was BL21 (DE3), which incorporate the
gene for T7 RNA polymerase, again after a lac operator. The lac operators
therefore repress both the expression of the T7 RNA polymerase in the bacterial
chromosome and the expression of the gene of interest in the pET vector. The lac
operator is only represses these genes in the absence of allolactose (a metabolite
of allolactose). Expression of the proteins is induced by the addition of isopropyl-
thio-β-D-galactoside (IPTG), which mimics allolactose and so activates both of
the genes repressed by lac operators. Once the T7 polymerase is present the
protein of interest is then rapidly expressed.
In both of these vectors the protein of interest is expressed as a fusion with an N-
terminal 6-His-tag. This tag is separated from the protein by a thrombin cleavable
site (LVPRGS) allowing it to be removed if necessary. The tag allows the protein
to be purified by immobilised metal ion affinity chromatography (IMAC), as
explained in section 3.7.
3.15.2 Site Directed Mutagenesis
The required primers were produced by the School of Biomedical sciences,
University of Nottingham. A QuikChange site directed mutagenesis (Stratagene)
was used for the process. The forward and reverse primers were designed to meet
the kit's specification, which was a 25 – 45 bases in length for each primer, a
minimum of 40% G/C content, a melting temperature of at least 78ºC and for the
primer to terminate with at least one G or C base. For the reaction the following

63
reagents were combined in a sterile 0.2 ml thin walled PCR tube (Starlab):
37.5 µl Sterile MilliQ water
5 µl 10x reaction buffer (20 mM Tris.HCl pH 8.8, 10 mM KCl, 10 mM NH4SO4,
2 mM MgSO4, 0.1% Triton X-100, 0.1 mg/ml bovine serum albumen).
2.5 µl DMSO
1 µl template DNA (approximately 50 ng/µl)
1 µl Forward primer (125 ng/µl)
1 µl Reverse primer (125 ng/µl)
1µl dNTPs (10 mM for each nucleotide)
1 µl (3 units) Pfu Turbo DNA polymerase (added last).
The PCR tube was then transferred to the PCR thermocycler block and run for 18
cycles of 30 seconds at 95ºC, 30 seconds at 55ºC, 30 seconds at 68ºC. The 95°C
step denatures the template DNA, separating the two strands. The 55°C step
allows the primers to anneal to their complementary sections in the template
DNA. To optimise the reaction the annealing temperature sometimes required
adjusting in the 50 – 60°C range. The 72°C step is a suitable temperature for the
DNA polymerase to extend the primers.
The remaining parental template DNA was digested with 1 µl (10 units) DpnI
endonuclease (New England Biolabs) at 37ºC for 1 hour. DpnI selectively cleaves
methylated DNA. This step is necessary as this DNA will not contain the point
mutation, but will still provide antibiotic resistance when transformed into cells.
In all cases the template DNA was extracted from XL1 Blue E. Coli cells and was
therefore methylated. DNA generated by the PCR is not methylated, and so is not
digested by the DpnI. The PCR product was transformed into XL1 Blues using
the protocol in section 3.15.9.

64
3.15.3 Cloning
Template DNA containing the gene to be cloned was extracted from XL1 Blues
using a Qiagen Spin Miniprep kit. The primers for production of the isolated
RRM2 construct were designed so that the forward primers contained the HindIII
restriction site at the 5’ end of the gene, while the reverse primers contained the
NheI restriction site at the 3’ end of the gene. A PCR of the insert was then
carried out by combining 1 µl of template DNA, 1 µl forward primer, 1 µl reverse
primer, 1 µl dNTPs, 5 µl reaction buffer (New England Biolabs buffer B as the )
and 40 µl sterile MilliQ water were mixed in a 0.2 ml thin walled PCR tube. 1 µl
of TAQ polymerase was then added, and the tube transferred to a PCR machine.
This was heated to 95ºC for 2 minutes to denature the DNA, and then underwent
30 cycles of 30 seconds at 95ºC, 30 seconds at 60ºC and 30 seconds at 72ºC to
amplify the insert.
The PCR product was digested with 1 µl Dpn1 for 1 hour at 37ºC. A PCR
purification kit (Qiagen) was used according to the manufacturer’s instructions to
purify the insert, which was then purified further by running on a 1% w/v agarose
gel. The section of the gel containing the insert DNA was then excised from the
agarose gel using a sterile scalpel, and the DNA extracted using a Qiagen gel
extraction kit. The vector DNA was prepared by growing a 15 ml overnight cell
culture of XL1 Blues containing a “blank” pET28b plasmid with no gene present
in the multiple cloning site. This plasmid DNA was extracted using a Qiagen
Miniprep Spin kit.
3.15.4 Restriction Digest

65
For the restriction digest two sterile 0.2 ml thin-walled PCR tubes were used, one
to prepare the insert and the other for the vector. The following reagents were
combined:
Insert:
37.5 µl Insert DNA
5 µl 10x Reaction Buffer B
2.5 µl Sterile MilliQ water
1 µl 50x BSA
2 µl HindIII restriction enzyme
2 µl NheI restriction enzyme
Vector:
32 µl blank pET28 vector DNA
4 µl 10x reaction buffer B
1 µl 50x BSA
2 µl HindIII restriction enzyme
2 µl NheI restriction enzyme
These PCR tubes were then incubated at 37ºC for 3 hours, after which the
enzymes were inactivated by heating to 65ºC for 15 minutes. The vector was then
treated with antarctic phosphatise, in the reaction mixture shown below. During
this process the insert was stored on ice.

66
40 µl Vector DNA
5 µl 10x antarctic phosphatase buffer
4 µl Sterile MilliQ water
1 µl Antarctic phosphatase
The reaction mixture was heated to 37ºC for 10 minutes, and then to 65ºC for 15
minutes to heat inactivate the enzyme. This left the insert and vector with
complementary ends which could be ligated together. The insert and vector were
both visualised and purified on a 1% w/v agarose gel. A deeper gel than usual (42
ml instead of the normal 30 ml) was used to accommodate the larger volume of
DNA. The DNA was extracted from the gel using a Qiagen gel extraction kit
according to the manufacturer’s instructions.
3.15.5 Ligation
A 4:1 ratio of insert to vector DNA was combined in a 0.2 ml thin walled PCR
tube, with 2 µl of 10x ligation buffer (New England Biolabs) and 1 µl T4 ligase
(Promega, 3 units). The total reaction volume was 18 µl. Ligation was carried out
at 16ºC overnight (~16 hours). After this the reaction mixture was heated to 65ºC
for 10 minutes to inactivate the ligase. The ligated product was then transformed
into XL1-Blue cells (using the protocol in section 3.15.9, except that an increased
volume of 5 µl of DNA was added to 100 µl of competent cells), and plated onto
agar. Tetracyclin and kanamycin were used as antibiotic selections.
3.15.6 Production of Deletion Constructs
The RRM3, RRM23 and RRM123 constructs were produced by deletion of
unwanted sections of the CELF1 wild type construct. This used a single step PCR
67
process, as outlined by Qi et al. and Liu et al.166, 167
. The following reagents were
combined in a 0.2 ml thin-walled PCR tube.
37.5 µl sterile MilliQ water.
5 µl 10x Reaction Buffer
2.5 µl DMSO
1 µl dNTPs
1 µl Template DNA (in this case full length CELF1 wild type)
1 µl Forward Primer
1 µl Reverse Primer
1 µl (3 Units) Pfu Phusion DNA Polymerase (Promega)
The thermocycler program used was as follows:
1 Cycle:
5 minutes at 95°C (Initial denaturation of the DNA)
18 Cycles:
1 minute at 95°C (Denaturation)
2 minutes at 68°C (Annealing of the non-overlapping sections of the primers)
12 minutes at 72°C (Extension step, lasting 1 minute per 500 bases in the DNA
template)
1 Cycle:
2 minutes at 60°C (Annealing of the complimentary sections of the primers)
30 minutes at 72°C (Final elongation step)
1 µl DpnI was then added, and the reaction mixture was incubated at 37°C for 2
hours to break down any remaining methylated template DNA. The PCR product

68
was then visualised by agarose gel to confirm amplification. As all PCRs using
this method deleted several hundred bases from the construct, the size difference
between the PCR product and template on the agarose gel provided an indicator
of whether the deletion was successful. The PCR product was then transformed
into XL1 Blue cells using the protocol in section 3.15.9. If the reaction was
successful the cells had resistance to the antibiotic, and formed colonies on the
LB agar plate.
3.15.7 Sequencing
PCR products and cloned plasmids were sequenced using the Sanger method168
by the School of Biomedical Sciences, Queens Medical Centre, Nottingham. 5 µl
DNA samples with concentrations of approximately 100 ng/µl were supplied,
with 5 µl of forward and reverse primers where appropriate. The T7 promoter
primer (TAA TAC GAC TCA CTA TAG GG) was used for sequencing all
constructs in the pET28 vector. The program Chromas 2.21 (Technelyesium) was
used to view sequencing results.
3.15.8 Production of Calcium Competent Cells
15 ml of LB containing 12.5 µg/ml of tetracycline was inoculated with XL1
blues, and incubated at 37ºC for 16 hours. After 16 hours 200 µl of this culture
was transferred to a second universal of 10 ml LB with 12.5µg/ml of tetracycline.
This was again incubated at 37ºC until the OD reached approximately 0.3. The
cells were then centrifuged at 1000 g for 15 minutes, and the supernatant
discarded. 4 ml of sterile, chilled 50 mM CaCl2 was then used to resuspend the
cells, after which they were stored on ice for a minimum of 2 hours.

69
3.15.9 Transformation
After at least 2 hours on ice the cells were centrifuged at 1000 g for 15 minutes,
and resuspended in 800 µl of chilled, sterile 50 mM CaCl2 before being returned
to the ice bath for another 30 minutes. These calcium competent cells were
divided into 100 µl aliquots. For transformations using the product of a PCR, 5
µl of DNA was added to an aliquot of calcium competent cells. For
transformations into BL21 (DE3) cells 1 µl of DNA was used. The cells were
heat-shocked by transferring them to a water bath at 42ºC for 30 seconds, after
which they were placed back on ice for 2 minutes. 400 µl of LB was then added
to each aliquot, and these were incubated at 37ºC for 30 minutes. The cells were
then spread onto agar plates with appropriate antibiotic selections, which were
then sealed with Nesco film and incubated overnight at 37ºC. A negative control
plate was produced using an aliquot of cells with no added plasmid DNA, to
confirm the antibiotic control was effective.
The following day colonies were picked and 10 ml overnight cultures inoculated
with them. Glycerol stocks were prepared from these overnights, and DNA was
extracted from the remainder of the cell culture using a QIAprep miniprep kit
(Qiagen) according to the manufacturer’s instructions.
3.15.10 Agar Plates
Agar plates were prepared by dissolving LB-agar (Sigma, 15 g/l agar, 10 g/l
tryptone, 5 g/l yeast extract, 10 g/l NaCl) in MilliQ water at 40 g/l. After
autoclaving, the agar was melted in a microwave and allowed to cool to
approximately 40°C. Any required controls (kanamycin and/or tetracycline) were
sterile filtered through a 0.22 µm filter before addition to the agar. The agar was
then plated onto sterile petri dishes and stored at 4°C. Before use the plates were
transferred to a 37°C incubator for 30 minutes to remove any excess moisture.

70
3.15.11 Agarose Gels
1% w/v DNA gels were prepared by dissolving 0.3 g of agarose in 30 ml Tris
Acetate EDTA (TAE) buffer (40 mM Tris-acetate pH 5.0, 1 mM EDTA), and
then heating the resulting mixture in a microwave until the agarose had melted.
The solution was allowed to cool for 5 minutes, after which 1 µl of ethidium
bromide was added. The gel was then cast in a 7 x 10 cm gel tray (Mini Sub GT
Cell – Biorad), around a comb to create eight 20 µl sample wells. After the gel
had set, it was immersed in TAE buffer (40 mM Tris.HCl, 1 mM EDTA, 20 mM
acetic acid). DNA samples were prepared by adding 2 µl of 6x DNA loading
buffer (Novagen, bromophenol blue) to 10 µl of sample. 2-log DNA ladder
markers (New England Biolabs) were used as a reference, prepared from 1 µl
supplied marker stock, 1 µl 6x loading dye and 4 µl MilliQ water. A potential of
70 V was applied across the gel until the bands had migrated sufficiently to
resolve the different masses. UV light was used to visualize the DNA bands, and
gels were imaged using a Syngene gel documentation system.
When used for purification rather than visualisation of PCR products a deeper gel
was prepared to accommodate the greater volume of sample. 0.42 g of agarose
was dissolved in 42 ml of TAE buffer to prepare a 1% gel. DNA samples were
loaded into adjacent lanes, so they could be excised in a single piece of the
agarose gel.
3.16 NMR Acquisition
All NMR experiments were run on a 600 MHz Bruker Avance spectrometer with
a TXI probe or an 800 MHz Bruker Avance III spectrometer with a QCI probe.
Data processing was carried out using Topspin 2.3 and later 3.0. Standard Bruker

71
pulse sequences were used throughout. Spectra were referenced internally to
trimethylsilylpropionate (TSP) at 0.00 ppm in the 1H dimension.
3.16.1 Data Analysis
An exponential window function with 2 Hz line broadening was applied to all 1D
proton spectra. For 2D spectra zero-filling of up to 2048 points was applied to the
direct and indirect dimensions for data acquired on the 600 MHz spectrometer.
Zero-filling of up to 4096 points was applied to data from the 800 MHz
spectrometer. A sine-squared apodization function and polynomial baseline
correction was applied to both dimensions. CCPNMR versions 1.1.15 and 2.1.2
were used for data analysis.
3.16.2 Sample Preparation
The composition of NMR buffer was 25 mM phosphate, 50 mM NaCl, 10% (v/v)
D2O, pH 7.0 unless otherwise specified. The buffers were prepared using RNase
free water throughout. Lyophilised protein samples were dissolved in 600 µl of
buffer, centrifuged at 13,000 g for 1 minute to remove any insoluble material, and
then transferred to NMR tubes. Protein concentrations were between 400 µM and
1 mM for experiments using the 600 MHz spectrometer and 20 µM – 400 µM for
those at 800 MHz. All RNA substrates were supplied by Dharmacon in a 2'
protected form. Prior to the experiments the RNA was deprotected according to
the supplier's instructions and dissolved in RNase free water to a concentration of
5 mM.
3.16.3 1D experiments

72
Standard Bruker pulse sequences were used in recording all 1D experiments.
Appropriate decoupling was applied when necessary for isotopically labelled
samples. Water suppression was applied using excitation sculpting169
and
WATERGATE pulse sequences170
. The transmitter frequency was set to the
water frequency (~4.7 ppm, 2823 Hz for the 600 MHz spectrometer, 3765 Hz for
the 800 MHz spectrometer).
3.16.4 HSQC Experiments
15N and
13C Heteronuclear single quantum coherence spectra (HSQCs) were
recorded for the smallest construct (RRM2). For larger constructs 15
N transverse
relaxation optimised spectroscopy (TROSY) was used to compensate for loss of
signal from rapid relaxation. RNA titrations used a protein concentration of 400
µM when recorded with the 600 MHz spectrometer, and 250 µM with the 800
MHz spectrometer, except where otherwise specified. RNA was titrated into the
sample until saturation point was reached (determined by no further changes
being observed in the 1H-
15N HSQC/TROSY of the protein over multiple titration
points).
3.16.5 3D Experiments
In order to assign the NH, HN, C' Cα and Cβ of each residue, a series of standard
3D Bruker experiments were used. These included HNCO130
, HN(CA)CO132
,
HNCA131
, HNCACB129
, HN(CO)CACB130, 133
and HCCH-TOCSY138
. These
experiments were conducted on the RRM1, RRM2, RRM3 and t187 constructs,
and also the S28D mutant of RRM1.
t187

73
Experiment Scans 1H
15N
13C Spectral
Widths (ppm)
(1H,
15N,
13C)
AQ Times
(s)
(1H,
15N,
13C)
1H-
15N HSQC 64 2048 64 - F2: 16.02
F1: 32.00
F2: 0.10650,
F1: 0.01644
HNCO 32 2048 64 98 F3: 11.97
F2: 32.00
F1: 25.00
F3: 0.14254,
F2: 0.01644,
F1: 0.01299
HN(CA)CO 256 2048 32 48 F3: 11.97
F2: 32.00
F1: 25.00
F3: 0.14254,
F2: 0.00822,
F1: 0.00636
HNCACB 72 2048 40 64 F3: 11.97
F2: 32.00
F1: 74.96
F3: 0.14254,
F2: 0.01028,
F1: 0.00250
HN(CO)CACB 48 2048 32 128 F3: 11.97
F2: 32.00
F1: 74.96
F3: 0.14254,
F2: 0.00822,
F1: 0.00565
HCCH-
TOCSY
32 2048 64 64 F3: 11.97
F2: 74.96
F1: 12.00
F3: 0.14254,
F2: 0.00283,
F1: 0.00444
RRM1
Experiment Scans 1H
15N
13C Spectral
Widths (ppm)
(1H,
15N,
13C)
AQ Times
(s)
(1H,
15N,
13C)
1H-
15N HSQC 64 2048 64 - F2: 16.02
F1: 32.00
F2: 0.10650,
F1: 0.01644
HNCO 32 2048 64 98 F3: 14.98
F2: 32.00
F3: 0.11387,
F2: 0.01644,

74
F1: 25.00 F1: 0.01259
HN(CA)CO 32 2048 64 98 F3: 14.98
F2: 32.00
F1: 25.00
F3: 0.11387,
F2: 0.01644,
F1: 0.01299
HNCACB 72 2048 40 64 F3: 14.98
F2: 32.00
F1: 85.02
F3: 0.11387,
F2: 0.01028,
F1: 0.00250
HN(CO)CACB 48 2048 32 128 F3: 14.98
F2: 32.00
F1: 85.02
F3: 0.11387,
F2: 0.00822,
F1: 0.00472
HCCH-
TOCSY
32 2048 64 64 F3: 11.97
F2: 74.96
F1: 12.00
F3: 0.14254,
F2: 0.00283,
F1: 0.00444
RRM2
Experiment Scans 1H
15N
13C Spectral
Widths (ppm)
(1H,
15N,
13C)
AQ Times
(s)
(1H,
15N,
13C)
1H-
15N HSQC 64 2048 64 - F2: 16.02
F1: 32.00
F2: 0.10650,
F1: 0.01644
HNCO 32 2048 64 80 F3: 14.98
F2: 32.00
F1: 25.00
F3: 0.14254,
F2: 0.01644,
F1: 0.01060
HN(CA)CO 64 2048 32 80 F3: 14.98
F2: 32.00
F1: 25.00
F3: 0.14254,
F2: 0.00822,
F1: 0.00808
HNCACB 48 2048 40 128 F3: 14.98
F2: 32.00
F1: 84.96
F3: 0.11387,
F2: 0.01028,
F1: 0.00499

75
HN(CO)CACB 48 2048 32 128 F3: 14.98
F2: 32.00
F1: 84.96
F3: 0.11387,
F2: 0.01028,
F1: 0.00499
HCCH-
TOCSY
40 2048 48 64 F3: 11.97
F2: 74.96
F1: 12.00
F3: 0.14254,
F2: 0.00212,
F1: 0.00444
RRM3
Experiment Scans 1H
15N
13C Spectral
Widths (ppm)
(1H,
15N,
13C)
AQ Times
(s)
(1H,
15N,
13C)
1H-
15N HSQC 64 2048 64 - F2: 16.02
F1: 32.00
F2: 0.10650,
F1: 0.01644
HNCO 32 2048 64 80 F3: 14.03
F2: 32.00
F1: 25.00
F3: 0.12165,
F2: 0.01644,
F1: 0.01060
HN(CA)CO 32 2048 64 80 F3: 14.03
F2: 32.00
F1: 25.00
F3: 0.12165,
F2: 0.01644,
F1: 0.01060
HNCACB 40 2048 64 128 F3: 15.02
F2: 32.00
F1: 90.00
F3: 0.11360,
F2: 0.01644,
F1: 0.00471
HN(CO)CACB 32 2048 44 128 F3: 17.96
F2: 35.23
F1: 75.02
F3: 0.09503,
F2: 0.01120,
F1: 0.00499
Assignment of the structured regions of RRM123 and wild type CELF1 were
carried out by comparison with the assignments of the isolated RRMs. With the
exception of residues immediately adjacent to the cut sites of these constructs,
76
there were minimal differences in the chemical shifts, allowing assignments to be
directly transferred.
3.16.6 15N Heteronuclear NOE
Pulse sequences consisting of standard 1H-
15N HSQCs with and without proton
saturation during the relaxation period prior to the initial 15
N pulse were used to
measure the heteronuclear NOE. The experiments were run as interleaved 1H-
15N
HSQCs which were subsequently split into a pair of 1H-
15N HSQCs, one with
proton saturation and one without. The heteronuclear NOE for each residue was
calculated as intensity (with proton saturation)/ intensity (equilibrium). 15
N
heteronuclear NOE data was collected at the start and end points of RNA
titrations to compare flexibility in the free and bound states.
3.16.7 Paramagnetic Relaxation Enhancement
Dipolar interactions with unpaired electrons enhance the relaxation rate of
surrounding nuclear spins. The magnitude of the relaxation enhancement is
related to the distance from the paramagnetic centre. PRE can therefore be used to
obtain additional distance restraints between the paramagnetic centre and the
surrounding nuclei171
. 1H nuclei are the most sensitive to paramagnetic relaxation
enhancement (PRE), with 13
C and 15
N showing only 1/16 and 1/100 of the effect
respectively.
There are various methods for incorporating an unpaired electron spin into
proteins and other macromolecules. One common method is the introduction of
lanthanide 3+
ions coordinated to the protein, normally by substituting for a
naturally occurring metal ion such as Mg2+
. Another method is to couple a small
stable radical group, such as a nitroxide, to the protein. This is generally carried
out by attaching it to a free thiol group in the protein. If no suitable cysteines are

77
naturally present in the protein, this requires site directed mutagenesis to add one
in a suitable location. Proteins with multiple cysteines present may require all but
one mutating to a similar residue (e.g. alanine or serine) in order for the
paramagnetic tag to be attached to one specific site in the protein, which can
present a problem if they are involved in interactions of interest172
.
Similar methods can be used to attach a paramagnetic group to RNA or DNA. In
RNA 4-thiouridine can be incorporated into specific positions in the sequence
which allows MTSL to be attached in a similar reaction to that with cysteines in
proteins. RNAs containing 4-thiouridines at specific positions are commercially
available, and were purchased from Dharmacon.
CELF1 has seven endogenous cysteine residues at positions 61, 62, 119, 137,
150, 172 and 446. Of these 61, 62 and 150 are part of the RNA binding patch, and
have substantially perturbed chemical shifts on binding. Attaching a large
paramagnetic tag to any of these residues would likely disrupt RNA binding.
Selectively attaching a paramagnetic tag to the t187 construct would require
mutating five cysteines to other residues. RRM3 is the easiest construct to attach
the tag to, since it has only a single cysteine residue, and it is not located in the
RNA binding patch.
After completion of PRE titrations the paramagnetic tag was reduced by addition
of a 5 molar excess of sodium L-ascorbate to the NMR sample. 16 hours was
sufficient for full reduction of the tag attached to a cysteine in RRM3. The tag
attached to 4-thiouridine RNA however was only partially reduced after this time.
A final 1H-
15N HSQC was then collected on the reduced sample to confirm the
magnitudes of the PRE effects.
3.17 X-ray Crystallography

78
Crystallization trials of the RRM1 construct unbound and in the presence of the
CUGCUG RNA substrate were conducted using Qiagen crystallization screening
suites. An identical set of trials were also conducted for the S28D mutant of
RRM1. Trials were also run for the RRM123 construct unbound, and in the
presence of the EDEN2U/4U RNA. In all cases these consisted of 96-well
Intelliplate sitting drop vapour diffusion plates, which were loaded using a Matrix
Hydra II micro-dispensing system. No diffraction quality crystals were produced
in any of these trials.
3.18 Size Exclusion Chromatography
An analytical Superdex GF200 column (GE Life Sciences) was used for size
exclusion chromatography. Since this technique was only used in order to
compare the bound complex to the free protein a size calibration curve with
known protein standards was not collected. Samples were dissolved in 1 ml of 50
mM potassium phosphate, 200 mM NaCl, pH 7.0 buffer and injected on the
column. The elution volume of the protein and RNA was detected by the change
in absorbance at 280 nm.
3.19 SAXS
SAXS samples were prepared by dissolving lyophilised protein in 30 mM
potassium phosphate, 100 mM NaCl, pH 7.0 buffer. RNA was added from a 5
mM stock to a 1:1 ratio to produce the samples of the complex. The samples of
the protein-RNA complex were then loaded onto a Superdex 200 gel filtration
column in order to separate the complex from any remaining unbound protein or
RNA. This step was essential in order to ensure the SAXS sample was
monodisperse. The sample was then transferred to a 3000 MWCO centrifugal
concentrator and concentrated to 5 mg/ml. The sample concentration was checked

79
by the 280 nm absorbance using a Nanodrop ND-100 spectrophotometer. Once at
a concentration of 5 mg/ml samples were frozen using liquid nitrogen and stored
at -80°C. A range of concentrations for SAXS data collection was produced by
dilution of this concentrated stock.
3.20 ITC
Isothermal titration calorimetry (ITC) was carried out using a VP-ITC high
sensitivity microcalorimeter (manufactured by MicroCal Inc, GE Healthcare).
The instrument was controlled using VPViewer2000 version 1.4.27 (MicroCal).
The ITC cell was cleaned by addition of Decon90 to the cell for 10 minutes,
followed by washing through a minimum of 500 ml of MilliQ water. The syringe
was also cleaned by washing through 500 ml of MilliQ water. A titration of water
into water was carried out prior to each experiment to confirm the machine was
free of contamination and that the baseline was stable. All solutions were
degassed for 10 minutes in a Thermovac (MicroCal) before loading. For reverse
titrations the cell was filled with 1.4 ml of 25 µM RNA dissolved in RNase free
water. 300 µl of 250 µM protein, also dissolved in RNase free water, was loaded
into the syringe. In experiments involving the RRM123 construct the cell
concentration was reduced to 12.5 µM, and the syringe concentration to 125 µM.
All titrations were carried out at 25°C. After an equilibration period of 20
minutes, 30 injections of 10 µl were added at 600 second intervals. A constant
stirring speed of 300 rpm was applied throughout the titration to rapidly mix the
contents of the cell.
A reference power of 5 µcals-1
was used except where otherwise specified. Fitting
of the resulting data was carried out using the Origin 7.0 fitting program,
assuming a single site binding model from which ΔH, ΔS, Kd and the
stoichiometry for the interaction could be determined. For traces where a one site
model was not appropriate, such as those showing multiple binding events, a fit to
a multi-site binding model was attempted instead. Baseline correction was

80
necessary for some datasets.
3.21 Mass Spectrometry
All ESI mass spectra were collected on a Waters SYNAPT instrument with a
quadruple time-of-flight mass analyzer calibrated using horse heart myoglobin.
Data acquisition and analysis was carried out using Masslynx (Waters) software.
All proteins required an additional desalting step to reduce salt to levels suitable
for ESI mass spectrometry. This second desalt was carried out into 50mM
ammonium acetate, in which the HiTrap desalting column had been pre-
equilibrated. All proteins were run as native rather than denatured samples so that
binding activity could be observed. Sample was injected at 5 µl/minute using a
Harvard Apparatus automatic syringe pump and a 100 µl Hamilton syringe. The
capillary voltage was 2.80 kV. The sample cone voltage was 30 V. Unbound
protein samples were run in positive ion mode, bound protein/RNA complexes
were run in both positive and negative ion mode. Data acquisition was carried out
over 3 minutes at 1 scan/second and combined. Data was acquired over an m/z
range of 500 – 5000.
3.22 Molecular Modelling
All hydrogen atoms for both the protein and RNA were introduced to the PDB
files, using XLEAP. Na+ ions were also introduced to give an overall neutral
charge (all protein/RNA systems modelled otherwise had an overall negative
charge due to the RNA phosphate backbone). TIP3P water was used as an explicit
solvent, and was added in a truncated octahedron geometry to a distance of 9 Å
around the protein. Energy minimisation was carried out using the SANDER
modules of the AMBER program. Energy minimisation was conducted in three
stages. The first step minimised the water molecules only, by applying a restraint
mask with a force constant of 200 to all other atoms in the system. The second
stage minimised the water and Na+ ions added to achieve an overall neutral

81
charge for the system, by restricting the restraint mask to the atoms of the protein
and RNA only. The third step minimised the entire system, with no restraint
mask. Each step included an initial minimisation by the steepest descent method,
lasting for 50 cycles, followed by conjugate gradient minimisation for up to a
maximum of 5000 cycles. Molecular dynamics simulations consisted of an initial
10 ps step at 100 K, followed by a temperature ramp to 300 K over a further 10 ps
with a restraint mask of weight 200 applied to the protein and nucleic acid. The
force constant of the restraint mask was then reduced to zero in seven stages (100,
50, 25, 10, 5, 2, 1) of 10 ps each. The final step of the molecular dynamics
simulation was at 300 K with no restraint mask, and allowed to run for a
minimum of 1 ns. The resulting models were viewed using Pymol.
Three crystal structures were used as starting points for constructing models: the
structure of RRM3 in complex with the RNA sequence UGUGUG by Tsuda et al.
(PDB ID: 2RQC), the structure of two RRM1 proteins in complex with the
sequence GUUGUUUUGUUU by Teplova et al. (PDB ID: 3NNH), and the
structure of the two N-terminal RRMs with RRM2 bound to the RNA sequence
GUUGUUUUGUUU, also by Teplova et al. (PDB ID: 3NMR).
The first model to be constructed was of the two N-terminal domains (the t187
construct) in complex with the RNA sequence UGUUUUGU. The RNA in the
structure of bound RRM1 (3NNH) was truncated to the sequence UUGU, leaving
a single RRM1 protein bound to a UGU site. The second RRM1 protein was
removed. The residues of the remaining RRM1 protein were then superimposed
onto the RRM1 section of the protein in structure 3NMR, minimising RMSD for
the protein. Replacing the atom coordinates of the RRM1 section of the protein in
structure 3NMR with those from the superimposed RRM1 from structure 3NNH
combined the two structures, resulting in a single protein of residues 14 - 187 of
CELF1, with a fragment of RNA containing a UGU(U) site bound to each
domain. Residues 1 – 13 are not included in any crystal structure, and since they
were not believed to be involved in RNA binding they were omitted. The RNA
82
molecule bound to RRM2 in this structure was truncated to the core UGUU
sequence in contact with the protein.
The RNA fragments UGUU (bound to RRM2) and UUGU (bound to RRM1)
were then connected to form the RNA UGUUUUGU. Due to the orientation of
the two domains in the original 3NMR structure this required the introduction of
an implausibly long bond connecting the two RNA fragments in this initial
structure. The energy minimisation step detailed earlier allowed the protein
domains and RNA to shift until this bond had relaxed to a normal length.
Molecular dynamics simulations were then conducted from this starting point,
using the temperature ramps specified earlier.
This structure served as the N-terminal fragment for later models containing all
three RRMs of the protein. Since no structural data exists for the RRM2 – RRM3
linker region a section of the RRM123 protein consisting of residues 186 - 216
was constructed in the program XLEAP, and then energy minimised in AMBER.
This linker was then attached to the N-terminal fragment by superimposing
residues 186 and 187 of the linker onto their counterparts in RRM2 of the N-
terminal fragment (minimising RMSD). The C-terminal fragment was similarly
attached by superimposing residues 215 and 216 of the RRM3 structure onto the
corresponding residues in the RRM2 - RRM3 linker. Combining the atom
coordinates from the PDB files resulted in a complete RRM123 protein with two
separate RNA fragments, UGUUUUGU bound to the N-terminal domains and
UGUGUG to RRM3. This model was energy minimised, and underwent
molecular dynamics simulations in AMBER for 1 ns at 300 K.
To produce the complex with the EDEN-2U/4U RNA the fragment bound to
RRM3 was truncated to the UGU site. A section of RNA consisting of the
sequence UUUUUU was constructed in XLEAP, energy minimised in AMBER,
and attached to the RRM3 fragment by superposition of the 3’ uracil with the 5’

83
uracil of this UGU site. The 5’ uracil of this RNA spacer was then superimposed
onto the 3’ U of the N-terminal bound UGUUUUGU fragment, which
necessitated the introduction of implausibly long bonds into the RNA backbone
to make this connection. This structure, corresponding to RRM123 in complex
with EDEN-2U/4U with the domains arranged in the order 2 – 1 – 3, was energy
minimised over five steps, with a restraint mask applied to the protein and RNA.
The force constant of this restraint mask was reduced (from 200 to 100, 50, 10
and 1) allowing all bonds to relax slowly to normal lengths. The structure was
then subjected to molecular dynamics simulations in AMBER for 2 ns. A model
of the same complex, but with the RRMs in the order 3 – 2 – 1 was also
constructed by the same method.
Models of RRM123 in complex with the EDEN-2U/HL RNA sequence were also
constructed. The RNA hairpin (consisting of the sequence
UCCCGAGGACGGGU folded to form hydrogen bonds between the bases in
italics) was constructed in XLEAP, and energy minimised. The 5’ and 3’ uracils
were then superimposed onto U9 and U12 respectively of EDEN-2U/4U in the
complex of this RNA sequence with RRM123. U10 and U11 of the EDEN-
2U/4U sequence were then deleting, leaving an overall RNA sequence matching
EDEN-2U/HL. The model then underwent energy minimisation and a 2 ns
molecular dynamics simulation.

84
4 RNA Interactions of the Isolated RRMs of CELF1
Our initial aim was to produce constructs of each of the three RRMs of CELF1 in
isolation, and assign their NMR spectra. The smaller size of these constructs
made them more amenable to some biophysical techniques, in particular NMR.
They were also far less prone to degradation than the full length CELF1 protein,
and were considerably more soluble in buffers with low salt concentrations.
Knowing the minimum RNA sites for binding of each RRM made it easier to
design sequences to bind the full length protein, and understand the role of each
RRM in recognising the EDEN motif.
Consensus sequences for CELF1 from the literature provided a starting point.
UGUUUGUUUGU (the EDEN11 GRE) and UGUUUGUUUGUUUGUU (the
EDEN15 GRE) have been suggested as possible targets for wild type CELF1.
Long UG repeating sequences had also been suggested as possible targets. From
this it has been hypothesised that each domain is recognising a UGU, UGUU or
UGUG site. We therefore aimed to determine the minimum site required for
binding of each of the three domains of CELF1.
CELF1 was originally noted to bind to a long repeating CUG RNA, hence its
original name of CUG-BP1, before it was discovered to bind UG rich sequences
such as the GRE with a higher affinity. Even though CUG sequences were known
to be relatively low affinity substrates they were still of interest due to the
possibility of them binding to CELF1 in DM1 cells. We therefore also aimed to
identify the binding sites on the protein for CUG sequences to determine if they
overlapped with the sites for UG rich sequences and so whether there would be
competition between these RNAs.

85
4.1.1 Purification of RRM1
The RRM1 construct was produced by making a single point mutation in a
plasmid of CELF1 in the pET28b(+) vector, which was supplied by Dr Emilie
Malaurie (University of Nottingham). This altered the codon for Asn102 to a stop
codon, truncating the protein and leaving only residues 1 - 101 attached to the N-
terminal 6-His tag. The stop codon was placed at this position as it was in a
flexible section of the linker between RRM1 and RRM2, and four residues after
the C-terminus of the structured RRM1 domain. DNA sequencing confirmed that
the point mutation was successful.
The plasmid DNA was transformed into BL21 (DE3) cells for expression. RRM1
was found to be soluble in lysis buffer A, with the vast majority of the protein
remaining in the soluble fraction after a 16 hour induction at 30°C. These cells
were lysed by sonication and the protein was allowed two hours to bind to an
IMAC cobalt resin column. Washing and elution steps were carried out according
to the protocol in section 3.7. After a thrombin cleave step to remove the N-
terminal 6-His tag, the protein was gel filtered using a Superdex GF75 column to
remove trace impurities. Finally the protein was desalted, frozen with liquid N2
and lyophilised to produce pure protein. The mass and purity of the protein at
each stage was checked using SDS-PAGE, an example of which is shown in
Figure 4.1. The overall yield was approximately 25 mg/l of RRM1 for growths in
LB, and 14 mg/l for M9 minimal media.

86
Figure 4.1: SDS-PAGE of samples from the IMAC column stage of the RRM1 purification. Standard
molecular weight markers (Sigma) are shown in lane 1. Lane 2 contains a diluted sample of the cell lysate
drained from the IMAC column after the His-tagged proteins had been allowed to bind. Lanes 3 and 4
contain samples from the two wash steps, both of which eluted significant quantities of RRM1 as well as
non-specifically binding proteins. To reduce this loss of protein the NaCl concentration in the high salt
wash was reduced to 1 M and the imidazole concentration in the low imidazole wash was reduced to 1
mM in later purifications. Lanes 5 – 9 contain samples from the high imidazole elution fractions. These
five fractions were retained for gel filtration to remove the impurities visible on the gel (particularly in
fractions 1 – 3).
Once the unlabelled material was confirmed to be intact and correctly folded
based on the dispersion of peaks in the 1D proton NMR spectrum, 15
N labelled,
and doubly labelled (15
N and 13
C) RRM1 was produced so the 1H-
15N HSQC of
the protein could be collected and assigned.
4.1.2 NMR Assignment of RRM1
The RRM1 construct has 101 residues, of which 9 are prolines which have no
backbone amide protons and hence no signals in the 1H-
15N HSQC. There are six
additional residues (GSHMAS) remaining at the N-terminus from the 6-His-tag

87
after thrombin cleavage. A very poor signal to noise ratio was observed in the 1H-
15N HSQC for residues in this region of the protein, and in most cases no
corresponding signals in the 3D spectra could be located. This can be attributed to
the N-terminus of the protein being sufficiently dynamic to adopt a range of
conformers in solution, each with slightly different chemical shifts for these
residues, broadening the peaks. Example data from the HNCACB and
HN(CO)CACB spectra used for assignment is shown below.
Figure 4.2: This figure shows strips through the three dimensional HNCACB and HNCOCACB data for residues 59 – 66 of the RRM1 construct. Peaks in the HN(CO)CACB spectra are shown in green. Peaks from the HNCACB spectra are shown in light and dark blue. Negative phase peaks, corresponding to Cβs (and Cαs of glycines) are in dark blue. Positive phase peaks, corresponding to the Cαs of all residues except glycines are shown in light blue. In each strip the peaks are labelled, showing the matching chemical shifts between residue i and residue i-1. The black lines show the “backbone walk” through this section of the protein.
Of the 92 non-proline residues in RRM1 itself, 90 were assigned to peaks in the
1H-
15N HSQC. Assignments are missing for Met1 and Asp12, as well as the

88
remaining residues from the 6-His tag. Asp12 is situated between prolines 11 and
13, preventing the normal 3D heteronuclear assignment strategy from being used.
The assignment of RRM1 is shown in Figure 4.3.
Figure 4.3: Assignment of the 1H-
15N HSQC of RRM1 (residues 1 - 101). There are some additional peaks
from side chain NH2 groups visible in the upper right region of the spectrum, which have not been
assigned. Chemical shifts for all assigned residues are tabulated in the appendix.
Figure 4: Histogram comparing the chemical shifts in Jun et al.’s available assignments with our assignments. Difference is calculated using the same method as for chemical shift perturbations, as outlined in section 2.2. Our data is for Xenopus CELF1, while Jun et al.’s data is for human CELF1. Residues which are not conserved between these homologs are highlighted with black arrows. Gaps indicate residues for which assignments are not available in one or both of the datasets.

89
There is generally good agreement between our assignments and those of Jun et
al. The largest discrepancies are for residues 15, 16, 26 and 31 which are all
either not conserved between these constructs, or directly adjacent to a non-
conserved residue. Lys101 also shows a large difference, but this is to be
expected as it is the C-terminal residue in this construct, as opposed to being in
the middle of Jun et al.’s construct.
4.1.3 Purification of RRM2
The RRM2 construct was produced by PCR amplification of the DNA for
residues 108 - 187 of Xenopus CELF1 using the primers specified in section 11.1.
This insert was then cloned into the Xho I/Hind III sites of the multiple cloning
site of the pET28b(+) vector (Novagen) and transformed into E. Coli XL1 Blue
cells. As with RRM1 the construct is expressed with an N-terminal 6-His-tag,
cleavable with thrombin, to allow purification using IMAC. After sequencing had
confirmed the sequence of the RRM2 construct was correct, the plasmid DNA
was transformed into E. Coli BL21 (DE3) cells for expression of the protein. Test
growths and inductions confirmed RRM2 was successfully overexpressed, and
remained in the soluble fraction after a 16 hour induction at 30°C.
Large scale expression and purification of RRM2 was carried out using the same
protocols as for RRM1. Since the RRM2 construct contains no tryptophan or
tyrosine residues it has almost no absorbance at 280 nm. Protein containing
fractions at the gel filtration and desalting steps therefore had to be identified by
SDS-PAGE. 15
N and 13
C/15
N isotopically labelled protein was produced for NMR
assignment and characterisation.
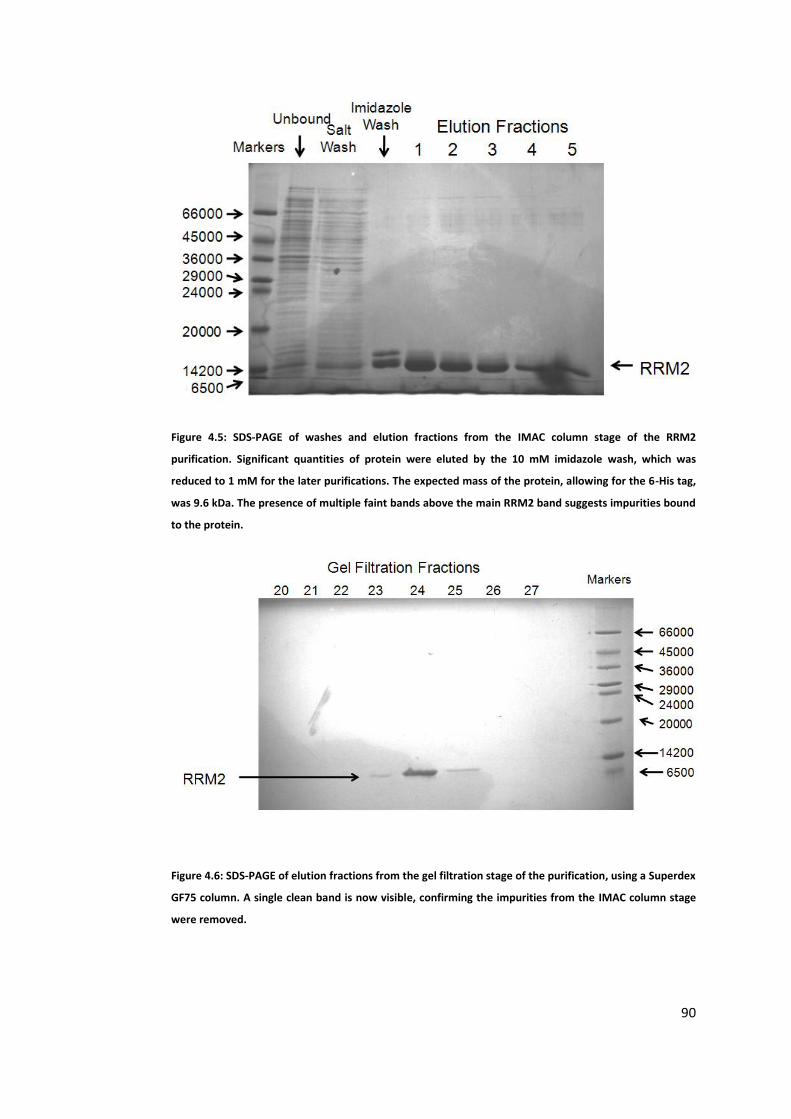
90
Figure 4.5: SDS-PAGE of washes and elution fractions from the IMAC column stage of the RRM2
purification. Significant quantities of protein were eluted by the 10 mM imidazole wash, which was
reduced to 1 mM for the later purifications. The expected mass of the protein, allowing for the 6-His tag,
was 9.6 kDa. The presence of multiple faint bands above the main RRM2 band suggests impurities bound
to the protein.
Figure 4.6: SDS-PAGE of elution fractions from the gel filtration stage of the purification, using a Superdex
GF75 column. A single clean band is now visible, confirming the impurities from the IMAC column stage
were removed.

91
The overall yields for this protein were lower than for RRM1 at approximately 12
mg/l from LB growths, and 8 mg/l from M9 minimal media. Due to the lack of
absorbance at 280 nm protein concentrations when preparing samples were based
on the mass of the lyophilised protein, as measured on a balance accurate to 0.1
mg.
4.1.4 NMR Assignment of RRM2
The TROSY technique was not used for NMR data collection on RRM2 since its
small size (9.6 kDa) results in minimal loss of signal intensity from relaxation,
and a conventional HSQC has twice the inherent sensitivity. Doubly labelled
RRM2 was prepared, and 3D NMR data collected for assignment purposes.
HN(CA)CO, HNCO, CBCANH and CBCA(CO)NH spectra were acquired on a 1
mM sample of 13
C and 15
N labelled RRM2. HCCH TOCSY data was also
acquired for the purpose of side chain assignment.

92
Figure 4.7: This figure shows strips through the three dimensional HNCACB and HNCOCACB data for residues 147 – 154 of the RRM2 construct. Peaks in the HN(CO)CACB spectra are shown in green. Peaks from the HNCACB spectra are shown in light and dark blue. Negative phase peaks, corresponding to Cβs (and Cαs of glycines) are in dark blue. Positive phase peaks, corresponding to the Cαs of all residues except glycines are shown in light blue. In each strip the peaks are labelled, showing the matching chemical shifts between residue i and residue i-1. The black lines show the “backbone walk” through this section of the protein.
Based on the 3D heteronuclear data 98% percent of the backbone amide signals
were assigned. Assignments were determined for all non-proline residues except
Ser178. As with RRM1 there are additional signals from the remainder of the 6-
His tag left after the thrombin cleave, which were not assigned. The assignment
of RRM2 is shown in Figure 4.8.

93
Figure 4.8: Assignment of the 15
N TROSY spectrum of RRM2 (residues 108 – 187 of CELF1). No assignment
is available for Ser178. Additional peaks from side chain NH2 groups are visible in the upper right region
of the spectrum, which have not been assigned.
The assignments for most residues in RRM2 of human CELF1 were deposited in
the BMRB by Jun et al. (Entry 6121)48
. A comparison of this data with our
assignments is shown in Figure 4.9.

94
Figure 4.9: Histogram comparing the chemical shifts in Jun et al.’s available assignments with our assignments. Difference is calculated using the same method as for chemical shift perturbations, as outlined in section 2.2. Our data is for Xenopus CELF1, while Jun et al.’s data is for human CELF1. Residues which are not conserved between these homologs are highlighted with black arrows. Gaps indicate residues for which assignments are not available in one or both of the datasets (e.g. Val183, which is missing from Jun et al.’s assignments).
While some significant differences are seen, they correspond to residues which
differ between the two constructs, and those in close proximity to them. In those
sections of the protein which are well conserved there is good agreement our
assignments and those of Jun et al.
4.1.5 Purification of RRM3
The RRM3 construct was produced from the wild type CELF1 plasmid DNA
using a single step PCR method which deleted the DNA codons for residues 1 -
384, as outlined in section 3.15.6. This left an N-terminal 6-His tag attached to
RRM3. A sufficiently long N-terminal extension was present in the construct that
its involvement in RNA binding subsequently discovered by Tsuda et al. should
still be possible. Protein expression and purification was carried out using the
same methods as for RRM1 and RRM2. The RRM3 construct does not contain a
tryptophan residue, so the 280 nm absorbance is relatively low, but there are

95
tyrosines present in this RRM. Protein containing fractions from the gel filtration
stage could therefore still be identified by 280 nm absorbance, unlike RRM2.
The expression and purification used the same protocols as for the RRM1
construct. Analysis by SDS-PAGE, which is shown in Figure 4.10, confirmed that
RRM3 was expressed intact.
Figure 4.10: SDS-PAGE of samples from the IMAC column stage of the RRM3 purification. In lane 1 are
reference markers (Novagen). Lane 2 is a diluted sample of the runoff from the IMAC column. Lanes 3
and 4 show proteins eluted in the two wash steps. Lanes 6 – 10 show the first five of the 0.75 M
imidazole elution fractions. RRM3 was found to be relatively pure even at this stage, but was gel filtered
through a Superdex 75 column to remove any trace impurities.
4.1.6 NMR Assignment of RRM3
A 15
N TROSY spectrum was collected, as well as HNCACB, HN(CO)CACB,
HNCO and HN(CA)CO 3D heteronuclear experiments in order to assignment the
protein backbone. The assignment for this domain is shown in Figure 4.12. The
flexible residues at the N-terminus resulted in very weak signals in the NMR
spectra, hindering assignment of this region. 90% assignment of the backbone of
the structured domain was achieved.

96
Figure 4.11: This figure shows strips through the three dimensional HNCACB and HNCOCACB data for residues 437 – 444 of the RRM1 construct. Peaks in the HN(CO)CACB spectra are shown in orange and green. Orange peaks correspond to Cαs in the preceding residue, while green peaks correspond to Cβs. Peaks from the HNCACB spectra are shown in light and dark blue. Negative phase peaks, corresponding to Cβs are in dark blue. Positive phase peaks, corresponding to the Cαs are shown in light blue. In each strip the peaks are labelled, showing the matching chemical shifts between residue i and residue i-1. The black lines show the “backbone walk” through this section of the protein.
Assignments are missing for five residues in the flexible N-terminal extension,
Gly395 and for residues 481 - 484 at the C-terminus.

97
Figure 4.12: Assignment of the RRM3 1H-
15N HSQC spectrum. The numbering scheme refers to the residue
number in full length CELF1. There are a number of peaks which could not be assigned due to poor signal
to noise in the 3D spectra, and the limited peak dispersion in some regions of the 1H-
15N HSQC.
Chemical shift data was subsequently deposited by Tsuda et al. in the BMRB
(Entry 11408)49
. A histogram showing the differences between these assignments
and ours is shown in Figure 4.13.

98
Figure 4.13: Histogram comparing the chemical shifts in Tsuda et al.’s available assignments with our assignments. Difference is calculated using the same method as for chemical shift perturbations, as outlined in section 2.2. The constructs used were not identical, and residues which differ between them have been highlighted with black arrows.
A good agreement is seen between our assignments and those of Tsuda et al. with
the exception of residue 433, which is not conserved, and the terminal residues
(due to the constructs being of different lengths, and the incorporation of non wild
type residues at the C-terminus of Tsuda et al.’s construct).
4.2 Interaction of CELF1 RRMs with Guanine-Rich Elements
With the vast majority of the residues in each RRM assigned it was possible to
determine by NMR whether any given RNA sequence was binding to an RRM,
and the areas of the protein involved in the binding interaction. The highest
affinity RNA substrates reported in the literature were the Guanine Rich Elements
(GREs), consisting of a repeating UGUU pattern of nucleotides. Three or
possibly four repeats of this pattern were suggested to be sufficient to bind all
three RRMs of CELF1 (the EDEN11 and EDEN15 GREs). This seemed to imply
each RRM could be recognising a UGUU site. The RRM fold has however been
known to recognise anywhere from 2 – 8 nucleotides, so potentially a single
99
RRM could be recognising additional nucleotides on either side of the UGUU
repeat. One of the RRMs recognising more than one UGUU repeat would also be
a possible explanation for the fourth conserved UGU site in the EDEN15
consensus sequence reported by Graindorge et al. (2008). High affinity
interactions have also been reported between CELF1 and UGUG repeats. This
could imply that the fourth nucleotide is not involved in binding, and the RRMs
are recognising UGU sites rather than UGUU sites. Alternatively the fourth
nucleotide could be involved in binding, but the protein is tolerant of either U or
G at that position.
In order to distinguish between these possibilities the RNA sequences
UGUUUGU (termed EDEN7) and UGU (EDEN3) were selected for
investigation. If an RRM is recognising more than one UGUU repeat or a four
nucleotide UGU(U/G) site it would be expected either to not bind to the short
UGU substrate, or to show a much smaller binding patch on the surface of the
protein compared to the EDEN7 substrate. If however an RRM was recognising
just a three nucleotide UGU site, it should show the same binding patch on the
protein for both of these RNA substrates.
4.2.1 Interactions of RRM1 with Guanine-Rich Elements
15N labelled RRM1 was titrated with the RNA substrate EDEN7 (UGUUUGU).
Significant chemical shift perturbations (CSPs) were seen for several residues,
confirming that RRM1 does bind to the EDEN7 sequence. Most residues were in
fast exchange, and so their assignments could simply be tracked from point to
point throughout the titration. In Figure 4.14 are shown overlaid spectra of the
unbound protein and the protein bound to RNA. Highlighted are the peaks for
some of the residues which show the greatest perturbation throughout the
titration.

100
Figure 4.14: Overlaid 15
N TROSY spectra for the titration of RRM1 with the RNA substrate EDEN7
(UGUUUGU) The spectrum of the unbound protein is shown in blue, and the fully bound protein in red.
Intermediate titration points are shown as a spectrum. Insets are expanded views of some of the most
affected peaks. Most of the affected residues are in fast exchange, such as Phe19, Gly21, Cys61, Cys62
and Leu85. There are some residues that are in intermediate exchange such as Gln22, for which the peak
from the free form is highlighted, but the bound peak is lost due to broadening. There are also residues in
slow exchange such as Gln93, where both the peak is visible in both the free and fully bound forms, but
not the intervening titration points. This prevents the peak being tracked through the titration, which can
present problems in determining the assignment of the bound form.
While most residues are in fast exchange there are a few, such as Gln22 which are
in intermediate exchange, and so broaden out and are lost in the early stages of
the titration. Additional peaks also grow in during the later stages of the titration
from the bound forms of residues in slow exchange, but the assignment of these
new peaks is in some cases ambiguous due to overlap. It can be stated these
residues are definitely involved in binding the RNA, but the chemical shift
perturbation cannot be quantified unless the corresponding peak from the bound
form can be located. In cases of slow exchange where bound assignments are
unclear a minimum CSP can be stated based on the closest unassigned peak in the
bound spectrum. This is not possible in some intermediate exchange situations as

101
the peak from the bound form may be too broad to observe. Residues in more
dynamic regions of the protein are more likely to fall into this category as they
tended to give weak, broad peaks even in the spectrum of the unbound protein.
The nitrogen chemical shift has a greater dispersion than the proton chemical
shift. When combining the changes in the proton and nitrogen chemical shifts into
a single chemical shift perturbation value (CSP), they must therefore be weighted
so that changes in the proton dimension are not obscured. CSP values were
calculated throughout using the formula below.
CSP = ((∆δN2
10) + ∆δH2)
0.5
Where ΔδN is the difference in chemical shift in the nitrogen dimension between
the saturation point and the zero point of the titration and ΔδH is the
corresponding difference in the proton dimension. The CSP values for each
residue can then be plotted against residue number to show those regions of the
protein that are involved in binding the RNA.

102
Figure 4.15: CSP values for each residue of RRM1 on titration with EDEN7. Residues which are in slow
exchange, for which the values are therefore minimum CSPs rather than exact values, are highlighted in
red. Gaps are due to prolines, unassigned residues and peaks for which CSPs could not be accurately
calculated due to signal overlap.
When RRM1 binds to the EDEN7 RNA substrate, the most perturbed residues are
concentrated in the 18 - 23, 59 - 63 and 93 - 101 regions. While these regions are
far apart in the protein chain they actually form adjacent strands of the β-sheet in
the folded protein, and so represent a single coherent RNA binding patch. This
binding patch can be more easily visualised by mapping the CSP values for each
residue onto the structure of the protein. In this case the CSPs were mapped onto
the relevant part of the CELF1 RRM1 and RRM2 structure produced by Jun et al,
which is available in the PDB (ID: 2DHS). This map of the binding surface is
shown in Figure 4.16.

103
Figure 4.16: CSP maps on the structure of RRM1, produced by truncation of Jun et al.’s NMR solution
structure of the first 187 residues of CELF1 from the PDB. RRM2 has been removed by deletion of
residues 102 – 187. The CSP values have been mapped onto the structure in red: the brighter the red
colour, the greater the magnitude of the CSP. Residues which are definitely affected but do not have
quantified CSP values due to intermediate or slow exchange preventing the peaks from the bound form
being located are shown in yellow. Residues for which no data can be obtained (i.e. prolines and
unassigned residues) are shown in black. This image was produced using the molecular graphics package
Molmol, as were all subsequent CSP maps.
In producing this map, residues with CSP values of less than 0.1 are considered to
undergo no significant change on binding, and are shown in grey. Residues for
which no data is available, specifically the prolines and the unassigned residues
are shown in black. CSP values are displayed as a colour gradient, with bright red
indicating the most affected residues, and dark red indicating lower CSPs.
Residues without quantifiable CSPs due to slow exchange preventing location of
the peak for the bound form are shown in yellow. As slow exchange is associated
with a large difference in chemical shifts between the free and bound forms these
residues are presumably the most disrupted on RNA binding, and would show the
largest CSPs if exact values could be calculated.
From this CSP map, it can be seen that the RNA binding site is across the face of
the β-sheet on the opposite side of the protein to the α-helices. There are also

104
some significantly perturbed residues in the loops at the lower edge of the β sheet
as shown in Figure 4.16, such as Gln22. The most affected residues, such as
Cys61 and Gly21 lie in the classic RNP regions in β-sheets 1 and 3. The
conserved aromatic residues in the RNP regions (Phe19 and Phe63) are also
affected. This is consistent with them forming stacking interactions with the RNA
bases, as is commonly seen for RRMs. Some residues near the C-terminus (e.g.
Asp98) appear to be involved in RNA binding despite being beyond the folded
region of RRM1. It was not clear whether this was an artefact caused by the
position at which the protein was truncated, or if some residues beyond the C-
terminus of the structured domain are in fact involved in binding.
It was noted that this titration seemed to reach saturation rather earlier than would
be expected for simple 1:1 binding, based on the point at which the 15
N TROSY
spectrum ceased to vary significantly between titration points. Very few changes
in chemical shift were seen after a 0.6: 1 ratio of RNA to protein was reached.
Examples of the titration curves for some of the most affected residues, such as
Gly21 and Cys61 are shown in Figure 4.17.

105
Figure 4.17: Chemical shift perturbations at each titration point for a selection of the most affected
residues for which CSPs can be calculated throughout the titration. The protein concentration was 500
µM. All reach an apparent plateau before an RNA concentration of 500 µM is reached.
Since the protein concentration in this experiment was 500 µM, in a 1:1 model
the titration would not be expected to reach saturation before this concentration of
RNA was reached. A possible explanation for this was that the complex being
formed did not have a simple 1:1 stoichiometry. If RRM1 is recognising a UGU
site then the EDEN7 RNA used (UGUUUGU) potentially had two identical
binding sites. This would permit a 2:1 protein to RNA complex to form, resulting
in all of the protein being in the bound form after a 0.5:1 ratio of RNA to protein
was reached.
The titration was repeated with the EDEN3 (UGU) RNA substrate. The protein
concentration for this titration, and all further titrations with RRM1, was reduced
to 400 µM.

106
Figure 4.18: Above is a histogram of chemical shift perturbations for the titration of RRM1 with UGU. The assignment for the bound peak of Gln22 was unclear, so a minimum CSP estimate to the closest unassigned peak has been included for this residue. Below is the CSP map for the titration of RRM1 with EDEN3 (the trinucleotide UGU). The protein concentration was 400 µM, and the titration was conducted at 298 K.
The UGU RNA substrate was still bound by RRM1, with almost all residues in
fast exchange in the NMR titration. Only Gln22 still appeared to be in slow
exchange, and so only has a minimum CSP value. The same residues in the RNP
regions are disrupted, including the aromatic residues Phe19 and Phe63, which
can therefore be assumed to be still stacking with two of the three RNA bases.
The only residues which appeared unaffected in the UGU titration, but showed
107
significant CSPs in the EDEN7 case are Asp98, Glu100 and some of the weakly
affected residues such as Ile45 in β2.
Significant CSPs show that RRM1 is still binding to this shorter RNA substrate,
and the set of affected residues appears to be very similar. The UGU substrate
was therefore not only binding to RRM1, but occupying the whole of the binding
site across the β-sheet as effectively as the longer EDEN7 substrate. From this it
was concluded that UGU sites are the key component of the EDEN motif, and are
sufficient for binding of RRM1. It also supported the possibility of two RRM1
protein molecules binding to EDEN7 (UGUUUGU) with one protein at each
UGU site.
The titration curves for some of the most affected residues suggest titration had
not quite reached saturation point at a 1:1 ratio of RNA to protein (see Figure
4.19). Again this is consistent with the UGU substrate forming a 1:1 complex
while EDEN7 forms a 2:1 complex with RRM1.

108
Figure 4.19: Titration curves for a selection of residues in the titration of the RNA sequence UGU into 400 µM RRM1. The curves for Gly21 and Cys61 definitely do not reach a maximum until an RNA concentration of 400µM. This is less clear for the other residues shown.
4.2.2 Removal of one UGU site from the EDEN7 RNA Substrate
To confirm the 2:1 complex hypothesis, and hence that RRM1 was recognising
just a UGU site, a version of the EDEN7 substrate with one of the two UGU sites
removed was designed (UGUUUAU). UAUU repeats had been previously
reported in the literature to show at most a low affinity interaction with CELF1,
so a switch from a UGU to a UAU site would be expected to eliminate, or at least
greatly reduce binding to the second site.

109
Figure 4.20: At the top is shown a plot of the CSP for each residue on binding to UGUUUAU. Residues
in slow exchange with minimum CSP estimates are highlighted in red. Below is a CSP map of RRM1
on titration with UGUUUAU. Exact CSP values are shown in red, with brightness of colour indicating
the magnitude. Affected residues with only minimum CSP estimates are shown in yellow. A similar
binding patch is seen as in previous experiments. The protein concentration throughout the titration
was 400 µM.
The same set of affected residues is seen as for the EDEN7 substrate, consistent
with RRM1 recognising a simple UGU site in each titration. Gly21, Gln22,
Val23, Cys61 and Gln93 are all highly affected. Moderate CSPs are seen for
Asp98 and Ile45, again matching the EDEN7 titration. The titration curves,
examples of which are shown in Figure 4.21, do seem to reach saturation point at
a slightly higher RNA to protein ratio than in the EDEN7 case, but it was
ambiguous whether the stoichiometry of the complex had changed. This RNA

110
substrate was later clarified by mass spectrometry to be primarily forming a 1:1
complex, for which the data is shown in section 4.5.1.
Figure 4.21: Binding curve for the titration of UGUUUAU into 400 µM 15
N-labelled RRM1. All curves show an increasing CSP up to an RNA: protein ratio of 0.85:1. The curves then appear to plateau, with the possible exception of Cys61.
4.2.3 Interactions of RRM2 with Guanine-Rich Elements
There are significant differences in the protein sequences of the three RRMs of
CELF1, so it could not be assumed that they were all recognising the same site.
Most of residues with large CSPs from the RRM1 titrations are conserved in
RRM2, such as the two phenylalanine residues in the β-sheet, and one of the two
cysteine residues in β3. There are some exceptions such as Gln22, which is
replaced with methionine (Met114) in RRM2 and Gln93, which is replaced with
valine (Val182). Our initial aim with RRM2 to was to determine whether it was
recognising a UGU site in the same manner as RRM1, or if it showed a

111
preference for a longer RNA sequence. The same titrations with the RNA
substrates EDEN7 and UGU were carried out to determine this.
Figure 4.22: Above is shown a histogram of the CSPs for the titration of RRM2 with EDEN7. Values which
are only minimum estimates, not exact values are highlighted in red. Also shown is the structure of
RRM2, produced by truncation of Jun et al.’s solution structure of t187, with CSP values from the titration
with EDEN7 mapped onto it. CSP values are shown in red with brightness of colour indicating magnitude
of the effect. Residues with CSP values of <0.1 shown in grey. Residues for which only minimum CSPs are
available due to loss of the peaks in slow exchange are shown in yellow. The overall protein
concentration was 500 µM.
As was the case for RRM1, the classic RNP regions of the RRM are the most
affected, as well as some of the loops at the lower edge of the β sheet in Figure
4.22. The regions 112 - 120, 148 – 152 and 182 – 187 contain all those residues
with CSPs of greater than 0.1. The most perturbed residue in RRM2 is Cys150,
which is a conserved residue between RRM1 and 2 corresponding to Cys61 in
RRM1. Cys61 was the most perturbed residue two of the three RRM1 titrations,

112
and the similar pattern of CSPs suggests the two RRMs are binding to the RNA in
a similar manner. The non-conserved residues Met114 and Val182 are strongly
affected, and so may be fulfilling the same role as Gln22 and Gln93 in RRM1.
The C-terminal residue Asp187 (corresponding to Asp98 in RRM1) shows a
moderate CSP, with a larger CSP seen for the preceding residue Ala186. The
RRM2 construct was based on the existing t187 construct, resulting in a
truncation point only two residues from the folded domain. Since this CSP map
suggested some possible C-terminal involvement in RNA binding, the results
were later checked with an extended construct (t242) to confirm no critical
residues had been omitted at the C-terminus (see section 5.6.2).
Figure 4.23: Binding curves for the RRM2/EDEN7 titration. Unlike the RRM1/EDEN7 titration this curve has clearly not reached a plateau by a 0.6:1 ratio of RNA to protein. The protein concentration was 500 µM.
There is one clear difference between the titration of RRM2 with the substrate
UGUUUGU and the equivalent RRM1 titration. This titration had definitely not
reached saturation point significantly before a 1:1 ratio of RNA to protein was

113
reached, as can be seen from the binding curves in Figure 4.23. This suggests that
it is not possible to bind two RRM2 proteins simultaneously onto a single EDEN7
RNA molecule. The binding patch seen on the surface of the protein is not
sufficiently large for RRM2 to be binding across both UGU sites in the EDEN7
substrate. Recognition of a fourth nucleotide could however be enough to prevent
a second protein molecule from binding to the unoccupied UGU site. The
implication of this was that RRM2 required a UGU(U/G) site rather than being
able to tolerate a UGU site like RRM1.
This also has implications for the overall EDEN motif recognised by CELF1. In
sequences such as the EDEN11 GRE there is only a single U between each of the
UGU sites, just as in EDEN7. If RRM2 is obstructing binding to the adjacent
UGU site to the one it is bound to, then it seemed unlikely it would be possible to
bind both RRM1 and RRM2 onto the adjacent UGU(U/G) sites of the EDEN11
GRE. Since RRM2 did not appear to be forming a 2:1 complex with the EDEN7
substrate anyway, the titration with the UGUUUAU sequence was not carried
out. The data for the titration of RRM2 with the shorter UGU substrate is shown
in Figure 4.24.

114
Figure 4.24: CSP data for the titration of 400 µM RRM2 with the RNA substrate UGU, acquired using a Bruker Avance III 600 MHz spectrometer. CSPs of greater than 0.1 ppm are regarded as significant and are shown in red, with brightness of colour indicating the magnitude. Residues which only have minimum CSP estimates are shown in yellow on the CSP map, and highlighted in red in the histogram.
Only a few residues in RRM2 show significant CSPs on titration with the shorter
UGU substrate. Cys150 is the most affected residue again, with Gly113, Ala151,
Val182, Ala186 and Asp187 also above the 0.1 ppm threshold. Met114 is again
lost on titration, but the bound peak could not be located. Neither of the
conserved aromatic residues Phe111 and Phe152 are significantly perturbed.
Overall the binding patch is much smaller than that seen in the UGUUUGU
titration.

115
4.2.4 RRM3
The original intention was to carry out the EDEN7 and UGU RNA titrations on
all three RRMs so they could be compared, and an isolated RRM3 construct was
prepared for this purpose. However before the RNA titrations could be conducted
Tsuda et al. (2009) published NMR and ITC studies on an isolated RRM3
construct both unbound and in complex with short UG rich RNA sequences. They
determined that RRM3 was binding to the sequence UGUGUG with the highest
affinity, with the core motif being UGU(U/G). The reported binding surface was
somewhat larger than that seen for RRM1 and RRM2, and involved an N-
terminal extension of the protein. These results implied RRM3 was recognising a
longer sequence than the UGU site required for RRM1 binding, and possibly
more than the UGU(U/G) site of RRM2. It would therefore not be expected to
form a 2:1 complex with EDEN7. The binding affinity for these sites was
significantly higher than seen for the isolated RRM1 and RRM2 constructs, with
a reported Kd of 1.9 µM.
Tsuda et al’s study of RRM3 also investigated binding other possible RNA
substrates such as CUG repeat sequences, and adenosine rich elements (AREs) by
NMR, which showed evidence of low affinity binding. ITC showed the Kd values
for AREs to be around three orders of magnitude lower than the corresponding
GREs. They were unable to detect any binding to the CUGCUG substrate by ITC.
4.2.5 Summary of NMR Titrations with GRE Sequences
It can be concluded that RRM1 is capable of binding to just the three nucleotides
of a UGU site. Multiple copies of RRM1 can bind to UGU sites separated by only
a single nucleotide, such as those in the UGUU repeating GRE RNA sequence.

116
RRM2 in contrast cannot bind to adjacent UGU sites separated by only a single
nucleotide, consistent with it requiring a longer sequence such as a UGU(U/G)
site. While some CSPs are seen on binding of RRM2 to the UGU substrate, their
magnitude is greatly reduced compared to the corresponding EDEN7 titration,
again suggesting a fourth nucleotide is required. Tsuda et al’s data on RRM3
indicates it is recognising at least four nucleotides in a UGU(U/G) site, and
possibly as many as six (UGUGUG).
4.3 Interactions of CELF1 RRMs with CUG Repeat RNA
Substrates
CELF1 was originally identified as an RNA binding protein by its ability to bind
to a (CUG)8 RNA probe. The higher affinity GRE sequences are more likely to be
representative of the EDEN motif CELF1 recognises in its normal function, but
the possibility of interactions with CUG repeat sequences is still of interest. In
DM1 cells extended CUG repeat RNAs accumulate into foci, in which CELF1 is
not found. It has however been proposed that a soluble fraction of these CUG
repeat RNAs must also exist and may be interacting with CELF1, contributing to
the DM1 phenotype. NMR titrations were therefore carried out to determine
whether each RRM would bind to CUG repeat RNA. Also of interest was
whether any binding patch found would overlap with that of the GRE substrates,
resulting in competition between the two RNA substrates.
While these RNAs are usually described as CUG repeats, that does not
necessarily mean that CELF1 is recognising a CUG site. The closest match to a
UGU site in a CUG repeating RNA is the sequence UGC. When binding to a
UGC site the first U and the G could then occupy exactly the same positions as
when binding a UGU site. The second U would be exchanged for a C, which
conceivably could occupy a similar part of the binding surface as they are both
pyrimidines. If however CUG repeat sequences have a different binding patch on
the protein, the number of nucleotides recognised might be completely different.
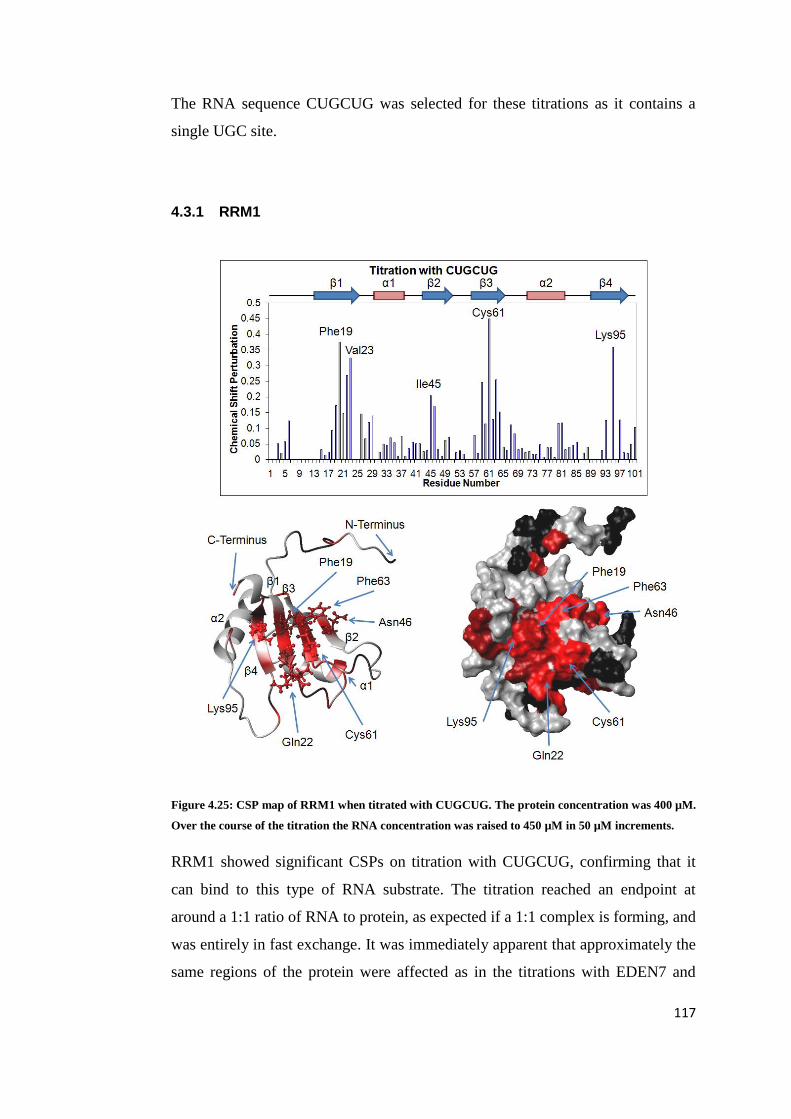
117
The RNA sequence CUGCUG was selected for these titrations as it contains a
single UGC site.
4.3.1 RRM1
Figure 4.25: CSP map of RRM1 when titrated with CUGCUG. The protein concentration was 400 µM.
Over the course of the titration the RNA concentration was raised to 450 µM in 50 µM increments.
RRM1 showed significant CSPs on titration with CUGCUG, confirming that it
can bind to this type of RNA substrate. The titration reached an endpoint at
around a 1:1 ratio of RNA to protein, as expected if a 1:1 complex is forming, and
was entirely in fast exchange. It was immediately apparent that approximately the
same regions of the protein were affected as in the titrations with EDEN7 and

118
UGU. Both of the aromatic residues Phe19 and Phe63 still show substantial
CSPs, suggesting these stacking interactions are conserved between these RNA
substrates. There are a few additional perturbed residues in the β2 and β4 strands,
such as Lys95, Ile45 and Asn46 compared to the EDEN7 substrate, suggesting a
slightly extended RNA binding surface.
Assuming RRM1 is recognising a UGC site, one potential explanation for this
was that the RNA substrates selected were not the same length. In the EDEN7
RNA the UGU sites are at the ends of the sequence, while in CUGCUG the UGC
site is in the centre, with additional nucleotides at both ends. The EDEN7 titration
was repeated with an extended RNA substrate (EDEN9: UUGUUUGUU), which
had an equivalent number of nucleotides on either side of the first binding site,
but this did not show any similar increase in the CSPs for residues such as Lys95.
A few additional residues from the bound form (in particular Val20 and Gln22)
could however be located in the bound 1H-
15N HSQC.
4.3.2 Comparison of RRM1 Interaction with UGU and UGC Sites
In Figure 4.27 is shown a direct comparison between the CSPs for the CUGCUG
and EDEN9 titrations. Residues with larger CSPs for CUGCUG are shown in red.
Residues with larger CSPs for EDEN9 are shown in blue. Brightness of colour
indicates the magnitude of the difference. Differences in the CSP values of less
than 0.1 ppm are shown in grey, and treated as background noise.

119
Figure 4.26: Direct comparison of chemical shift perturbations for titration of RRM1 with EDEN9 and with CUGCUG. For each residue the CSP for the EDEN9 titration is on the left in blue and the CSP for the CUGCUG titration is on the right in red. Some of the residues showing substantial differences between the two have been highlighted.
Figure 4.27: Map of the difference in CSPs in RRM1 between EDEN9 and CUGCUG substrates. Residues in red are more perturbed on addition of CUGCUG than EDEN9. Residues in blue are more perturbed by EDEN9 than CUGCUG. The brighter the colour, the greater the magnitude of the CSP difference. Residues in grey have less than a 0.1 difference in CSPs between the two cases.
The absolute magnitudes of the CSPs were in general somewhat larger for the
EDEN9 substrate (with one clear exception for Lys95). A very similar pattern of
affected residues is seen for the two RNAs, confirming they are occupying the
same binding site on the protein, and so would be in competition. In both cases
the most affected peaks are concentrated in the 19 - 23, 59 - 63 and 98 - 101
regions of the protein. The main RNP1 and RNP2 regions show significantly

120
larger CSPs when bound to the UGU site, as expected based on the overall
preferences known for CELF1. The only residue with a dramatically larger CSP
on binding to CUGCUG is Lys95 at the upper end of the β4 strand.
Teplova et al. subsequently published a crystal structure of RRM1 in complex
with a 13 nucleotide RNA substrate (UGUGUGUUGUGUG). Comparison of the
bound conformation of this RNA with a repeating CUG sequence can help to
rationalise some of the differences seen in the CSPs.
Figure 4.28: Structure of CELF1 RRM1 in complex with a UG rich RNA substrate, determined by Teplova et al. (2010) using x-ray crystallography. The position of Lys95 has been highlighted.
Based on this structure the increased disruption to Lys95 on binding to a UGC
site can be rationalised, as this change would result in the carbonyl group on U3
closest to this residue being replaced with an NH2 group.

121
4.3.3 Interactions of RRM2 with CUG Repeat RNAs
The comparison between the GRE and CUG repeat sequences was also conducted
for RRM2. The protein concentration for these titrations was reduced to 400 µM.
Figure 4.29: CSP data for the RRM2/CUGCUG titration. The CSP map shows all values greater than 0.05 in red as a colour gradient. The titration curve is consistent with a 1:1 complex.
While the usual RNP regions are still perturbed, the CSP values are in general
reduced compared to those in the RRM2/EDEN7 titration. The RNP1 region of
the protein in particular shows significantly reduced CSPs compared to the
corresponding region in the RRM1/CUGCUG titration. Cys150 is no longer one
of the most affected residues, which are now to be found at the C-terminus,
specifically Ala186 and Asp187. Val182 also shows a limited perturbation of 0.1

122
ppm compared to 0.4 ppm in the titration with EDEN7. Met114 is not lost on
titration as it was in the earlier titrations with substrates containing UGU sites.
While the CUGCUG substrate is still showing some limited interaction, RRM2
appeared to have more of a preference for UGU(U) sites over UGC(U) sites than
was seen for RRM1. This difference cannot be accounted for by RRM2
recognising a fourth nucleotide, as in both titrations the base at position 4 would
be U. RRM2 must therefore have a lower tolerance for the U to C substitution at
position 3.
A side by side comparison for all residues is shown in Figure 4.30. Few residues
in RRM2 show CSPs above the 0.1 ppm significance threshold when titrated with
CUGCUG, and none are above 0.2 ppm, compared with Val115, Cys150, Ala151,
Val182 and Ala186 in the titration with EDEN7. Unlike RRM1, there are no
obvious examples of residues with much larger CSPs in the CUGCUG titration.
Lys95 is a conserved residue between RRM1 and RRM2, but the corresponding
Lys184 in RRM2 shows a CSP of less than 0.1 for both RNA substrates.

123
Figure 4.30: A comparison of the CSPs for each residue of RRM2 on titration with the RNA substrates EDEN7 (UGUUUGU) in blue and CUGCUG in red. Some of the residues showing significant differences have been highlighted.
Figure 4.31: Map of the difference in CSPs between the EDEN7 and CUGCUG titrations onto the surface of RRM2. Residues in blue show a greater CSP on binding to EDEN7, residues in red show a greater CSP on binding to CUGCUG, with brightness of colour indicating the magnitude of the difference. Differences of less than 0.1 ppm are regarded as no significant, and the residues are shown in grey.
From this it can be concluded that UGC(U) sites are quite unfavourable for
binding of RRM2. There is still some interaction, but the CSPs are greatly
reduced overall.

124
4.3.4 Summary of Interactions between the CELF1 domains and CUG
Repeat RNAs
For all three RRMs any interaction with CUG repeat RNA substrates appears to
occur via the same RNA binding surface as the interaction with GRE sequences.
These RNAs will therefore be in direct competition for binding, and if CELF1
does bind to the extended CUG repeat RNAs in DM1 cells it will interfere with
the normal functions of the protein. It seems probable the RRMs are recognising a
UGC(U) site in the sequence, as the closest match to the high affinity UGU(U)
sites. There are noticeable differences between the three RRMs. RRM1 still
shows quite large CSPs on binding to a UGC site, while RRM2 shows few
residues above the 0.1 threshold. This suggests RRM1 is relatively tolerant of the
U to C switch, while RRM2 is only interacting weakly with these sites. RRM3
was reported by Tsuda et al to have a much lower affinity for CUG repeats,
suggesting most of the interaction with these substrates reported for CELF1 has
been occurring via RRM1.
4.4 Interaction of CELF1 RRMs with Adenosine-Rich Elements
4.4.1 RRM1
The third category of RNA substrates reported to show at least some interaction
with CELF1 was the AREs, particularly those containing UAU sites. The ARE
equivalent of EDEN7 (UAUUUAU) was investigated.

125
Figure 4.32: CSP values for a titration of 15
N RRM1 with ARE7. The protein concentration was 400 µM.
No residues showed CSP values above the 0.1 threshold. There is possibly some
very slight disruption to residues such as Gly60 and Val20, but the low CSP
values suggest this is a very weak non-specific interaction with the RNA. This
experiment confirmed that this ARE7 sequence is not bound by RRM1. This also
confirmed that ARE sequences are suitable for use as controls for this domain.
The G to A substitution in UGUUUAU should therefore have eliminated the
second binding site in the earlier titration.
4.4.2 RRM2
Since RRM2 was suspected to be recognising a longer section of RNA from the
GRE titrations, it was decided to use an extended ARE sequence; ARE15
(UAUUUAUUUAUUUAU) to ensure there were sufficient nucleotides on either
side of at least one UAU site.

126
Figure 4.33: CSP values for a titration of 15
N RRM2with ARE15. The protein concentration was 400 µM. Red stars indicate peaks which disappear on titration, but no plausible peak corresponding to the bound form appears. These residues are therefore in intermediate exchange, and since none of the visible peaks correspond to the bound form it is not possible to calculate either an exact CSP, or estimate a minimum value for the CSP.
While the CSP values are substantially lower than for the titration with the
EDEN7 sequence, in particular for residues such as Cys150 and Val182, there
does still seem to be some weak/non-specific interaction between the RNA and
the RNP1 and 2 regions of the protein. The overall intensities are significantly
higher than those seen for the CUGCUG titration. Residues 186 and 187 are again
the most affected, though these may have a tendency to be disproportionately
perturbed as they form the flexible C-terminus. Substantially larger CSP values
were seen in this titration than for the RRM1/ARE7 combination, where no
residue showed a CSP of greater than 0.1. From this data it appears that RRM2
may have a greater tolerance for UAU(U) sites than RRM1.

127
4.5 Determination of Complex Stoichiometry by ESI Mass
Spectrometry
The NMR data was supplemented using ESI mass spectrometry. This technique is
useful for confirming the stoichiometry of complexes based on their overall mass.
The NMR titration curves were ambiguous as to whether the EDEN7 and
UGUUUAU sequences could form 2:1 complexes with RRM1, so this point was
clarified by ESI-MS.
4.5.1 RRM1
All mass spectrometry samples were produced from previously lyophilised and
desalted protein by carrying out a second desalting step into 50 mM ammonium
acetate. This was necessary to reduce the salt content to levels tolerated by ESI-
MS. Without this second desalt step only very broad peaks could be observed due
to a wide range of salt adducts of each species forming. All samples were run as
native rather than denatured protein so the interactions with RNA could be
investigated. Data was collected in both positive and negative ion mode since the
negatively charged phosphate backbone of the RNA could potentially result in an
overall negative charge on some complexes.
Figure 4.34: ESI mass spectrum of RRM1 only (sample concentration 10 µM). One major species with
a mass of 12174 Da seen. There are signs of a small population of a dimer, based on small peaks with
apparent half-integer charge states at 5.5+ and 4.5+. While there is one report in the literature of
Xenopus CELF1 forming a dimer, this was also stated only to occur in constructs containing RRM1,
RRM2 and at least part of the RRM2 – RRM3 linker.

128
RRM1 has a theoretical mass of 12182 Da, allowing for the additional N-terminal
residues left after thrombin cleavage of the histidine tag. Mass spectrometry
showed one major species with a mass of 12174 Da. There were some
intermediate peaks suggesting a small population of an RRM1 dimer may be
present (theoretical mass 24364 Da). No evidence of dimerisation of RRM1 was
observed by NMR or ITC, so this may be an artefact of the protein being in the
gas phase.
To study the bound complexes RNA was added from a concentrated 5 mM stock
dissolved in RNase free water to the sample of unbound RRM1 to a concentration
of 2 µM. On addition of the EDEN9 RNA substrate (UUGUUUGUU), the
spectrum shown in Figure 4.35 was observed.
Figure 4.35: ESI mass spectrum of a mixture of RRM1 and EDEN9 (UUGUUUGUU), with RRM1 in
excess. The protein concentration is 10 µM, and the RNA concentration is 2 µM. Two species seen,
with masses of 12174 Da and 27118 Da. Species A is the unbound protein. Species B is a 2:1 complex of
the protein and the RNA. No unbound RNA or 1:1 complex could be observed, but given the protein is
in excess it would be expected that each RNA molecule would bind the largest number of proteins
possible.
Two species were observed, one with a mass of 12174 Da and a second with a
mass of 27118 Da. The first species is unbound protein (which is still in
considerable excess in this experiment). The second species has a mass which is

129
consistent with a 2:1 protein - RNA complex (theoretical mass 27136 Da). No 1:1
complex is observed and also no unbound RNA. Since RRM1 is in excess, even
allowing for the two possible binding sites, it is not surprising that the RNA
would be saturated to form the 2:1 complex. ITC experiments with RRM1
binding to a UGU(U) site conducted by our group and Teplova et al. determined a
Kd of 30 – 60 µM for this binding event. Under these conditions it would be
expected that approximately 10% of the protein would be in the form of the
complex, assuming that the binding of one RRM1 protein to EDEN9 does not
interfere with the binding of the other. This experiment confirms that RRM1 can
form a 2:1 complex with RNA substrates such as EDEN7. The experiment was
then repeated with the EDEN7 knock out sequence UGUUUAU. It was expected
that this would have only one possible binding site for RRM1, and so no 2:1
complex would be observed. The results are shown in Figure 4.36.
Figure 4.36: ESI mass spectrum of RRM1 + UGUUUAU. The protein concentration is 10 µM and the
RNA concentration is 2 µM. Two species, with masses of 12177 Da and 14259 Da were seen. One
significant additional peak with an m/z of 2206 is present, but other charge states from this species
could not be located.
RRM1 was again in a twofold excess, and the remaining unbound protein is
visible as a species with an apparent mass of 12177 Da. A 1:1 complex of mass
14259 Da (theoretical mass 14340 Da) is definitely present with peaks from

130
charge states +5 to +8. A 2:1 complex would have theoretical mass of 26507 Da.
One peak with an m/z of 2206 was observed and could not be accounted for by
the other species, which would be consistent with the +12 charge state of a 2:1
complex, but other charge states of this species could not be located. The
relatively large error margins on the mass of the complexes are believed to be due
to sodium adducts of the RNA. While there may be a small population of the 2:1
complex present, the majority of the RNA formed a 1:1 complex, which was
completely absent for the EDEN9 substrate. This is despite the presence of excess
protein, which should encourage binding multiple proteins to each RNA molecule
if possible. The switch from a UGU to a UAU site may not have totally
eliminated the 2:1 complex, but has definitely made it much less favourable than
the 1:1 complex.
4.5.2 RRM2
Native ESI mass spectrometry of RRM2 was also carried out, the results of which
are shown below.
Figure 4.37: ESI mass spectrum of RRM2 only. Protein concentration estimated at 2 µM based on
mass of lyophilised protein used to produce a concentrated stock which was subsequently diluted. The
lack of tryptophan and tyrosine residues in this construct results in a negligible absorbance at 280 nm
preventing this from being confirmed by nanodrop, unlike the other constructs. One species was seen
with a mass of 9607 Da.
RRM2 has a theoretical mass of 9613 Da (including the remaining N-terminal

131
residues GSHMASM after the removal of the 6-His-tag). A mass of 9607 Da was
observed by ESI-MS, which is the unbound RRM2. Attempts were made to
observe the complexes of RRM2 with EDEN9 and CUGCUG in order to confirm
the stoichiometries, but these were not successful.
Figure 4.38: ESI mass spectrum of a mixture of 2 µM RRM2 and 1 µM CUGCUG. Two species were
seen, of masses 1850 Da and 9607 Da.
Addition of the CUGCUG RNA to a concentration of 1 µM simply results in a
new series of peaks from the unbound RNA appearing (theoretical mass 1851
Da). The same results were seen for addition of 1 µM EDEN9. We conducted ITC
experiments on this system, and similar experiments were also published in 2010
by Teplova et al. Both sets of experiments showed the Kd for RRM2 binding to a
UGU(U) site to be ~60 µM. Given this, only a small fraction of the protein
(~1.5%) would be expected to be in the form of the complex, which may be
insufficient to observe it. The exact Kd for binding of RRM2 to a CUGCUG
sequence was not determined, but by NMR this interaction appeared to be of
lower affinity than RRM2 with UGU(U). The Kd is therefore presumably larger
than 60 µM, and the proportion of complex correspondingly even smaller, hence
our inability to observe it in the mass spectrum.

132
4.6 Conclusions
RRM1 has been shown to be capable of binding to a three nucleotide site with the
sequence UG(U/C). It can therefore bind to both UGU rich sequences such as the
GRE and to single stranded CUG repeat RNA. Both RNA substrates have been
confirmed by NMR CSP maps to bind to the same binding surface of the protein.
The affinity for the UGU site appears to be higher than for UGC, but the
difference is not as distinct as has been reported for RRM3 or for CELF1
constructs containing more than one RRM. This suggests RRM1 binds relatively
promiscuously to RNA sequences, with the overall preference for U/G rich
sequences being provided by at least one of the other RRMs of CELF1.
The EDEN7 sequence can accommodate two RRM1 proteins, but only one
RRM2 protein, which suggests RRM2 requires a slightly longer RNA sequence
for binding, such as UGU(U). The RRM2 titration with the shorter UGU
substrate showed a greatly reduced binding patch compared to the UGUUUGU
titration. The difference was not as pronounced in the RRM1 titration, again
consistent with a fourth nucleotide being of greater importance for RRM2 binding
than RRM1. Given the reported high affinity interactions with long UG repeat
sequences RRM2 may tolerate some variation of the nucleotide at position 4 (i.e.
a UGU(U/G) site). RRM2 appears to have a greater preference for UGU(U) sites
over UGC(U) sites than was seen for RRM1. RRM2 did however show
significant CSPs when titrated with UAU sequences (AREs) unlike RRM1. In
combination the preferences of these two RRMs would account for the overall
preference of the full length protein for U/G rich sequences which have high
affinity sites for both RRMs rather than ARE or CUG repeat substrates which are
unfavourable for at least one of the domains. Teplova et al. subsequently
published crystal structures of RRM2 in complex with UGUU and UGUG sites
and RRM1 in complex with a UGUU site51
. Their reported structures of both
domains show similar contacts to the base at position four when binding to the
UGUU sequence, in the case of RRM1 to residues K17, N46 and F63, and in the
case of RRM2 to K109, R138 and F152. When RRM2 was bound to a UGUG site

133
they report additional hydrogen bonds between the G4 base and E136.
Superimposing these structures showed near identical conformations for the first
three nucleotides, with greater variation seen for the fourth. The authors did
observe a higher binding affinity by ITC for RRM1 than RRM2, consistent with
our results, which they attribute to additional hydrogen bonds between the U1 and
G2 nucleotides and residues Q22 and Q93 of RRM1, which do not have
counterparts in RRM2 where neither of these residues is conserved. This could
imply that in RRM1 contacts to the first three nucleotides (UGU) represent a
greater contribution to the overall binding than in RRM2, diminishing the
importance of the contacts to the fourth nucleotide for RRM1.
RRM3 has been reported to be capable of recognising up to six nucleotides,
assisted by an interaction between the RNA and an N-terminal extension of the
domain. Nothing similar was been seen for these isolated RRM1 or RRM2
domains, but the possibility of this was investigated later on with longer protein
constructs. Tsuda et al. identified a core motif of UGU(U/G) for RRM3, similar
to our predictions for the preferred RRM2 target site.
As all three domains can recognise a variation on a UGU site, these results are
consistent with the full length protein recognising a sequence of the GRE type.
The fact that RRM2 cannot bind to adjacent UGU sites that are only separated by
a single nucleotide does however suggest that UGUU repeating sequences such as
the EDEN11 GRE may not be suitable for recognition of the full length CELF1
protein. The importance of the spacing between UGU sites when binding multiple
CELF1 domains simultaneously was investigated, with the results shown in
chapter 5.

134
5 Tandem RNA Binding of the two N-terminal
Domains of CELF1
To be able to predict natural target sequences of CELF1, it was necessary to
determine not only that each RRM was recognising a UGU or UGU(U/G) site,
but also what separation was required between the sites to allow the domains to
bind at the same time. This was investigated using a construct containing the two
N-terminal domains of CELF1 (RRM1 and RRM2) and the UGU(U) site spacing
in the proposed EDEN motifs EDEN11 and EDEN15 as a starting point. A series
of RNA substrates containing two UGU sites with a variable number of
nucleotides separating them (UGU(U)xUGU) were then used to determine the
exact range of spacer lengths tolerated for binding RRMs onto both sites
simultaneously.
In order to trigger deadenylation and hence translational repression in cells,
CELF1 must form a high affinity interaction with its target mRNA. The
interaction of each RRM with its core binding site had been shown to be
relatively low affinity, particularly for the two N-terminal RRMs. Kd values of 20
– 60 µM were later reported for each of RRM1 and 2 with a UUGUU substrate,
significantly lower than the Kd of 1.9 µM reported for RRM3. An important
question was therefore whether the binding affinity would be enhanced when
multiple RRMs of CELF1 interact simultaneously with the same RNA molecule.
If an enhancement of binding affinity was seen then there was also the question of
whether the lower affinity RNA substrates (the CUG repeat sequences and the
AREs) would show increased affinity when binding multiple RRMs in tandem, or
would remain as unfavourable non-specific interactions.
Finally it was important to verify whether any regions of the protein other than
the three structured RRMs were involved in RNA binding. RRM3 had been found
by Tsuda et al. (2009) to have a flexible N-terminal extension which could fold

135
back to assist in binding to RNA. Similar N and C-terminal involvement in RNA
recognition is seen in several structures of RRMs from other proteins42, 173, 174
.
Flexible extensions of some RRMs have also been reported to be indirectly
involved by the formation of additional structured regions in the presence of the
RNA, which stabilize the overall structure175, 176, 177
. Since the isolated RRM1 and
RRM2 constructs were truncated within a few residues of the structured regions,
it was important to check that no similar flexible extensions of these domains had
been removed. NMR studies to check for involvement of the N-terminus of
RRM1, the C-terminus of RRM2, and the flexible linker between the two RRMs
were therefore conducted.
5.1.1 Purification of a Construct of the N-terminal domains of CELF1
A construct consisting of the first 187 residues of CELF1 was used in this
investigation, and has been termed the t187 construct. This consists of both the
RRM1 and RRM2 domains connected as in the native protein by the short linker
of residues 102 – 107, which was not present in either of the isolated RRM
constructs. The t187 construct was originally produced by Dr Emilie Malaurie
(University of Nottingham). The mass of this construct is 21.1 kDa, not including
the N-terminal 6-His tag and the thrombin cleavage site. Test expressions were
carried out at 30°C and 37°C, which showed the protein was overexpressed, and
remained soluble at 30°C after a 16 hour induction. The protein was purified
using the same methods as for the isolated RRM1 and RRM2 constructs, as
detailed in section 3.7. SDS-PAGE showed the protein to be intact both in the
cell, and at the IMAC column stage of the purification.

136
Figure 5.1: SDS-PAGE of the IMAC column washes and elution fractions from the first t187
purification. Low molecular weight markers (Sigma) are shown as a reference in lane 1, with the mass
of each band shown in Daltons. Lanes 2 and 3 show diluted samples from the cell lysate of an
uninduced growth, and a growth after a 16 hour induction. The t187 induction band is clearly visible.
Lanes 4 and 5 show samples from the wash steps from the IMAC column stage. Lanes 6 – 10 show 2 ml
elution fractions. The vast majority of the protein is eluted in the first 3 fractions.
The induction band can clearly be seen in lane 3, with a mass of approximately 24
kDa. A small amount of the protein was eluted by the high salt wash step (lane 4),
and in later preparations the salt concentration used in this step was reduced from
2 M to 1 M in order to minimise this. The 1 mM imidazole wash (lane 5) did not
cause any similar loss of protein. 0.75 M imidazole, 25 mM potassium phosphate,
50 mM NaCl, pH 7.0 buffer was used to elute the protein from the column. The
bulk of the protein was eluted in fractions 1 - 3, though trace amounts are still
visible in fractions 4 and 5. Significant quantities of impurities were still present,
as can be seen by the additional bands in the SDS-PAGE for fractions 1 - 4,
which were removed by the subsequent gel filtration step.

137
Figure 5.2: SDS-PAGE of gel filtration fractions from the t187 purification. T187 eluted from the Superdex
200 gel filtration column between 220 and 250 ml. There are still very faint bands from some impurities
visible with a slightly lower mass than t187 that was not separated by the gel filtration.
Between the IMAC column stage shown in Figure 5.1 and the gel filtration stage
shown above in Figure 5.2 the 6-His tag was removed with thrombin using the
protocol in section 3.8. The tagged protein has a mass of 24911 Da, compared to
21719 Da after removal of the tag. The thrombin does not cleave immediately
before the first residue of CELF1, but leaves the additional residues GSHMAS at
the N-terminus, hence the slightly higher mass than for residues 1 – 187 alone.
Comparison to the reference markers in the SDS-PAGE, and ESI mass
spectrometry confirmed the tag had been successfully removed.
5.1.2 Comparison of the Isolated Domains and t187 Spectra
An initial 1D proton spectrum was collected on a Bruker Avance III 600 MHz
spectrometer at 298K using unlabelled material. Lyophilised protein was
dissolved in NMR buffer A. The dispersion of signals from the amide protons in
this initial spectrum showed that the protein was correctly folded, with the
downfield signals from Met94, Val183 and the Trp27 side chain clearly
resolvable and matching their proton shifts from the isolated RRMs. As the t187

138
construct has a mass of 21.7 kDa, the TROSY technique was used in all 2D and
3D NMR experiments to compensate for the faster relaxation rate compared to
the isolated domains. High resolution 15
N TROSY spectra with well dispersed
peaks could still be collected despite the larger size of the protein compared to the
isolated RRMs, and is shown in Figure 5.3.
Figure 5.3: 15
N TROSY of t187, collected on a 500 µM sample using a Bruker Avance III 600 MHz
spectrometer at 298 K. The sample was prepared by dissolving lyophilised protein in 25 mM potassium
phosphate, 50 mM NaCl, 10% D2O (v/v) pH 7.0 buffer.
In Figure 5.4 the 15
N TROSY spectrum of the t187 protein has been overlaid with
those of RRM 1 in red and RRM2 in green.

139
Figure 5.4: Overlaid 15
N TROSY spectra of t187 in blue, RRM1 in red and RRM2 in green. Virtually all the
RRM1 and 2 peaks match to peaks in the t187 spectrum, confirming the chemical shifts of the residues
have not been significantly perturbed by splitting the protein into two fragments. A small number of
peaks are only seen in the t187 spectrum and are due to the linker region (102 - 107) which is not present
in either of the smaller constructs.
The vast majority of peaks from the two isolated domain constructs overlay very
closely with the corresponding peaks from the t187 construct. It can be concluded
that the removal of RRM2 therefore has no effect on the environment and hence
the chemical shifts of the residues in RRM1, and vice versa. This confirms that
despite the short linker between them, the two domains of the protein are free to
move fairly independently of each other, at least when not bound to RNA. This
also aided assignment of the t187 spectrum, since in most cases assignments
could be transferred directly from the spectra of the isolated RRMs.
A few residues do show very substantial changes in chemical shift, for example
Lys101 (the RRM1 C-terminal residue), Arg108 and Lys109 (the RRM2 N-
terminal residues), but since the environment of these residues changes from
being in the middle of the protein sequence to being at the terminal regions this

140
was not surprising. In order to assign these residues, and those in the linker which
were not present in either the RRM1 or RRM2 constructs, 3D heteronuclear
NMR data was collected on the t187 construct.
5.1.3 Assignment of the 15N TROSY Spectrum
NMR data on the first 187 residues of human CELF1 had previously been
collected (Jun et al, 2004), but there are still enough variations in chemical shifts
compared to Xenopus CELF1 that assignments in the more crowded regions
could not simply be transferred. There were also some missing assignments, such
as the downfield peaks at >10 ppm which are not seen in Jun et al.’s human
CELF1 NMR spectrum, possibly due to the collection of data over a spectral
width range that was too narrow. For assignment purposes t187 was both 13
C and
15N labelled by growing in M9 minimal media with appropriately labelled carbon
and nitrogen sources. The purification yield was reduced to 13 mg/l, comparable
to the yields of the isolated RRMs. HNCACB, HN(CO)CACB, HNCO,
HN(CA)CO and HCCH TOCSY spectra were collected, allowing assignment of
the linker region. Those assignments transferred from the spectra of the isolated
RRMs were also verified using this 3D heteronuclear NMR data. All non-proline
residues were assigned except for Met1, Asp12 and Ser178.
5.2 Interactions of the N-terminal Domains of CELF1 with
Tandem UGU Sites in Guanine Rich Elements
By titrating an RNA substrate into 15
N labelled t187 protein, and collecting 15
N
TROSY NMR spectra, it was possible to tell whether each of the domains was
interacting with the RNA. If CSPs were seen in both RRMs, it would indicate
they were both binding to the RNA, and so that the RNA substrate contained
UGU sites with suitable spacing for CELF1 recognition. In contrast if CSPs were
only seen in one, then the separation between the UGU sites was not suitable for
tandem binding of the domains.

141
The EDEN11 GRE and EDEN15 consensus sequences reported by Vlasova et al.
(2008) and Graindorge et al. (2008) respectively were proposed to be capable of
forming a high affinity interaction with wild type CELF1, and so would be
expected to be capable of binding both domains of the t187 construct in tandem.
These sequences are shown in
Table 5-1, and contain up to four UGU sites in the case of EDEN15. By removing
one UGU site at a time it was possible to deduce which of the possible UGU sites
were involved in binding to these sequences, and so the spacing between them.
With this as a starting point a series of RNAs with shorter and longer spacers
between UGU sites were systematically investigated to find the exact range of
spacer lengths that would permit both the N-terminal domains of CELF1 to bind
in tandem. These RNAs were of the form UGU(U)xUGU, where x is varied to
alter the spacer length. The range of RNAs of this type used in this study is also
listed in
Table 5-1.
RNA Sequence
EDEN15 GRE UGUUUGUUUGUUUGU
EDEN11 GRE UGUUUGUUUGU
EDEN7 UGUUUGU
EDEN2U UGUUUUGU
EDEN3U UGUUUUUGU
EDEN4U UGUUUUUUGU
EDEN5U UGUUUUUUUGU
EDEN6U UGUUUUUUUUGU
EDEN7U UGUUUUUUUUUGU

142
Table 5-1: This lists the RNA substrates used in determining the UGU site spacing requirements for
binding the N-terminal domains of CELF1 simultaneously. The positions of all UGU sites in the sequences
have been underlined.
5.2.1 Interaction of the N-terminal Domains of CELF1 with the EDEN15
GRE.
In this titration, and all subsequent titrations with this protein construct, a 400 µM
15N labelled t187 sample was prepared in 600 µl of NMR buffer A. The RNA
concentration was raised in 50 µM increments by addition of 6 µl aliquots from a
5 mM stock dissolved in RNase free water. A 15
N TROSY spectrum was collected
at each titration point on a 600 MHz Bruker Avance III spectrometer at 298K.
Titrations were terminated once no variation could be seen between two
successive spectra. In all cases this occurred shortly after a 1:1 ratio of RNA to
protein was reached.

143
Figure 5.5: Graph of the CSP for each residue at the endpoint of the t187/EDEN15 titration. Also shown is
a CSP map of the affected residues, with red indicating the most affected residues and yellow indicating
residues with estimated minimum CSPs. The protein concentration was 400 µM, and the titration was
continued until no further variation in the spectrum was seen between titration points.

144
A mixture of residues in fast and slow exchange is seen. As was the case in the
titrations with the isolated RRMs it was not always possible to locate the signals
from the bound form for certain residues. This was due to a combination of signal
overlap in crowded regions of the spectrum, and certain residues which did not
appear to show a signal in the bound form (e.g. Met114).
Chemical shift perturbations are seen in both RRMs, confirming that the EDEN15
GRE is binding both the N-terminal domains of CELF1 in tandem. In RRM1 the
affected residues are a similar set to those seen in the earlier RRM1/UGU
titration. The β1 and β3 strands show several strongly affected residues, in
particular Val20, Gly21, Gln22, Cys61 and Cys62. Of the two conserved
aromatic residues on the β-sheet Phe19 shows a significant CSP of just over 0.2.
However Phe63 has a negligible CSP of less than 0.05 contrasting with one of
>0.1 in the RRM1/UGU titration. In β2 there are significant CSPs for Ile45 and to
a lesser extent Val47, suggesting an extended RNA binding surface across this
part of the β-sheet. In β4 only Gln93 shows a CSP above the 0.1 threshold.
Asp98, which was an affected residue in slow exchange in the RRM1/EDEN7
titration, has a negligible CSP and does not appear to be involved in binding.
Neither of the α-helices contain any affected residues.
In RRM2 CSPs are again concentrated in the β1 and β3 strands, in particular
Gly113, Met114, Val115, Cys150 and Ala151. As with RRM1 only one of the
two conserved aromatic residues on the β-sheet (Phe152) shows a significant
CSP. Phe111 in contrast has a CSP of <0.05. In β4 Val182 is very strongly
perturbed, as was the case in the isolated RRM2 construct. The α-helices do not
have any affected residues, and there is also little disruption to the β2 strand.
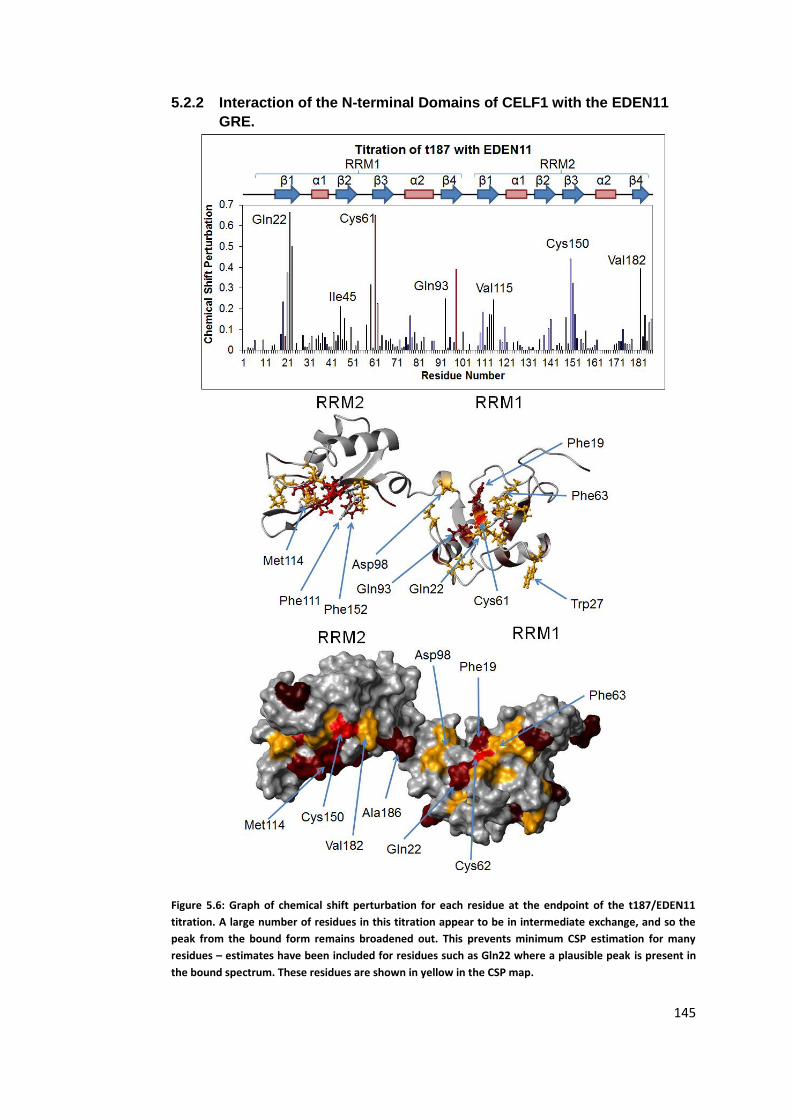
145
5.2.2 Interaction of the N-terminal Domains of CELF1 with the EDEN11
GRE.
Figure 5.6: Graph of chemical shift perturbation for each residue at the endpoint of the t187/EDEN11
titration. A large number of residues in this titration appear to be in intermediate exchange, and so the
peak from the bound form remains broadened out. This prevents minimum CSP estimation for many
residues – estimates have been included for residues such as Gln22 where a plausible peak is present in
the bound spectrum. These residues are shown in yellow in the CSP map.

146
The RNA sequence was shortened by one UGU(U) site to UGUUUGUUUGU,
which corresponds to the EDEN11 GRE. The results of this titration are shown in
Figure 5.6. Again there is a mixture of residues in fast and slow exchange.
Significant CSPs are seen in both RRMs, confirming this RNA substrate is
binding both domains in tandem. The set of affected residues is generally the
same as was seen for the EDEN15 GRE with few exceptions. The most
noticeable difference is that Asp98 is now affected, though overlap of this peak in
the bound form prevents accurate quantification of the CSP.
5.2.3 Interaction of the N-terminal Domains of CELF1 with the EDEN7
GRE.
The RNA was shortened by a further UGU(U) site to UGUUUGU (EDEN7).
Unlike the previous titrations, where the affected signals were predominantly in
fast exchange, this experiment appeared to show an intermediate exchange
situation for most of the normally affected residues. In intermediate exchange the
rate constant k is approximately equal to the difference in chemical shifts between
the free and bound forms (δν)178
. This results in extremely broad signals at a
population weighted average of the chemical shifts. In this case the signals for
those residues with large δν rapidly broaden out, but are not recovered,
suggesting the intermediate exchange situation is broadening the peaks to an
extent where they are not observable above the background noise. The lack of
peaks specific to the bound form prevented direct CSP determination, or
minimum CSP estimation based on the closest unknown peak.

147
Figure 5.7: Overlaid 15
N TROSY spectra of t187 unbound (shown in blue) and after titration to a 1:1 ratio
with EDEN7 (UGUUUGU – shown in red). Few peaks are seen to move in fast exchange over the course of
the titration, and none of those in fast exchange show CSPs of >0.1. A number of peaks are however lost,
and therefore these residues must have a greater change in environment, resulting in an intermediate
exchange situation. This permits the most affected region of the RNA binding surface to be identified, but
without bound peaks no CSPs can be estimated.
The binding patch, and hence which domains were bound to the RNA could be
identified based on which peaks from the free form were lost during the titration.
This is shown in Figure 5.8.
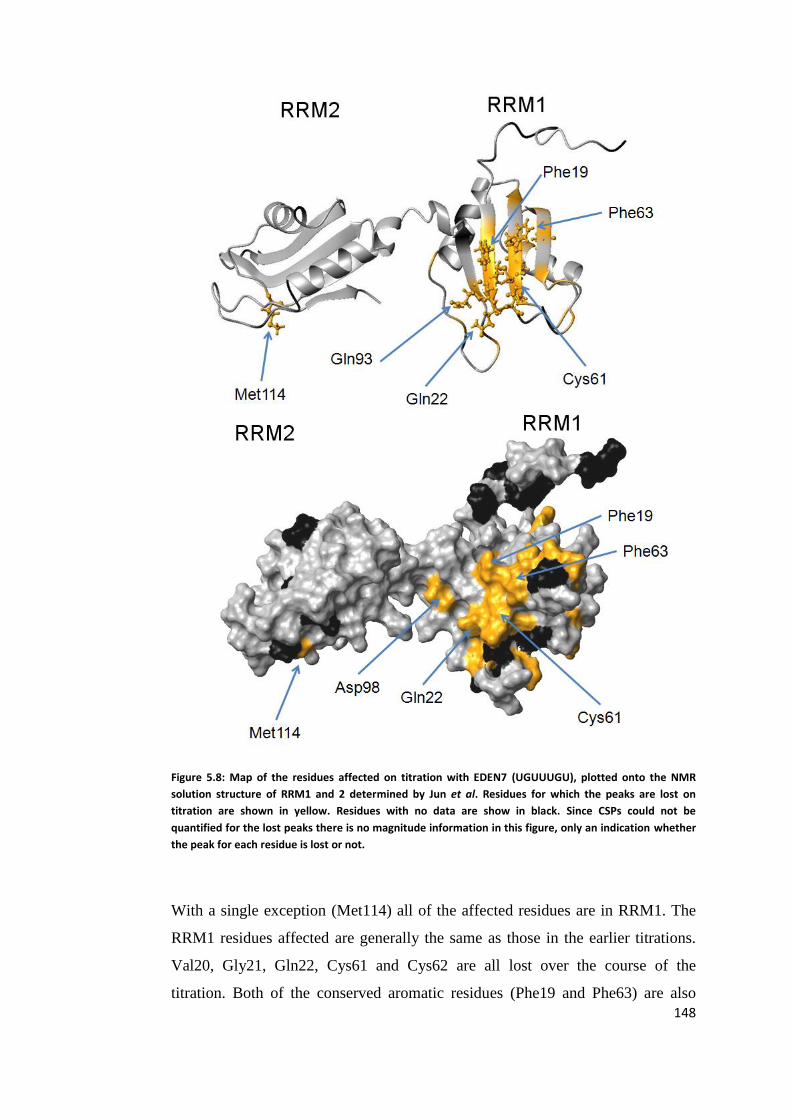
148
Figure 5.8: Map of the residues affected on titration with EDEN7 (UGUUUGU), plotted onto the NMR
solution structure of RRM1 and 2 determined by Jun et al. Residues for which the peaks are lost on
titration are shown in yellow. Residues with no data are show in black. Since CSPs could not be
quantified for the lost peaks there is no magnitude information in this figure, only an indication whether
the peak for each residue is lost or not.
With a single exception (Met114) all of the affected residues are in RRM1. The
RRM1 residues affected are generally the same as those in the earlier titrations.
Val20, Gly21, Gln22, Cys61 and Cys62 are all lost over the course of the
titration. Both of the conserved aromatic residues (Phe19 and Phe63) are also

149
affected. In β4 Asp98 and Gln93 are lost. In β2 Asn46 and Arg48 are lost, in
contrast with Ile45 and Val47 in the earlier titrations. There is no effect on the α-
helices.
5.2.4 Systematic Investigation of Spacing Requirements for Tandem
Binding of the N-terminal domains of CELF1
The shortest GRE sequence to show tandem binding of the two N-terminal
domains of CELF1 (the EDEN11 GRE) had a separation between the UGU sites
of five nucleotides. RNAs with spacer lengths from 1 to 7 nucleotides were
investigated by NMR in order to refine the exact spacing requirements between
UGU sites for tandem binding. The NMR titrations were again carried out using a
400 µM protein sample in NMR buffer A, and raising the RNA concentration in
50 µM increments. All titrations were extended to a 1.5:1 ratio of RNA to protein
to confirm that the sample was fully bound.
Virtually identical CSPs were observed for the residues in RRM1 for all spacer
lengths from 2 - 7, while a greater range of effects were seen for residues in
RRM2. In the RNA binding patch across the β-sheet Val20, Gly21, Gln22, Val23,
Cys61, Cys62 and Gln93 show large CSPs for spacer lengths 2 - 7. A spacer
length of 1 is equivalent to the earlier EDEN7 titration, where the signals for all
of these residues are lost, but are not recovered. In RRM2 Ile112, Gly113,
Met114, Val115, Cys150, Ala151 and Val182 show comparable CSPs to the
titration with the EDEN11 GRE for spacer lengths of 2 – 5 inclusive. Cys150 and
Val182 are consistently the most affected residues with CSPs of around 0.4 ppm
in each titration. With a single nucleotide spacer only the Met114 signal is lost
from RRM2. There are some slight perturbation of Cys150 and Val182, but in
both cases it is only around 0.05 ppm, and is below the significance threshold.
For spacers of length 6 and 7 significant CSPs were seen for all of the normally
affected residues in RRM2, but were consistently reduced to around 50 – 60% of
the magnitude of those seen for the 2 – 5 nucleotide spacers.

150
Figure 5.9 focuses on the peaks from the residues Cys61 and Cys150, which are
in RRM1 and RRM2 respectively and show the greatest chemical shift
perturbation in most of these titrations. Similar results are seen for the other
affected residues, but the differences are most pronounced for these residues due
to the larger absolute values of the CSPs.
Figure 5.9: Overlaid 15
N TROSY spectra for t187 unbound, and in the presence of a saturating amount of
each of the seven RNA sequences EDEN1U – EDEN7U. The RNA sequences are of the form UGU(U)xUGU,
with x = 1 – 7. This is a close up of a region of the spectra containing the signals from residue Cys61 in
RRM1 and Cys62 in RRM2.
5.2.5 Interaction of the N-terminal Domains of CELF1 with GRE
Sequences
Both the EDEN15 and EDEN11 GREs were found to be capable of binding the
two N-terminal domains of CELF1 in tandem, consistent with these substrates
151
being targets for wild type CELF1. There are multiple possible UGU sites in
these sequences (four in EDEN15 and three in EDEN11), some of which are
expected to be redundant. The two domains could therefore be bound to sites with
either one or five nucleotides separating them in the EDEN11 case. In the
EDEN15 case one, five or nine nucleotide spacer lengths are possible depending
which sites are being occupied by the two domains.
The EDEN7 (UGUUUGU) data clarifies how these two domains are recognising
GRE sequences. In this titration all of the normally affected residues in RRM1,
such as Gly21, Gln22, Cys61 and Gln93 are lost, showing that the RRM1 RNA
binding surface is being fully occupied. In contrast Met114 is the only residue
affected in RRM2, indicating that this domain is not binding to the RNA in the
usual manner. This shows that this sequence, and hence a separation of one
nucleotide between UGU sites, is not suitable for binding of the two N-terminal
domains in tandem.
In the previous chapter this RNA sequence (UGUUUGU) was found to be
capable of binding two copies of RRM1 simultaneously. It was not however
capable of binding two copies of RRM2. It was speculated that RRM2 was
recognising a slightly larger site of UGU(U/G) rather than the UGU site
recognised by RRM1. If this is the case there would still be sites for both RRMs
in this sequence, but with no separation between them, which could result in an
unfavourable steric clash between the domains. Another possibility is that both
domains might be able to fit onto the RNA when separated, but the short linker
between them is not sufficiently flexible to allow the RRMs to adopt a suitable
conformation relative to each other in order to bind simultaneously. The length of
this linker may therefore play a role in regulating binding to CELF1’s RNA
targets by determining the separation between UGU sites that can permit tandem
interaction with these domains. The EDEN7 RNA substrate is known to bind
each of RRM1 and RRM2 in isolation. As they cannot bind at the same time
when connected in the t187 construct, this titration behaves essentially as a

152
competition experiment. All but one of the affected residues are in RRM1, so it
can also be concluded that RRM1 has a higher affinity for UGU(U) sites than
RRM2.
The EDEN7 titration data shows unambiguously that the N-terminal domains
cannot bind to sites with only a single nucleotide separating them. This eliminates
one of the possible arrangements of the domains for binding to the EDEN11
GRE. The only remaining possible arrangement is for the two domains to bind to
the outer two UGU sites, leaving the central site unoccupied. These sites are
separated by five nucleotides. The longer EDEN15 GRE also has UGU sites with
a five nucleotide separation, which the N-terminal domains of CELF1 could be
recognising in the same manner. There was also still the possibility of binding to
the outer two UGU sites in EDEN15, which would be a nine nucleotide
separation.
The data from the GRE sequences had confirmed that a five nucleotide spacer
between UGU sites was sufficient for tandem binding of RRM1 and RRM2,
while a single nucleotide was insufficient. From this alone it was not possible to
tell whether the separation had to be exactly five, or if a range of spacer lengths
could be tolerated. The NMR data collected on the range of RNAs with spacer
lengths from 2 – 7 nucleotides clarified this. For all spacer lengths the residues in
RRM1 showed almost identical chemical shifts in the bound form. This is as
expected, since the UGUUUGU titration showed that RRM1 is bound
preferentially if the domains cannot bind in tandem. RRM2 however shows a
larger range of effects.
With spacer lengths of 2 – 5 nucleotides the residues in RRM2 show very similar
chemical shifts in the bound form to those in the EDEN11 GRE titration. This
confirms that all of these spacer lengths (from UGUUUUGU to
UGUUUUUUUGU) can permit tandem binding of these two domains. The RNA

153
with the 5 nucleotide spacer also confirms that the central UGU site in the
EDEN11 GRE is not playing any role in binding these two domains, since
altering this G to a U has had no significant effect on the bound spectrum.
The longer 6 and 7 nucleotide spacers show a noticeable reduction in CSPs for
the normally affected residues in RRM2. This was highlighted in Figure 5.9 for
the highly perturbed residue Cys150, and a similar decline in CSP is seen for
residues such as Ile112, Ala150 and Val182. In general they are reduced to 50 -
60% of the CSPs seen for the 2 – 5 nucleotide spacers. These CSPs are still above
the 0.1 significance threshold for these residues, so tandem binding of RRM1 and
RRM2 has not been completely eliminated as it appeared to be in the case of the
single nucleotide spacer. The upper limit on the spacer length is therefore not as
sharply defined as the lower limit. It does however appear that spacing of greater
than 5 nucleotides between UGU sites is not optimal for tandem binding. It
therefore seems likely that in the EDEN15 GRE the domains are binding to two
of the UGU sites separated by five nucleotides, rather than the outer two sites
which are separated by nine.
5.3 Enhanced Affinity when Binding Multiple Domains of
CELF1 in Tandem
Our second aim was to determine whether tandem interaction of the two N-
terminal domains results in enhanced binding affinity compared to their
interactions in isolation. RRM1 had previously been determined by ITC to bind to
substrates with UGU sites with a Kd of approximately 30 µM. RRM2 was found
to have a slightly lower affinity for UGU sites of around 45 µM. ITC data was
collected for titrations of the t187 construct with a UGU substrate, and with the
series of RNA sequences with spacer lengths of 1 – 7 nucleotides between UGU
sites. The UGU substrate would result in the domains binding separately, while
spacer lengths of 2 – 5 nucleotides would permit tandem binding, based on the
NMR data previously shown. Each titration was run with 25 µM RNA in the cell.

154
250 µM protein was injected from the syringe in thirty 10 µl aliquots, while
stirring at a constant rate.
Figure 5.10: ITC trace for titration of 250 µM t187 protein into 25 µM RNA (UGU). The curve has been
fitted using the MicroCal Origin 7.0 software package.
The Kd value for this interaction was calculated as 64.5 ± 2 µM, consistent with
ITC data for the titration of UGU with the isolated domains. The stoichiometry is
approximately 0.5 consistent with the two N-terminal domains of CELF1 binding
separate UGU molecules.

155
Figure 5.11: ITC binding curves for the X = 1, 2, 4 and 6 examples of the UGUUxUGU sequence. A)
EDEN1U, previously called EDEN7, shows a biphasic titration curve distinct from all the others. No
satisfactory fit to this curve could be obtained using the multiple site or sequential site binding models in
the Origin 7.0 package. B) EDEN2U, showing a single phase curve, fitted to a one site model. C) EDEN4U,
again showing only a single binding event, and fitted to a one site model. D) EDEN6U which, while it
shows a single phase curve, the shallower gradient indicates a substantially lower binding affinity for the
interaction. Data was also collected on the X = 3, 5 and 7 sequences.

156
In Figure 5.11 a) is shown the ITC trace for titration of the t187 construct into
UGUUUGU (the substrate with the single nucleotide spacer). This shows a
biphasic curve distinct from the single phase curves of the other RNAs
investigated. Attempts were made to fit this to the multiple binding site and
sequential binding site models in Origin 7.0, but no satisfactory fit could be
obtained. In Figure 5.11 b) and c) are shown the ITC traces and fitted binding
curves for the 2 and 4 nucleotide spacers. These fit to models with Kd values of
0.43 ± 0.08 µM and 0.37 ± 0.07 µM respectively. In contrast the trace for the 6
nucleotide spacer (Figure 5.11 d) shows a significantly lower affinity interaction,
with a Kd around an order of magnitude larger at 3.4 ± 0.3 µM.
Binding affinities, stoichiometries and other calculated thermodynamic
parameters for all RNA sequences investigated by ITC are shown below.
RNA Sequence Kd (µM) N ΔH (kcal/mol)
ΔS (cal/K/mol)
UGU UGU 64.5 ± 2.0 0.94 -17.3 -41.0
EDEN2U UGUUUUGU 0.47 ± 0.06 1.27 -17.0 -28.0
EDEN3U UGUUUUUGU 1.60 ± 0.30 1.80 -20.1 -42.6
EDEN4U UGUUUUUUGU 0.37 ± 0.06 1.35 -23.8 -50.5
EDEN5U UGUUUUUUUGU 3.86 ± 0.79 0.99 -50.4 -144
EDEN6U UGUUUUUUUUGU 3.38 ± 0.28 1.05 -45.5 -128
EDEN7U UGUUUUUUUUUGU 3.50 ± 0.72 1.39 -39.4 -107
Table 5-2: ITC results for all spacer lengths, and also the titration of t187 into the UGU RNA substrate.

157
5.3.1 Dependence of Binding Affinity on the Separation between UGU
Sites
The titration with the RNA substrate UGU showed a Kd of 64 µM, comparable to
those seen for RRM1 and RRM2 binding in isolation. Since the RNA is only
three nucleotides each domain must be binding to a separate RNA molecule, so
there is no tandem binding to increase affinity. The RNA with the single
nucleotide spacer (UGUUUGU) also does not permit tandem binding, as
previously shown in the NMR data. Interpretation of these results was however
complicated by the ITC trace showing two distinct binding events, with different
affinities. This RNA substrate has previously been shown to be capable of
binding two RRM1 proteins simultaneously, one to each UGU site. Two binding
events are occurring and, since RRM2 is known not to be interacting from the
NMR data, these must be two separate t187 proteins binding via their RRM1
domains. At low protein concentrations t187 binds to one UGU site of an RNA
molecule via RRM1, but the spacer length does not permit RRM2 to bind in
tandem, leaving the second UGU site vacant. When the protein concentration is
increased until the protein is in excess this vacant UGU site can be occupied by
the RRM1 domain of a second t187 protein, hence the second binding event seen
in the ITC trace. A diagram of this complex is shown in Figure 5.12. The
difference in binding affinity indicates that the two events are not equivalent and
suggests negative cooperativity, possibly due to steric difficulties in binding the
second protein onto the short RNA sequence. This may also imply that the bound
conformation of the second RRM1 to bind may not be identical to that of the first
RRM1. The presence of more than one bound conformation of RRM1 would
result in broadening of the signals in the NMR, contributing to the lack of clear
signals from the bound form.

158
Figure 5.12: This shows a possible 2:1 complex of t187 with the EDEN7 RNA substrate, which would
account for the two binding events observed by ITC.
The RNAs with spacer lengths of 2 – 7 nucleotides all show simple sigmoidal
curves, consistent with the two domains binding in tandem to form a 1:1
complex. The binding affinity is significantly enhanced for all of these compared
to the RRMs binding in isolation. The lowest Kd values are seen for the 2 and 4
nucleotide spacers, both at around 0.4 µM. This is more than a 100-fold
improvement in affinity compared to the protein binding two unconnected UGU
sites. The 6 and 7 nucleotide spacers are, as seen in the NMR data, less
favourable but with Kd values of around 3 µM they still show more than a 10 fold
improvement in binding affinity. This is consistent with RRM2 still interacting to
some extent, permitting some degree of tandem binding. The five nucleotide
spacer showed a Kd value of 3.86 µM, indicating somewhat weaker binding than
the 2 – 4 nucleotide spacers. This suggests that the five nucleotide spacing
between occupied UGU sites in the EDEN11 and EDEN15 GREs may still be
slightly larger than is optimal for tandem binding.
Based on these results, the optimal sequence for tandem binding of the N-
terminal domains of CELF1 appears to be UGU(U)xUGU where X is 2 - 4
inclusive. X = 1 results in almost complete loss of binding to RRM2. X ≥ 5
results in some loss of binding affinity, possibly due to binding becoming less
entropically favourable as the spacer length increases. This upper limit is not as
sharply defined as the lower limit, and it is possible that an RNA sequence with a
longer spacer containing secondary structure to hold the UGU sites in close
proximity might also show comparably favourable binding to the 2 - 4 spacers.
This data clearly demonstrates that tandem interaction of the two domains leads
to a significant enhancement in binding affinity. This is consistent with CELF1

159
forming a high affinity complex with its target mRNAs by recognition of an
EDEN motif that extends across all three RRMs.
A model of the complex of the two N-terminal domains with the shortest of the
optimal RNA substrates (UGUUUUGU) was constructed based on the available
crystal structures of the isolated domains. Teplova et al. had published structures
of RRM1 in complex with the UGU sites of a 12 nucleotide RNA
(GUUGUUUUGUUU). The unit cell contains two RNA molecules each with two
RRM1 proteins, one bound to each UGU site. They also published a structure of a
construct of both RRM1 and RRM2 (residues 14 – 187) in complex with this
sequence, but with only RRM2 in contact with the RNA. In order to construct this
model the RNA in the RRM1 structure was truncated to the sequence UUGU,
leaving a single RRM1 protein bound to the UGU site. The residues of this
RRM1 were then superimposed onto the RRM1 region of the structure containing
both domains, minimising RMSD for the protein. The RNA molecule bound to
RRM2 in this structure was truncated to the core UGUU sequence in contact with
the protein. This resulted in a structure of the two N-terminal domains, each
bound to a four nucleotide section of RNA in the same manner as in the crystal
structure.
The RNA fragments UGUU (bound to RRM2) and UUGU (bound to RRM1)
were then connected to form the RNA UGUUUUGU, determined experimentally
to be the shortest sequence capable of binding the domains in tandem. Due to the
orientation of the two domains in Teplova et al’s structure this required the
introduction of an implausibly long bond connecting the two RNA fragments in
this initial structure. The complex was placed in a truncated octahedron of
TIP3PBOX water, with sodium ions to achieve an overall neutral charge. Energy
minimisation was conducted in Amber with an initial restraint mask applied to the
protein and RNA. The force constant of this restraint mask was reduced to zero
over several stages (100, 50, 25, 10, 5, 2, 1), allowing the domains and RNA to
shift until the bond where the two RNA fragments were connected had been

160
reduced to a normal length. Molecular dynamics simulations were then run in
Amber, using the parameters in section 3.22, with a final step at 300 K with no
restraint mask for 1 ns. The resulting model is shown in Figure 5.13.
Figure 5.13: Model of the N-terminal domains of CELF1 in complex with the RNA substrate UGUUUUGU.
The protein is shown in green as a ribbon diagram with the amino acid side chains of key residues in the
binding surface shown as lines. The RNA is shown in light blue.
This is the shortest RNA sequence capable of binding both domains in tandem.
Bases 1 – 4 of the RNA form contacts with the β-sheet and some of the loop
regions of RRM2. U3 is forming a stacking interaction with Phe111, and U4 is
forming a similar interaction with Phe152. U5 is relatively distant from the
protein surface, with only the side chain of His90 in close proximity. U6, G7 and
U8 interact with the β-sheet of RRM1. U8 forms a stacking interaction with
Phe19. Phe63 does not stack with any of the RNA bases, though it is also quite
close to the U8 base.

161
5.4 Determining the Stoichiometry of Complexes with GRE
Substrates by Mass Spectrometry
The titration of t187 into UGUUUGU highlighted the potential for the formation
of complexes with stoichiometries other than 1:1 when multiple UGU sites are
present in an RNA substrate. The EDEN15 and EDEN11 GREs both have
unoccupied UGU sites even after the N-terminal domains are bound in tandem.
The masses of the complexes of t187 with these RNA substrates were therefore
measured by ESI-MS to check for the presence of higher stoichiometries. As for
the isolated domains, purified protein was put through a second desalting step
into 25 mM ammonium acetate to further reduce the salt concentration, and hence
the presence of salt adducts.
Figure 5.14: ESI mass spectrum of t187. The protein concentration is 5 µM. One species is seen with a
mass of 21702 Da.
The t187 construct, including the additional N-terminal residues left after removal
of the 6-His-tag, has a theoretical mass of 21719 Da. The mass spectrum, shown
in Figure 5.14, measures the protein’s mass to be 21702 Da.

162
Figure 5.15: ESI mass spectrum of t187 + EDEN11. Both the protein and RNA concentrations are 5 µM.
Three species were seen, of masses 21702 Da, 25134 Da and 3449 Da, corresponding to unbound t187,
1:1 complex and unbound EDEN11 respectively.
RNA was added from a 5 mM stock in RNase free water until a 1:1 ratio of RNA
to protein was reached. On addition of the EDEN11 GRE substrate a complex
with a mass of 25134 Da was observed, which is a close match to the 25142 Da
theoretical mass of a 1:1 complex. A small amount of unbound RNA is
observable. Comparable amounts of unbound protein and 1:1 complex are
present. ITC of this protein construct binding to the similar RNA sequence
UGUUUUUUUGU observed a Kd of 3.86 µM. Under these conditions just over
40% of the protein would be expected to be in the form of the complex, which is
consistent with mass spectrometry results.

163
Figure 5.16: ESI mass spectrum of t187 + EDEN15. Both the protein and RNA concentrations were 5 µM.
Two species were seen, of masses 26386 Da and 4683 Da, corresponding to a 1:1 complex of t187 and
EDEN15 and unbound RNA respectively.
Figure 5.16 shows the ESI mass spectrum after the addition of the EDEN15 GRE
substrate. The 1:1 complex is visible. Its theoretical mass is 26405 Da, compared
to an observed mass of 26389 Da. Unbound RNA is also visible, with a mass of
4683 Da. No free protein was observed at a 1:1 protein to RNA ratio. We were
unable to fit a curve to the biphasic ITC trace for binding of this protein construct
to EDEN15, preventing an accurate Kd for either of the binding events being
determined. The fact the vast majority of the protein appears to be in the form of
the 1:1 complex under these conditions does however suggest significantly tighter
binding than in the EDEN11 case, where a mixture of unbound protein and
complex was seen.
No 2:1 complex is observed. The biphasic ITC trace observed for this system
does suggest it is possible for a second protein molecule to bind to this RNA. If
however the second protein molecule can only bind via one of its two domains,
the binding affinity will be far lower than for the first protein molecule binding.
RRM1 binds to a UGU site in isolation with a Kd of ~30 µM, and it is possible
that negative cooperativity will further reduce the binding affinity. The proportion
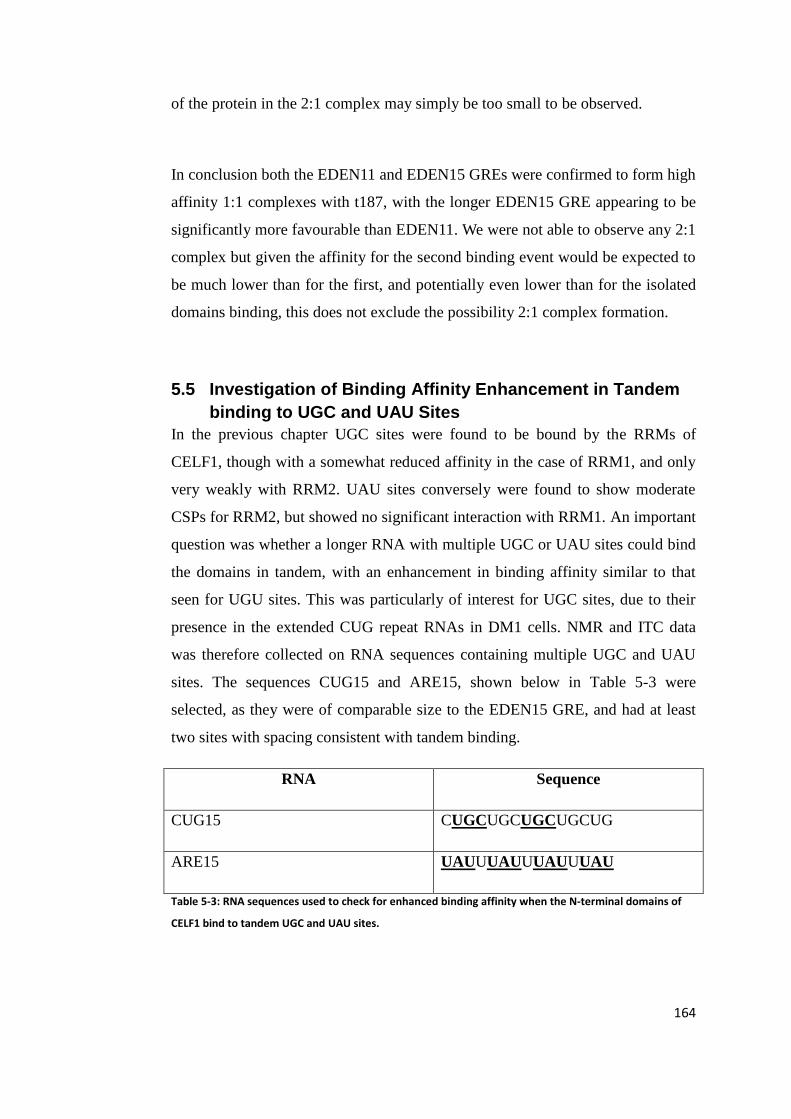
164
of the protein in the 2:1 complex may simply be too small to be observed.
In conclusion both the EDEN11 and EDEN15 GREs were confirmed to form high
affinity 1:1 complexes with t187, with the longer EDEN15 GRE appearing to be
significantly more favourable than EDEN11. We were not able to observe any 2:1
complex but given the affinity for the second binding event would be expected to
be much lower than for the first, and potentially even lower than for the isolated
domains binding, this does not exclude the possibility 2:1 complex formation.
5.5 Investigation of Binding Affinity Enhancement in Tandem
binding to UGC and UAU Sites
In the previous chapter UGC sites were found to be bound by the RRMs of
CELF1, though with a somewhat reduced affinity in the case of RRM1, and only
very weakly with RRM2. UAU sites conversely were found to show moderate
CSPs for RRM2, but showed no significant interaction with RRM1. An important
question was whether a longer RNA with multiple UGC or UAU sites could bind
the domains in tandem, with an enhancement in binding affinity similar to that
seen for UGU sites. This was particularly of interest for UGC sites, due to their
presence in the extended CUG repeat RNAs in DM1 cells. NMR and ITC data
was therefore collected on RNA sequences containing multiple UGC and UAU
sites. The sequences CUG15 and ARE15, shown below in Table 5-3 were
selected, as they were of comparable size to the EDEN15 GRE, and had at least
two sites with spacing consistent with tandem binding.
RNA Sequence
CUG15 CUGCUGCUGCUGCUG
ARE15 UAUUUAUUUAUUUAU
Table 5-3: RNA sequences used to check for enhanced binding affinity when the N-terminal domains of
CELF1 bind to tandem UGC and UAU sites.
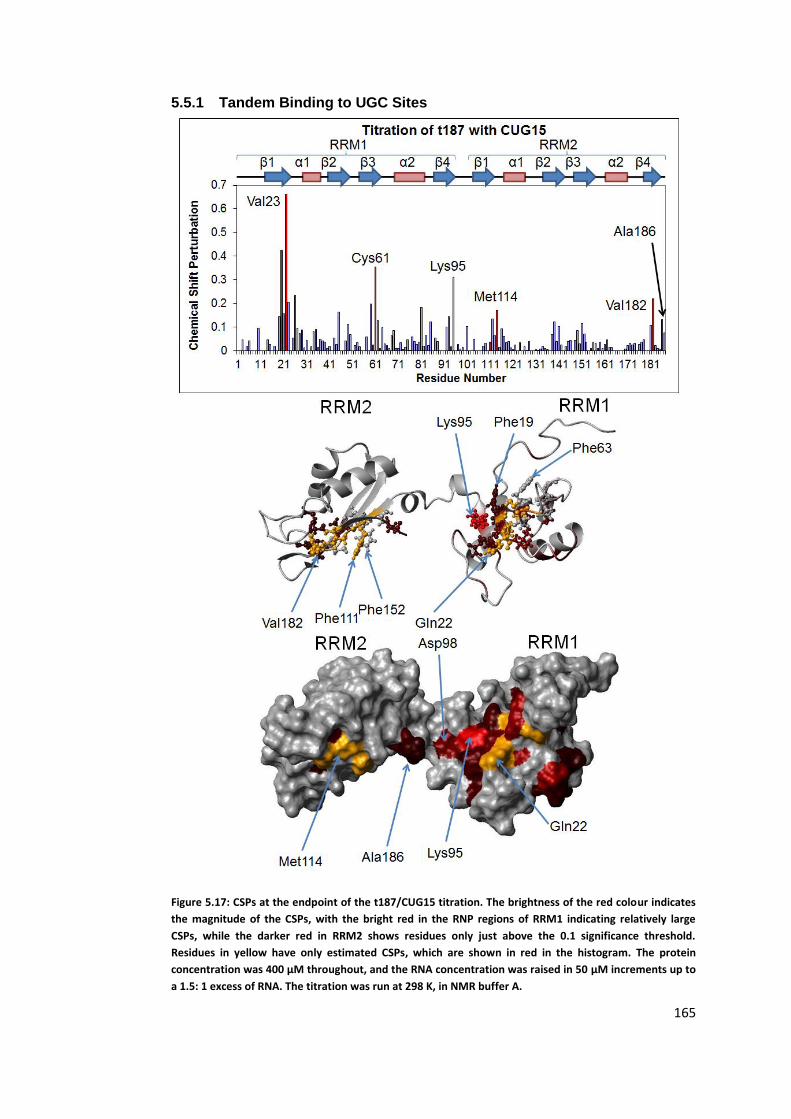
165
5.5.1 Tandem Binding to UGC Sites
Figure 5.17: CSPs at the endpoint of the t187/CUG15 titration. The brightness of the red colour indicates
the magnitude of the CSPs, with the bright red in the RNP regions of RRM1 indicating relatively large
CSPs, while the darker red in RRM2 shows residues only just above the 0.1 significance threshold.
Residues in yellow have only estimated CSPs, which are shown in red in the histogram. The protein
concentration was 400 µM throughout, and the RNA concentration was raised in 50 µM increments up to
a 1.5: 1 excess of RNA. The titration was run at 298 K, in NMR buffer A.

166
RRM1 shows CSPs across most of the β-sheet residues, with some of comparable
magnitude to those in the EDEN15 titration. In β1 Phe19, Gly21 and Val23 all
show CSPs of greater than 0.15. In β2 Ile45 and Asn46 show similar CSPs, as do
Lys59 and Cys62 in β3. In β4 Lys95 shows a large CSP of >0.25, contrasting with
<0.05 in the EDEN15 titration. RRM2 however shows very limited CSPs. In
particular the 110 - 115 and 149 - 155 regions, which showed the largest CSPs on
binding to UGU sites, have no residues in fast exchange with CSPs of magnitudes
above 0.1. The peaks for Phe111 and Met114 are still lost on titration. Val182
shows a CSP of just over 0.1, compared to 0.4 for binding to UGU sites. In this
region Ala186 also has a CSP just over the significance threshold. As with the
other t187 titrations, a mixture of residues in fast and slow exchange is seen. The
ITC trace had an unusual shape, as shown in Figure 5.18, which was unlike any of
those seen for the titrations with UGU substrates.
Figure 5.18: ITC curve for a titration of 500 µM t187 protein into 25 µM CUG15 at 298K. All samples were
dissolved in RNase free water and degassed.

167
A plausible fit to the curve could not be produced using any of the available
binding models in Origin 7.0, preventing any thermodynamic parameters from
being calculated. From the NMR data it appears that RRM1 is binding to the
UGC site with comparable affinity to the UGU site. However RRM2 still shows
only very weak CSPs, suggesting that even when the domains bind in tandem the
overall affinity for sequences with UGC sites is not significantly enhanced.
A complication in this titration is the issue of RNA secondary structure. Long
CUG repeating sequences such as those found in DM1 cells have been shown to
form hairpin structures. These consist of a stem of C – G Watson-Crick base
pairs, separated by U – U mismatches. Atomic force microscopy by Michalowski
et al (1999) showed that CELF1 could not bind to this double stranded stem.
Binding could only occur to short single stranded sections of the RNA at the ends
of the hairpin. The possibility of similar hairpin structures in the relatively short
CUG repeat sequences used in these experiments had to be considered. The
mFOLD RNA secondary structure prediction webservice179
predicted no
secondary structure for the short CUGCUG sequence, or any of the sequences
with UGU or UAU sites. It did however predict that CUG15 would form a short
hairpin structure with two C-G base pairs (ΔG = -1.0 kcal/mol).
This could account for the unusual shape of the ITC trace. The endothermic
section at the start of this titration, which was not seen for any other RNA
substrate, could be caused by the breaking apart of the RNA hairpin. Since
CELF1 has been confirmed to only bind to single stranded CUG repeat sequences
by AFM, and the NMR shows that it is binding to CUG15, any secondary
structure in the RNA must be breaking down. CUG15 is still a relatively short
sequence compared to the extended CUG RNAs present in DM1 cells which can
run to thousands of repeats. While this ITC experiment does suggest CELF1 is
capable of breaking apart at least a short section of RNA hairpin in order to bind,
it may not be able to do this except at the ends of the RNA hairpins in DM1 cells.

168
5.5.2 Tandem Binding to Adenosine Rich Elements
Figure 5.19: CSPs at the endpoint of the t187/ARE15 titration. This titration was largely in fast exchange,
and shows residues in both RRMs above the 0.1 significance threshold. The titration was carried out on a
400 µM protein sample in NMR buffer A at 298 K. The RNA concentration was raised in 50 µM increments
until no further variation in the spectrum was seen. Residues lost on titration are shown in yellow on the
CSP map, and minimum CSP estimates are highlighted in red in the histogram.

169
Significant CSPs of up to 0.4 ppm were seen, comparable to those in the EDEN15
titration, were seen in both domains. In RRM1 β1 and β3 both show strongly
affected residues, such as Gly21, Val23 and Gly60. The conserved aromatic
residues Phe19 and Phe63 are not perturbed. Β2 and β4 show relatively low
CSPs, though His90 in the loop connecting α2 and β4 has a high CSP of almost
0.3 ppm. In RRM2 most of the effects are in β1, in particular Ile112. The other
parts of the β-sheet are less affected, though Phe152 in β3 is lost on titration.
Figure 5.20: ITC curve for a titration of 500 µM t187 into 25 µM ARE15. Binding is occurring, with multiple
events as can be seen from the shape of the curve. It was not possible to achieve a good fit to this data
using any of the binding models in the Origin 7.0 software package.
A titration of t187 protein into the ARE15 RNA substrate showed a curve,
indicating that binding was occurring. While not as pronounced as in the titration
with EDEN7, there are clearly at least two phases to the binding curve, indicating

170
at least two binding events are occurring. The multi-site binding model did not
produce a plausible fit.
From the NMR data it can be concluded that the N-terminal domains of CELF1
are binding in tandem to two sites in the ARE15 substrate, as there are substantial
CSPs across both domains. This contrasts with the isolated domain results. RRM2
did show moderate CSPs with an ARE substrate, but RRM1 showed no
significant CSPs at all when titrated with ARE7 (UAUUUAU). This suggests that
binding the two domains in tandem has enhanced the affinity of the N-terminal
domains of CELF1 for UAU sites. From the ITC it does not appear to be forming
a simple 1:1 complex with ARE15. Possibly the two redundant UAU sites permit
a second t187 protein to bind when in large excess.
Based on the ITC data the substrate ARE15 does not appear to form a high
affinity 1:1 complex like EDEN15 does, so AREs can still be considered as
relatively low affinity targets. There is enough of an interaction however that
they may not be a good choice as control sequences, particularly when multiple
domains of CELF1 can bind simultaneously to improve the binding affinity.
5.6 Investigating the Involvement of Unstructured Regions
Flanking RRM1 and RRM2 in RNA Binding
In 2009 Tsuda et al published a structure of RRM3 in complex with the RNA
substrate UGUGUG. One notable feature of this structure was that a flexible
section at the N-terminus of the protein was folded back across the β-sheet,
making additional contacts with the RNA and enhancing binding affinity. It was
therefore important to investigate if any similar regions flanking the structured
RRM1 and RRM2 domains were involved in RNA binding. This was particularly
important to determine for the C-terminus of RRM2, since the t187 construct cut

171
the protein only one residue after the end of the structured domain. If any
unstructured region was involved in the wild type, it would be truncated in the
t187 construct, potentially altering the RNA target or binding affinity. Also the
unstructured N-terminus of RRM1 and the linker between RRM1 and RRM2
were investigated. This was accomplished using a combination of 15
N
heteronuclear NOE experiments, and an extended protein construct (t242).
5.6.1 Evidence for Conformational Flexibility from 15N Heteronuclear
NOEs
By measuring the 1H -
15N heteronuclear NOE it is possible to measure the
flexibility of each residue in the protein180
. Heteronuclear NOEs are sensitive to
motion on a timescale of 10-8
– 10-12
seconds, which is a typical range for internal
protein dynamics181
. Heteronuclear NOEs are generally highest in rigid areas of
the protein, with a theoretical maximum value of 0.82.182
Some values higher
than 0.82 are seen in practice due to the margin of error in measuring signal
intensities. Values from 0 – 0.6 generally indicate relatively dynamic regions of
the protein. Completely unstructured regions can produce negative values. 15
N
heteronuclear NOE experiments have the disadvantage of low sensitivity
compared to an ordinary 1H-
15N HSQC experiment, and so require long
acquisition times which can present a problem with unstable samples. They also
require accurate measurement of the intensity of each peak in the spectrum. As a
result heteronuclear NOEs cannot be accurately calculated for any overlapping
peaks.

172
Figure 5.21: The upper graph shows the 15
N heteronuclear NOEs seen for each residue in the unbound
t187 protein. The lower graph shows the same protein after the addition of an excess of the EDEN4U RNA
substrate (known to be an optimal target to form a 1:1 complex with t187). Data was collected on an 800
MHz NMR spectrometer with cryoprobe, with 40 scans at a resolution of 2048 x 128 points for each of
the two interleaved experiments comprising the 15
N heteronuclear NOE experiment.

173
In the folded domains of t187 NOEs are typically 0.7 or greater, indicating slow
isotropic tumbling consistent with a compact, rigid structure. An exception is the
loop connecting β-sheets 2 and 3 of RRM1 where the NOEs are significantly
lower, indicating faster internal motion and suggesting this loop is somewhat
more dynamic than the rest of the domain. This is consistent with the greater
range of conformations seen for this loop compared to the rest of the domain in
the available crystal structures of RRM151
, and the NMR structural ensemble of
the N-terminal domains previously reported by Jun et al48
. The N-terminus of the
construct also shows very low, and some negative NOEs, indicating unstructured
protein. Residues 98 - 105 show relatively low heteronuclear NOEs, consistent
with the linker between RRM1 and 2 being fairly dynamic.
The experiment for t187 in complex with the EDEN4U substrate showed a similar
overall pattern of NOEs, showing that it is not becoming significantly more rigid
on binding to RNA. The relatively flexible loop between the β2 and β3 strands of
RRM1 is also remaining flexible when bound to the RNA, as is the N-terminus.
The N-terminus possibly shows a slight increase in the NOE for residues 2 – 5,
but still remains quite dynamic compared to the structured domains.
From this data it can be concluded from this that there is no involvement of the
flexible N-terminus of RRM1 in binding the RNA, unlike that seen for RRM3. If
it were, it would be expected to become significantly less dynamic when bound to
RNA. Similarly the short linker between RRM1 and RRM2 appears to remain
dynamic even when the domains bind in tandem, consistent with a lack of any N-
terminal involvement in RRM2 binding.
5.6.2 Investigation of Involvement of the RRM2 C-Terminus Using an
Extended CELF1 Construct
It had been suggested in the literature that not only the first two domains, but also

174
some additional residues from the unstructured region between RRM2 and 3 are
required for high affinity binding of RNA103, 54
. The t187 construct was however
capable of binding RNA with affinities in the low µM to high nM range even
without this region. We examined the effects of this proposed extension of RRM2
using a construct of the first 242 residues of CELF1 (t242). The t242 construct
was originally produced by Dr. Emilie Malaurie (University of Nottingham), but
due to lower yields from purifications and poor solubility, work was focused on
the shorter t187 construct. It contains an additional 55 residues from the linker
region between RRM2 and 3, which are believed to be completely unstructured.
The purification was carried out using the same protocol as for t187 construct.
Figure 5.22: SDS PAGE of 15
N labelled t242 purification. The protein mass is consistent with t242, and
there is no sign of truncation of the flexible C-terminal tail. From left to right the lanes show: 1) Standard
molecular weight markers (Sigma), 2) The supernatant after the protein has bound to the His-Pur column,
containing the non-binding proteins. 3) Proteins eluted by the 2 M NaCl wash. 4) Proteins eluted by the 1
mM imidazole wash. 6) – 10). The first 5 fractions of elution buffer containing 0.75 M imidazole. The
elution fraction volume was 2 ml.
From SDS-PAGE the increased size of the protein can be seen. It runs slightly
above the 29 kDa marker, consistent with its theoretical mass of 30475 (including
the 6-His-tag). The purification yield was severely reduced, to 2.5 mg/l when

175
grown in minimal media. The protein solubility was also reduced, to
approximately 100 µM in the phosphate NMR buffer A. Increasing the salt
concentration to 200 mM only marginally increased the protein solubility, and
substantially reduced the quality of the resulting NMR spectrum, so buffer A was
still used for collection of all NMR data on the t242 construct. The NMR data
was collected using the TROSY technique on a Bruker Avance III 600 MHz
spectrometer with a TXI probe at 298K.
Figure 5.23: 15
N TROSY of t242, collected on a Bruker Avance III 600 MHz spectrometer, shown in blue.
15N TROSY of t187 overlaid in red for comparison. 55 additional peaks would be expected in the t242
spectrum. Most of the additional peaks in the t242 spectrum are however tightly clustered in the 7.5 -
8.5ppm proton region and are difficult to resolve. This indicates they are in an unstructured region of the
protein, which is consistent with the available information on the structure of CELF1.
Given the difficulty of resolving the heavily overlapped peaks from the
unstructured 188 - 242 region and the poor signal/noise ratio, it was decided not
to attempt assigning these, but instead to repeat the earlier titrations with a GRE
sequence and the CUG15 sequence to check for any differences in the CSPs of
the structured domains between the two constructs. The low protein concentration
also prevented the acquisition of 3D heteronuclear NMR data, which would be
necessary for assignment of a protein of this size.

176
Due to the limited solubility of t242, a very low sample concentration (~100 µM)
had to be used for all NMR experiments. The number of scans taken at each
titration point was increased to compensate. The RNA concentration was raised in
25 µM increments until an excess of RNA was present.
A larger than normal percentage of the peaks do not have quantifiable CSPs,
since their low initial intensities results in them being more easily lost over the
course of the titration. Also some peaks which are normally resolvable in the t187
are obscured by the cluster of peaks from the unstructured C-terminal extension
of the protein. The binding patch can still be identified from those residues for
which the signals from the free form disappear over the course of the titration.
Figure 5.24: Graph of CSP values for titration of t242 with CUG15. Red asterisks indicate residues that are
resolvable in the initial spectrum, but lost on titration. No values are shown for residues 187 – 242 as
these were not assigned. Minimum values for the CSPs of residues lost on titration have not been
estimated, since there are insufficient visible peaks in the bound form to account for all residues. If the
bound peak is not visible, as opposed to merely unassigned, the distance to the nearest unassigned peak
could still be a large overestimate of the CSP.

177
Figure 5.25: Map of CSP values onto the first 187 residues of t242. The additional 45 residues at the C-
terminus are assumed to be unstructured, and there is no CSP data available for them. The affected
residues are mostly in RRM1, as was expected based on the t187 data.
As with t187, most of the residues perturbed on titration with the CUG15 RNA
are localized to RRM1, with only limited effects in RRM2. Cys61 is the most
perturbed residue for which a CSP could be calculated. Both Phe19 and Phe63 are
lost on titration, as are residues in all four strands of the β-sheet. The CSP for
Lys95, could not be quantified as the peak from the bound form was obscured by

178
some of those from the unstructured region. Since the peak from the free form
was lost Lys95 is definitely affected, consistent with the earlier titrations. In
RRM2 the peaks from a few residues are lost, such as Phe111, Ala151 and
Val182. Cys150 is not significantly affected, again consistent with the
corresponding titration with the t187 construct. A repeat of the EDEN15 titration
with t242 also matched the results for t187.
In conclusion, these experiments determined that there is no significant difference
in the RNA binding properties of the t187 and t242 constructs, suggesting little
involvement of the unstructured region immediately after RRM2. Since the
spectrum of the unbound t242 matches very closely to that of the unbound t187
complex it can be concluded that there is no dimerisation occurring due to the
additional residues from the RRM2 – RRM3 linker. If these residues did result in
dimerisation, it would be expected that there would be significant changes in
chemical shift for the residues in the dimerisation interface. While the protein
concentration in these experiments was relatively low at 100 µM, if a
physiologically relevant dimerisation event is occurring then at least some
population of the dimer should be visible in these spectra. No variation in the
t187 spectrum was seen for concentrations ranging from 10 µM to 1 mM.
These results confirmed that the C-terminus of RRM2 is not involved in binding
to RNA. This in conjunction with the earlier 15
N heteronuclear NOE data shows
that no critical regions for RNA binding have been omitted from the t187 and
isolated domain constructs. The behaviour of these proteins is therefore
representative of the behaviour of the domains of wild type CELF1.
179
5.7 Summary of Cooperative Binding by the N-terminal
Domains of CELF1 to RNA targets
The data presented in this chapter shows that tandem binding of multiple CELF1
domains to RNAs with more than one UGU site greatly increases the overall
affinity of the interaction. Kd values are reduced from tens of micromolar for the
domains binding in isolation to less than one micromolar for optimal RNA
targets. This increase in affinity is most pronounced for cooperative binding of
UGU sites. There does appear to be some increase in affinity for UAU sites when
the domains bind in tandem, but not to the same extent as was seen for UGU
sites. UGC sites do not appear to show any significant increase in affinity. As for
the isolated domains most of the interaction with CUG repeat RNA substrates is
occurring via RRM1, with minimal perturbation of residues in RRM2.
We have shown that the separation between UGU sites is critical in determining
whether a given RNA sequence can bind both domains in tandem. For optimal
binding an absolute minimum of 2 nucleotides between UGU sites is required.
The upper limit is not as well defined, with a gradual decline in binding affinity
seen for spacers of 5 or more nucleotides. Even with a seven nucleotide spacer
there was still a tenfold increase in binding affinity compared to the isolated
domains. The optimal target sequence of the N-terminal domains of CELF1 was
therefore concluded to be UGU(U)xUGU with x between 2 and 4, which were
found to have a Kd of around 400 nM.
The 15
N heteronuclear NOE data shows that even when bound to an optimal RNA
target, there remain some intrinsic dynamics in the linker region that facilitates
binding to RNAs with a range of spacer lengths. This in combination with the
data collected on the extended t242 construct showed no involvement of the N- or
C-terminal unstructured regions in RNA binding, contrasting with the N-terminal
extension involvement reported for RRM3.

180
Both the EDEN11 GRE and EDEN15 sequences have been demonstrated to form
high affinity complexes with the two N-terminal domains of CELF1, consistent
with them being “EDEN” motifs targeted by the full length CELF1 protein. Both
sequences have unoccupied UGU sites, which could potentially be bound by the
third RRM, increasing the affinity even further.
Figure 5.26: Possible arrangements of full length CELF1 on a repeating UGUU RNA substrate such as
EDEN15 or EDEN11. Red arrows indicate possible locations of the binding site for RRM3 on the RNA
strand. Since RRM1 and RRM2 have been shown to occupy the outer two UGU sites of EDEN11, there is
potentially an unoccupied site between the domains. If this site cannot be bound by RRM3, then an
additional UGU site must be added to the sequence towards either the 5’ or 3’ end of the RNA strand.
The length and flexibility of the RRM2 – RRM3 linker meant that any of these positions initially appeared
to be plausible. This was further investigated in chapter 6.
For the EDEN11 GRE to be binding all three RRMs, RRM3 would have to
occupy the central UGU site between RRM1 and RRM2, as shown by the central
arrow in Figure 5.26. If this site is too hindered for RRM3 to bind then a longer
RNA with an additional UGU site (such as the EDEN15 GRE) would be required.
The length of the RRM2 – RRM3 linker is sufficient that it seems possible RRM3
could bind either towards the 5’ end or to the 3’ end of the other two domains.

181
6 Optimal RNA Targets of Full Length CELF1
6.1 Introduction
Wild type full length CELF1 is known to form a high affinity interaction with an
RNA motif found in the 3’ UTR of the mRNAs that the protein regulates. This
had been termed the “EDEN motif”, but the sequence or range of sequences that
could be recognised by CELF1 was not well defined. Some mRNAs, such as c-
mos, c-jun and TNFα have been shown empirically to be bound by CELF1
triggering deadenylation, but it is not clear which regions of these sequences are
being recognised. Without knowing the exact criteria for an EDEN motif, it is not
possible to predict whether any given mRNA is regulated by CELF1.
Full length CELF1 consists of three RRMs. The two N-terminal domains were
investigated by NMR and ITC in the previous chapters. X-ray crystallography
data on these domains was also collected by Teplova et al. (2010). The C-
terminal RRM3 was investigated in isolation by Tsuda et al. (2009). However no
data had been collected on the full length CELF1 protein containing all three
domains, so it was not known how they worked together in order to bind a
complete EDEN motif.
Some consensus sequences which constitute possible EDEN motifs have been
discussed previously. Vlasova et al. suggested the EDEN11 GRE
(UGUUUGUUUGU) and Graindorge et al. the longer EDEN15
(UGUUUGUUUGUUUGU) sequence. Rattenbacher et al. (2010) later suggested
a long UG repeating sequence as a possible EDEN motif, while Masuda et al.
(2012) suggested UGUUUGU (the EDEN7 sequence previously investigated).
While all of these sequences were shown to be capable of binding to CELF1, it
was not known if they were interacting with all three RRMs simultaneously, or
sufficient to trigger deadenylation. These sequences could therefore be only

182
partial EDEN motifs, interacting with a subset of the CELF1 RRMs. The target
identified by Masuda et al. (UGUUUGU) was already known to be incapable of
interacting with both N-terminal RRMs simultaneously from work in the previous
chapter. The question was therefore whether the longer EDEN11 GRE and
EDEN15 sequences were complete, or merely partial targets for full length
CELF1.
Previous in vitro studies of CELF1 had all used constructs of one or two RRMs
rather than the full length protein. Our initial aim was therefore to devise a
purification protocol for the complete CELF1 protein. Using this we would then
determine by NMR and ITC whether the reported EDEN11 and/or EDEN15 GRE
consensus sequences do in fact represent high affinity “EDEN motifs” targeted by
CELF1. If these sequences were not complete EDEN motifs, we then aimed to
design high affinity RNA sequences capable of binding all three RRMs based on
our data on preferences of the smaller constructs. From this we would refine the
overall criteria for an EDEN motif, and use these to explain how CELF1 is
recognising known mRNA targets such as c-jun, c-mos and TNFα.
6.2 Purification of Wild Type CELF1
To study how all three RRMs of CELF1 interact, it was necessary to develop a
purification protocol for the full length protein. This proved problematic due to
the protein undergoing rapid proteolysis in the linker region between RRM2 and
RRM3. The DNA for the full 489 residue CELF1 protein in a pET28b(+) vector
(supplied by Dr. Emilie Malaurie, University of Nottingham) was transformed
into XL1 Blue, and then BL21 (DE3) cells. Initial test growths showed some
solubility issues. At 37°C the protein expressed, but rapidly became insoluble, as
can be seen in the SDS-PAGE gel in Figure 6.1.
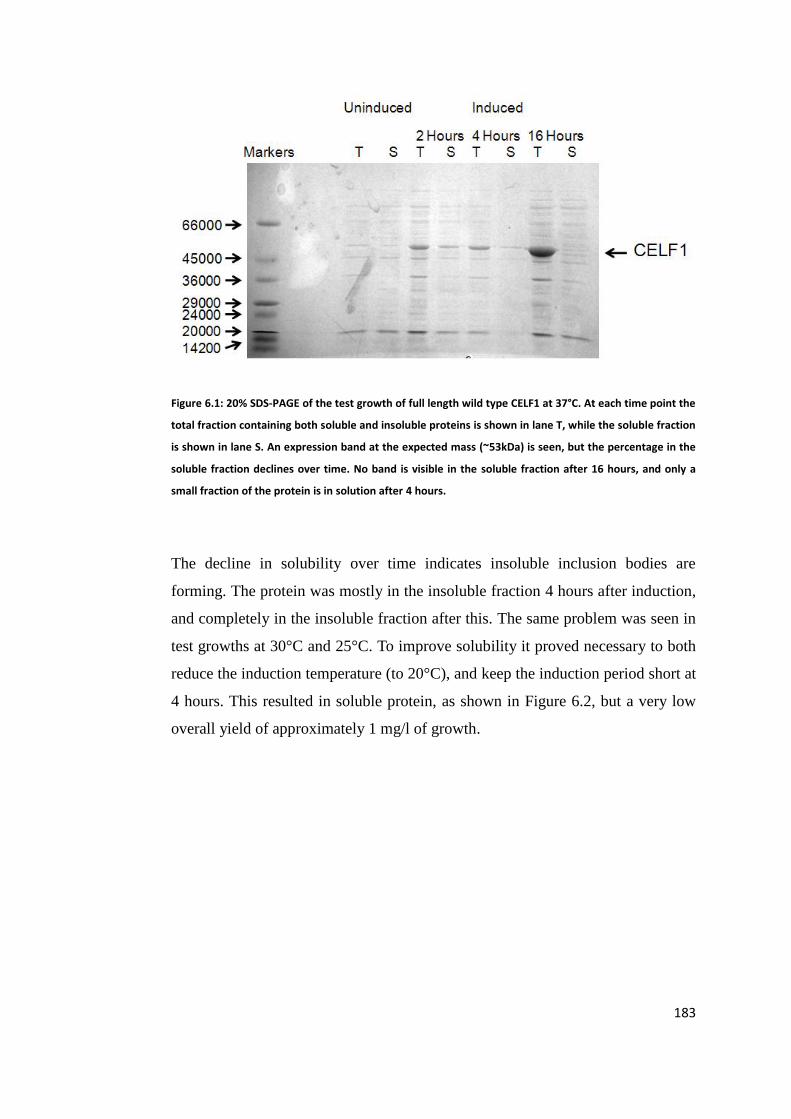
183
Figure 6.1: 20% SDS-PAGE of the test growth of full length wild type CELF1 at 37°C. At each time point the
total fraction containing both soluble and insoluble proteins is shown in lane T, while the soluble fraction
is shown in lane S. An expression band at the expected mass (~53kDa) is seen, but the percentage in the
soluble fraction declines over time. No band is visible in the soluble fraction after 16 hours, and only a
small fraction of the protein is in solution after 4 hours.
The decline in solubility over time indicates insoluble inclusion bodies are
forming. The protein was mostly in the insoluble fraction 4 hours after induction,
and completely in the insoluble fraction after this. The same problem was seen in
test growths at 30°C and 25°C. To improve solubility it proved necessary to both
reduce the induction temperature (to 20°C), and keep the induction period short at
4 hours. This resulted in soluble protein, as shown in Figure 6.2, but a very low
overall yield of approximately 1 mg/l of growth.

184
Figure 6.2: 20% SDS-PAGE from a short induction, low temperature test expression. The protein
expression was induced with 1 ml of IPTG for 4 hours at 20°C to prevent formation of insoluble inclusion
bodies. The CELF1 expression band is visible, and the majority of the protein seems to be in the soluble
fraction. At this stage the protein is intact. Fragmentation of the RRM2 - RRM3 linker does not occur until
after the cells are lysed.
While less protein was expressed in total, more of it is in the soluble fraction than
after 4 hours at 30°C. These durations and temperatures were therefore used for
large scale growths. Cell lysis and the IMAC column stage of the purification
were initially carried out using the same basic protocol as for the t187 construct.
A Roche EDTA free protease inhibitor cocktail was added to the resuspended
cells prior to sonication. The time allowed for binding to the cobalt resin was
restricted to one hour in order to minimise the time available for proteases to
break down the protein. Samples from each stage of the purification were
analysed by SDS-PAGE to check the condition of the eluted protein. The
resulting gel is shown in Figure 6.3.

185
Figure 6.3: 20% SDS-PAGE of the IMAC column washes and elution fractions from a purification of
unlabelled wild type CELF1. The wash step consisted of 25 ml of buffer A + 10 mM imidazole. The
“unbound” lane is a diluted sample of the cell lysate drained from the IMAC column. The presence of
multiple bands in the elution fractions indicate that the full length CELF1 has largely fragmented by this
stage of the purification.
While a small amount of intact CELF1 was visible as the uppermost band on the
gel (with a mass of approximately 53 kDa), the vast majority of the protein had
been fragmented. The presence of multiple strong bands with masses of 24 - 36
kDa indicates that all these fragmentation sites are in the linker between RRM2
and RRM3. The protease inhibitor cocktail evidently was not effective in
preventing proteolysis of the full length CELF1 protein. The elution fractions
were combined and loaded onto a Superdex 200 gel filtration in an attempt to
separate the remaining intact protein from the truncated forms. The thrombin
cleave step was omitted. The trace of 280 nm absorbance showed multiple broad
peaks. Analysis of the fractions by SDS-PAGE is shown in Figure 6.4.

186
Figure 6.4: SDS-PAGE of the protein containing gel filtration fractions 22 – 30 from a purification of wild
type CELF1 using a Superdex 200 column. Lanes are labelled with the elution fraction number (40 x 10 ml
fractions were collected). The protein has continued to degrade since the drip column stage, and has now
mostly been truncated to a stable fragment of between 24 and 29 kDa.
The void volume for this gel filtration column is 120 ml. No protein bands were
observed in elution fractions from 130 – 210 ml. The vast majority of the
material seen on this gel has a molecular mass of between 24 and 29 kDa,
consistent with protein fragments slightly longer than the t242 construct. It
appears the protein continued to break down during the gel filtration stage, until it
reached the longest stable fragment. Analysis by ESI mass-spectrometry showed
multiple species, even after an additional desalting step into ammonium acetate.
Only a rough approximation of the exact mass of the longest stable fragment
could be calculated.

187
Figure 6.5: ESI mass spectrum of the degradation products of full length wild type CELF1. The total
protein concentration was approximately 2 µM. The major species has a mass of approximately 24799
Da. There is an additional minor species with a mass of approximately 21730 Da.
The major species appears to have a mass of approximately 24800, which does
not match precisely to a fragmentation product of CELF1. The break site,
assuming this is the N-terminal fragment, would be at around Leu217 or Thr218,
though the observed mass does not match precisely to either. This is closer to the
N-terminus than expected, given that the t242 construct appeared stable when
analysed by SDS-PAGE. The C-terminal fragment could not be detected, but may
have been removed at the gel filtration stage.
The earlier gels from the IMAC column stage of the purification also suggest that
the fragmentation is occurring in several places in the linker region from the
number of bands present. If only a small number of protease sites were present
then they could have been removed by point mutation. However the number of
protease sites required to give the range of species seen in the elution fractions
and the difficulties of precisely locating them made this approach impractical.
The main band of ~25 kDa after gel filtration is merely the longest stable

188
fragment, consisting of approximately the first 220 residues, and by this point in
the purification the vast majority of the protein was fully degraded.
CELF1 is expressed intact, and remains so as long as it is in the cell, as can be
seen by SDS-PAGE if all proteins are denatured immediately after cell lysis.
Diluting the cell lysate immediately after sonication slowed the fragmentation
process to some extent, but did not prevent it completely. It was found that lysing
the cells under denaturing conditions (in the presence of 8 M urea) prevented
fragmentation of CELF1, presumably due to denaturation of the proteases
responsible as well. This also had the advantage of solubilising the insoluble
fraction of the protein, allowing a longer induction time to be used resulting in an
improved overall yield. A purification based on denaturing CELF1 at the cell lysis
stage, and refolding it after the gel filtration step was attempted, but the peak
dispersion in the 1D proton NMR spectra indicated that the protein was not
correctly refolded. None of the normal dispersed peaks from the domains could
be observed, and all signals were in a narrow band suggestive of random coil.
Reducing the concentration of urea in the lysis buffer to 4 M still prevented most
of the fragmentation problems. Based on fluorescence experiments with varying
concentrations of denaturant CELF1 should still be mostly folded under these
conditions. Small amounts of intact material (1 - 2 mg per litre of M9 minimal
media) were produced by this method, and confirmed to be folded based on the
peak dispersion in the NMR spectra. The 15
N TROSY spectrum of this material is
shown in Figure 6.6.

189
Figure 6.6: 15
N TROSY of full length wild type CELF1. This spectrum was collected on a 100 µM protein
sample in 50 mM potassium phosphate, 200 mM NaCl, 10% (v/v) D2O pH 7.0 NMR buffer, using an 800
MHz Bruker Avance III spectrometer with a QCI cryoprobe at 298 K. Due to the low signal to noise ratio
360 scans were required to obtain this quality of spectrum. The lengthy acquisition time and poor sample
stability made it impractical to run titrations similar to those carried out on t187 and the isolated RRMs
using this sample.
Peaks with chemical shifts closely matching those of the residues of the isolated
RRM1, RRM2 and RRM3 constructs can be seen. There are also a large number
of peaks from the flexible RRM2 – RRM3 linker visible between 7.5 and 8.5 ppm
in the proton dimension. Solubility remained a serious problem, as the protein
could not be concentrated above ~125 µM without a significant concentration of
urea present. The protein was also insoluble in the 50 mM salt buffers used in
previous experiments, requiring a 200 mM salt concentration in the NMR buffer
resulting in a reduction in signal to noise ratio. The long acquisition times
required made it difficult to carry out NMR titrations similar to those used to
identify the preferred t187 RNA substrate.

190
6.2.1 Production of a Stable Construct Containing all three Domains
To bypass the solubility and stability issues encountered with wild type CELF1 it
was decided to produce a construct in which a large section of the RRM2 - RRM3
linker was removed. This would remove the many fragmentation sites in this
region, and was also expected to improve the solubility of the protein.
The first designed construct consisted of t242 fused to residues 385 - 489 based
on Tsuda et al's RRM3 construct which was reported to be stable, and the t242
construct which appeared to remain intact during the purification (see section
5.6.2). While fragmentation of the protein was greatly reduced, the solubility for
this new construct remained low, with a maximum concentration of ~125 µM in
the 50 mM potassium phosphate, 200 mM NaCl buffer. The construct was
therefore further shortened to residues 1 - 214 fused to 385 - 489 on the basis that
t242 had been previously observed to have solubility issues, while RRM3 did not.
This shortened construct proved to be both stable and soluble to protein
concentrations of at least 500 µM in buffer A. Purification yields were improved
to ~15 mg/l when grown in LB and 8 - 9 mg in M9 minimal media. The
interaction of all three RRMs to bind long RNAs could be studied by NMR and
ITC using this new construct, which was termed RRM123. With around 30
residues of flexible protein remaining between RRM2 and RRM3, the domains
were still free to adopt any orientation relative to each other.
6.2.2 Production of Deletion Mutants Using a Single Step PCR
These constructs were produced using a one-step PCR deletion method as
outlined by Qi et al. (2008), from the wild type CELF1 DNA, as specified in
section 3.15.6. In this method the primers are designed so that the PCR amplifies
the entire plasmid except for the section to be deleted. The primers consist of two
sections; a short overlapping section with a low annealing temperature and a

191
longer non-overlapping section which will anneal to the template DNA at a
temperature at least 5 K higher166
.
The PCR is run for 18 cycles at a temperature where the non-overlapping sections
of the primer will anneal, but the overlapping sections will not. This amplifies the
entire plasmid except the section to be deleted, and leaves complementary “sticky
ends”. The temperature is then reduced so that these ends anneal to each other,
reforming the plasmid into a circle, as shown below in Figure 6.7. This is
followed by a final elongation step of 30 minutes.
Figure 6.7: Above is shown the design of primers in this one step deletion method. In the initial higher
temperature stage of the PCR the non-overlapping regions of the primers anneal, amplifying the entire
plasmid except for the region to be deleted. The complementary sections of the primers anneal at the
lower temperature.
As before the sequence of the resulting construct was verified by DNA
sequencing. However the success of the deletion process could also be rapidly
checked using an agarose gel. As the deleted section is relatively large, being in
excess of 500 bases for each of these constructs, the difference in size between
the template DNA and the PCR product is clearly visible after a successful
reaction.

192
Figure 6.8: DNA gel showing the change in plasmid size in a successful deletion PCR. In the left hand lane
is a 2-log DNA ladder (New England Biolabs) as a reference. In lane 2 is the template DNA, in this case the
plasmid containing full length CELF1 in a pET28b vector with a total size of 6500 bp. In lane 3 is the PCR
product from the reaction to produce the RRM123 construct. In lane 4 is the PCR product from a reaction
to produce the RRM3 construct. The difference in size between these two PCR products and the template
DNA is clear.
The plasmid DNA was transformed into XL1 Blue cells. The DNA was extracted
from an overnight cell culture and sequenced to confirm the intended section had
been deleted, after which it was transformed into BL21 (DE3) cells for
expression.

193
6.3 Expression and Purification of RRM123
The expression and IMAC column stages of the purification used the same
protocols as for the t187 construct. RRM123 was found to remain soluble in a 16
hour expression at 30°C, unlike the full length CELF1 protein.
Figure 6.9: SDS-PAGE of the washes and elution fractions from the IMAC column stage of the RRM123
purification. The vast majority of the protein is now intact, and is of the expected molecular weight (38
kDa). The presence of low intensity bands at approximately 25 suggests a small amount of fragmentation
is still occurring, but not to the same extent as seen in Figure 6.3 for the wild type CELF1.
The eluted protein was purified using a Superdex 200 gel filtration column, which
separated out the lower molecular weight fragments of RRM123 as well as any
other impurities. Those fractions containing protein were identified by their
absorbance at 280 nm, and analysed by SDS-PAGE. The results of this are shown
in Figure 6.10.

194
Figure 6.10: SDS-PAGE of gel filtration fractions. RRM123 is remaining intact and in solution throughout
the gel filtration stage of the purification, although it does appear spread across an unusually large range
of fractions.
The mass of the protein was determined by mass spectrometry to be 38348 ± 7
Da. RRM123 has a theoretical mass of 36026 Da, but this protein still has the N-
terminal 6-His tag attached, giving a theoretical overall mass of 38348 Da. A
much larger range of charge states is seen for this construct than for t187, as can
be seen in Figure 6.11. This can be attributed to the unstructured linker region in
RRM123, and the presence of the complete N-terminal His-tag. Denatured
proteins tend to show a very large charge envelope due to the greater ability of the
unstructured peptide chain to pick up additional charges, and this is presumably
the case for the long unstructured regions in the larger CELF1 constructs.

195
Figure 6.11: ESI mass spectrum of RRM123, under native conditions. The protein concentration was 5 µM.
A single species with a mass of 38348 Da is seen, consistent with the His-tagged RRM123 protein. Charge
states ranging from +9 to +40 are seen. This large range compared to the other constructs is presumably
due to both the remaining unstructured section of the RRM2 – RRM3 linker and the 6-His tag.
6.3.1 NMR Characterisation of RRM123
15N labelled material was produced, and an initial
15N TROSY spectrum was
collected on a Bruker Avance III 600 MHz spectrometer. While it required higher
scans and resolution than previous experiments with t187, a spectrum in which
peaks from all three RRMs could be clearly resolved was acquired. A higher
resolution spectrum was later collected at 800 MHz which is shown in Figure
6.12.

196
Figure 6.12: 15
N TROSY spectrum of the RRM123 construct. This was collected on a 250 µM sample in 25
mM potassium phosphate, 100 mM NaCl, 10% v/v D2O pH 7.0 NMR buffer. Data was collected on a
Bruker Avance III 800 MHz spectrometer with QCI cryoprobe at 298 K.
The quality of the spectrum is surprisingly good given this is a relatively large
protein with a mass of 38 kDa. This is likely2 to be due to the favourable internal
dynamics in the protein. Since the three structured RRMs are separated by
flexible linkers and move fairly independently the relaxation rates are likely to be
closer to those of a 12 kDa RRM than a 38 kDa globular protein. The linewidths
of the peaks are therefore still quite narrow, allowing clear resolution of most
peaks despite the spectrum being relatively crowded with signals from more than
300 residues.
Combining the spectra of the three separate RRMs gives a very good match to the
RRM123 spectrum. There are still some additional peaks from the remaining
section of the RRM2 - RRM3 linker, and these are clustered in a narrow band
between 7.5 and 8.5 ppm, indicative of unstructured protein. RRM3 can therefore
be concluded not to interact with the other RRMs or the flexible linker since the
chemical shifts of its residues in the RRM123 spectrum are not significantly

197
different from those in the spectrum of the isolated domain. The RRM1 and
RRM2 chemical shifts as expected match those in the t187 construct, with the
exception of Ala186 and Asp187.
The increased sample solubility and improved signal to noise ratio from the lower
salt concentration meant that adequate resolution of the peaks of all three RRMs
required only 32 scans at a resolution of 2048 x 128 points. This meant that
acquisition times were short enough that RNA titrations could be conducted
easily using this construct.
Assignment of the peaks from all three RRMs was carried out by analogy to the
smaller constructs. No assignment of the peaks from the RRM2 – RRM3 linker
was attempted. This protein does give surprisingly high quality NMR spectra, and
so it should be possible to collect 3D heteronuclear data. The unstructured nature
of this linker would make the assignment strategy used so far problematic, but
alternative assignment strategies for intrinsically disordered regions of proteins
could be used. While the peaks from the side chain Cα and Cβ shifts show very
limited dispersion in intrinsically disordered regions, greater dispersion is seen
for the 15
N and 13
C’ shifts. Alternative HA-detect 3D experiments such as
H(CA)NCO and H(CA)CON can be used to establish backbone connectivities
from these nuclei183
. Further dispersion of peaks could be achieved by the use of
4D or 5D NMR experiments, with non-uniform sampling methods to reduce the
acquisition time required184, 185, 186
.
6.3.2 15N Heteronuclear NOE
To characterise the relative flexibility of different sections of the protein 15
N
heteronuclear NOE data was collected on an 800 MHz spectrometer with
cryoprobe. 168 scans were accumulated at a resolution of 2048 x 256 points.
Experiments with and without the NOE were interleaved to minimise artefacts
from any changes in the spectrum over time.

198
Figure 6.13: 15
N Heteronuclear NOE plotted against residue number. It can be seen that the three RRMs
are highly structured, with the exception of some loop regions. Smaller NOEs are seen for the residues in
the flexible regions between the domains, though assignments are not available for most of the RRM2 to
RRM3 linker.
RRM1 and 2 show similar 15
N heteronuclear NOE values to the t187 construct. A
few residues show NOE values of greater than 1, which is probably due to the
relatively large margin of error in measuring the intensity of some of the weaker
signals. Both domains are quite rigid, with the exception of the N-terminus, the
linker around residues 100 - 107 and the loop from residues 52 - 57 which are
moderately flexible. No assignments are available for most of the RRM2 to
RRM3 linker. RRM3 is quite rigid, though there is a noticeable drop in the
heteronuclear NOE for the N-terminal extension and the C-terminus of the
protein. There is a slight decrease around residue 270, again due to a relatively
flexible loop between two strands of the β-sheet. These loops do not appear to be
involved in RNA recognition, based on NMR chemical shift perturbations and the
available x-ray crystal structures.

199
These flexible linkers allow significant interdomain dynamics, which may
contribute to the high quality NMR spectra that can be collected for this
construct. The overall structure of the RRM123 construct (and presumably also
the 53 kDa wild type CELF1) can be summarised as three “beads on a string”.
The domains are free to move relatively independently with the result that their
relaxation rates are closer to those of than isolated domains than for the average
38 kDa protein. This effect was observed for the RRM1 and RRM2 domains by
Teplova et al. They reported rotational correlation times of 10.2 ns and 9.7 ns for
RRM1 and RRM2 respectively, when connected as a construct of residues 14 –
187 of CELF1187
. These are both lower than the ~12 ns time which would be
expected for a globular protein of the same mass188, 189
. Teplova et al. also noted a
substantial increase in the rotational correlation times for both domains when
bound in tandem to an RNA substrate, to 14.6 ns and 12.0 ns for RRM1 and
RRM2 respectively. This was attributed to restriction of the relative motion of the
domains by the RNA, though the significant difference seen for the two domains
indicates the resulting structure is not completely rigid51
.
6.4 Interactions of RRM123 with the EDEN11 GRE
With the aim of identifying RNA sequences which could bind all three RRMs
simultaneously, NMR titrations were carried out on 15
N-labelled RRM123, using
an 800 MHz NMR spectrometer. The EDEN11 GRE (UGUUUGUUUGU) was
considered as a possible candidate, containing three UGU sites. This RNA was
titrated into a 250 µM sample of 15
N-labelled RRM123.
Chemical shift perturbations were observed for residues on the binding surfaces
of all three RRMs, with generally the same set of affected residues as were seen
with the isolated domains. Gly21, Cys61 and Gln93 from RRM1 and Gly113,
Cys150 and Val182 from RRM2 all show large CSPs. From RRM3 residues such
as Cys446 and Gly448 are strongly perturbed, matching data reported by Tsuda et

200
al. for the binding of RRM3 to UGUGUG in isolation. This confirmed that all of
the RRMs could recognise a UGU(U) site in the EDEN11 GRE. However the
titration did not reach an endpoint until a 2:1 excess of RNA had been reached. At
a 1:1 ratio the peaks were very broad, with far too few resolvable signals to
account for all of the residues. This suggests the midpoint of a titration in
intermediate exchange on the NMR timescale. The peaks from the perturbed
residues are therefore extremely broad, and not observable in the spectra from the
intermediate titration points. Since each of the smaller constructs generally
reached saturation at about a 1:1 RNA to protein ratio this indicated that the
EDEN11 GRE is not forming a tight 1:1 complex, but instead one with a higher
stoichiometry, which would not be expected if the EDEN11 GRE represented a
complete EDEN motif capable of binding all three domains of CELF1.
The fully bound spectrum at a 2:1 excess of RNA is a close match to a
combination of the bound spectra of each of the three RRMs in isolation, and is
shown in Figure 6.14.
Figure 6.14: The 15
N TROSY of the unbound RRM123 is shown in blue. Overlaid in red is the spectrum of
RRM123 after the addition of a 2:1 excess of the EDEN11 GRE RNA (UGUUUGUUUGU). Both spectra were
collected on a Bruker Avance III 800 MHz spectrometer with a cryoprobe. The protein concentration was
250 µM. 32 scans were collected at a temperature of 298K.

201
Figure 6.15: A possible 2:1 complex of RRM123 with the EDEN11 GRE, consistent with the NMR data.
The data suggest that the protein is binding two RNA molecules, one via RRM3,
and the other by the tandem interaction of RRM1 and RRM2, as shown in Figure
6.15. If the binding affinity of RRM3 to the RNA is of comparable strength to the
tandem binding of N-terminal domains to the RNA (as would be predicted based
on the ITC results for t187, and the reported RRM3 ITC data from Tsuda et al.
2009) then at a 1:1 ratio a mixture of bound species would be present. Multiple
species in intermediate exchange would account for the poor signal to noise seen
across the residues in the binding interfaces of all three RRMs. Another
possibility was that all three RRMs were binding onto a single RNA molecule,
but with more than one conformation. For example, it might be possible to
arrange the RRMs in a different order from the 5’ to 3’ end of the RNA substrate
if the linkers between domains are sufficiently flexible. While this would account
for a broadening of the line widths, it would not account for the apparent 2:1
stoichiometry observed for this titration.
As a control experiment a titration with the EDEN4U RNA substrate
(UGUUUUUUGU) was carried out under the same conditions. Since this
sequence contains only two UGU sites, and was known to be an optimal target for
the tandem binding of RRM1 and RRM2, it is definitely not capable of binding
all three RRMs simultaneously. This control titration showed almost identical
results to the EDEN11 GRE case, supporting the hypothesis of EDEN11 forming
a 2:1 complex. Again, the signals were broad and poorly resolved at a 1:1 ratio,
with a recovery of spectrum quality at around a 2:1 excess of RNA.

202
6.4.1 ITC of the EDEN11 GRE Binding to RRM123
The EDEN11 GRE was tested for formation of a 1:1 complex, again using
EDEN4U as a control, with the results shown in Figure 6.16.
Figure 6.16: Binding curves for ITC of 125 µM EDEN11 GRE (UGUUUGUUUGU) and EDEN4U
(UGUUUUUUGU) RNA substrates into 12.5 µM RRM123. Red lines show the best fitting match to a one-
site binding model. Neither titration reaches full saturation at the endpoint (a 2.5:1 excess of RNA).
The EDEN11 GRE and EDEN4U RNA substrates give very similar binding
curves on titration into RRM123. In both cases the titration fails to reach an
endpoint until more than a 2:1 excess of RNA is present. Kd values of around 2
µM are seen for both sequences, which is comparable to that seen in the t187 ITC
data. This is all consistent with the model of two EDEN11 molecules binding to
each protein, with the two binding events having comparable Kd values. This
confirms that RRM3 cannot occupy the central UGU site of an EDEN11 RNA
molecule that has already bound to RRM1 and RRM2. This is consistent with the
conclusion in the previous chapter that t187 is binding to the two terminal UGU
sites of EDEN11, leaving the central UGU site sterically inaccessible.

203
From the Kd values of ~3 µM determined in earlier experiments for t187 binding
to EDEN5U, and 1.9 µM reported for RRM3 by Tsuda et al, it seems likely that
the two binding events in this titration do in fact have quite similar Kd values,
making them competitive. This would account for unresolved binding events
observed in the EDEN4U and EDEN11 ITC experiments, contrasting with the
biphasic scheme seen for RRM1/EDEN7 where the Kd values for the two binding
events are substantially different.
The NMR and ITC data enable us to conclude that the EDEN11 GRE is only a
partial binding motif for CELF1. Its inability to bind all three RRMs
simultaneously is likely to be due to steric effects between RRM3 and the other
domains, as RRM3 would have to bind to the central UGU site. The crystal
structure by Tsuda et al. suggests RRM3 is capable of forming contacts with up to
six RNA bases, and so it was not surprising that it might require a greater spacing
between binding sites than the other two RRMs.
6.5 CELF1 Recognition of the EDEN15 GRE
The ITC and NMR data collected on the shorter EDEN11 GRE showed
unambiguously that it cannot bind all three RRMs simultaneously, and so does
not represent a complete EDEN motif. Although the EDEN11 GRE has been
presented as a consensus sequence in the recent literature, the analysis by
Graindorge et al. in 2008 originally suggested a fourth UGU site might be
conserved, giving the longer GRE sequence EDEN15 as a possible complete
EDEN motif.

204
RNA Sequence
EDEN11 UGUUUGUUUGU
EDEN15 UGUUUGUUUGUUUGU
(UGUC)4 UGUCUGUCUGUCUGU
GU15 GUGUGUGUGUGUGUG
The RNA substrate (UGUC)4 was investigated by ITC. This has four potential
UGUX sites, with the same spacing as the EDEN15 GRE. The binding curve
showed both a higher affinity than the EDEN11 GRE (Kd = 0.53 µM), and
stoichiometry consistent with a 1:1 complex (n = 0.84). A 15 nucleotide GU
repeat RNA substrate, similar to that suggested by Rattenbacher et al. (2010) was
also investigated and found to give similar results as shown in Figure 6.17.
Figure 6.17: ITC Binding curves for the RNA substrates GU15 and (UGUC)4. In red are shown the best fits
to a 1: 1 binding model that could be obtained. Data processing carried out using MicroCal Origin 7.0.

205
From the ITC data it appears that both GU15 and (UGUC)4 form a 1:1 complex
with RRM123. Since EDEN15 has the same spacing between UGU sites as the
(UGUC)4 sequence, it could be concluded that the EDEN15 GRE will form a
high affinity 1:1 complex with RRM123, and so appears to represent a complete
EDEN motif. The binding affinities, while higher than for the EDEN11 GRE with
RRM123 are still not much improved compared to those seen for tandem binding
of the N-terminal domains. This suggests that while EDEN15 and similar
sequences are capable of binding all three RRMs, the spacing between UGU sites
may not be optimal.
In GU15 the separation between the UGU sites is 1 and 3 nucleotides, while in
(UGUC)4 it is 1 and 5 nucleotides. In both cases binding all three RRMs onto a
single RNA molecule requires two of the RRMs to be occupying UGU sites with
only a single nucleotide separating them, as illustrated in Figure 6.18. Since this
was known not to be possible for the two N-terminal domains, it seemed to imply
that RRM2 and RRM3 could tolerate this tight spacing between UGU sites. This
was surprising, given that both of these domains were predicted to recognise
UGUX sites and so would be expected to require more space than RRM1.
Figure 6.18: Possible arrangements of the three domains of CELF1 on the proposed EDEN motifs EDEN15
and GU15. In both cases two of the domains must occupy UGU sites separated by a single nucleotide,
which is known not to be possible for the N-terminal domains RRM1 and 2.

206
6.6 Design of a High Affinity EDEN Motif
For optimal binding it was expected that RRM3 would need a greater spacing
between the third UGU(U) site and the other two. Since the minimum spacing
requirement for t187 had been determined it was possible to return to the known
natural targets of CELF1, and examine the spacing between suitable sites for t187
and the next nearest UGU site. Based on these it was concluded that a spacing of
2 – 4 nucleotides between UGU sites was relatively common in the known
natural targets.
c-fos: UGUUCAUUGUAAUGUU
TNFα: UGUUCCCAUGU………….UGU
c-jun: UGUUUGGGUAUCCUGCCCAGUGUUGUUUGU…
c-mos: UAUAUGUAUGUGUUGUUUUAUGUGUGUGUGUGUGCU
This spacing was consistent with the c-mos and c-fos targets. It could also
account for binding to c-jun if secondary structure in the spacing region could
bring distant UGU sites together. This involvement of secondary structure
appeared to be the only way to account for binding to TNFα, in which the third
UGU site is separated by more than 30 nucleotides. Based on this observation the
RNA substrate EDEN-2U/4U (UGUUUUGUUUUUUGU) was designed. RRM1
and 2 could potentially bind across either spacer with high affinity. RRM3 could
be allowed up to four nucleotides between its site and the adjacent site, which
was expected to improve the binding affinity compared to EDEN15 and similar
RNA substrates. Also designed was a variant that used an RNA hairpin to bring
two of the UGU sites into close proximity: EDEN-2U/HL
(UGUUUUGUUCCCGAGGACGGGUUGU). These two RNAs were
investigated by NMR and ITC to determine if they formed a 1:1 complex, and if
the binding affinity was improved compared to the EDEN15 GRE.
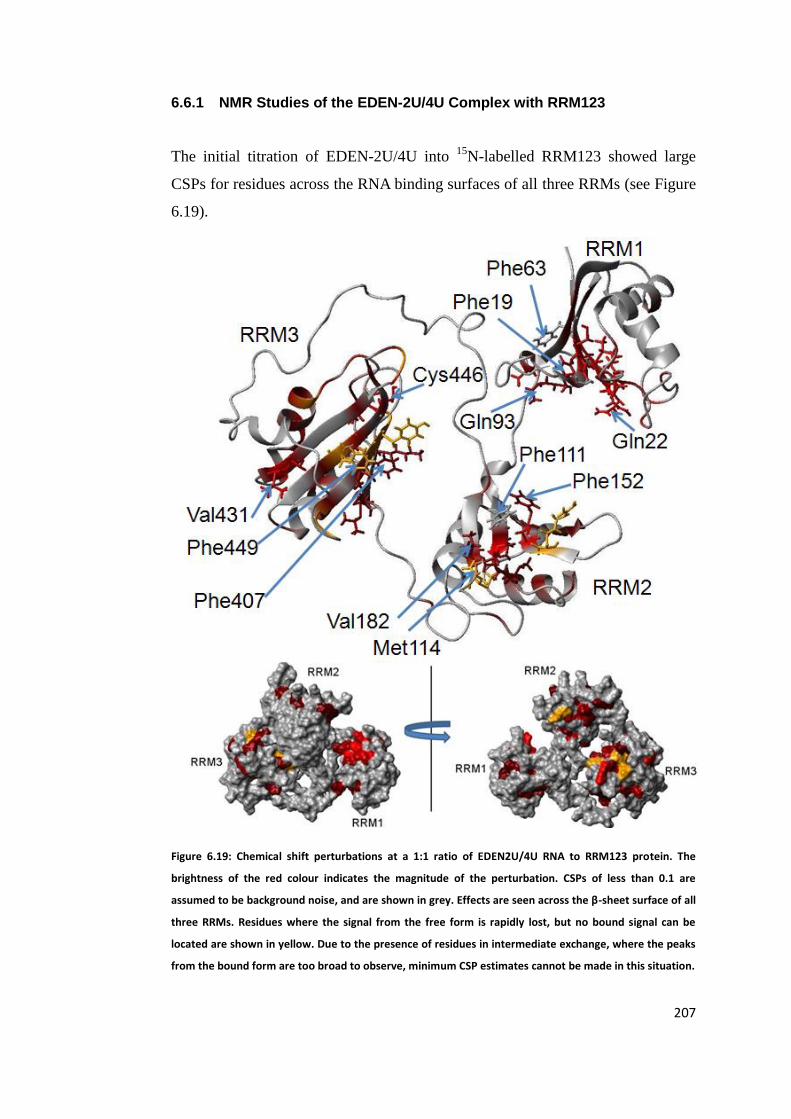
207
6.6.1 NMR Studies of the EDEN-2U/4U Complex with RRM123
The initial titration of EDEN-2U/4U into 15
N-labelled RRM123 showed large
CSPs for residues across the RNA binding surfaces of all three RRMs (see Figure
6.19).
Figure 6.19: Chemical shift perturbations at a 1:1 ratio of EDEN2U/4U RNA to RRM123 protein. The
brightness of the red colour indicates the magnitude of the perturbation. CSPs of less than 0.1 are
assumed to be background noise, and are shown in grey. Effects are seen across the β-sheet surface of all
three RRMs. Residues where the signal from the free form is rapidly lost, but no bound signal can be
located are shown in yellow. Due to the presence of residues in intermediate exchange, where the peaks
from the bound form are too broad to observe, minimum CSP estimates cannot be made in this situation.

208
With this RNA substrate there were some noticeable differences in the binding
characteristics compared to earlier titrations. The signal to noise ratio remained
poor throughout the titration, and was not recovered even at large excesses of
RNA (3:1), unlike in the EDEN11 GRE and EDEN4U titrations. A 15
N TROSY
spectrum with a greatly increased number of scans (720) was collected on a
sample with a 1:1 ratio of RNA to protein, which showed only peaks
corresponding to the bound spectrum for all three RRMs (shown in Figure 6.20).
This can be seen most clearly for residues with large CSPs, such as Cys61,
Cys150 and Gly478. The glycine and cysteine regions of the spectrum have been
expanded and compared to the corresponding regions from the EDEN11 GRE
titration in Figure 6.21.
Figure 6.20: Complete 15
N TROSY at a 1:1 ratio of RRM123 and EDEN2U/4U, illustrating the decrease in
spectrum quality compared to the free form, and the 2:1 complex with EDEN11 GRE. Peaks
corresponding to the bound form of all three RRMs are visible. No peaks specific to the free form can be
seen. This spectrum was acquired with 720 scans on a Bruker Avance III 800 MHz spectrometer with QCI
cryoprobe at 298K.
Cys61 and Cys150 both show large CSPs, matching those seen for the titration of
t187 with EDEN4U. In the glycine region of the spectrum from RRM1 Gly21,
Gly60 and Cys62 also show significant CSPs. From RRM2 Gly113, Gly149 and

209
to a lesser extent Gln172 can be seen to move. RRM3 shows major CSPs for
Gly416, Cys446 and Gly448, which match the observations reported for binding
of RRM3 to a UGU site. The chemical shifts in the bound spectra for the 2:1
complex of EDEN11 with RRM123 and the 1:1 complex of EDEN-2U/4U with
RRM123 are almost identical.
Figure 6.21: Expanded view of two regions of the 15
N TROSY spectrum, showing the residues most
affected on binding to RNA. The spectrum of the unbound RRM123 is shown in blue. Overlaid in maroon
is the spectrum at a 1:1 ratio with the EDEN11 RNA substrate, where very few peaks are visible. In green
is the spectrum at a 1:1 ratio with the EDEN-2U/4U substrate, where peaks from the bound form are
clearly visible. In red is the spectrum for a 2:1 ratio of EDEN11 to RRM123, where the peaks from the
bound form have appeared.

210
No peaks specific to the free form could be observed in the EDEN-2U/4U case so
it appears that the protein is fully bound at a ratio of 1:1. However the bound
complex is showing a reduced signal to noise ratio and much broader linewidths
compared to the end point of the EDEN11 titration. The poor signal to noise ratio
cannot be attributed to intermediate exchange in this case. The peaks at a 1:1
ratio, while broad, match the bound chemical shifts of the isolated RRMs, and so
are not at a population weighted average of the free and bound forms. The signal
intensity is also not recovered for large excesses of RNA, which would be
expected in the case of intermediate exchange.
The reduced spectrum quality could be due to the formation of a bound complex
which is less dynamic and slower tumbling than the free protein. The high quality
of the NMR spectra collected from unbound RRM123 samples has been
attributed to the interdomain dynamics and resulting short rotational correlation
times for the protein. If the dynamics of the protein change on binding, for
example if it becomes more rigid and compact as all of the RRMs bind onto a
single RNA molecule, this effect will be lost. The correlation times for RRM1 and
RRM2 reported by Teplova et al. suggest this is occurring when the N-terminal
domains bind in tandem51
. It is therefore possible that a similar restriction is
placed on the motion of RRM3 when all three domains are bound simultaneously
to a single RNA molecule. Relaxation rates will become faster, resulting in more
rapid loss of magnetisation and hence a poorer signal to noise ratio in the NMR
spectrum. In contrast the signal to noise ratio was recovered in the EDEN11 GRE
titration as RRM3 remained free to move relative to RRM1 and RRM2 due to
binding a separate RNA molecule. Therefore the data for the complex of
RRM123 with EDEN-2U/4U is consistent with a slow tumbling 1:1 complex with
all three domains bound simultaneously.

211
6.6.2 Size Exclusion Chromatography
If the loss of signal is due to the protein becoming more compact on binding all
three RRMs to a single RNA molecule, it would be expected that size exclusion
chromatography (SEC) could confirm this. The rate at which the protein complex
moves through the gel matrix is dependent not only on the mass, but also the
shape of the protein. A more globular complex would be expected to elute
significantly later than the unbound protein.
SEC however showed only a minimal difference between the free and bound
RRM123. The bound complex eluted around 0.5 ml earlier than the unbound
complex, as shown in Figure 6.22. It is possible this is due to the opposing
influences of an increase in mass on binding to the RNA and the formation of a
more compact protein complex. However the RRM123/EDEN11 complex was
used as a control, and also showed little difference in the elution volume. This
should have a higher mass than the RRM123/EDEN-2U/4U complex, and is not
expected to be more compact than the free protein. From these results it was
inconclusive whether the loss of signal in the NMR spectrum was due to a more
compact bound form of the protein.

212
Figure 6.22: 280 nm absorption traces for size exclusion chromatography on an analytical Superdex
GF200 column. The protein/RNA complexes are remaining intact when travelling through the column, as
is clear from the increased 280 nm absorbance of the complexes compared to an equal concentration of
the RRM123 protein. The maximum point of each peak has been marked with a vertical line in the same
colour.
Ion mobility mass spectrometry to measure the cross-sectional area of the protein
complex is another potential method to confirm this. In this technique the ions
produced by ESI travel through a tube with an applied electric current. A carrier
buffer gas flows in the opposite direction, impeding the motion of the ions.
Depending on the size and shape of the ions, they have different collision cross
sections for the buffer gas molecules to collide with. The ions therefore travel at
different speeds to the detector depending on their collision cross sections.
Unfortunately ESI-MS of the complex resulted in very broad signals and poor
quality spectra, preventing a comparison to the unbound RRM123 being made.
This is probably due to an increase in salt adducts due to the longer RNAs
compared to those used in mass spectrometry of the isolated RRMs and the t187
construct.

213
6.6.3 RRM123 Binding to an RNA Substrate Containing a Hairpin Loop
The EDEN-2U/HL substrate (UGUUUUGUUCCCGAGGACGGGUUGU) was
designed to test the hypothesis that secondary structure in the RNA could bring
distant UGU sites together resulting in a higher overall binding affinity. This
RNA contains a hairpin between the expected t187 and RRM3 sites with a
predicted stability of -5.2 kcal/mol, as shown in Figure 6.23179
. The RNA was
confirmed to form a hairpin in solution using 1D proton NMR, which identified
imino peaks in the 12 - 14 ppm region of the spectrum.
Figure 6.23: Secondary structure of the EDEN-2U/HL RNA substrate, as predicted by the RNA Institute
mFOLD web service179
.
Hydrogen bonding between RNA bases results in distinctive chemical shifts
downfield of the other RNA signals. With four C-G base pairs forming the “stem”
of the hairpin, it would be expected to see four signals in this region if the hairpin
is present. In the 1D proton NMR of the RNA three signals were observed, at
shifts of 13.33, 12.65 and 12.18 ppm. The signal at 12.18 ppm is significantly
more intense than the other two, and so may be caused by two protons with very
similar shifts. This confirms that at least three of the C-G base pairs and hence the
RNA hairpin is forming in solution.

214
Figure 6.24: 1D proton NMR of the endpoint of the titration of 15
N labelled RRM123 with EDEN2U/HL.
The imine peaks at the far left of the spectrum are clear indicators of the presence of RNA secondary
structure. Theoretically there should be one peak for each of the four C – G base pairs in the hairpin. Only
three clearly resolved peaks can be seen, but the more intense peak at 12.18 ppm may be due to two
peaks with very similar proton chemical shifts.
As with the EDEN-2U/4U substrate, CSPs are seen across the RNA binding
surfaces of all three RRMs. The same loss of spectrum quality is seen, and again
is not recovered with a large excess of RNA. The 1:1 high affinity complex is
therefore still forming, despite the insertion of the RNA hairpin between two of
the UGU sites. The imino peaks from the RNA hairpin are present at the end of
the titration, confirming that CELF1 is capable of binding across the base of the
hairpin without breaking it apart. This is consistent with the AFM data reported
by Michalowski et al. which showed CELF1 only binding to the single stranded
ends of long CUG repeat hairpins and not to the stems.

215
6.6.4 ITC of RRM123 Binding to EDEN-2U/4U and EDEN-2U/HL
The EDEN-2U/4U and EDEN-2U/HL substrates which were identified as
forming high affinity 1:1 complexes by NMR were also examined by ITC, with
the results shown in Figure 6.25.
Figure 6.25: Binding curves from the titration of 125 µM EDEN-2U/4U (UGUUUUGUUUUUUGU) and
EDEN-2U/HL (UGUUUUGUUCCCGAGGACGGGUUGU) into 12.5µM RRM123. Red lines show the curves
from the one site binding model the data is fitted to. The first data point has been removed from each
data set because the volume of the first aliquot is generally inaccurate.
The EDEN-2U/4U substrate did produce a simple 1:1 curve when titrated into
RRM123. Fitting to a one site binding model gave an n value of 0.85, showing a
clear contrast with the n values of 1.45 and 1.64 observed for the EDEN11 and
EDEN4U substrates. The Kd was calculated as 110 nM, which is the highest
affinity so far observed by ITC for any combination of the CELF1 constructs and
RNA substrates.
The EDEN-2U/HL RNA showed a similar binding curve, with a somewhat lower
affinity (Kd = 550 nM). While the presence of a hairpin in the spacer may be

216
having a slight negative effect on the binding affinity, the stoichiometry appears
to be the same as seen for EDEN-2U/4U (n = 0.83), which is consistent with the
NMR data. Unlike the earlier ITC experiments with CUG repeat hairpins, there
were no signs of the hairpin breaking apart on binding, which would have been
expected to introduce a second endothermic event similar to that seen for the
earlier t187/CUG15 titration, altering the overall shape of the ITC trace. This is
consistent with the 1D proton NMR of the bound complex showing peaks in the
11 – 13 ppm region from Watson-Crick base pair hydrogen bonding in the stem of
the hairpin.
ITC data was also collected for the EDEN-2U/4U and EDEN-2U/HL sequences
as a reverse titration with the RNA in the cell and the RRM123 protein in the
syringe. This was to examine how the protein behaved in the presence of large
excesses of RNA, and to clarify whether the poor signal to noise in the NMR
spectra at large excesses of RNA was due to multiple species forming.

217
Figure 6.26: ITC curve for a titration of 250 µM RRM123 into 25 µM EDEN-2U/4U. 30 x 10 µl aliquots were
injected at 5 minute intervals.
Both EDEN-2U/4U and EDEN-2U/HL showed an unusual shape to the start of
the ITC curve, i.e. where there was a large excess of RNA present. The difference
in the ITC traces for titrating protein into RNA compared to titrating RNA into
protein can be rationalised. If this protein construct forms a high affinity complex
with all three RRMs bound to this RNA sequence, then in a situation with a large
excess of protein it would be expected that only simple 1:1 binding would be
seen. Once a protein binds to the RNA substrate via one RRM, the chelate effect
should strongly favour binding of the other two RRMs onto the same RNA
molecule if there are suitable sites for them. This is the case for the RNA into
protein titrations. In contrast if the RNA is in very large excess then the formation
of complexes with two or possibly three RNA molecules per protein becomes
more favourable. The formation and later dissociation of these complexes as the

218
protein to RNA ratio increases could account for the anomalous shape of the
curve in the protein into RNA titrations for molar ratios of 0 to ~0.6 protein to
RNA. Once the protein concentration increases, formation of the 1:1 complex
becomes more favourable, resulting in the second part of the curve which shows
similar Kd and enthalpy changes to those seen in the RNA into protein titration.
6.6.5 Comparison of ITC Data shows Two Distinct Binding Schemes
Since the titrations with the EDEN11, EDEN4U, EDEN-2U/4U and EDEN-
2U/HL substrates were run under exactly the same conditions they could be
compared directly by overlaying the ITC binding curves. This overlay is shown in
Figure 6.27 and clearly shows that these four titrations can be divided into two
distinct binding schemes, one indicative of 1:1 stoichiometry and one suggesting
a higher stoichiometry.
Figure 6.27: Comparison of the ITC traces for RRM123 on titration with EDEN4U, EDEN11, EDEN2U/4U
and EDEN2U/HL. In all cases 125 µM RNA was titrated into 12.5 µM RRM123, in 30 x 10 µl aliquots.
Where RRM123 can bind all three RRMs simultaneously to the RNA (in the
EDEN-2U/4U and EDEN-2U/HL cases) the titration reaches saturation point

219
earlier, and there is a larger enthalpy change. When all the domains cannot bind
simultaneously (in the EDEN11 and EDEN4U cases) the titration does not reach
saturation until more than a 2:1 excess of RNA is present. This suggests that at a
1:1 ratio a mixture of species is present, with some proteins bound to the RNA via
their N-terminal domains and some bound via the RRM3 domain, as shown in
Figure 6.28. The binding affinities for these events are believed to be similar,
accounting for the lack of resolvable binding events in the ITC trace. At a 2:1
excess all proteins can bind to two RNA molecules. In contrast in the scheme
where all three RRMs can bind simultaneously the higher affinity 1:1 complex is
not affected by addition of further RNA.
Figure 6.28: This diagram shows the species present in each of the two binding schemes at a 1:1 and 2:1
ratio of RNA to protein.
6.7 Refining the Criteria for an EDEN Motif
The spacer lengths of 2 and 4 nucleotides were originally selected based on a
combination of known mRNA targets of CELF1, and the spacing requirements
seen for the two N-terminal domains. Once these were known to permit the
formation of a high affinity 1:1 complex it was necessary to investigate the

220
minimum and maximum spacer lengths tolerated as was done for the t187
construct, in order to determine the overall criteria for an EDEN motif. In
addition, since the two spacers are not necessarily the same length, it was
important to determine if CELF1 showed any preference in the 5’ to 3’ order of
them.
6.7.1 EDEN4U/2U
The closest matching section to the EDEN-2U/4U RNA substrate from the
naturally occurring mRNAs is a sequence from the c-fos ARE.
c-fos ARE 14-30: UGUUCAUUGUAAUGUU
EDEN-2U/4U: UGUUUUGUUUUUUGU
There are differences, as some of the U spacers have been replaced with A and C
bases, and the 2U/4U spacers have been reversed. However this still seemed a
likely candidate to form a 1:1 complex with RRM123. Since it is possible that the
RRMs have a preference for a specific 5’ – 3’ order on the RNA strand the
arrangement of the spacer lengths may be relevant. The ITC experiment with the
RNA EDEN-4U/2U (UGUUUUUUGUUUUGU) was used to check for any
difference in binding affinity.
Reversing the spacers did result in some loss of binding affinity (the Kd was
increased from 110 nM to 980 nM), but still permitted a 1:1 complex to form. It is
not clear whether the change in binding from EDEN-2U/4U involves reversing
the 5’ to 3’ arrangement of the RRMs on the RNA. It could simply be the case
that RRM1 and RRM2 are still bound at the 5’ end of the RNA, across the 4U
spacer, while the 2U spacer is still sufficient for RRM3 to bind at the 3’ end. The
results of the EDEN15 titrations suggested that RRM3 can tolerate even a one
nucleotide spacer. It therefore seems likely that RRM3 can bind across the 2U

221
spacer as well as the 4U spacer. If RRM3 and the neighbouring RRM begin to
clash when binding to UGU sites with only two uracils separating them, it could
account for the reduction in binding affinity seen. Since this arrangement of
spacers is tolerated it confirms that the section of the c-fos mRNA tentatively
suggested by Moraes et al. in 2006 is a high affinity EDEN motif capable of fully
binding CELF1.
6.7.2 Involvement of RNA Secondary Structure in CELF1 Binding
C-jun was reported by Paillard et al. (2002) to bind to both Xenopus and human
CELF1, and trigger rapid deadenylation when present in the 3’ UTR of an
mRNA190
. Vlasova et al. reported a shorter version of the c-jun sequence which
could also trigger deadenylation. Since the EDEN11 GRE has been shown to be
insufficient this RNA does not contain a set of UGU sites with suitable spacing
for CELF1 binding when considered only as a linear sequence. The TNFα
sequence reported by Moraes et al. is another example, which has no instances of
three UGU sites within 40 nucleotides of each other. The experiments with
EDEN-2U/HL however showed that secondary structure could also create a high
affinity CELF1 site by bringing distant UGU sites together. Similar secondary
structure in the C-jun and TNFα sequences provide an explanation for their
binding of CELF1. The secondary structures of the relevant regions of these two
RNA, as predicted by the mFOLD web service, are shown in Figure 6.29.

222
Figure 6.29: Left is shown the C-jun section shown by Vlasova et al to be capable of binding CELF1. Right
is shown part of the TNFα substrate reported by Moraes et al. In each case the UGU sites which appear to
be in the most favourable arrangement for binding CELF1 have been highlighted. RNA secondary
structure predictions were made by the mFOLD web service179
.
The c-jun RNA shows two clear double stranded regions. One is from bases 17 –
31, which forms a hairpin held together primarily by three Watson-Crick C-G
base pairs, similar to the hairpin in the EDEN-2U/HL sequence. The second
double stranded region is between bases 1 – 11 and 44 – 53, mostly composed of
U –A base pairs. This leaves a single stranded region between them, which
contains five of the possible UGU sites in close proximity. The three highlighted
UGU sites are essentially equivalent to the EDEN-2U/4U high affinity substrate,
with a hairpin inserted into the 2U spacer. This seems the most probable site for

223
binding of all three RRMs of CELF1.
TNFα is predicted to form an extended hairpin motif, formed largely by U – A
base pairing in the AUUUA repeating region. As shown, this does bring three
UGU sites into relatively close proximity. They are however predicted to be in
double stranded regions of the RNA, which has been shown to prevent CELF1
binding in the long CUG repeat hairpins found in DM1 cells. The CELF1
interaction with UGU sites is of higher affinity, and there are more mismatched
U-G and U-U bases in this hairpin than in the CUG repeat case. It is possible that
some of this double stranded region can break apart in order to bind CELF1 (as
was seen in the t187/CUG15 titration).
This also provides a possible explanation for the reported dependence of
deadenylation efficiency on the presence of an AU rich element, in this case an
AUUUA repeat. It can be hypothesised that deadenylation is more efficient when
the AU rich elements are present because they form secondary structures that
bring UGU sites into more favourable configurations for CELF1 binding, rather
than any direct binding of CELF1 to the AU rich elements themselves.
6.7.3 Determination of the Minimal Binding Sequence for CELF1
If the earlier hypotheses about the spacing tolerances of each of the RRMs are
correct then the RNA substrate EDEN-2U/1U (UGUUUUGUUUGU) would be
expected to be the minimum sequence capable of binding all three RRMs. It
would therefore represent the smallest possible EDEN motif, and confirm the
minimum requirements for binding. ITC was carried out on this substrate, with
the results shown in Figure 6.30.
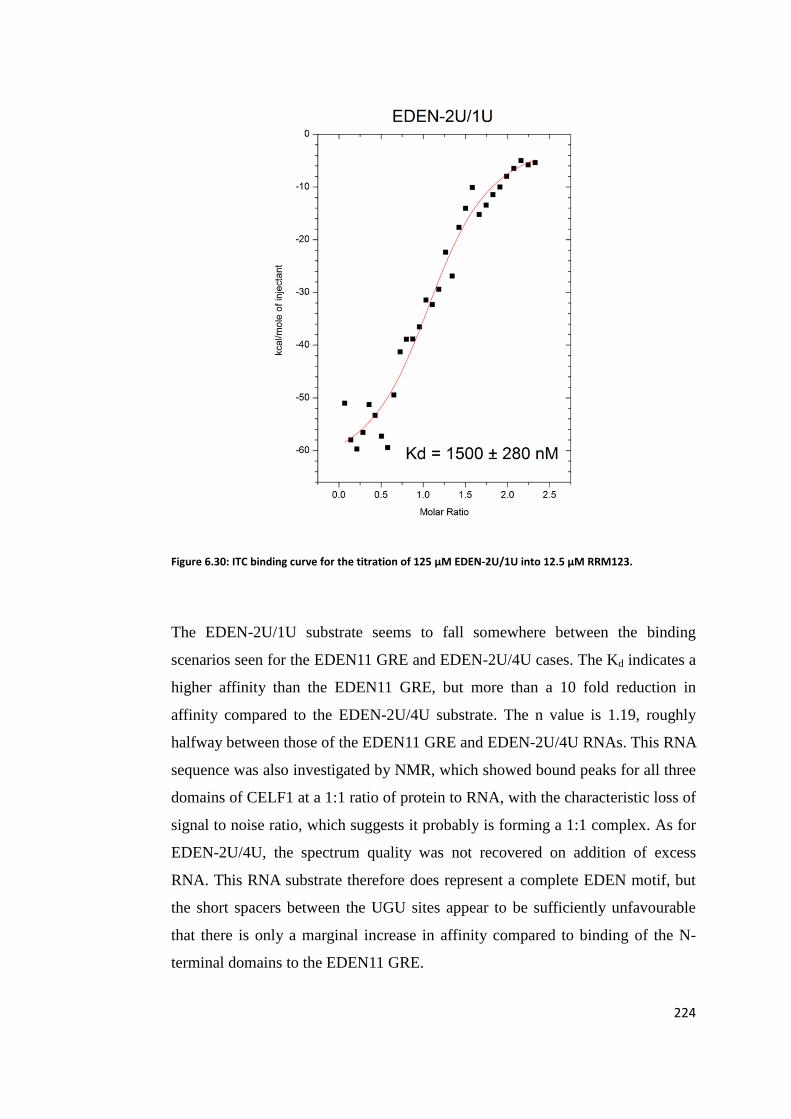
224
Figure 6.30: ITC binding curve for the titration of 125 µM EDEN-2U/1U into 12.5 µM RRM123.
The EDEN-2U/1U substrate seems to fall somewhere between the binding
scenarios seen for the EDEN11 GRE and EDEN-2U/4U cases. The Kd indicates a
higher affinity than the EDEN11 GRE, but more than a 10 fold reduction in
affinity compared to the EDEN-2U/4U substrate. The n value is 1.19, roughly
halfway between those of the EDEN11 GRE and EDEN-2U/4U RNAs. This RNA
sequence was also investigated by NMR, which showed bound peaks for all three
domains of CELF1 at a 1:1 ratio of protein to RNA, with the characteristic loss of
signal to noise ratio, which suggests it probably is forming a 1:1 complex. As for
EDEN-2U/4U, the spectrum quality was not recovered on addition of excess
RNA. This RNA substrate therefore does represent a complete EDEN motif, but
the short spacers between the UGU sites appear to be sufficiently unfavourable
that there is only a marginal increase in affinity compared to binding of the N-
terminal domains to the EDEN11 GRE.

225
6.7.4 Investigation of a Two Domain Construct of RRM2 and RRM3
As both the EDEN15 GRE and EDEN-2U/1U can bind all three RRMs, at least to
some extent, then it was conceivable that RRM2 and RRM3 could bind
simultaneously to the EDEN7 (UGUUUGU) sequence which previously failed to
bind both RRMs of t187. To investigate this possibility a construct containing
only the RRM2 and RRM3 domains was required. A construct retaining the wild
type 200 residue linker between these two domains as expected had all of the
same issues with solubility and stability as the full length wild type CELF1. For
direct comparison with the RRM123 construct a version with the shortened
RRM2 – RRM3 linker was needed.
Both the wild type and deletion mutant versions were produced using the same
method of single step PCR deletion to remove the codons for residues 1 - 107 of
CELF1 from the construct. The only difference in the PCR protocol was whether
full length CELF1 or the RRM123 construct DNA was used as the template. The
growth, expression and purification protocols were the same as for the RRM123
complex. The solubility and stability of the protein were found to be similar to
RRM123, allowing NMR and ITC data to be collected.
The 15
N TROSY spectrum of this construct was well resolved, and is shown in
Figure 6.31. As expected the spectrum essentially a composite of the RRM2 and
RRM3 spectra, with some additional peaks from the unstructured linker.

226
Figure 6.31: 15
N TROSY spectrum of a 250 µM sample of the RRM23 construct, collected on an 800 MHz
spectrometer with cryoprobe at 298K.
This new construct was used to determine whether RRM2 and RRM3 could bind
to UGU sites separated by only a single nucleotide, using a similar approach to
that described for the t187 construct. The EDEN7 RNA substrate was titrated into
15N-labelled RRM23.

227
Figure 6.32: The 15
N TROSY spectrum of unbound RRM23 is shown in blue. Overlaid in red is the 15
N
TROSY at the midpoint of the titration with EDEN7. As the titration is in slow exchange sharp peaks from
both the free and bound form are clearly visible. CSPs are only seen for residues in RRM3. No effects are
seen for any residues in RRM2. Some significantly perturbed residues in RRM3, and some residues that
are normally perturbed on binding in RRM2 have been highlighted.
As shown in Figure 6.32, CSPs were only seen in RRM3, indicating that only this
domain was binding to the EDEN7 substrate. The titration was entirely in slow
exchange and peaks from both the free and bound forms of RRM3 can be clearly
seen at the midpoint of the titration. No significant CSPs were seen for any
residues in RRM2. When RRM2 and RRM3 are in competition RRM3 is bound
preferentially. This is as expected since the ITC data showed that RRM3 had a
significantly stronger binding affinity for UGU sites than RRM2, with a Kd that
was at least an order of magnitude lower.
This was corroborated by ITC of RRM23 into EDEN7, which showed only a
single binding event with a Kd of 0.52 ± 0.12 µM, consistent with only RRM3
binding (Figure 6.33). Due to the large difference in the affinities of the two
domains, there would be expected to be a strong preference for binding of RRM3.
No effects were seen for residues in RRM2 until after a 1:1 ratio of RNA to

228
protein was reached. It is unclear if this is due to an inability to bind the domains
in tandem to the UGUUUGU substrate, or simply the 100 fold difference in
binding affinities between the domains.
Figure 6.33: ITC curve for a titration of 125 µM RRM3 into 12.5 µM EDEN7. A single binding event is seen,
indicating formation of a 1:1 complex.
These observations had failed to produce any evidence of tandem binding of
RRM2 and RRM3 to UGU sites separated by only a single nucleotide. A
remaining possibility in sequences such as EDEN-2U/1U was that RRM1 and
RRM3 were occupying the UGU sites on either side of the single nucleotide
spacer, leaving the RRMs arranged in the order RRM2 – RRM1 – RRM3 from
the 5’ to 3’ end of the RNA substrate. Whether this was a viable arrangement of
the domains was initially investigated by molecular modelling, and then
investigated in solution by NMR using a paramagnetic relaxation enhancement
technique as detailed in the next chapter.

229
6.7.5 Summary of ITC Data for all RNA Substrates
All calculated thermodynamic parameters for each RNA substrate on titration into
RRM123 are summarised in the table below.
RNA Kd (M) N
(sites)
ΔH (kcalmol-1) ΔS (calK-
1mol-1)
UGUUUGUUUGU (GRE) 2.2 ± 0.3 1.45 -53.7 ± 1.4 -154.0
UGUUUUUUGU (EDEN-4U) 2.1 ± 0.4 1.64 -54.4 ± 1.7 -157.0
UGUAUGUGUUGUUUUAUGU
(EDEN19)
0.33 ±
0.07
0.79 -111.4 ± 3.1 -344.0
UGUUUUGUUUUUUGU (EDEN-
2U/4U)
0.11 ±
0.02
0.85 -51.8 ± 1.0 -142.0
UGUUUUUUGUUUUGU (EDEN-
4U/2U)
0.98 ±
0.12
0.67 -35.7 ± 1.0 -92.3
UGUUUUGUUCCCGAGGACGGGUUG
U (EDEN2U/HL)
0.55 ±
0.08
0.83 -69.0 ± 1.6 -203.0
GUGUGUGUGUGUGUGUG (GU15) 0.66 ±
0.08
0.74 -46.3 ± 1.2 -127.0
UGUCUGUCUGUCUGUC (UGUC)4 0.53 ±
0.07
0.84 -56.9 ± 1.1 -162.0
UGUUUUGUUUGU (EDEN-2U/1U) 1.49 ±
0.23
1.19 -64.7 ± 2.9 -190.0

230
6.8 Conclusions
Wild type CELF1 was found to be a difficult protein to investigate by most
biophysical techniques due to its poor solubility and the low yield of the
purification method. We did however succeed in producing the much more
soluble and stable RRM123 construct allowing the behaviour of all three domains
of CELF1 together to be investigated by NMR and ITC.
Using RRM123 we have shown that the EDEN11 GRE is not capable of forming
a high affinity 1:1 complex with CELF1, and so only represents a partial EDEN
motif. While it does contain three UGU sites the spacing between them is
unsuitable for simultaneous binding of all three domains. The longer EDEN15
RNA substrate does however appear to be capable of binding all three RRMs and
so is a complete EDEN motif. However the ITC results suggest the spacing is not
optimal, as little enhancement of affinity was seen compared to binding of the N-
terminal domains only. Based on the spacing requirements of the N-terminal
domains deduced in the previous chapter, and the known natural mRNA targets
of CELF1 we have designed the RNA substrate EDEN-2U/4U, which was found
to be a complete EDEN motif with the highest binding affinity so far observed
(Kd = 110 nM).
We have refined the criteria for the EDEN motif to UGU(x)UGU(y)UGU where
x = 2 – 4 and y = 1 – 5 result in a 1:1 complex. There is a 5-fold difference in Kd
for y = 5 vs. y = 4, and a 10-fold difference for y = 1 vs. y = 4. The combination x
= 2, y = 4 results in the highest affinity interaction measured so far. However we
have also shown using the RNA EDEN-2U/HL that much longer spacers can bind
with comparable affinity if RNA secondary structure can bring distant UGU sites
into close proximity. We have identified both c-jun and TNFα as possible natural
examples of this. All other mRNAs previously demonstrated to trigger
deadenylation by binding CELF1 contain sequences consistent with our EDEN
motif criteria without the need for secondary structure involvement.

231
7 Characterisation of a Complex of CELF1 with a
High Affinity EDEN Motif
We originally aimed to characterise the structure of the complex of CELF1 with a
high affinity EDEN motif using either NMR or x-ray crystallography.
Unfortunately the decrease in signal to noise ratio seen in the NMR spectra when
the complex formed prevented the collection of sufficiently high quality NOE and
RDC data to gather restraints for an NMR solution structure. Attempts were also
made to co-crystallise RRM123 with high affinity RNA substrates in order to
obtain a structure by x-ray crystallography, but no diffraction quality crystals
were produced.
A different approach of modelling the structure of the complex, starting from the
available structures of the isolated domains was therefore chosen. In constructing
this model the main uncertainty to be resolved was the arrangement of the three
structured domains on the three UGU(U) sites of a high affinity RNA substrate.
There was also the question of whether there was a single preferred bound
conformation, or if the inherent flexibility of the linkers between the domains
would permit a range of conformations in solution. The range of possible RNA
binding modes in multi-RRM systems has been previously found to present
problems, particularly for x-ray crystallography. For example when the tandem
interaction of RRM1 and RRM2 of U2AF65 with an RNA substrate was
investigated by both NMR and x-ray crystallography, the resulting structures
differed significantly191, 192, 193
. The potential for multi-RRM systems to have
several possible binding modes, depending on the exact target RNA and the
presence of any secondary structure therefore had to be considered.

232
7.1 Arrangement of the Domains on the RNA Substrate
A key question in constructing the model was the relative arrangement of the
three domains when bound onto a single RNA molecule. The data in the previous
chapter showed that substrates such as EDEN-2U/4U could bind all three
domains, one to each of its three UGU sites, but did not indicate which domain
was occupying which site. There are several possible ways of arranging the
domains on the three UGU sites, but steric considerations allowed some
possibilities to be eliminated. In the available crystal structures the RNA substrate
is consistently positioned with the 5’ end towards the β4 side of the β-sheet and
the 3’ end on the β2 side for all three RRMs of CELF1. This alignment of the
RNA across the β-sheet is common for RRMs in general43
. The short linker
between the N-terminal domains RRM1 and RRM2 of CELF1 imposes
significant steric constraints on binding, and in order for each domain to bind in
the same way as they do in isolation they must be arranged in the order RRM2 –
RRM1 from 5’ to 3’ along the RNA. This arrangement is shown in Figure 7.1.
Figure 7.1: Model of the N-terminal domains RRM1 and RRM2 in complex with the RNA substrate
UGUUUUUUUGU. This was produced by constructing the RNA sequence UUUUU in XLEAP, and
superimposing the two terminal nucleotides with U4 and U5 of the t187/EDEN2U model shown earlier.
The model was then minimised, and underwent a molecular dynamics run according to the protocol in
section 3.22. The domains are in the order RRM2 – RRM1 from the 5’ to 3’ end of the RNA. The linker
between the domains is not sufficiently long to allow the domains to adopt the other arrangement.
Energy minimization and molecular dynamics were carried out in Amber. This image was produced using
Pymol.

233
While there are no available structures in the protein databank showing tandem
binding of any combination of the CELF1 domains onto a single RNA molecule,
there are some structures of other multi-RRM systems available in the literature.
Structural data is available for some examples of proteins containing two RRMs
separated by a comparably short linker to CELF1, such as Sx138
, PABP194
and
Hrp144
. Each of these proteins is capable of binding in tandem to an RNA
substrate of between 7 and 10 nucleotides. Restricted by an interdomain linker of
less than 10 residues in each case, these proteins have consistently been found to
bind with RRM2 at the 5’ end of the RNA, and RRM1 towards the 3’ end
(numbering the RRMs from the N-terminus of each protein). These proteins
displayed considerable cooperativity between the RRMs, with them acting in
tandem to form an extended β-sheet surface to recognise longer RNA sequences.
While the CELF1 RRMs appear to be rather more independent, the short linker
still forces RRM2 to be positioned to the 5’ end of the RNA relative to RRM1.
The location of RRM3 remained uncertain. With the restriction that RRM2 must
be towards the 5’ end relative to RRM1 there were three possible arrangements of
the domains on the EDEN-2U/4U substrate, as shown in Figure 7.2.
Figure 7.2: Possible arrangements of the three domains of CELF1 from 5’ to 3’ when bound to the RNA
substrate EDEN-2U/4U.
The earlier investigation of the N-terminal domains in the t187 construct showed
a significant decrease in binding affinity for UGU sites separated by more than 4
nucleotides. The 2 – 3 – 1 arrangement forces RRM1 and RRM2 to occupy sites

234
which are 9 nucleotides apart, which is therefore likely to be unfavourable. Based
on this observation and the known inability of RRM3 to occupy to the central site
of the EDEN11 GRE (UGUUUGUUUGU) it seemed unlikely that the 2 – 3 – 1
arrangement would be preferred.
This left the 3 – 2 – 1 and 2 – 1 – 3 arrangements as possibilities. In the RRM123
construct the linker between RRM2 and RRM3 consists of around 30 residues,
which is sufficient to make either arrangement sterically plausible. In wild type
CELF1 this linker is far longer at around 200 residues, allowing RRM3 even
more freedom to move independently, again making either arrangement possible.
In order to determine whether one of these arrangements is preferred, and if so
which, a technique was required that could connect one of the domains to a
specific UGU site. Paramagnetic relaxation enhancement was used for this
purpose.
7.2 Modelling RRM123 in Complex with a High Affinity RNA
Substrate
Models of the RRM123 construct bound to the EDEN-2U/4U and EDEN-2U/HL
RNA sequences were constructed, as an initial check to ensure that no steric
clashes or implausible strains on the interdomain linkers were present. These
were constructed based on the available crystal and NMR structures in the Protein
Data Bank produced by Teplova et al. and Tsuda et al. Since none of these
structures had more than one of the RRMs bound to a single RNA substrate, it
was necessary to splice the isolated structures together to produce the overall
model of RRM123.
The model of RRM1 and RRM2 in complex with the RNA sequence
UGUUUUGU (a two nucleotide spacer), shown earlier in Figure 5.13, was used
as the N-terminal fragment of the protein. The structure of RRM3 in complex

235
with the RNA sequence UGUGUG produced by Tsuda et al. was used as the C-
terminal fragment. Since no structural data existed for the RRM2 – RRM3 linker
region a section of the RRM123 protein consisting of residues 186 - 216 was
constructed in the program XLEAP, and then energy minimised in AMBER. This
linker was then attached to the N-terminal fragment by superimposing residues
186 and 187 of the linker onto their counterparts in RRM2 of the N-terminal
fragment (minimising RMSD). The C-terminal fragment was similarly attached
by superimposing residues 215 and 216 of the RRM3 structure onto the
corresponding residues in the RRM2 - RRM3 linker. This resulted in a complete
RRM123 protein with two separate RNA fragments, one bound to the N-terminal
domains and one to RRM3.
This model was energy minimised, and underwent molecular dynamics
simulations in AMBER for 1 ns at 300 K. To produce the complete RNA the
fragment bound to RRM3 was truncated to the UGU site. A section of RNA
consisting of the sequence UUUUUU was constructed in XLEAP, energy
minimised in AMBER, and attached to the RRM3 fragment by superposition of
the 3’ uracil with the 5’ uracil of the UGU site. The 5’ uracil of this RNA spacer
was then superimposed onto the 3’ U of the UGUUUUGU fragment, which
necessitated the introduction of implausibly long bonds into the RNA backbone
to make this connection. This structure, corresponding to RRM123 in complex
with EDEN-2U/4U with the domains arranged in the order 2 – 1 – 3, was energy
minimised with a restraint mask applied to the RNA, which was gradually
reduced until all bonds had relaxed to normal lengths. The structure was then
subjected to molecular dynamics simulations in AMBER for 2 ns.
A model of the same complex, but with the RRMs in the order 3 – 2 – 1 was also
constructed by a similar method. The spacing in the RNA sequence
UGUUUUGU, bound to the N-terminal fragment was expanded from 2U to 4U
by superimposing the 5’ and 3’ nucleotides of a constructed UUUU sequence
onto U4 and U5. This structure was then minimised and used as the starting point
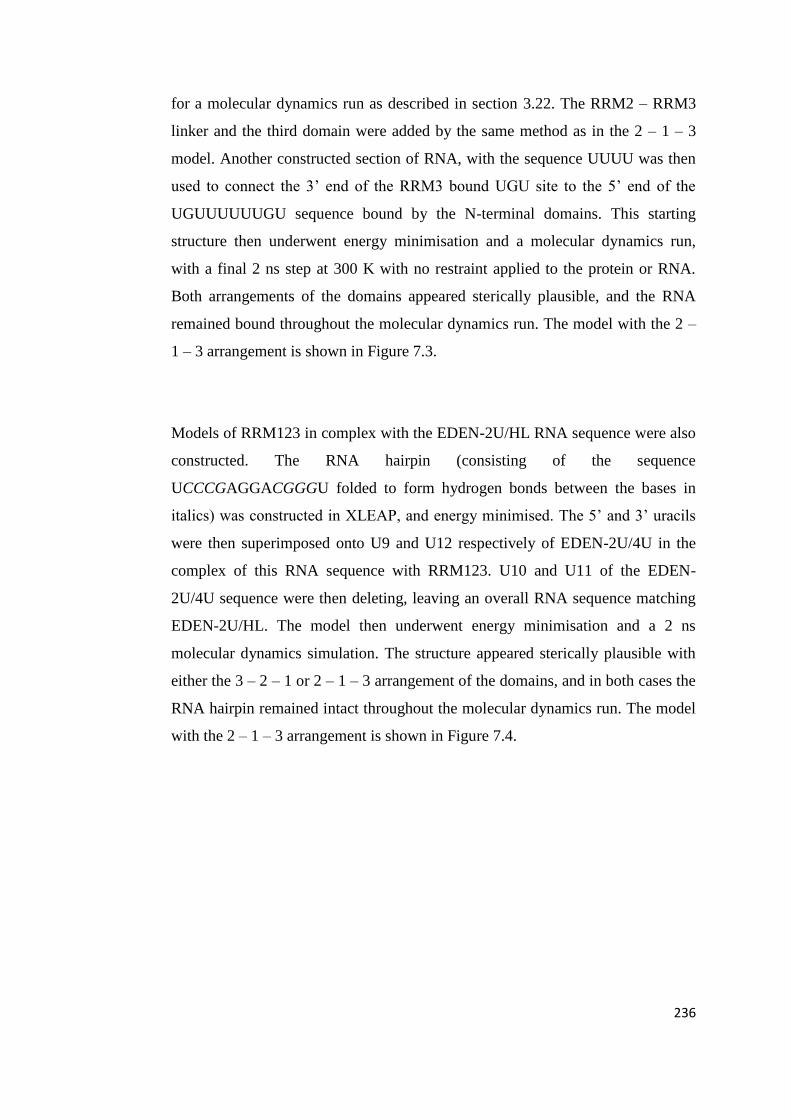
236
for a molecular dynamics run as described in section 3.22. The RRM2 – RRM3
linker and the third domain were added by the same method as in the 2 – 1 – 3
model. Another constructed section of RNA, with the sequence UUUU was then
used to connect the 3’ end of the RRM3 bound UGU site to the 5’ end of the
UGUUUUUUGU sequence bound by the N-terminal domains. This starting
structure then underwent energy minimisation and a molecular dynamics run,
with a final 2 ns step at 300 K with no restraint applied to the protein or RNA.
Both arrangements of the domains appeared sterically plausible, and the RNA
remained bound throughout the molecular dynamics run. The model with the 2 –
1 – 3 arrangement is shown in Figure 7.3.
Models of RRM123 in complex with the EDEN-2U/HL RNA sequence were also
constructed. The RNA hairpin (consisting of the sequence
UCCCGAGGACGGGU folded to form hydrogen bonds between the bases in
italics) was constructed in XLEAP, and energy minimised. The 5’ and 3’ uracils
were then superimposed onto U9 and U12 respectively of EDEN-2U/4U in the
complex of this RNA sequence with RRM123. U10 and U11 of the EDEN-
2U/4U sequence were then deleting, leaving an overall RNA sequence matching
EDEN-2U/HL. The model then underwent energy minimisation and a 2 ns
molecular dynamics simulation. The structure appeared sterically plausible with
either the 3 – 2 – 1 or 2 – 1 – 3 arrangement of the domains, and in both cases the
RNA hairpin remained intact throughout the molecular dynamics run. The model
with the 2 – 1 – 3 arrangement is shown in Figure 7.4.

237
Figure 7.3: Model of RRM123 in complex with the EDEN-2U/4U substrate. The RRMs are in the 2 – 1 – 3
arrangement from the 5’ to 3’ end of the RNA strand.
Figure 7.4: A model of the EDEN-2U/HL RNA substrate bound to the RRM123 protein. Modelling was
carried out using Amber for energy minimization followed by molecular dynamics simulations as
specified in section 3.22.

238
From the molecular modelling it was evident that there was still considerable
flexibility in the structure from the RNA and interdomain linkers. This permits
the domains to either form a compact structure, or a range of more extended
structures.
7.3 Paramagnetic Relaxation Enhancement
When a paramagnetic centre is present in a protein the relaxation rates of
surrounding nuclei are greatly increased, resulting in attenuation of their signals
in NMR spectra. By observing which residues contain affected nuclei, the
position of the paramagnetic centre within the structure can be determined195
.
Some proteins contain endogenous paramagnetic centres such as Fe3+
, or metal
ions which can be substituted for a paramagnetic lanthanide ion196, 197
. In addition
to using existing metal ions in proteins it is also possible to add paramagnetic
tags, containing either a lanthanide ion, or a stable radical such as a nitroxide
group198, 199
. These are usually attached by a coupling reaction to a cysteine
residue, either endogenous or introduced by point mutation. These tags can also
be attached to ligands200, 201
and nucleic acids202, 203
.
The PRE effect has a much longer range than NOEs, of up to 25 Å. This is a
sufficiently long distance that the effect could potentially extend between the
domains of CELF1, allowing interdomain restraints to be generated. This
technique would also distinguish between the 3 – 2 – 1 and 2 – 1 – 3
arrangements. If the tag were attached to one of the protein domains then
measurement of the signal attenuation in the 15
N TROSY spectrum for residues in
each of the other two domains would show which domain was closest to the
paramagnetic tag, and hence the overall arrangement. Alternatively the
paramagnetic tag could be attached to the RNA, close to one of the UGU sites.
The residues in the domain binding to that UGU site would then be expected
show the greatest signal attenuation in the 15
N TROSY spectrum.

239
The paramagnetic tag selected for these experiments was MTSL (S-(2,2,5,5-
tetramethyl-2,5-dihydro-1H-pyrrol-3-yl)methyl methanesulfonothioate) supplied
by Toronto Research Chemicals Inc. MTSL consists of a stable nitroxide group
attached to a sulfinic acid (CH3SO2) leaving group. This is normally reacted to
form a disulphide link to a specific cysteine residue in the protein, but it can also
be coupled to other sulphur containing groups. Since the RRM123 construct
contains seven cysteine residues attaching the spin label to a specific cysteine
would require a minimum of six point mutations. In addition some of these
cysteines (specifically Cys61, Cys62 and Cys150) are located in the key RNP
regions of the protein’s binding surfaces, and form hydrogen bonds to the RNA in
the reported crystal structures of the isolated domains. RNA binding would
almost certainly be interfered with if the tag was attached to one of these residues.
Altering these residues to, for example, serine or alanine would however
potentially disrupt the normal RNA binding properties of the protein. Attaching
the spin label to a specific site on the RNA was a more attractive option, as RNA
sequences with modified bases at specific sites were commercially available from
Dharmacon. MTSL can be coupled to a 4-thio-uridine base, as shown in Figure
7.5.
Figure 7.5: On the left is the structure of the 4-thio-uridine modified RNA base. In the centre is the
structure of the MTSL, showing the unpaired electron of the nitroxide group which acts as the spin label.
On the right is shown the structure of the modified RNA base after the coupling reaction with the MTSL.

240
With the tag attached to a modified base at one end of the RNA strand it would
attenuate the signals of the nearby residues in the 1H-
15N HSQC spectrum,
unambiguously showing which domain was binding closest to that end.
7.3.1 Paramagnetic Relaxation Enhancement in RRM1 on binding to
MTSL Labelled UGUU
As an initial proof of concept the RNA tetramer U*GUU, where the 5' uridine
had been replaced with 4-thiouridine was used. A 3x molar excess of MTSL was
added to the RNA, and allowed to react in darkness at room temperature for two
hours. This was then loaded onto a HiTrap desalting column and eluted into
RNAse free MilliQ H2O to remove unreacted MTSL. The eluted RNA was then
frozen using liquid nitrogen, and lyophilised, again in darkness.
Titration of this MTSL-tagged RNA into a 15
N labelled RRM1 sample resulted in
attenuation of a large percentage of the amide signals in the spectrum. Those in β-
strands 1 and 3 were most affected, with signals from residues such as 19 – 23
and 60 - 62 lost completely by the time a 1:1 ratio of RNA to protein was
reached.
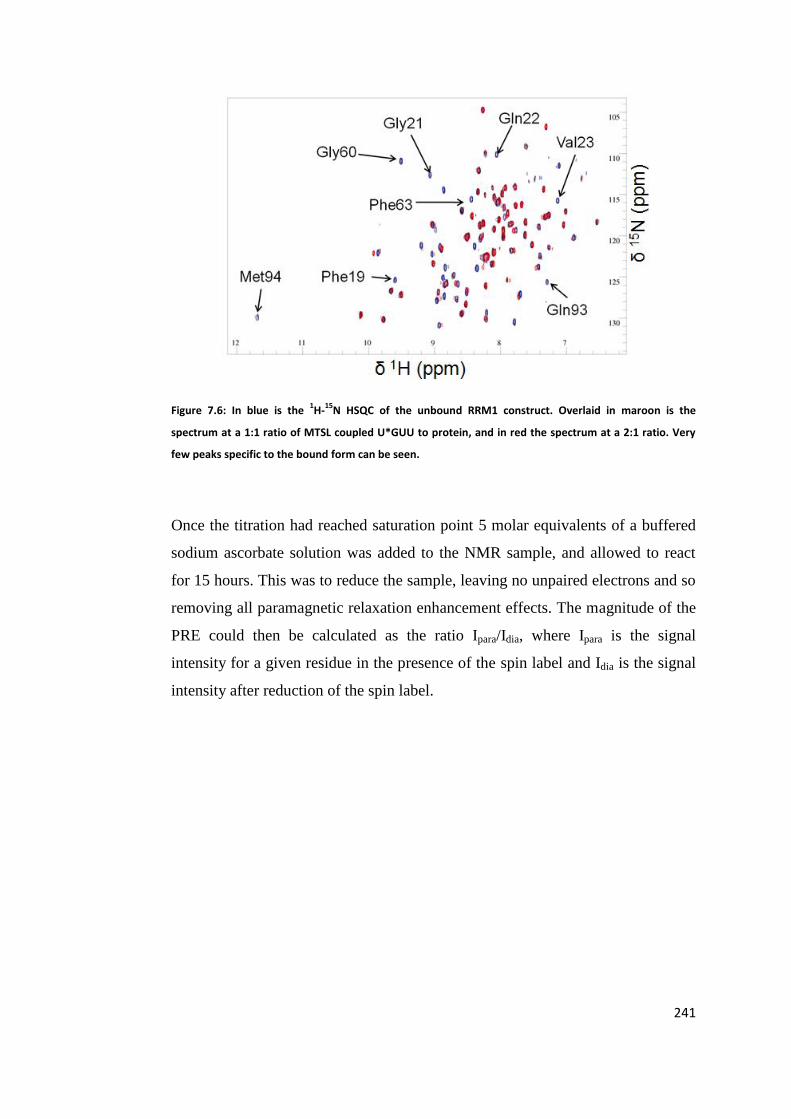
241
Figure 7.6: In blue is the 1H-
15N HSQC of the unbound RRM1 construct. Overlaid in maroon is the
spectrum at a 1:1 ratio of MTSL coupled U*GUU to protein, and in red the spectrum at a 2:1 ratio. Very
few peaks specific to the bound form can be seen.
Once the titration had reached saturation point 5 molar equivalents of a buffered
sodium ascorbate solution was added to the NMR sample, and allowed to react
for 15 hours. This was to reduce the sample, leaving no unpaired electrons and so
removing all paramagnetic relaxation enhancement effects. The magnitude of the
PRE could then be calculated as the ratio Ipara/Idia, where Ipara is the signal
intensity for a given residue in the presence of the spin label and Idia is the signal
intensity after reduction of the spin label.

242
Figure 7.7: Graph of the ratio Ipara/Idia for the titration of RRM1 with U*GUU. Residues for which the
signals are completely obliterated have been highlighted in red to distinguish them from the prolines and
overlapped residues which have no data.
The most affected residues are 19 – 23, 47 – 51, 59 – 64, 81 and 93 – 95, the
signals of which are all completely obliterated. These include most of the residues
in the β-sheet, and almost all of those residues previously seen to be involved in
RNA binding to this domain. Strong signal attenuation is also seen for the C-
terminal residues, and for residues such as Ser52 and Gln53 in the loop
connecting β2 and β3. Some attenuation of signal (around a 20 – 40% decrease in
intensity) is seen even for the relatively unaffected regions of the protein. These
are residues 2 – 7, 35 – 44 and 65 – 79, which make up the N-terminus and the α-
helices of the protein. When the values for each residue are mapped onto the
surface of the protein, a coherent patch of attenuated signals can be seen.

243
Figure 7.8: The largest paramagnetic enhancement effects are shown in red (residues where Ipara/Idia <
0.3). Moderate effects (0.3 < Ipara/Idia < 0.5) are shown in orange. Less affected residues are shown in grey
(Ipara/Idia > 0.5). The RNA substrate is also shown, with the position of the modified base with the MTSL
tag highlighted in red.
Figure 7.8 shows the most affected area of the protein in red, and the approximate
position of the spin label based on the crystal structures. The most affected region
covers a rather larger area of the protein surface than was generally seen in the
CSP maps. The MTSL tag is attached to the 5’ RNA base via a disulphide bond
which allows it some range of movement relative to the RNA. This may allow the
spin label some freedom of movement even when the RNA remains fixed in the
binding site. There are additional affected residues above and to the left of the
binding patch (visible in orange in Figure 7.8) which are greatly attenuated but
not lost completely may be due to this. They are outside the normal RNA binding
surface seen on CSP maps, but are plausibly within the range of motion of the
MTSL tag.
There is a general loss of signal intensity of 20 - 40% over virtually all of the
remaining surface area of the protein, including those residues in the α-helices on

244
the opposite face of the protein from the RNA. This can be attributed to the long
range of the PRE effect (up to 25 Å) encompassing almost the entirety of RRM1.
7.3.2 PRE on labelling of the EDEN-2U/4U substrate with MTSL
The MTSL coupling method was used to attach a spin label to the EDEN-2U/4U
sequence. As it is a rather bulky group, the MTSL tag was coupled to an
additional 4-thio-uridine at the 5’ end of the RNA rather than to one of the
existing uridines in the EDEN-2U/4U substrate to ensure it did not interfere with
binding of the protein to the UGU site at the 5’ end of the RNA. The RNA
sequence was therefore 5’-U*UGUUUUGUUUUUUGU-3’.
After completion of the titration the sample was treated with 5 molar equivalents
of buffered sodium ascorbate for 16 hours. Comparison of the 15
N TROSY
spectrum after this with the bound spectrum from the RRM123 titration with
unlabelled EDEN-2U/4U showed the spin label had been at best partially
reduced. In particular the peaks for several residues in RRM2 were still of very
low intensity compared to the conventional titration. 10 additional molar
equivalents of buffered sodium ascorbate were therefore added and the sample
was allowed to react at room temperature for an additional 24 hours. This
achieved a greater recovery of signal intensity. It is unclear why the spin label
was more difficult to reduce in this case compared to the RRM1/U*GUU
titration. Possibly it had packed against the surface of the protein via some form
of hydrophobic interaction with the MTSL group, making the nitroxide spin label
harder to access.
The ratio of Ipara/Idia was again calculated for each residue to quantify the PRE
effect. The signal to noise ratio for the bound complex was poor even without the
attenuation from the spin label, resulting in relatively large margins of error
compared to the previous titration. There were also far more overlapping peaks in

245
this spectrum, for which it was not possible to accurately measure the signal
intensity for each residue. The ratio is shown below in Figure 7.9 for all residues
where it could be calculated.
Figure 7.9: Graph of the PRE effects seen on the RRM123 construct on addition of MTSL labelled EDEN-
2U/4U (U*-UGUUUUGUUUUUUGU). Values greater than 1 are seen for some residues due to the large
margin of error. Moderate PRE effects (ratio = 0.4 – 0.8) are seen for some residues in all three domains.
A noticeable cluster of strongly affected residues (ratio < 0.4) is seen in RRM2, and has been highlighted,
though there are a few other strongly affected residues in the other domains.
The MTSL spin label is expected to have some freedom of movement due to both
the disulphide link attaching it to the RNA base, and the fact the 4-thiouracil is an
addition to the 5’ end of the RNA and so does not interact directly with the
protein. This accounts for the observation of PRE effects across a relatively large
number of residues. While there is some attenuation of signals across all three
domains, most of the strongly affected residues are concentrated in RRM2, as is
shown in Figure 7.10. From this it can be concluded that CELF1 is preferentially
binding with RRM2 at the 5’ end of this RNA sequence. This indicates that the 2
– 1 – 3 arrangement of the domains from 5’ to 3’ is most favourable, not the 3 – 2
– 1 arrangement.

246
Figure 7.10: A model of RRM123 with PRE effects shown, in complex with the RNA substrate
U*UGUUUUGUUUUUUGU. Details of the model construction are explained in section 7.2. Large
paramagnetic enhancement effects are shown in red (residues where Ipara/Idia < 0.3). Moderate effects
(0.3 < Ipara/Idia < 0.5) are shown in orange. Less affected residues are shown in grey (Ipara/Idia > 0.5), as are
any with no data such as the unassigned RRM2 – RRM3 linker. The RNA substrate is also shown, with the
position of the modified base with the MTSL tag highlighted in red.
It seems likely that the signals in RRM2 that are almost completely obliterated
are due to PRE from the directly bound RNA, while the much more widespread
partial attenuation of signals may be due to non-specific intermolecular
interactions, and represent the exposed surface of the protein. The most affected
residues are shown in Figure 7.10 with those losing >70% of signal intensity
shown in red, and those with 50 - 70% loss shown in orange.

247
With a single exception (Met18) the most affected residues are in RRM2, and
generally are in the β-sheet and loop regions of the domain. There is also a
concentration of moderately affected residues in this domain, with a few
additional residues in RRM1 and RRM3 with 50 – 70% loss of signal intensity.
7.4 Small Angle X-ray Scattering
The loss of NMR spectrum quality on formation of a high affinity 1:1 complex
was attributed to the protein becoming more globular and rigid on binding. Small
angle X-ray scattering (SAXS) was used as a complementary technique to help
investigate whether the complex was more rigid and compact than the unbound
protein. SAXS data was collected for the RRM123 construct both unbound, and
in complex with the high affinity EDEN-2U/4U substrate. Data for the
protein/RNA complex was collected at two concentrations – 1 mg/ml and 5
mg/ml to check for any aggregation effects. Collection of the SAXS data was
carried out by Dr. Chan Li (School of Pharmacy, University of Nottingham). We
analysed the data to calculate Kratky and Guinier plots in the ATSAS software
package. Advice during this analysis was provided by Dr. Katherine Carr (School
of Pharmacy, University of Nottingham). Calculation of the 3D envelope was
carried out by Dr. Jonas Emsley (School of Pharmacy, University of
Nottingham).
7.4.1 Guinier Plots
The radius of gyration (Rg) of the protein and the complex can be calculated from
a Guinier plot of the SAXS data. By comparing Rg values for the free RRM123
protein and the complex, it would possible to tell if the overall protein geometry
was changing. If a more compact complex was forming, it would be expected to
have a lower radius of gyration. The Guinier plots for the unbound protein, the

248
complex at low concentration, and the complex at high concentration are shown
in Figure 7.11.
Figure 7.11: Left is the Guinier plot for the unbound CELF1. Centre is the plot for the RRM123/EDEN-
2U/4U complex at low concentration (1 mg/ml) and right is the plot for the complex at higher
concentration (5 mg/ml). Calculated Rg for the unbound protein was 2.72 nm, Rg for the complex was
calculated as 2.69 nm from the low concentration plot and 2.94 nm at high concentration. Plots were
produced using the ATSAS software package.
There is a slight deviation from linearity in the plot for the complex at high
concentration, suggesting some aggregation is occurring in this sample. This is
likely to be the reason for the slightly higher Rg seen for the complex at this
concentration. At 1 mg/ml the Guinier plot is linear, and the calculated Rg should
therefore be more accurate. Rg values of 27.2 Å for the unbound protein, and 26.9
Å for the complex were calculated. This difference in the radius of gyration for
the free and bound RRM123 is negligible. This is somewhat surprising if the
domains are forming into a more compact arrangement on binding, but is
consistent with the earlier size exclusion chromatography data, which showed
very little change for RRM123 on binding to the RNA.
7.4.2 Kratky Plots
Earlier in Error! Reference source not found. were shown examples of the Kratky
plots for globular proteins, disordered proteins, and a protein with both structured

249
and disordered regions. If the complex of RRM123 with EDEN-2U/4U is more
compact and rigid than the free RRM123 protein the Kratky plots, shown below
in Figure 7.12, would be expected to show a significant difference.
Figure 7.12: Kratky plots for unbound RRM123 (left) and the complex of RRM123 with EDEN-2U/4U
(right).
Both the free protein and the complex show considerable flexibility, with a long
increasing tail for high values of q. The complex shows a rather more clearly
defined peak than the free protein, suggesting some population of a more compact
form when bound to RNA. The Kratky plot does still show flexibility in the
bound form though, so there may also be a range of more elongated
conformations in solution.
7.4.3 Predicted Envelope
SAXS can be used to predict a low resolution 3D envelope of the particles in
solution. Based on the data from the high concentration sample of the bound
complex a 3D envelope was calculated by Dr. Jonas Emsley (School of
Pharmacy, University of Nottingham), which is shown in Figure 7.13.

250
Figure 7.13: Autoenvelope calculated from the SAXS data for the RRM123/EDEN-2U/4U complex. Envelope calculated by Dr. Jonas Emsley (School of Pharmacy, University of Nottingham).
It is not immediately obvious how the three domains of CELF1 would occupy
this volume. As shown in Figure 7.14 the envelope is large enough to
accommodate a relatively linear arrangement of the domains, but this leaves a
significant amount of unaccounted for volume in the envelope. Similarly a more
compact form of CELF1 will fit reasonably well into the roughly triangular
section to the left hand side in Figure 7.13, but again leaves a “tail” of
unaccounted for volume to the right. It is possible that in solution there are a
range of conformations between these two extremes, resulting in a calculated
SAXS envelope which is not representative of any individual conformation.

251
Figure 7.14: Possible arrangements of the domains within the SAXS envelope. A) shows a relatively
compact arrangement of the three domains. B) shows a more extended model. In both cases the
envelope is large enough to accommodate all three domains, but there are significant volumes
unaccounted for.

252
7.5 Refining the Model
The initial model was refined using distance restraints based on the paramagnetic
relaxation enhancement experiments. Due to the potential issues with
intermolecular PRE effects, only those from the most affected residues (Ipara/Idia <
0.5) were used, though this left relatively few restraints between the tag and
residues outside RRM2. Molecular dynamics simulations starting from either an
“extended” or “compact” arrangement of the domains resulted in a very similar
final model.
Figure 7.15: Refined model of RRM123 in complex with the EDEN-2U/4U RNA substrate, produced using
restraints based on the most affected residues in the PRE experiment. Restraints were approximated as
an upper limit of 24.5 Å between those residues where Ipara/Idia < 0.3 and the paramagnetic centre, and 29
Å for residues where 0.3 < Ipara/Idia < 0.5.
The model could be refined further by repeating the experiment with the spin
label at different positions in the RNA, for example at the 3’ end and at a position

253
close to the middle UGU site. This would provide corroborating information on
the 5’ to 3’ arrangement of the three RRMs and increase the number of long
range distance restraints which could be used in molecular dynamics simulations.
7.6 Conclusions
We were not able to produce an NMR solution structure of the complex, but we
were able to construct a model based on the structural data from the isolated
domains supplemented by PRE and SAXS data. The intrinsic flexibility of the
RRM2 – RRM3 linker sequence can be seen in the Kratky plots from the SAXS
data, and is conserved in the bound state. This suggests that conformational
flexibility, together with the long range distance dependence of the PRE effect
may account for the attenuation of signals observed in all three domains. The
largest effects appear to place the 5’ MTSL label in close proximity to RRM2,
which uniquely defines the alignment of all three domains on the RNA substrate.
From this it appears that CELF1 forms a relatively compact complex with high
affinity RNA substrates such as EDEN-2U/4U, with the RRMs preferentially
arranged in the order 2 – 1 – 3 from the 5’ to 3’ end of the RNA. The possibility
of a minor population in solution with a different domain arrangement, or a more
extended conformation cannot be excluded.

254
8 CELF1 Phosphorylation and Interactions with
Poly(A) Ribonuclease
8.1 Phosphorylation
CELF1 has been previously identified as a phosphoprotein, with multiple possible
phosphorylation sites for different kinases11
. In DM1 cells it has been shown that
CELF1 is hyperphosphorylated by protein kinase C, resulting in an extended
protein half-life105
. So far the only phosphorylation sites to have been investigated
and observed to have an effect on the properties of CELF1 are Ser28 in RRM1
and Ser302 in the RRM2 – RRM3 linker (cyclinD3/cdk4). Both of these have
been reported to increase CELF1’s affinity for RNA in general and possibly to
influence the preferred RNA target sequence106, 109
. The Ser302 phosphorylation
has also been reported to promote association with an initiation factor (eIF2),
which would impact the translation of the target mRNAs204
.
Other potential phosphorylation sites have been predicted for three other
phosphatases. GSK3 at Thr277, Thr281, Ser285, Ser292 and Ser300. PKC delta
at Thr163, Ser268 and Ser383. Finally Akt kinase has been predicted to also be
capable of phosphorylation at Ser28. Most of these sites are in a serine and
threonine rich region in the middle of the flexible linker between RRM2 and
RRM3. The only sites in structured regions are Ser28 in RRM1 and Thr163 in
RRM2. It is worth noting that Thr163 is not conserved between human and
Xenopus CELF1, being replaced with methionine in Xenopus. Given human and
Xenopus CELF1 have been shown to be functionally interchangeable it seems
unlikely this residue plays any key role. Work by Salisbury et al. in 2008 was
unable to confirm any activity by GSK3 or PKC delta on CELF1, but did show
phosphorylation by Akt1 in vitro. Akt1 has also been noted to be upregulated in
DM1 cells109
.

255
Salisbury et al. also reported increased affinity for the cyclin D1 mRNA sequence
when CELF1 is phosphorylated. This sequence bears very little resemblance to
any of the other sequences known to be targets of CELF1, with very few uracils,
no UGU sites and only a single UGC site. It has been proposed that
phosphorylation of CELF1 at Ser28 may serve as a “switch” capable of changing
the RNA target of the protein from U/G rich sequences to C/G rich sequences,
enabling the reported interaction with cyclin D1 RNA. Ser28 does not show a
significant CSP when binding to any of the NMR substrates investigated earlier
in this study, and did not show any contacts with the RNA substrate UUGUU in
the crystal structure.
Cyclin D1: 5'-
CCCAGCCAGGACCCACAGCCCUCCCCAGCUGCCCAGGAAGAGCCCCA
GCC-3'
This sequence is clearly distinct from the U/G rich sequences capable of forming
high affinity complexes with CELF1. To examine this potential range of
additional RNA targets, a phosphomimetic mutant of CELF1: S28D was
produced by site directed mutagenesis. This mutation was used in the original
paper, and serine to aspartate mutations have been shown in many cases to mimic
phosphorylation205, 206
. Mutants of the RRM1, t187 and RRM123 constructs were
also produced. The purification methods used for the S28D mutants were
identical to those for the wild type.

256
Figure 8.1: From left to right are shown structures of a) serine, b) phosphoserine from post translational
modification, c) aspartic acid, used as a mimic for phosphoserine in the original study, and in this
investigation. Glutamic acid can also be used as a phosphomimetic mutant.
15N labelling the protein and collecting a
15N TROSY showed moderate
disruption to the spectrum, localised to those residues near the point mutation.
Figure 8.2: The 15
N TROSY of the RRM1 S28D phosphomimetic mutant is shown in red, overlaid on the
spectrum of wild type protein in blue. The signals for residue 28, and other strongly perturbed residues,
are highlighted. The spectrum is generally very similar to that of the wild type RRM1, suggesting this
phosphorylation is not drastically altering the fold of the protein. Data was collected on a Bruker Avance
III 800 MHz spectrometer at 298 K.

257
Most residues could be assigned by analogy to the wild type protein. There were
however several residues with large enough chemical shift changes between the
wild type and S28D mutant to render assignments ambiguous (specifically for
residues 30, 32, 33, and 34, in addition to residue 28 itself). Assignment of these
residues was carried out using HNCACB and HN(CO)CACB spectra collected on
a 250 µM doubly labelled sample on an 800 MHz spectrometer with QCI
cryoprobe.
Figure 8.3: Structure of RRM1 with Ser28 shown using a ball and stick depiction. Those residues which
show significant changes to their chemical shifts when Ser28 is mutated to aspartic acid are highlighted in
red, with brightness of colour indicating the magnitude of the perturbation. The most affected residues
consist of the first half of α-helix 1, and to a lesser extent a few residues in β-strand 2, which is packed
against it.
In the wild type protein the side chain of Ser28 extends out into solution at the
start of the first alpha helix. In the S28D mutant, there is disruption of the
chemical shifts for all residues in the first two turns of this helix, with the
exception of Glu31. There are minor shifts for Ile45, Val47 and Arg49 as well.
The side chains of these residues extend from the underside of β2, pointing

258
towards the disrupted residues in α-helix 1. There are negligible CSPs for Trp27
and Ser26, despite their close proximity to the mutation site.
From the changes in the NMR spectrum on mutation it appears that
phosphorylation at this position does not greatly alter the overall fold of the
protein. The effects are confined to the α-helix, which has not previously been
seen to be involved in binding, and to a lesser extent the β2 strand. This was
consistently the least affected strand of the β-sheet in the titrations shown earlier,
so again it would be surprising if this had a significant impact on the normal
binding mode of the domain.
S28D mutants were also produced of the t187, RRM123 and full length CELF1
proteins with the assistance of Zoe Le Gray-Wise. The binding affinity of the
S28D mutants relative to the wild type constructs was investigated by ITC, NMR
and fluorescence methods. It was expected that the S28D mutant would show an
increase in affinity for CUG repeating sequences, and/or a reduction in affinity
for the sequences containing UGU sites. Comparison of the ITC data for wild
type vs. S28D did not however show any significant difference on binding to the
sequence UGUUUAU, as shown in Figure 8.4.

259
Figure 8.4: Comparison of ITC traces for the titration of RRM1 wild type and the S28D mutant with the
RNA substrate UGUUUAU. This phosphomimetic mutation is not resulting in any loss of binding affinity
to the normal UGU site.
In practice no significant differences in binding affinity (or stoichiometry) were
seen for the S28D mutant binding to UGUGUG, EDEN11 or EDEN-2U/4U. To
within the margin of error of these techniques the results were the same as for the
wild type CELF1 constructs. The S28D mutant in fact showed a somewhat
reduced affinity for CUG based sequences, with no detectable binding seen by
ITC. NMR showed greatly reduced CSPs on binding to CUGCUG, and the
titration required a much larger excess of RNA in order to reach an endpoint.
Based on this it could be concluded that phosphorylation at Ser28 does not serve
as any kind of regulatory switch between UGU and CUG targets of CELF1. The
cyclin D1 mRNA from could perhaps be being recognised via some other motif,
such as GCGC.
This leaves the possibility that phosphorylation may play a role in regulating the
stability of CELF1, and its ability to interact with other proteins. The multiple
sites in the serine rich region of the RRM2 to RRM3 linker are the most likely
residues for this. The limited impact of Ser28 phosphorylation and the lack of

260
predicted phosphorylation sites in the other structured regions of the protein
indicate that it does not regulate RNA recognition though.
8.2 Dimerisation of CELF1
Bonnet-Corven et al. (2002) reported dimerisation of Xenopus CELF1 using a
yeast two hybrid assay54
. Biophysical techniques have not shown any sign of
dimer formation except possibly in the ESI-MS of RRM1. No dimer population
was seen for the t187 or RRM123 constructs, despite the fact the RRM123
construct still incorporates the section of the linker proposed to be involved in
dimerisation103
. The elution point by gel filtration of all CELF1 constructs is
consistent with a monomeric species. ITC of concentrated wild type CELF1 into
buffer showed no significant enthalpy change. If a dimer was present then this
dilution titration would be expected to show a dissociation curve.
There are signs of a small dimer population in some of the mass spectra, in
particular the unbound RRM1 construct. This appears as a smaller set of peaks
with m/z values that imply half-integer values of z. Since this is not possible, it
indicates a second species consisting of a dimer. The NMR data shows no change
in the spectrum of any of the CELF1 constructs on dilution from 400 µM to 20
µM. No change is seen on dilution for the high affinity RRM123/EDEN2U4U
complex either. As the ITC and NMR do not show any evidence of dimerisation
and the fraction of this species seen in the mass spectrum is very small it is
possible this is an artefact of the experiment being in the gas phase. There were
also no signs of dimerisation in the spectrum for the t187 or RRM123 constructs.
Wild type CELF1 did not give clear enough mass spectrometry data for accurate
determination of its mass, or to detect the presence of any low population species.
The NMR spectrum of full length CELF1 was essentially the same as that of
RRM123 for the structured region, so it seems unlikely that any dimerisation
interface could exist in the RRMs. The spectrum did not show any changes on

261
dilution, so again there is no evidence of dimerisation of CELF1 by NMR.
8.3 Poly(A) Ribonuclease
In 2006 Moraes et al. reported a protein - protein interaction between CELF1 and
poly(A) ribonuclease (PARN)56
. PARN is a 3’-exoribonuclease, which
specifically degrades poly(A) tails207, 208, 209
. This presents a possible mechanism
for CELF1 binding increasing deadenylation rates, as the protein could be directly
recruiting PARN to the target mRNA substrate. This interaction was observed in
the absence of RNA so it must occur between the proteins, and not simply be a
case of the two proteins binding to the same RNA molecule. It was later shown
that the presence of CELF1 affected patterns of mRNA deadenylation by
PARN13
. No structural information indicating which regions of these two proteins
are involved in the interaction has been reported.
Poly(A) ribonuclease is a 72.8 kDa protein containing three structured domains; a
310 residue exoribonuclease domain, a 75 residue R3H domain, and an 80 residue
RNA recognition motif210
. The R3H domain is inserted into a long flexible loop
in the middle of the protein sequence of the nuclease domain. The RRM is
separated from the other domains by an unstructured region, and there are an
additional 120 residues of flexible protein forming the C-terminal end of the
protein. A 54 kDa fragment of the protein has been found to be sufficient to
specifically degrade poly(A) tails211
.

262
Figure 8.5: Domain layout of PARN. The R3H domain is inserted into an extended loop in the middle of
the exoribonuclease domain.
PARN is believed to form a homodimer via the exoribonuclease domain211
.
Dimerisation of a construct of residues 443 - 560 has also been reported, and
speculated to be mediated by a zipper motif in the C-terminal region212
. Crystal
structures of all three structured domains are available (PDB IDs: 1UG8, 1WHV
and 2A1R), however no structure in which all three domains are visible
simultaneously has yet been reported. Structural data is also available for the
nuclease domain in complex with a poly(A) sequence213
and for the RRM in
complex with the 5’ mRNA cap structure112
. The RRM has also been implicated
in interactions with the poly(A) tail214, 215
. The largest complex which has been
directly observed consisted of residues 1 - 510 of PARN in complex with RNA,
but the R3H domain appeared unstructured in this crystal. In 2009 Wu et al.
produced a possible model of the complete homodimeric protein in complex with
both the 5’ cap and the poly(A) tail of an mRNA based on a combination of the
different crystal structures, which is shown in Error! Reference source not
found.111.
The reported dimerisation via the C-terminal zipper motif is however inconsistent
with this model. While the C-terminus of the protein is not visible in the available
crystal structures due to its flexibility, the model by Wu et al. would have these
regions at opposite ends of the protein dimer. There is no indication of how
CELF1 might interact with this complex

263
The R3H domain has been suggested to play a role in stabilizing the RRM, and
hence the rest of the protein and the model does suggest a possible contact surface
between these domains216
. In the model the R3H domain of each monomer is
paired up with the RRM of the other monomer unit. PARN has been previously
noted to truncate in the region of the RRM to give the p54 isoform, and removal
of the R3H domain encourages this breakdown. PARN is also stabilised by the
presence of Mg2+
ions, and requires them for catalytic activity217
.
8.4 Aims
Our initial aim was to express and purify poly (A) ribonuclease and determine
whether it possible to acquire high resolution NMR data on this system. If NMR
spectra of sufficient quality could be collected, we then aimed to observe the
reported CELF1/PARN interaction using 15
N TROSY spectra, and so determine
which regions of the proteins were involved. This would enable us to determine if
a ternary complex of CELF1, PARN and an EDEN motif could form, and so
whether the proposed mechanism of PARN recruitment by CELF1 was plausible.
As a complex of CELF1 with the PARN dimer would have a mass of around 200
kDa, this system is an ambitious target for NMR.
8.5 Expression and Purification of Poly(A) Ribonuclease
Expression plasmids of human and Xenopus PARN cloned into the pET33 vector
were supplied by Dr. Cornelia de Moor (University of Nottingham). The
expression and purification protocols were based on the methods reported by
Nilsson et al. (2006), which had been shown to produce catalytically active
PARN110
and so was expected to give intact and correctly folded protein.
Poly(A) ribonuclease was overexpressed successfully, though a significant
fraction of the material was insoluble after a 16 hour induction at 30°C. Reducing

264
the induction temperature to 20°C resulted in almost all of the protein remaining
in the soluble fraction. The intact protein was visible as a band just above the 66
kDa marker. There were also signs of truncation of the protein resulting in a
significant band on the SDS-PAGE at approximately 55 kDa. Similar truncation
products were seen in the purification by Nilsson et al, and were attributed to
degradation of the unstructured C-terminus of PARN. Unlike CELF1, PARN did
not appear to degrade further after the IMAC column stage, allowing the intact
fraction of the protein to be separated from the truncation products.
Figure 8.6: SDS-PAGE of the elution fractions from the IMAC column stage of the purification of poly(A)
ribonuclease. Two strong bands are visible, one at more than 66 kDa, corresponding to the intact protein,
and one just below, corresponding to a truncation product.
Gel filtration was found to be ineffective in separating the intact and truncated
protein, as both eluted between 160 and 170 ml from a Superdex GF200 column.
An ion exchange method similar to that used by Nilsson et al. was attempted,
which succeeded in separating some of the truncation products.

265
Figure 8.7: SDS-PAGE of samples from the ion exchange stage of the poly(A) ribonuclease purification.
Lane 2 shows the proteins loaded onto the anion exchange column, lane 3 shows the proteins which
were not bound. The remaining lanes show the proteins eluted by a 50 mM to 2 M NaCl gradient.
Some separation was achieved, though the truncation products were not
completely removed. In the original purification by Nilsson et al these could not
be completely eliminated either, though the resulting material was found to be
catalytically active. The protein at this point was in a high salt buffer containing
10% (v/v) glycerol, which was not ideal for NMR, and prevented the protein from
being lyophilised. The protein was therefore desalted into MilliQ water using a
HiTrap desalting column.

266
Figure 8.8: SDS-PAGE of the elution fractions from the desalt column. Fraction 2 contained intact protein
only. Fraction 3 contained a greater quantity of intact protein, but also contained visible bands from the
remaining truncation products.
Fraction 2 was lyophilised, and yielded 3 - 4 mg of pure protein per litre when
grown in M9 minimal media. Fraction 3 was found to contain residual glycerol,
and so could not be lyophilised, but additional material could be recovered by
repetition of the desalting step.
8.6 NMR Studies of Poly(A) Ribonuclease
Since the protein has a mass of 72.8 kDa and was believed to form a homodimer,
it seemed likely that rapid relaxation rates would result in a poor signal to noise
ratio in the NMR spectrum, and that the protein would therefore be difficult to
examine even using the TROSY method. 15
N labelled material was purified and a
TROSY spectrum was collected. With 720 scans acquired on a Bruker Avance III
800 MHz spectrometer some well dispersed peaks were resolvable, as shown in
Figure 8.9.
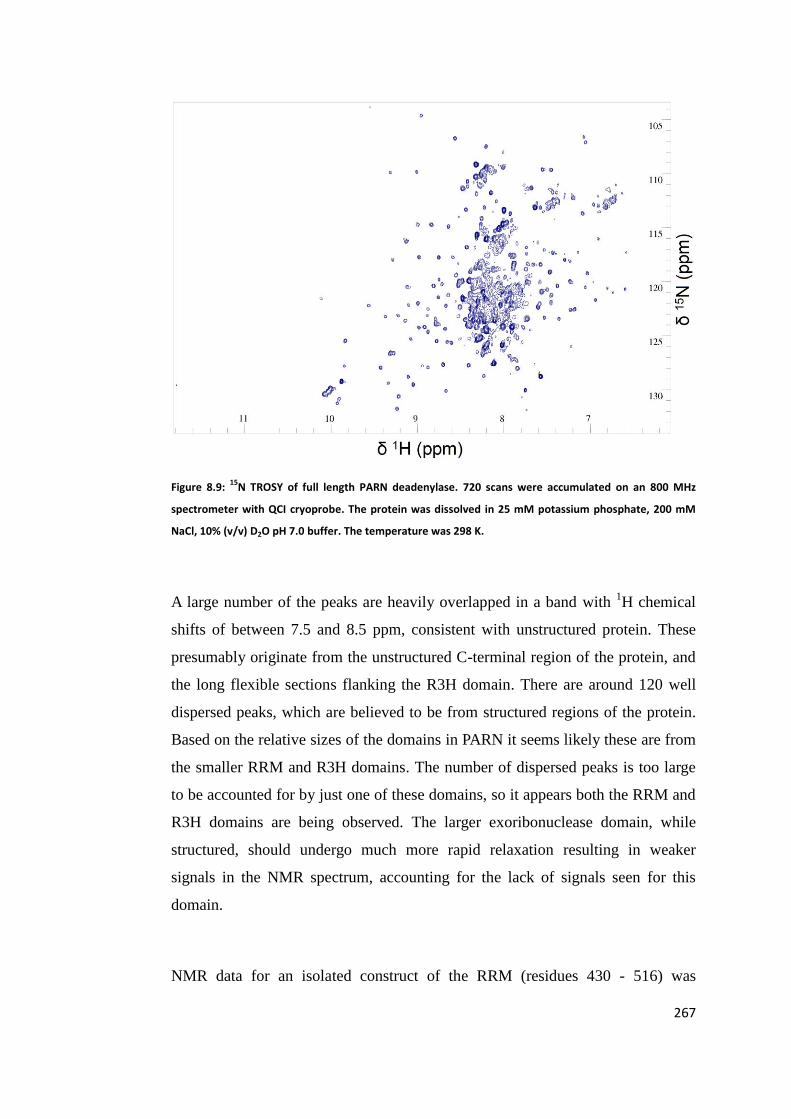
267
Figure 8.9: 15
N TROSY of full length PARN deadenylase. 720 scans were accumulated on an 800 MHz
spectrometer with QCI cryoprobe. The protein was dissolved in 25 mM potassium phosphate, 200 mM
NaCl, 10% (v/v) D2O pH 7.0 buffer. The temperature was 298 K.
A large number of the peaks are heavily overlapped in a band with 1H chemical
shifts of between 7.5 and 8.5 ppm, consistent with unstructured protein. These
presumably originate from the unstructured C-terminal region of the protein, and
the long flexible sections flanking the R3H domain. There are around 120 well
dispersed peaks, which are believed to be from structured regions of the protein.
Based on the relative sizes of the domains in PARN it seems likely these are from
the smaller RRM and R3H domains. The number of dispersed peaks is too large
to be accounted for by just one of these domains, so it appears both the RRM and
R3H domains are being observed. The larger exoribonuclease domain, while
structured, should undergo much more rapid relaxation resulting in weaker
signals in the NMR spectrum, accounting for the lack of signals seen for this
domain.
NMR data for an isolated construct of the RRM (residues 430 - 516) was

268
published by Nagata et al. in 2008. The published 1H-
15N HSQC does not
however match very closely to any subset of the well dispersed peaks in the
spectrum of full length PARN. A possible explanation for this is that the RRM has
been reported to be stabilized by interaction with the R3H domain. In the model
by Wu et al. of the dimeric form the RRM domain of one protein subunit has
contacts with the R3H domain of the other, consistent with this stabilisation.
These contacts will not be present for the isolated RRM, which will exist as a
simple monomeric protein accounting for the significant differences in the 15
N
TROSY spectrum.
8.7 Interactions of CELF1 with Poly(A) Ribonuclease
An excess of unlabelled wild type CELF1 was added to a 15
N labelled PARN
sample. The resulting 15
N TROSY spectrum is shown in Figure 8.10, overlaid on
the spectrum of unbound PARN.
Figure 8.10: Spectrum of unbound 15
N labelled PARN shown in blue. Overlaid in red is 15
N PARN after the
addition of an excess of unlabelled full length wild type CELF1. Acquisition was carried out on an 800 MHz
spectrometer with QCI cryoprobe. Both spectra were collected with 720 scans at 298 K, with a resolution
of 2048 x 128 points.

269
The poorly dispersed peaks from the unstructured region showed minimal
perturbation on addition of CELF1. There were however some significant
changes to the chemical shifts of some of the well dispersed peaks, presumed to
be from the RRM and R3H domains. Without assignments it is not possible to
unambiguously match up signals for the same residue bound and unbound and so
calculate exact CSPs. However the distance between signals lost, and the closest
signals that appear on addition of PARN allows a lower boundary for the CSPs to
be set. It appears that several residues display CSPs of at least 0.4 ppm, indicating
a significant change in environment. It can therefore be concluded that PARN and
CELF1 do interact. As the most affected residues lie in the dispersed region of the
spectrum it can be hypothesized that the interaction between these two proteins is
mediated by the RRM or perhaps the R3H domain of PARN deadenylase.
The tryptophan side chains of PARN may provide some additional evidence as to
which domain is interacting with CELF1. PARN contains six tryptophan residues,
two of which are in the RRM. One tryptophan is located in the R3H domain, and
the remaining three are in the unstructured C-terminal region. In the 15
N TROSY
of PARN, a tight cluster of six peaks with chemical shifts characteristic of
tryptophan side chains is visible.

270
Figure 8.11: Tryptophan side chain region of the PARN 15
N TROSY spectrum. Unbound PARN is shown in
blue. The spectrum after the addition of a saturating amount of unlabelled wild type CELF1 is overlaid in
red. Six clear peaks can be seen in the unbound spectrum, of which two move significantly on binding.
The remaining four, one of which is clearly the C-terminal tryptophan, are not affected.
Two of these peaks are perturbed by addition of unlabelled wild type CELF1,
while the other four remain completely unaffected. As the only section of the
protein with two tryptophan residues in close proximity is the RRM, this would
seem to suggest this domain is mediating the PARN/CELF1 interaction.
There are some RRMs which are known to mediate protein – protein interactions.
One subgroup of RRMs is known as U2AF homology motifs (UHM), and interact
with other proteins via the α-helices on the opposite face from the normal RNA
binding surface218, 219, 220
. In some cases RRMs may bind both proteins and RNA
simultaneously, as has been reported for PTB RRM2221
. Another subgroup of
RRMs is capable of forming protein – protein interactions via the β-sheet surface,
though this generally prevents RNA binding222, 223, 224
. The PARN RRM has both
a non-standard structure, with a third α-helix at the C-terminus, and a novel RNA
binding site. The C-terminal α-helix blocks access to most of the β-sheet surface,

271
even in the presence of its target RNA (the m7GpppG cap structure). The RNA is
instead bound by the loop regions, in particular a key tryptophan residue at the C-
terminal end of β2112, 33,
34
.
One possibility considered was that the interaction was between the PARN RRM
and one of the three RRMs of CELF1, perhaps via the opposite face to the RNA
binding surface in the case of the CELF1 domain. To investigate this possibility
the NMR experiment was run again with the labelling scheme reversed so the
effects on the residues in CELF1 could be observed. An excess of unlabelled
PARN deadenylase was added to 15
N labelled wild type CELF1, resulting in the
15N TROSY spectra shown in Figure 8.12.
Figure 8.12: 15
N TROSY of unbound wild type CELF1 shown in blue. Overlaid in red is the 15
N TROSY after
addition of unlabelled full length PARN. There are only very minor perturbations seen to the signals from
the structured RRMs. A much greater disruption is seen for some signals from the unstructured RRM2-
RRM3 linker, suggesting that PARN may be recognising some part of this sequence. Some degradation
products of CELF1 are visible in the bound spectrum.
The addition of unlabelled PARN deadenylase had very little effect on the peaks

272
from any of the three RRMs of CELF1. There was some disruption to peaks in
the unstructured region of CELF1, but without assignments the exact residues
involved could not be determined. This indicates that the RRMs of CELF1 are not
involved in any interaction with PARN. The remaining possibility is that the
interaction is between the RRM and/or R3H domain of PARN and a peptide
sequence in the long linker between RRM2 and RRM3. This is consistent with
the disruption seen for the residues from the unstructured region of CELF1. It
also implies that the interaction with PARN should not interfere with the normal
RNA binding interactions of CELF1, and so a ternary complex could be formed.
If a section of the RRM2 - RRM3 linker is recognised by PARN it would be
expected to be conserved across the different species where CELF1 and PARN
homologs exist. Unfortunately this linker, while somewhat less conserved than
the structured domains of CELF1, still has a high degree of sequence identity
across species such as human, mouse, chicken, Xenopus and zebrafish. There are
many conserved sections which could potentially be a binding motif for PARN. In
Figure 8.13 is shown a sequence comparison of this region of the protein.

273
Figure 8.13: Sequence alignment of the RRM2 – RRM3 linker region of CELF1 for the species human,
mouse, Xenopus, chicken and zebrafish. There is still a high degree of sequence conservation even in the
unstructured regions of CELF1, so no obvious binding site for poly(A) ribonuclease is evident.
An alternative approach would be to compare the linker region of CELF1 with
other proteins which are already known to interact with PARN, and look for a
conserved sequence. Zinc-finger antiviral protein (ZAP) has been reported to
recruit PARN to degrade the poly(A) tails of viral mRNAs, and so may have a
similar binding site to CELF1225
. There has been one point mutation in the RRM2
– RRM3 linker of human CELF1 which has been reported to prevent
deadenylation in vivo, but not to interfere with RNA binding (G331D)23
.
Mutations disrupting the region of CELF1 recognised by PARN would be
expected to have this effect, so it is possible that Gly331 is within the PARN
binding site. However Gly331 is also one of the least conserved residues between
the CELF1 homologs, replaced with asparagine in Xenopus and serine in

274
zebrafish.
If PARN is remaining as a dimer when it binds CELF1, the resulting complex
would have a mass of around 200 kDa. It would be very surprising to see any
clear peaks in the NMR for a system of this size. It is possible that the PARN
dimer is disrupted by binding to CELF1, which would result in a
monomer/CELF1 complex with a total mass of approximately 135 kDa. Given
the NMR spectra of the complex are of at least the same quality as those of the
free protein, it seems likely that the complex is not drastically larger than the
PARN dimer.
8.7.1 Isolation of the PARN RRM
An initial attempt was made to confirm the regions of PARN involved in CELF1
binding by breaking the protein into isolated domains. The RRM was the simplest
domain to isolate, using the one-step deletion PCR method to remove the codons
for residues 1 – 430 from the full length protein plasmid. This construct retained
the long unstructured C-terminus of the protein, which has been predicted to form
a “zipper” motif dimer.
Expression and purification of this construct was carried out using the same
protocols as for the full length protein. The solubility was considerably higher
than for the full length protein, though SDS-PAGE did still show some C-
terminal degradation of the protein after the IMAC column stage of the
purification.

275
Figure 8.14: 15
N TROSY spectrum of the 431 – 631 construct of PARN deadenylase. Both well dispersed
peaks from the structured RRM and heavily overlapped peaks from the unstructured C-terminus of the
protein are visible. The unstructured peaks generally are a close match to a subset of those in the
spectrum of the full length protein. The structured peaks do not match any of those in the full length
protein, but do match the data in Nagata et al.’s 2008 paper.
The 15
N TROSY of this protein showed around 80 well dispersed peaks,
consistent with the structured RRM domain. There are also clusters of intense
peaks from the unstructured region. The signals from the unstructured region
closely match a subset of the signals in the spectrum of the full length protein.
The signals from the RRM however do not match the chemical shifts of any
subset of the peaks in the spectrum of the full length protein. This can be
attributed to a change from dimer to monomer in going from full length protein to
the 431 – 631 construct. The well dispersed peaks are a reasonable match to the
NMR data published by Nagata et al. in 2008, which was from a smaller
monomeric construct, lacking the C-terminal region.

276
Addition of a saturating amount of wild type CELF1 had no apparent effect on
the spectrum. From this it can be concluded that the RRM on its own is
insufficient to bind to CELF1. Contacts with an R3H domain in the dimeric form
of PARN may be required to form the binding site for CELF1, and/or stabilise the
RRM. Since the domains are not functioning independently the approach of
investigating each domain in isolation which was successful for CELF1, may not
suitable for locating the CELF1 binding site on PARN.
8.7.2 Supplementary Biophysical Techniques
Preliminary investigations of the CELF1/PARN interaction were also conducted
using ITC and ESI-MS. Mass spectrometry of PARN was not successful. Some
very broad signals were present, possibly indicating a range of species with
different numbers of bound sodium ions. The SDS-PAGE analysis carried out
during the purification suggested that the truncation products were not completely
removed, which may also be contributing to the broad peaks seen in the mass
spectrum
ITC experiments were conducted, titrating wild type CELF1 from the syringe into
a dilute solution of PARN in the cell. The syringe and cell concentrations were
reduced to 125 µM and 12.5 µM respectively due to the limited solubility of both
wild type CELF1 and PARN. Titration of CELF1 into PARN showed a
pronounced endothermic curve, shown in Figure 8.15, similar to that seen for
dissociation of a dimer, though it could not be fitted to a simple dissociation
model. Control experiments titrating CELF1 into buffer, and buffer into PARN
showed no significant enthalpy change in either case, confirming that the curve
seen was from direct interaction of the two proteins rather than simply the effect
of diluting either protein.

277
Figure 8.15: ITC traces collected for: A) Titration of 125 µM wild type CELF1 into 12.5 µM PARN. B) Control
titration of 125 µM CELF1 into buffer. C) Control titration of buffer into 12.5 µM PARN. No satisfactory fit
to the CELF1/PARN binding curve could be achieved using any of the binding models in Origin 7.0.
The curve suggests an entropically driven process, and could perhaps be due to
the dissociation of the PARN dimer when binding to CELF1. Repeating the ITC
experiment with the RRM123 construct showed no significant interaction,
consistent with the requirement of some part of the linker between RRM2 and
RRM3 of CELF1. It can also be concluded that the sequence recognised by
PARN is not in the 188 – 214 or >385 regions which are retained in the RRM123
construct. A series of constructs incorporating different sections of the RRM2 –
RRM3 linker could be used to narrow down the region involved in the interaction
with PARN.
8.8 Conclusions
We have shown that despite its size at 72.8 kDa, and existence in solution as a
146 kDa homodimer, poly(A) ribonuclease can be investigated by NMR. Peaks
from at least the RRM and R3H domains are clearly resolvable in the 15
N TROSY
spectrum of the wild type protein. The interaction with CELF1 can therefore be
investigated using this technique. The preliminary data collected on the isolated
RRM does however show that the domains are not functioning independently.

278
The approach of studying each domain in isolation which proved effective for
CELF1 may not be as successful for PARN.
The initial NMR and ITC data does support the hypothesis of a direct interaction
between these two proteins. This interaction appears to be mediated by some part
of the flexible section between RRM2 and 3 (the “divergent domain”) of CELF1.
It is less clear which regions of PARN form the binding interface, though the
NMR spectra do suggest that the RRM and/or the R3H domains are involved. The
lack of interaction with the RRM123 construct seen by ITC shows that residues
188 – 214 of CELF1 do not include a binding site for PARN. The section of the
CELF1 RRM2 – RRM3 linker recognised by PARN could be identified by
producing a series of CELF1 constructs containing only a short section of this
linker, and observing by ITC and NMR whether an interaction occurred with each
one. Since the interaction with the EDEN motif and PARN appear to be mediated
by completely separate regions of CELF1, this preliminary data is consistent with
the formation of a ternary complex, and hence CELF1 triggering deadenylation
by recruitment of PARN to the target mRNA.

279
9 Conclusions
Our first aim was to determine the minimum RNA sequence that would permit
binding by each of the isolated domains. Using NMR and ITC we showed that
RRM1 can bind to the three nucleotide RNA substrate UGU with a Kd of around
60 µM. This indicates only a slightly lower binding affinity than Teplova et al.
later observed for a UUGUU substrate. The CSP map also showed little
difference in the set of affected residues between the UGU and UGUUUGU
substrates. From this it could be concluded that a UGU site is sufficient for
RRM1 to bind, with the addition of a fourth nucleotide providing only a slight
increase in binding affinity. This was corroborated by the observation that RRM1
will form a 2:1 complex with the UGUUUGU substrate, which was detected by
ESI-MS. In contrast RRM2 showed a significantly smaller RNA binding patch in
the CSP map when binding to a UGU substrate compared to UGUUUGU. It was
also unable to form a 2:1 complex with the UGUUUGU substrate, unlike RRM1.
We could therefore conclude that RRM2 requires a fourth nucleotide for high
affinity binding, and hence needs a UGU(U/G) site.
For the lower affinity substrates RRM1 still showed significant CSPs on titration
with a CUG repeat RNA, but not with an ARE. It was therefore concluded to be
capable of recognising either a UGU or UGC site. RRM2 showed very limited
interactions with a CUG substrate, but significant CSPs were seen on titration
with an ARE. This suggests that the domain can tolerate a UAU(U/G) site as well
as a UGU(U/G) site. Together these observations can account for the overall
binding preferences seen for CELF1. Both can recognise sites in a UGU(U/G)
repeating sequence, resulting in a high affinity complex. For CUG and ARE
substrates only one of the two domains has a high affinity site, resulting in a low
affinity interaction for the overall complex.

280
Our second aim was to determine the sequence requirements for tandem binding
of the two N-terminal domains of CELF1. We demonstrated by NMR and ITC
that for a sequence of the form UGU(U)x(UGU) spacer lengths of x = 2 – 4 are
optimal for tandem binding. ITC shows a substantial enhancement of the binding
affinity from ~60 µM to ~0.4 µM when the domains can bind in tandem. X = 1
does not permit binding of both domains simultaneously, and in this situation
RRM1 is bound preferentially. The upper limit was not as sharply defined, with
spacer lengths of 5 nucleotides or more showing a reduction in binding affinity
with Kd values of ~3 µM. This indicates the interaction is still of significantly
higher affinity than for the domains binding in isolation, and the bound NMR
spectrum for x = 5 matched that of the 2 – 4 nucleotide spacers. CSP maps did
however show reduced perturbations in RRM2 for x = 6 and 7. We demonstrated
that the EDEN11 GRE and EDEN15 consensus sequences will bind the N-
terminal domains of CELF1 in tandem, to two of the UGU sites which are
separated by 5 nucleotides.
An extended CUG repeat substrate still showed little interaction with RRM2 by
NMR. An extended ARE however showed significant CSPs in both domains,
unlike the isolated RRM1 construct, suggesting some enhancement of affinity
when the domains bind in tandem to ARE substrates as well. RRM3 has been
previously reported to have only very weak interactions with CUGCUG repeats.
It can be concluded that any interaction of wild type CELF1 with single stranded
CUG repeat RNA will be of very low affinity, and will be outcompeted by the
preferred U/G rich sequences. We also confirmed that there is no RRM1 or
RRM2 equivalent of the RRM3 N-terminal involvement in RNA binding. 15
N
heteronuclear NOE experiments showed that the RRM1 N-terminus and the
interdomain linker between RRM1 and RRM2 remain dynamic even when both
domains are bound to RNA. A construct with 50 additional residues at the C-
terminus of RRM2 also showed no differences in RNA binding properties to the
t187 construct. This confirms that the isolated domain and t187 constructs are not
omitting any functional extensions of these domains, and so should behave in the
same manner as in wild type CELF1.

281
Our third aim was to characterise the full EDEN motif capable of binding all
three domains of CELF1 simultaneously. We were able to devise a purification to
produce small amounts (~ 1-2 mg/l) of wild type CELF1, but the protein’s poor
solubility and vulnerability to proteolysis severely limited the data that could be
collected using it. We therefore produced the RRM123 construct, in which
residues 215 - 384 of CELF1 have been deleted, which was found to be stable,
soluble, and allowed the acquisition of high quality NMR spectra. Using this
construct we demonstrated that the EDEN11 GRE proposed as an EDEN motif by
Vlasova et al. is not in fact capable of binding all three domains simultaneously.
It can be concluded that neither the EDEN11 GRE, or the 11 nucleotide UG
repeat proposed by Rattenbacher et al. represent complete EDEN motifs. The
EDEN15 sequence proposed by Graindorge et al. did appear to permit the
formation of a 1:1 complex with all three domains bound and so probably is a
functional EDEN motif, but the affinity was not significantly enhanced compared
to binding of just the N-terminal domains. It was therefore concluded that the
while the spacing in this sequence can be tolerated by CELF1, it is not optimal.
We designed the sequence EDEN-2U/4U (UGUUUUGUUUUUUGU) which
formed the highest affinity 1:1 complex so far observed, with a Kd of 110 nM. We
concluded that sequences of the form UGU(U)xUGU(U)yUGU, with x = 2 – 5
and y = 1 – 4 permitted a 1:1 complex with all three domains of CELF1 bound
simultaneously, and therefore represented functional EDEN motifs. The shortest
sequence for which formation of a 1:1 complex was observed was EDEN-2U/1U
(UGUUUUGUUUGU), though more than a 10-fold reduction in binding affinity
was seen compared to EDEN-2U/4U. This is the minimum sequence capable of
binding all three RRMs simultaneously. We also demonstrated that secondary
structure in the RNA substrate can play an important role in forming a high
affinity target for CELF1. The sequence EDEN-2U/HL still formed a 1:1
complex with comparable affinity to the EDEN15 sequence despite the 14
nucleotide spacer between two of the UGU sites. This was because the spacer was
282
capable of forming an RNA hairpin, which was confirmed to be present by NMR,
bringing the UGU sites into close proximity and making the binding of CELF1
more favourable.
The fourth aim was to rationalise those RNA sequences which have been
empirically demonstrated to be EDEN motifs by their ability to trigger
deadenylation. All of the sequences shown to be EDEN motifs by Moraes et al,
Vlasova et al. and Rattenbacher et al. contain at least one set of UGU sites
complying with our criteria for the formation of a 1:1 complex except TNFα and
c-jun. Both of these sequences are however predicted to contain secondary
structure which will bring distant UGU sites into close proximity, which can
therefore account for CELF1 binding. Interestingly in the TNFα case this is due
to the formation of a hairpin from the repeating AUUUA region of the RNA,
which may account for the observation that this motif increases deadenylation
efficiency when present.
The fifth aim was to characterise the structure of the high affinity 1:1 complex
between CELF1 and an EDEN motif. We were however unable to produce an
NMR or crystal structure of the complex. A substantial loss in NMR spectrum
quality was seen when all three domains bound simultaneously to a single RNA
molecule, which prevented acquisition of sufficient quality NOE restraints and
RDC data to determine a structure. Attempts to co-crystallise the protein and
RNA were unsuccessful preventing determination of the structure by x-ray
crystallography. We were however able to produce a model of the complex based
on the existing crystal structures of the isolated domains, supplemented by PRE
and SAXS data. The PRE data showed a significant preference for arranging the
domains in the order 2 – 1 – 3 from the 5’ to 3’ end of the RNA sequence. Kratky
plots suggest the complex is slightly more globular than the unbound RRM123
protein. This may indicate a loss of internal dynamics in the protein, which could
account for the reduction in the quality of the NMR spectra.

283
The sixth aim was to investigate whether phosphorylation at Ser28 could act as a
“switch” changing CELF1’s preferred RNA target from U/G rich elements to C/G
rich sequences. We produced and expressed phosphomimetic S28D mutants of all
of our constructs of CELF1 which contained this residue. The disruption to the
fold of the domain appeared very limited, with only six residues in α-helix 1
showing large CSPs when compared to the wild type. No significant difference in
binding affinity was seen for U/G rich sequences between the wild type and the
S28D mutant. No enhancement of binding affinity was seen for the S28D mutant
when binding to a CUG repeat sequence. It is possible that recognition of some
element other than the CG sites of the cyclin D1 RNA reported by Salisbury et al.
is being enhanced, but we found no evidence to support this idea of a
phosphorylation switch.
Our final aim was to determine whether it was possible to acquire high resolution
NMR data on poly(A) ribonuclease, and its key regulatory complex with CELF1
reported by Moraes et al. We expressed and purified the full 631 residue poly (A)
ribonuclease, though the protein was found to be prone to proteolysis of the
unstructured C-terminal region. We were able to acquire the first 15
N TROSY
spectrum of the complete protein (a 146 kDa dimer). Around 140 dispersed peaks
could be clearly resolved which are believed to be from the smaller RRM and
R3H domains, with the signals from the larger nuclease domain being lost due to
rapid relaxation. This demonstrates that NMR can be used to study the behaviour
of these domains even as part of the full length protein.
We observed significant CSPs for some of the well dispersed peaks in the PARN
spectrum on addition of unlabelled wild type CELF1, confirming a direct
interaction between these two proteins. This interaction is likely to involve the
RRM and/or the R3H domains of PARN. Reversing the labels showed no CSPs
in the three RRMs of wild type CELF1 on addition of unlabelled PARN, but did

284
appear to show some disruption to the poorly dispersed signals from the long
linker between RRM2 and RRM3. If PARN is interacting with this region of
CELF1 it is unlikely to interfere with the normal binding of CELF1’s RRMs to
the EDEN motif. This is consistent with CELF1 binding to both the EDEN motif
and PARN simultaneously, and so the mechanism of CELF1 recruiting PARN to
its mRNA targets in order to trigger deadenylation.
9.1 Future Work
The structure of the high affinity complex between CELF1 and an EDEN motif
could be refined by additional paramagnetic relaxation enhancement experiments.
If several titrations were conducted with the spin label placed at a different
position in each one (such as at the 3’ end of the RNA and either side of the
central UGU site) a far greater number of distance restraints could be generated
and a more accurate model could be produced.
Control experiments with the wild type CELF1 have shown no appreciable
difference between its RNA binding preferences and those of the RRM123
construct. A further control experiment could be to replace the RRM2 to RRM3
linker with a more stable sequence of comparable length. This “dummy” linker
would allow the same freedom of movement of the RRMs relative to each other,
while bypassing the stability and solubility issues which have hindered the
collection of data on the wild type protein. In particular it would allow SAXS
data to be collected, which the low solubility of the wild type protein prevented.
A longer linker between RRM2 and RRM3 would be expected to be more visible
in the envelope, making the orientation of the protein domains much clearer.
While the S28D phosphomimetic mutant did not show any change in the binding
preferences for U/G rich sequences and CUG repeats, there remains the
possibility of increased affinity for some other motif present in the cyclin D1

285
mRNA. Systematic NMR titrations of CELF1 with short sections of the cyclin D1
RNA could locate any elements other than the single UGC site that are being
recognised. Even if Ser28 proves not to have any important role in the function of
CELF1, there are a number of other possible phosphorylation sites to be
investigated. Most of these are within the unstructured RRM2 – RRM3 linker,
and so could have a role in regulating the interaction with poly(A) ribonuclease.
Phosphomimetic mutations could be produced at these sites, and any impact on
the binding of PARN observed by ITC and NMR.
The exact region of CELF1 recognised by PARN could be determined by
systematically testing short sections of the RRM2 – RRM3 linker for binding
using NMR and ITC. These could either be isolated peptide sequences, or as
deletion constructs of CELF1 produced by the same methods as RRM123.
Locating the binding surface of PARN is more difficult due to the interaction
between the domains. It might be possible to collect 3D heteronuclear NMR
spectra of sufficient quality to assign the dispersed peaks in the 15
N TROSY of
the full length protein, and so determine the exact residues involved. An
alternative approach would be to investigate whether in combination the PARN
RRM and R3H domains can interact with CELF1. A construct with these
domains, but not the large nuclease domain, would be expected to result in a
substantial improvement in the NMR spectrum quality, and so the ease of
assigning the spectrum.
The ability of CELF1 to bridge the end of an RNA hairpin, demonstrated using
the RNA substrate EDEN-2U/HL presents a possible mechanism for its function
as an alternative splicing regulator. By binding RRM1 and RRM2 in tandem to a
partial EDEN motif on one side of an exon, and binding RRM3 to a UGU(U/G)
site on the other side, it could encourage skipping of the exon. This is consistent
with recently published results by Masuda et al. (2012), which reported that
CELF1 binding sites are concentrated in intronic regions flanking alternative
exons. In their study they were however treating the sequence UGUUUGU as a

286
CELF1 binding site, which we have shown in this thesis to be incapable of
binding multiple CELF1 domains simultaneously. CELF1 would therefore need
multiple copies of this RNA sequence for high affinity binding, which could be
located on either side of the exon.
CELF1 presents a possible drug target, as if its “gain of function” in DM1 cells
could be reversed then normal alternative splicing patterns should be restored and
the DM1 phenotype mitigated. The recent publication by Masuda et al. (2012)
also suggests that one of the mRNAs bound by CELF1, and hence translationally
repressed, is the MBNL1 mRNA. Down-regulation of CELF1 should therefore
result in upregulation of MBNL1, counterbalancing its sequestration by CUG
repeat RNAs in DM1 cells. With the understanding of requirements for high
affinity binding of CELF1 gained in this study it may be possible to design a
ligand capable of binding with higher affinity than the natural substrates, and so
sequestering CELF1. This would involve further studies to produce high affinity
ligands, working from templates such as EDEN-2U/4U and possibly
incorporating modified RNA bases.

287
10 References
1. Wu, J.; Li, C.; Zhao, S.; Mao, B., Differential expression of the Brunol/CELF family
genes during Xenopus laevis early development. International Journal of Developmental
Biology 2010, 54 (1), 209-214.
2. Delaunay, J.; Mee, G.; Ezzeddine, N.; Labesse, G.; Terzian, C.; Capri, M.; Ait-
Ahmed, O., The Drosophila Bruno paralogue Bru-3 specifically binds the EDEN
translational repression element. Nucleic Acids Research 2004, 32 (10), 3070-3082.
3. Chen, Q.; Herring, D.; Good, P., The role of the Bruno family of RNA-binding
proteins in nervous system and muscle development. Molecular Biology of the Cell
1997, 8, 2064-2064.
4. Good, P.; Chen, Q.; Warner, S.; Herring, D., A family of human RNA-binding
proteins related to the Drosophila Bruno translational regulator. Journal of Biological
Chemistry 2000, 275 (37), 28583-28592.
5. Barreau, C.; Paillard, L.; Méreau, A.; Osborne, H. B., Mammalian CELF/Bruno-like
RNA-binding proteins: molecular characteristics and biological functions. Biochimie
2006, 88 (5), 515-25.
6. Timchenko, L.; Timchenko, N.; Caskey, C.; Roberts, R., Novel proteins which bind
CTG and CUG repeat sequences. American Journal of Human Genetics 1995, 57 (4), 862-
862.
7. Miller, J.; Swanson, M.; Timchenko, N.; Devore, D.; Lin, L.; Datar, K.; Roberts, R.;
Caskey, C.; Timchenko, L., Identification of a CUG triplet repeat RNA-binding protein and
its role in myotonic dystrophy. Molecular Biology of the Cell 1996, 7, 1755-1755.
8. Mankodi, A.; Takahashi, M.; Jiang, H.; Beck, C.; Bowers, W.; Moxley, R.; Cannon,
S.; Thornton, C., Expanded CUG repeats trigger aberrant splicing of CIC-1 chloride
channel pre-mRNA and hyperexcitability of skeletal muscle in myotonic dystrophy.
Molecular Cell 2002, 10 (1), 35-44.

288
9. Ho, T.; Bundman, D.; Armstrong, D.; Cooper, T., Transgenic mice expressing
CUG-BP1 reproduce splicing mis-regulation observed in myotonic dystrophy. Human
Molecular Genetics 2005, 14 (11), 1539-1547.
10. Suzuki, H.; Jin, Y.; Otani, H.; Yasuda, K.; Inoue, K., Regulation of alternative
splicing of alpha-actinin transcript by Bruno-like proteins. Genes To Cells 2002, 7 (2),
133-141.
11. Roberts, R.; Timchenko, N.; Miller, J.; Reddy, S.; Caskey, C.; Swanson, M.;
Timchenko, L., Altered phosphorylation and intracellular distribution of a (CUG)(n)
triplet repeat RNA binding protein in patients with myotonic dystrophy and in myotonin
protein kinase knockout mice. Proceedings of the National Academy of Sciences of the
United States of America 1997, 94 (24), 13221-13226.
12. Paillard, L.; Omilli, F.; Legagneux, V.; Bassez, T.; Maniey, D.; Osborne, H., EDEN
and EDEN-BP, a cis element and an associated factor that mediate sequence-specific
mRNA deadenylation in Xenopus embryos. EMBO Journal 1998, 17 (1), 278-287.
13. Moraes, K.; Wilusz, C.; Wilusz, J., CUG-BP and 3'UTR sequences influence PARN-
mediated deadenylation in mammalian cell extracts. Genetics and Molecular Biology
2007, 30 (3), 646-655.
14. Goldstrohm, A.; Wickens, M., Multifunctional deadenylase complexes diversify
mRNA control. Nature Reviews Molecular Cell Biology 2008, 9 (4), 337-344.
15. Cooke, A.; Prigge, A.; Wickens, M., Translational Repression by Deadenylases.
Journal of Biological Chemistry 2010, 285 (37), 28506-28513.
16. Lu, P.; Vogel, C.; Wang, R.; Yao, X.; Marcotte, E., Absolute protein expression
profiling estimates the relative contributions of transcriptional and translational
regulation. Nature Biotechnology 2007, 25 (1), 117-124.
17. Garneau, N.; Wilusz, J.; Wilusz, C., The highways and byways of mRNA decay.
Nature Reviews Molecular Cell Biology 2007, 8 (2), 113-126.
18. Cao, D.; Parker, R., Computational modeling of eukaryotic mRNA turnover. Rna-
a Publication of the RNA Society 2001, 7 (9), 1192-1212.

289
19. Parker, R.; Song, H., The enzymes and control of eukaryotic mRNA turnover.
Nature Structural & Molecular Biology 2004, 11 (2), 121-127.
20. Kapp, L.; Lorsch, J., The molecular mechanics of eukaryotic translation. Annual
Review of Biochemistry 2004, 73, 657-704.
21. Ezzeddine, N.; Paillard, L.; Capri, M.; Maniey, D.; Bassez, T.; Ait-Ahmed, O.;
Osborne, H., EDEN-dependent translational repression of maternal mRNAs is conserved
between Xenopus and Drosophila. Proceedings of the National Academy of Sciences of
the United States of America 2002, 99 (1), 257-262.
22. Paillard, L.; Legagneux, V.; Maniey, D.; Osborne, H. B., c-Jun ARE targets mRNA
deadenylation by an EDEN-BP (embryo deadenylation element-binding protein)-
dependent pathway. J Biol Chem 2002, 277 (5), 3232-5.
23. Paillard, L.; Legagneux, V.; Beverley Osborne, H., A functional deadenylation
assay identifies human CUG-BP as a deadenylation factor. Biol Cell 2003, 95 (2), 107-13.
24. Caskey, C.; Swanson, M.; Timchenko, L., Myotonic dystrophy: Discussion of
molecular mechanism. Cold Spring Harbor Symposia on Quantitative Biology 1996, 61,
607-614.
25. Timchenko, L. T.; Miller, J. W.; Timchenko, N. A.; Devore, D. R.; Datar, K. V.; Lin,
L.; Roberts, R.; Caskey, C. T.; Swanson, M. S., Identification of a (CUG)n triplet repeat
RNA-binding protein and its expression in myotonic dystrophy. Nucleic Acids Res 1996,
24 (22), 4407-14.
26. Timchenko, L.; Timchenko, N.; Caskey, C.; Roberts, R., Novel proteins with
binding specificity for DNA CTG repeats and RNA CUG repeats: Implications for
myotonic dystrophy. Human Molecular Genetics 1996, 5 (1), 115-121.
27. Philips, A. V.; Timchenko, L. T.; Cooper, T. A., Disruption of splicing regulated by
a CUG-binding protein in myotonic dystrophy. Science 1998, 280 (5364), 737-41.
28. Takahashi, N.; Sasagawa, N.; Suzuki, K.; Ishiura, S., The CUG-binding protein
binds specifically to UG dinucleotide repeats in a yeast three-hybrid system.
Biochemical and Biophysical Research Communications 2000, 277 (2), 518-523.
290
29. Mori, D.; Sasagawa, N.; Kino, Y.; Ishiura, S., Quantitative analysis of CUG-BP1
binding to RNA repeats. J Biochem 2008, 143 (3), 377-83.
30. Maruyama, K.; Sato, N.; Ohta, N., Conservation of structure and cold-regulation
of RNA-binding proteins in cyanobacteria: probable convergent evolution with
eukaryotic glycine-rich RNA-binding proteins. Nucleic Acids Research 1999, 27 (9), 2029-
2036.
31. Maris, C.; Dominguez, C.; Allain, F., The RNA recognition motif, a plastic RNA-
binding platform to regulate post-transcriptional gene expression. FEBS Journal 2005,
272 (9), 2118-2131.
32. Venter, J.; Adams, M.; Myers, E.; et al., The sequence of the human genome.
Science 2001, 291 (5507), 1304-+.
33. Calero, G.; Wilson, K.; Ly, T.; Rios-Steiner, J.; Clardy, J.; Cerione, R., Structural
basis of m(7)GpppG binding to the nuclear cap-binding protein complex. Nature
Structural Biology 2002, 9 (12), 912-917.
34. Mazza, C.; Segref, A.; Mattaj, I.; Cusack, S., Large-scale induced fit recognition of
an m(7)GpppG cap analogue by the human nuclear cap-binding complex. EMBO Journal
2002, 21 (20), 5548-5557.
35. Allain, F.; Bouvet, P.; Dieckmann, T.; Feigon, J., Molecular basis of sequence-
specific recognition of pre-ribosomal RNA by nucleolin. EMBO Journal 2000, 19 (24),
6870-6881.
36. Price, S.; Evens, P.; Nagai, K., Crystal structure of the spliceosomal U2B ''-U2A '
protein complex bound to a fragment of U2 small nuclear RNA. Nature 1998, 394
(6694), 645-650.
37. Wang, X.; Hall, T., Structural basis for recognition of AU-rich element RNA by
the HuD protein. Nature Structural Biology 2001, 8 (2), 141-145.
38. Handa, N.; Nureki, O.; Kurimoto, K.; Kim, I.; Sakamoto, H.; Shimura, Y.; Muto, Y.;
Yokoyama, S., Structural basis for recognition of the tra mRNA precursor by the sex-
lethal protein. Nature 1999, 398 (6728), 579-585.

291
39. Adam, S.; Nakagawa, T.; Swanson, M.; Woodruff, T.; Dreyfuss, G., Messenger-
RNA polyadenylate-binding protein - gene isolation and sequencing and identification of
a ribonucleoprotein consensus sequence. Molecular and Cellular Biology 1986, 6 (8),
2932-2943.
40. Swanson, M.; Nakagawa, T.; Levan, K.; Dreyfuss, G., Primary structure of human
nuclear ribonucleoprotein particle C-proteins - conservation of sequence and domain-
structures in heterogeneous nuclear-RNA, messenger-RNA, and pre-ribosomal-RNA-
binding proteins. Molecular and Cellular Biology 1987, 7 (5), 1731-1739.
41. Allain, F.; Gubser, C.; Howe, P.; Nagai, K.; Neuhaus, D.; Varani, G., Specificity of
ribonucleoprotein interaction determined by RNA folding during complex formation.
Nature 1996, 380 (6575), 646-650.
42. Oubridge, C.; Ito, N.; Evans, P.; Teo, C.; Nagai, K., Crystal-structure at 1.92
angstrom resolution of the RNA-binding domain of the U1A spliceosomal protein
complexed with an RNA hairpin. Nature 1994, 372 (6505), 432-438.
43. Clery, A.; Blatter, M.; Allain, F., RNA recognition motifs: boring? Not quite.
Current Opinion in Structural Biology 2008, 18 (3), 290-298.
44. Ding, J.; Hayashi, M.; Zhang, Y.; Manche, L.; Krainer, A.; Xu, R., Crystal structure
of the two-RRM domain of hnRNP A1 (UP1) complexed with single-stranded telomeric
DNA. Genes & Development 1999, 13 (9), 1102-1115.
45. Crichlow, G.; Zhou, H.; Hsiao, H.; Frederick, K.; Debrosse, M.; Yang, Y.; Folta-
Stogniew, E.; Chung, H.; Fan, C.; De La Cruz, E.; Levens, D.; Lolis, E.; Braddock, D.,
Dimerization of FIR upon FUSE DNA binding suggests a mechanism of c-myc inhibition.
EMBO Journal 2008, 27 (1), 277-289.
46. Birney, E.; Kumar, S.; Krainer, A., Analysis of the RNA-recognition motif and RS
and RGG domains - conservation in metazoan pre-messenger-RNA splicing factors.
Nucleic Acids Research 1993, 21 (25), 5803-5816.
47. Kenan, D.; Query, C.; Keene, J., RNA recognition - towards identifying
determinants of specificity. Trends in Biochemical Sciences 1991, 16 (6), 214-220.

292
48. Jun, K. Y.; Xia, Y.; Han, X.; Zhang, H.; Timchenko, L.; Swanson, M. S.; Gao, X.,
(1)H, (15)N and (13)C chemical shift assignments of RNA repeats binding protein --
CUGBP1ab. J Biomol NMR 2004, 30 (3), 371-2.
49. Tsuda, K.; Kuwasako, K.; Takahashi, M.; Someya, T.; Inoue, M.; Terada, T.;
Kobayashi, N.; Shirouzu, M.; Kigawa, T.; Tanaka, A.; Sugano, S.; Güntert, P.; Muto, Y.;
Yokoyama, S., Structural basis for the sequence-specific RNA-recognition mechanism of
human CUG-BP1 RRM3. Nucleic Acids Res 2009, 37 (15), 5151-66.
50. Koradi, R.; Billeter, M.; Wuthrich, K., MOLMOL: A program for display and
analysis of macromolecular structures. Journal of Molecular Graphics 1996, 14 (1), 51-&.
51. Teplova, M.; Song, J.; Gaw, H.; Teplov, A.; Patel, D., Structural Insights into RNA
Recognition by the Alternate-Splicing Regulator CUG-Binding Protein 1. Structure 2010,
18 (10), 1364-1377.
52. Lu, X.; Timchenko, N.; Timchenko, L., Cardiac elav-type RNA-binding protein
(ETR-3) binds to RNA CUG repeats expanded in myotonic dystrophy. Human Molecular
Genetics 1999, 8 (1), 53-60.
53. Audic, Y.; Omilli, F.; Osborne, H., Embryo deadenylation element-dependent
deadenylation is enhanced by a cis element containing AUU repeats. Molecular and
Cellular Biology 1998, 18 (12), 6879-6884.
54. Bonnet-Corven, S.; Audic, Y.; Omilli, F.; Osborne, H., An analysis of the sequence
requirements of EDEN-BP for specific RNA binding. Nucleic Acids Research 2002, 30 (21),
4667-4674.
55. Marquis, J.; Paillard, L.; Audic, Y.; Cosson, B.; Danos, O.; Le Bec, C.; Osborne, H.,
CUG-BP1/CELF1 requires UGU-rich sequences for high-affinity binding. Biochemical
Journal 2006, 400, 291-301.
56. Moraes, K. C.; Wilusz, C. J.; Wilusz, J., CUG-BP binds to RNA substrates and
recruits PARN deadenylase. RNA 2006, 12 (6), 1084-91.

293
57. Graindorge, A.; Le Tonqueze, O.; Thuret, R.; Pollet, N.; Osborne, H.; Audic, Y.,
Identification of CUG-BP1/EDEN-BP target mRNAs in Xenopus tropicalis. Nucleic Acids
Research 2008, 36 (6), 1861-1870.
58. Vlasova, I.; Tahoe, N.; Fan, D.; Larsson, O.; Rattenbacher, B.; John, J.;
Vasdewani, J.; Karypis, G.; Reilly, C.; Bitterman, P.; Bohjanen, P., Conserved GU-rich
elements mediate mRNA decay by binding to CUG-binding protein 1. Molecular Cell
2008, 29 (2), 263-270.
59. Vlasova, I.; Bohjanen, P., Posttranscriptional regulation of gene networks by GU-
rich elements and CELF proteins. RNA Biology 2008, 5 (4), 201-207.
60. Rattenbacher, B.; Beisang, D.; Wiesner, D. L.; Jeschke, J. C.; Von Hohenberg, M.;
St Louis-Vlasova, I. A.; Bohjanen, P. R., Analysis of CUGBP1 targets identifies GU-repeat
sequences that mediate rapid mRNA decay. Mol Cell Biol 2010, 30 (16), 3970-80.
61. Harper, P., Myotonic Dystrophy. Third ed.; 2001.
62. Mankodi, A.; Jiang, C.; Takahashi, M.; Beck, C.; Moxley, R.; Cannon, S.; Thornton,
C., RNA splicing defect leads to chloride channelopathy and myotonia in myotonic
dystrophy (DM). Neurology 2002, 58 (7), A168-A169.
63. Charlet-B, N.; Savkur, R.; Singh, G.; Philips, A.; Grice, E.; Cooper, T., Loss of the
muscle-specific chloride channel in type 1 myotonic dystrophy due to misregulated
alternative splicing. Molecular Cell 2002, 10 (1), 45-53.
64. Timchenko, N.; Patel, R.; Iakova, P.; Cai, Z.; Quan, L.; Timchenko, L.,
Overexpression of CUG triplet repeat-binding protein, CUGBP1, in mice inhibits
myogenesis. Journal of Biological Chemistry 2004, 279 (13), 13129-13139.
65. Ward, A. J.; Rimer, M.; Killian, J. M.; Dowling, J. J.; Cooper, T. A., CUGBP1
overexpression in mouse skeletal muscle reproduces features of myotonic dystrophy
type 1. Human Molecular Genetics 2010, 19 (18), 3614-22.
66. Koshelev, M.; Sarma, S.; Price, R.; Wehrens, X.; Cooper, T., Heart-specific
overexpression of CUGBP1 reproduces functional and molecular abnormalities of
myotonic dystrophy type 1. Human Molecular Genetics 2010, 19 (6), 1066-1075.

294
67. Ho, T. H.; Bundman, D.; Armstrong, D. L.; Cooper, T. A., Transgenic mice
expressing CUG-BP1 reproduce splicing mis-regulation observed in myotonic dystrophy.
Human Molecular Genetics 2005, 14 (11), 1539-47.
68. Aslanidis, C.; Jansen, G.; Amemiya, C.; Shutler, G.; Mahadevan, M.; Tsilfidis, C.;
Chen, C.; Alleman, J.; Wormskamp, N.; Vooijs, M.; Buxton, J.; Johnson, K.; Smeets, H.;
Lennon, G.; Carrano, A.; Korneluk, R.; Wieringa, B.; Dejong, P., cloning of the essential
myotonic-dystrophy region and mapping of the putative defect. Nature 1992, 355
(6360), 548-551.
69. Brook, J.; Mccurrach, M.; Harley, H.; Buckler, A.; Church, D.; Aburatani, H.;
Hunter, K.; Stanton, V.; Thirion, J.; Hudson, T.; Sohn, R.; Zemelman, B.; Snell, R.; Rundle,
S.; Crow, S.; Davies, J.; Shelbourne, P.; Buxton, J.; Jones, C.; Juvonen, V.; Johnson, K.;
Harper, P.; Shaw, D.; Housman, D., molecular-basis of myotonic-dystrophy - expansion
of a trinucleotide (CTG) repeat at the 3' end of a transcript encoding a protein-kinase
family member. Cell 1992, 68 (4), 799-808.
70. Buxton, J.; Shelbourne, P.; Davies, J.; Jones, C.; Vantongeren, T.; Aslanidis, C.;
Dejong, P.; Jansen, G.; Anvret, M.; Riley, B.; Williamson, R.; Johnson, K., Detection of an
unstable fragment of DNA specific to individuals with myotonic-dystrophy. Nature 1992,
355 (6360), 547-548.
71. Fu, Y.; Pizzuti, A.; Fenwick, R.; King, J.; Rajnarayan, S.; Dunne, P.; Dubel, J.;
Nasser, G.; Ashizawa, T.; Dejong, P.; Wieringa, B.; Korneluk, R.; Perryman, M.; Epstein,
H.; Caskey, C., An unstable triplet repeat in a gene related to myotonic muscular-
dystrophy. Science 1992, 255 (5049), 1256-1258.
72. Harley, H.; Brook, J.; Rundle, S.; Crow, S.; Reardon, W.; Buckler, A.; Harper, P.;
Housman, D.; Shaw, D., Expansion of an unstable DNA region and phenotypic variation
in myotonic-dystrophy. Nature 1992, 355 (6360), 545-546.
73. Pizzuti, A.; Fu, Y.; Fenwick, R.; Rajanarayan, P.; Perryman, M.; Epstein, H.;
Caskey, C., Identification of an unstable triplet repeat in the myotonic-dystrophy gene, a
protein-kinase gene. Neurology 1992, 42 (7), 1426-1426.
295
74. Groh, W.; Lowe, M.; Zipes, D., Severity of cardiac conduction involvement and
arrhythmias in myotonic dystrophy type 1 correlates with age and CTG repeat length.
Journal of Cardiovascular Electrophysiology 2002, 13 (5), 444-448.
75. Tsilfidis, C.; Mackenzie, A.; Mettler, G.; Barcelo, J.; Korneluk, R., Correlation
between CTG trinucleotide repeat length and frequency of severe congenital myotonic-
dystrophy. Nature Genetics 1992, 1 (3), 192-195.
76. Hunter, A.; Tsilfidis, C.; Mettler, G.; Jacob, P.; Mahadevan, M.; Surh, L.;
Korneluk, R., The correlation of age of onset with CTG Trinucleotide repeat amplification
in myotonic-dystrophy. Journal of Medical Genetics 1992, 29 (11), 774-779.
77. Lavedan, C.; Hofmannradvanyi, H.; Shelbourne, P.; Rabes, J.; Duros, C.; Savoy,
D.; Dehaupas, I.; Luce, S.; Johnson, K.; Junien, C., Myotonic-dystrophy - size-dependent
and sex-dependent dynamics of CTG meiotic instability, and somatic mosaicism.
American Journal of Human Genetics 1993, 52 (5), 875-883.
78. Ricker, K.; Koch, M.; Lehmannhorn, F.; Pongratz, D.; Speich, N.; Reiners, K.;
Schneider, C.; Moxley, R., Proximal myotonic myopathy - clinical-features of a
multisystem disorder similar to myotonic-dystrophy. Archives of Neurology 1995, 52 (1),
25-31.
79. Day, J.; Ricker, K.; Jacobsen, J.; Rasmussen, L.; Dick, K.; Kress, W.; Schneider, C.;
Koch, M.; Beilman, G.; Harrison, A.; Dalton, J.; Ranum, L., Myotonic dystrophy type 2 -
Molecular, diagnostic and clinical spectrum. Neurology 2003, 60 (4), 657-664.
80. Taneja, K.; Mccurrach, M.; Schalling, M.; Housman, D.; Singer, R., Foci of
trinucleotide repeat transcripts in nuclei of myotonic-dystrophy cells and tissues.
Journal of Cell Biology 1995, 128 (6), 995-1002.
81. Taneja, K., Localization of trinucleotide repeat sequences in myotonic dystrophy
cells using a single fluorochrome-labeled PNA probe. Biotechniques 1998, 24 (3), 472-
476.
82. Hsu, R.; Hsiao, K.; Lin, M.; Li, C.; Wang, L.; Chen, L.; Pan, H., Long Tract of
Untranslated CAG Repeats Is Deleterious in Transgenic Mice. PLOS One 2011, 6 (1).

296
83. He, Y.; Vogelstein, B.; Velculescu, V.; Papadopoulos, N.; Kinzler, K., The
Antisense Transcriptomes of Human Cells. Science 2008, 322 (5909), 1855-1857.
84. Zu, T.; Gibbens, B.; Doty, N.; Gomes-Pereira, M.; Huguet, A.; Stone, M.;
Margolis, J.; Peterson, M.; Markowski, T.; Ingram, M.; Nan, Z.; Forster, C.; Low, W.;
Schoser, B.; Somia, N.; Clark, H.; Schmechel, S.; Bitterman, P.; Gourdon, G.; Swanson,
M.; Moseley, M.; Ranum, L., Non-ATG-initiated translation directed by microsatellite
expansions. Proceedings of the National Academy of Sciences of the United States of
America 2011, 108 (1), 260-265.
85. Michalik, A.; Van Broeckhoven, C., Pathogenesis of polyglutamine disorders:
aggregation revisited. Human Molecular Genetics 2003, 12, R173-R186.
86. Oma, Y.; Kino, Y.; Sasagawa, N.; Ishiura, S., Comparative analysis of the
cytotoxicity of. homopolymeric amino acids. Biochimica Et Biophysica Acta-Proteins and
Proteomics 2005, 1748 (2), 174-179.
87. Tian, B.; White, R.; Xia, T.; Welle, S.; Turner, D.; Mathews, M.; Thornton, C.,
Expanded CUG repeat RNAs form hairpins that activate the double-stranded RNA-
dependent protein kinase PKR. RNA-A Publication of the RNA Society 2000, 6 (1), 79-87.
88. Mooers, B.; Logue, J.; Berglund, J., The structural basis of myotonic dystrophy
from the crystal structure of CUG repeats. Proceedings of the National Academy of
Sciences of the United States of America 2005, 102 (46), 16626-16631.
89. Mankodi, A.; Urbinati, C.; Yuan, Q.; Moxley, R.; Sansone, V.; Krym, M.;
Henderson, D.; Schalling, M.; Swanson, M.; Thornton, C., Muscleblind localizes to
nuclear foci of aberrant RNA in myotonic dystrophy types 1 and 2. Human Molecular
Genetics 2001, 10 (19), 2165-2170.
90. Yuan, Y.; Compton, S.; Sobczak, K.; Stenberg, M.; Thornton, C.; Griffith, J.;
Swanson, M., Muscleblind-like 1 interacts with RNA hairpins in splicing target and
pathogenic RNAs. Nucleic Acids Research 2007, 35 (16), 5474-5486.
91. Junghans, R. P., Dystrophia myotonia: why focus on foci? European Journal of
Human Genetics 2009, 17 (5), 543-53.

297
92. Michalowski, S.; Miller, J.; Urbinati, C.; Paliouras, M.; Swanson, M.; Griffith, J.,
Visualization of double-stranded RNAs from the myotonic dystrophy protein kinase
gene and interactions with CUG-binding protein. Nucleic Acids Research 1999, 27 (17),
3534-3542.
93. Timchenko, N.; Cai, Z.; Welm, A.; Reddy, S.; Ashizawa, T.; Timchenko, L., RNA
CUG repeats sequester CUGBP1 and alter protein levels and activity of CUGBP1. Journal
of Biological Chemistry 2001, 276 (11), 7820-7826.
94. (a) Kuyumcu-Martinez, N. M.; Wang, G. S.; Cooper, T. A., Increased steady-state
levels of CUGBP1 in myotonic dystrophy 1 are due to PKC-mediated
hyperphosphorylation. Mol Cell 2007, 28 (1), 68-78; (b) Wang, G.; Kuyumcu-Martinez,
M.; Sarma, S.; Mathur, N.; Wehrens, X.; Cooper, T., PKC inhibition ameliorates the
cardiac phenotype in a mouse model of myotonic dystrophy type 1. Journal of Clinical
Investigation 2009, 119 (12), 3797-3806.
95. Wheeler, T., Myotonic dystrophy: Therapeutic strategies for the future.
Neurotherapeutics 2008, 5 (4), 592-600.
96. Wheeler, T.; Sobczak, K.; Lueck, J.; Osborne, R.; Lin, X.; Dirksen, R.; Thornton, C.,
Reversal of Myotonia and Splicing Defects by Antisense Oligomers in a Transgenic
Mouse Model of Myotonic Dystrophy Type 1 (DM1). Neurology 2009, 72 (11), A489-
A490.
97. Magana, J.; Cisneros, B., Perspectives on Gene Therapy in Myotonic Dystrophy
Type 1. Journal of Neuroscience Research 2011, 89 (3), 275-285.
98. Teplova, M.; Patel, D., Structural insights into RNA recognition by the
alternative-splicing regulator muscleblind-like MBNL1. Nature Structural & Molecular
Biology 2008, 15 (12), 1343-1351.
99. Fu, Y.; Ramisetty, S.; Hussain, N.; Baranger, A., MBNL1-RNA Recognition:
Contributions of MBNL1 Sequence and RNA Conformation. Chembiochem 2012, 13 (1),
112-119.

298
100. Goers, E.; Purcell, J.; Voelker, R.; Gates, D.; Berglund, J., MBNL1 binds GC motifs
embedded in pyrimidines to regulate alternative splicing. Nucleic Acids Research 2010,
38 (7), 2467-2484.
101. Kino, Y.; Mori, D.; Oma, Y.; Takeshita, Y.; Sasagawa, N.; Ishiura, S., Muscleblind
protein, MBNL1/EXP, binds specifically to CHHG repeats. Human Molecular Genetics
2004, 13 (5), 495-507.
102. Masuda, A.; Andersen, H.; Doktor, T.; Okamoto, T.; Ito, M.; Andresen, B.; Ohno,
K., CUGBP1 and MBNL1 preferentially bind to 3 ' UTRs and facilitate mRNA decay.
Scientific Reports 2012, 2.
103. Cosson, B.; Gautier-Courteille, C.; Maniey, D.; Ait-Ahmed, O.; Lesimple, M.;
Osborne, H.; Paillard, L., Oligomerization of EDEN-BP is required for specific mRNA
deadenylation and binding. Biology of the Cell 2006, 98 (11), 653-665.
104. Roberts, R.; Timchenko, N.; Miller, J.; Reddy, S.; Swanson, M.; Timchenko, L.,
Results of knockout mouse suggest impaired phosphorylation of triplet CUG binding
protein pivotal to pathogenesis of cardiac and skeletal muscle dysfunction. Journal of
the American College of Cardiology 1998, 31 (2), 422A-422A.
105. Kuyumcu-Martinez, N.; Wang, G.; Cooper, T., Increased steady-state in levels of
CUGBP1 in myotonic dystrophy 1 are due to PKC-mediated hyperphosphorylation.
Molecular Cell 2007, 28 (1), 68-78.
106. Timchenko, L.; Salisbury, E.; Wang, G.; Nguyen, H.; Albrecht, J.; Hershey, J.;
Timchenko, N., Age-specific CUGBP1-eIF2 complex increases translation of
CCAAT/enhancer-binding protein beta in old liver. Journal of Biological Chemistry 2006,
281 (43), 32806-32819.
107. Welm, A.; Mackey, S.; Timchenko, L.; Darlington, G.; Timchenko, N.,
Translational induction of liver-enriched transcriptional inhibitory protein during acute
phase response leads to repression of CCAAT/enhancer binding protein alpha mRNA.
Journal of Biological Chemistry 2000, 275 (35), 27406-27413.
108. Timchenko, N.; Wang, G.; Timchenko, L., RNA CUG-binding protein 1 increases
translation of 20-kDa isoform of CCAAT/enhancer-binding protein beta by interacting
299
with the alpha and beta subunits of eukaryotic initiation translation factor 2. Journal of
Biological Chemistry 2005, 280 (21), 20549-20557.
109. Salisbury, E.; Sakai, K.; Schoser, B.; Huichalaf, C.; Schneider-Gold, C.; Nguyen, H.;
Wang, G.; Albrecht, J.; Timchenko, L., Ectopic expression of cyclin D3 corrects
differentiation of DM1 myoblasts through activation of RNA CUG-binding protein,
CUGBP1. Experimental Cell Research 2008, 314 (11-12), 2266-2278.
110. Nilsson, P.; Virtanen, A., Expression and purification of recombinant poly (A)-
specific ribonuclease (PARN). International Journal of Biological Macromolecules 2006,
39 (1-3), 95-99.
111. Wu, M.; Nilsson, P.; Henriksson, N.; Niedzwiecka, A.; Lim, M.; Cheng, Z.;
Kokkoris, K.; Virtanen, A.; Song, H., Structural Basis of m(7)GpppG Binding to Poly(A)-
Specific Ribonuclease. Structure 2009, 17 (2), 276-286.
112. Nagata, T.; Suzuki, S.; Endo, R.; Shirouzu, M.; Terada, T.; Inoue, M.; Kigawa, T.;
Kobayashi, N.; Guntert, P.; Tanaka, A.; Hayashizaki, Y.; Muto, Y.; Yokoyama, S., The RRM
domain of poly(A)-specific ribonuclease has a noncanonical binding site for mRNA cap
analog recognition. Nucleic Acids Research 2008, 36 (14), 4754-4767.
113. Bertini, I.; Luchinat, C.; Parigi, G., Moving the frontiers in solution and solid-
state bioNMR. Coordination Chemistry Reviews 2011, 255 (7-8), 649-663.
114. Banci, L.; Bertini, I.; Luchinat, C.; Mori, M., NMR in structural proteomics and
beyond. Progress in Nuclear Magnetic Resonance Spectroscopy 2010, 56 (3), 247-266.
115. Tzakos, A.; Grace, C.; Lukavsky, P.; Riek, R., NMR techniques for very large
proteins and RNAs in solution. Annual Review of Biophysics and Biomolecular Structure
2006, 35, 319-342.
116. Riek, R.; Fiaux, J.; Bertelsen, E.; Horwich, A.; Wuthrich, K., Solution NMR
techniques for large molecular and supramolecular structures. Journal of the American
Chemical Society 2002, 124 (41), 12144-12153.
117. Fiaux, J.; Bertelsen, E.; Horwich, A.; Wuthrich, K., NMR analysis of a 900K GroEL-
GroES complex. Nature 2002, 418 (6894), 207-211.
300
118. Tugarinov, V.; Muhandiram, R.; Ayed, A.; Kay, L., Four-dimensional NMR
spectroscopy of a 723-residue protein: Chemical shift assignments and secondary
structure of malate synthase G. Journal of the American Chemical Society 2002, 124
(34), 10025-10035.
119. Cavanagh, J., Protein NMR Spectroscopy - Principles and Practice. 2006.
120. Pervushin, K., Impact of Transverse Relaxation Optimized Spectroscopy (TROSY)
on NMR as a technique in structural biology. Quarterly Reviews of Biophysics 2000, 33
(2), 161-197.
121. Pervushin, K.; Riek, R.; Wider, G.; Wuthrich, K., Attenuated T-2 relaxation by
mutual cancellation of dipole-dipole coupling and chemical shift anisotropy indicates an
avenue to NMR structures of very large biological macromolecules in solution.
Proceedings of the National Academy of Sciences of the United States of America 1997,
94 (23), 12366-12371.
122. Weigelt, J., Single scan, sensitivity- and gradient-enhanced TROSY for
multidimensional NMR experiments. Journal of the American Chemical Society 1998,
120 (41), 10778-10779.
123. Riek, R.; Pervushin, K.; Wuthrich, K., TROSY and CRINEPT: NMR with large
molecular and supramolecular structures in solution. Trends in Biochemical Sciences
2000, 25 (10), 462-468.
124. Wuthrich, K., NMR of Proteins and Nucleic Acids. 1986.
125. Marion, D.; Driscoll, P.; Kay, L.; Wingfield, P.; Bax, A.; Gronenborn, A.; Clore, G.,
Overcoming the overlap problem in the assignment of H-1-NMR Spectra of larger
proteins by use of 3-dimensional heteronuclear H-1-N-15 Hartmann-Hahn multiple
quantum coherence and nuclear overhauser multiple quantum coherence spectroscopy
- application to interleukin-1-beta. Biochemistry 1989, 28 (15), 6150-6156.
126. (a) Marion, D.; Kay, L.; Sparks, S.; Torchia, D.; Bax, A., 3-dimensional
heteronuclear NMR of N-15-labeled proteins. Journal of the American Chemical Society
1989, 111 (4), 1515-1517; (b) Wijmenga, S.; Hallenga, K.; Hilbers, C., A 3-dimensional

301
heteronuclear multiple-quantum coherence homonuclear Hartmann-Hahn experiment.
Journal of Magnetic Resonance 1989, 84 (3), 634-642.
127. Sattler, M.; Schleucher, J.; Griesinger, C., Heteronuclear multidimensional NMR
experiments for the structure determination of proteins in solution employing pulsed
field gradients. Progress in Nuclear Magnetic Resonance Spectroscopy 1999, 34 (2), 93-
158.
128. Wagner, G.; Thanabal, V.; Stockman, B.; Peng, J.; Nirmala, N.; Hyberts, S.;
Goldberg, M.; Detlefsen, D.; Clubb, R.; Adler, M., NMR-studies of structure and
dynamics of isotope enriched proteins. Biopolymers 1992, 32 (4), 381-390.
129. Wittekind, M.; Mueller, L., HNCACB, a high-sensitivity 3D NMR experiment to
correlate amide-proton and nitrogen resonances with the alpha-carbon and beta-
carbon resonances in proteins. Journal of Magnetic Resonance Series B 1993, 101 (2),
201-205.
130. Kay, L.; Ikura, M.; Tschudin, R.; Bax, A., 3-dimensional triple-resonance NMR-
spectroscopy of isotopically enriched proteins. Journal of Magnetic Resonance 1990, 89
(3), 496-514.
131. Salzmann, M.; Pervushin, K.; Wider, G.; Senn, H.; Wuthrich, K., [C-13]-constant-
time [N-15,H-1]-TROSY-HNCA for sequential assignments of large proteins. Journal of
Biomolecular NMR 1999, 14 (1), 85-88.
132. Clubb, R.; Thanabal, V.; Wagner, G., A constant-time 3-dimensional triple-
resonance pulse scheme to correlate intraresidue H-1(N), N-15, and C-13(') chemical-
shifts in N-15-C-13-labeled proteins. Journal of Magnetic Resonance 1992, 97 (1), 213-
217.
133. Grzesiek, S.; Bax, A., Improved 3D Triple-resonance NMR Techniques applied to
a 31-kDa protein. Journal of Magnetic Resonance 1992, 96 (2), 432-440.
134. Loria, J.; Rance, M.; Palmer, A., Transverse-relaxation-optimized (TROSY)
gradient-enhanced triple-resonance NMR spectroscopy. Journal of Magnetic Resonance
1999, 141 (1), 180-184.
302
135. Salzmann, M.; Wider, G.; Pervushin, K.; Senn, H.; Wuthrich, K., TROSY-type
triple-resonance experiments for sequential NMR assignments of large proteins. Journal
of the American Chemical Society 1999, 121 (4), 844-848.
136. Grzesiek, S.; Bax, A., An efficient experiment for sequential backbone
assignment of medium-sized isotopically enriched proteins. Journal of Magnetic
Resonance 1992, 99 (1), 201-207.
137. Vranken, W.; Boucher, W.; Stevens, T.; Fogh, R.; Pajon, A.; Llinas, P.; Ulrich, E.;
Markley, J.; Ionides, J.; Laue, E., The CCPN data model for NMR spectroscopy:
Development of a software pipeline. Proteins-Structure Function and Bioinformatics
2005, 59 (4), 687-696.
138. Kay, L.; Xu, G.; Singer, A.; Muhandiram, D.; Formankay, J., A gradient-enhanced
HCCH TOCSY experiment for recording side-chain H-1 and C-13 correlations in H2O
samples of proteins. Journal of Magnetic Resonance Series B 1993, 101 (3), 333-337.
139. Shuker, S.; Hajduk, P.; Meadows, R.; Fesik, S., Discovering high-affinity ligands
for proteins: SAR by NMR. Science 1996, 274 (5292), 1531-1534.
140. Doyle, M., Characterization of binding interactions by isothermal titration
calorimetry. Current Opinion in Biotechnology 1997, 8 (1), 31-35.
141. Velaquez-Campoy, A.; Leavitt, S. A.; Freire, E., Characterization of protein-
protein interactions by isothermal titration calorimetry. Methods in molecular biology:
2004; Vol. 261, pp 35-54.
142. Feig, A., Studying RNA-RNA and RNA-protein interactions by isothermal titration
calorimetry. Methods in Enzymology, Vol 468: Biophysical, Chemical, and Functional
Probes of RNA Structure, Interactions and Folding, Pt a 2009, 468, 409-422.
143. Salim, N.; Feig, A., Isothermal titration calorimetry of RNA. Methods 2009, 47
(3), 198-205.
144. Freyer, M.; Lewis, E.; Correia, J.; Detrich, H., Isothermal titration calorimetry:
Experimental design, data analysis, and probing Macromolecule/Ligand binding and

303
kinetic interactions. Biophysical Tools For Biologists: Vol 1 in Vitro Techniques 2008, 84,
79-113.
145. Ladbury, J.; Chowdhry, B., Sensing the heat: The application of isothermal
titration calorimetry to thermodynamic studies of biomolecular interactions. Chemistry
& Biology 1996, 3 (10), 791-801.
146. Falconer, R.; Penkova, A.; Jelesarov, I.; Collins, B., Survey of the year 2008:
applications of isothermal titration calorimetry. Journal of Molecular Recognition 2010,
23 (5), 395-413.
147. Turnbull, W.; Daranas, A., On the value of c: Can low affinity systems be studied
by isothermal titration calorimetry? Journal of the American Chemical Society 2003, 125
(48), 14859-14866.
148. Cliff, M.; Gutierrez, A.; Ladbury, J., A survey of the year 2003 literature on
applications of isothermal titration calorimetry. Journal of Molecular Recognition 2004,
17 (6), 513-523.
149. Feigin, L. A.; Svergun, D. I., Structure analysis by small-angle X-ray and neutron
scattering. 1987; p 335.
150. Mertens, H.; Svergun, D., Structural characterization of proteins and complexes
using small-angle X-ray solution scattering. Journal of Structural Biology 2010, 172 (1),
128-141.
151. Doniach, S., Changes in biomolecular conformation seen by small angle X-ray
scattering. Chemical Reviews 2001, 101 (6), 1763-1778.
152. Bernado, P.; Svergun, D., Structural analysis of intrinsically disordered proteins
by small-angle X-ray scattering. Molecular BioSystems: 2011; Vol. 8, pp 151-167.
153. Koch, M.; Vachette, P.; Svergun, D., Small-angle scattering: a view on the
properties, structures and structural changes of biological macromolecules in solution.
Quarterly Reviews of Biophysics 2003, 36 (2), 147-227.
154. Aebersold, R.; Mann, M., Mass spectrometry-based proteomics. Nature 2003,
422 (6928), 198-207.

304
155. Fenn, J.; Mann, M.; Meng, C.; Wong, S.; Whitehouse, C., Electrospray ionization-
principles and practice. Mass Spectrometry Reviews 1990, 9 (1), 37-70.
156. Fenn, J.; Mann, M.; Meng, C.; Wong, S.; Whitehouse, C., Electrospray ionization
for mass-spectrometry of large biomolecules. Science 1989, 246 (4926), 64-71.
157. Yamashita, M.; Fenn, J., Electrospray ion-source - another variation on the free-
jet theme. Journal of Physical Chemistry 1984, 88 (20), 4451-4459.
158. Eyles, S.; Kaltashov, I., Methods to study protein dynamics and folding by mass
spectrometry. Methods 2004, 34 (1), 88-99.
159. Kaltashov, I.; Mohimen, A., Estimates of protein surface areas in solution by
electrospray ionization mass spectrometry. Analytical Chemistry 2005, 77 (16), 5370-
5379.
160. Van Berkel, W.; Van Den Heuvel, R.; Versluis, C.; Heck, A., Detection of intact
megaDalton protein assemblies of vanillyl-alcohol oxidase by mass spectrometry.
Protein Science 2000, 9 (3), 435-439.
161. Yin, S.; Xie, Y.; Loo, J., Mass spectrometry of protein-ligand complexes:
Enhanced gas-phase stability of ribonuclease-nucleotide complexes. Journal of the
American Society For Mass Spectrometry 2008, 19 (8), 1199-1208.
162. Hossain, B.; Simmons, D.; Konermann, L., Do electrospray mass spectra reflect
the ligand binding state of proteins in solution? Canadian Journal of Chemistry-Revue
Canadienne De Chimie 2005, 83 (11), 1953-1960.
163. Studier, F.; Moffatt, B., Use of bacteriophage-T7 RNA-polymerase to direct
selective high-level expression of cloned genes. Journal of Molecular Biology 1986, 189
(1), 113-130.
164. Rosenberg, A.; Lade, B.; Chui, D.; Lin, S.; Dunn, J.; Studier, F., Vectors for
selective expression of cloned DNAs by T7 RNA-polymerase. Gene 1987, 56 (1), 125-135.
165. Studier, F.; Rosenberg, A.; Dunn, J.; Dubendorff, J., Use of T7 RNA-polymerase
to direct expression of cloned genes. Methods in Enzymology 1990, 185, 60-89.

305
166. Qi, D.; Scholthof, K., A one-step PCR-based method for rapid and efficient site-
directed fragment deletion, insertion, and substitution mutagenesis. Journal of
Virological Methods 2008, 149 (1), 85-90.
167. Liu, H.; Naismith, J., An efficient one-step site-directed deletion, insertion, single
and multiple-site plasmid mutagenesis protocol. BMC Biotechnology 2008, 8.
168. Sanger, F.; Nicklen, S.; Coulson, A., DNA sequencing with chain-terminating
inhibitors. Proceedings of the National Academy of Sciences of the United States of
America 1977, 74 (12), 5463-5467.
169. Hwang, T.; Shaka, A., Water suppression that works - excitation sculpting using
arbitrary wave-forms and pulsed-field gradients. Journal of Magnetic Resonance Series
A 1995, 112 (2), 275-279.
170. Piotto, M.; Saudek, V.; Sklenar, V., gradient-tailored excitation for single-
quantum NMR-spectroscopy of aqueous-solutions. Journal of Biomolecular NMR 1992,
2 (6), 661-665.
171. Liang, B.; Bushweller, J.; Tamm, L., Site-directed parallel spin-labeling and
paramagnetic relaxation enhancement in structure determination of membrane
proteins by solution NMR spectroscopy. Journal of the American Chemical Society 2006,
128 (13), 4389-4397.
172. Deschamps, M.; Pilka, E.; Potts, J.; Campbell, I.; Boyd, J., Probing protein-
peptide binding surfaces using charged stable free radicals and transverse paramagnetic
relaxation enhancement (PRE). Journal of Biomolecular NMR 2005, 31 (2), 155-160.
173. Deka, P.; Rajan, P.; Perez-Canadillas, J.; Varani, G., Protein and RNA dynamics
play key roles in determining the specific recognition of GU-rich polyadenylation
regulatory elements by human Cstf-64 protein. Journal of Molecular Biology 2005, 347
(4), 719-733.
174. Oberstrass, F.; Auweter, S.; Erat, M.; Hargous, Y.; Henning, A.; Wenter, P.;
Reymond, L.; Amir-Ahmady, B.; Pitsch, S.; Black, D.; Allain, F., Structure of PTB bound to
RNA: Specific binding and implications for splicing regulation. Science 2005, 309 (5743),
2054-2057.
306
175. Tsuda, K.; Someya, T.; Kuwasako, K.; Takahashi, M.; He, F.; Unzai, S.; Inoue, M.;
Harada, T.; Watanabe, S.; Terada, T.; Kobayashi, N.; Shirouzu, M.; Kigawa, T.; Tanaka, A.;
Sugano, S.; Guntert, P.; Yokoyama, S.; Muto, Y., Structural basis for the dual RNA-
recognition modes of human Tra2-beta RRM. Nucleic Acids Research 2011, 39 (4), 1538-
1553.
176. Netter, C.; Weber, G.; Benecke, H.; Wahl, M., Functional stabilization of an RNA
recognition motif by a noncanonical N-terminal expansion. RNA-A Publication of the
RNA Society 2009, 15 (7), 1305-1313.
177. Clery, A.; Jayne, S.; Benderska, N.; Dominguez, C.; Stamm, S.; Allain, F.,
Molecular basis of purine-rich RNA recognition by the human SR-like protein Tra2-beta
1. Nature Structural & Molecular Biology 2011, 18 (4), 443-U78.
178. Kleckner, I.; Foster, M., An introduction to NMR-based approaches for
measuring protein dynamics. Biochimica Et Biophysica Acta-Proteins and Proteomics
2011, 1814 (8), 942-968.
179. Zuker, M., Mfold web server for nucleic acid folding and hybridization
prediction. Nucleic Acids Research 2003, 31 (13), 3406-3415.
180. Clore, G.; Driscoll, P.; Wingfield, P.; Gronenborn, A., Analysis of the backbone
dynamics of interleukin-1-beta using 2-dimensional inverse detected heteronuclear N-
15-H-1 NMR-spectroscopy. Biochemistry 1990, 29 (32), 7387-7401.
181. Kay, L.; Torchia, D.; Bax, A., Backbone dynamics of proteins as studied by N-15
inverse detected heteronuclear NMR-spectroscopy - application to Staphylococcal
nuclease. Biochemistry 1989, 28 (23), 8972-8979.
182. Grasberger, B.; Gronenborn, A.; Clore, G., Analysis of the backbone dynamics of
interleukin-8 by N-15 relaxation measurements. Journal of Molecular Biology 1993, 230
(2), 364-372.
183. Mantylahti, S.; Aitio, O.; Hellman, M.; Permi, P., HA-detected experiments for
the backbone assignment of intrinsically disordered proteins. Journal of Biomolecular
NMR 2010, 47 (3), 171-181.

307
184. Wen, J.; Wu, J.; Zhou, P., Sparsely sampled high-resolution 4-D experiments for
efficient backbone resonance assignment of disordered proteins. Journal of Magnetic
Resonance 2011, 209 (1), 94-100.
185. Mantylahti, S.; Hellman, M.; Permi, P., Extension of the HA-detection based
approach: (HCA)CON(CA)H and (HCA)NCO(CA)H experiments for the main-chain
assignment of intrinsically disordered proteins. Journal of Biomolecular NMR 2011, 49
(2), 99-109.
186. Novacek, J.; Zawadzka-Kazimierczuk, A.; Papouskova, V.; Zidek, L.; Sanderova,
H.; Krasny, L.; Kozminski, W.; Sklenar, V., 5D C-13-detected experiments for backbone
assignment of unstructured proteins with a very low signal dispersion. Journal of
Biomolecular NMR 2011, 50 (1), 1-11.
187. Teplova, M.; Song, J.; Gaw, H. Y.; Teplov, A.; Patel, D. J., Structural insights into
RNA recognition by the alternate-splicing regulator CUG-binding protein 1. Structure
2010, 18 (10), 1364-77.
188. Su, X.; Jergic, S.; Ozawa, K.; Burns, N.; Dixon, N.; Otting, G., Measurement of
dissociation constants of high-molecular weight protein-protein complexes by
transferred N-15-relaxation. Journal of Biomolecular NMR 2007, 38 (1), 65-72.
189. Ryabov, Y.; Geraghty, C.; Varshney, A.; Fushman, D., An efficient computational
method for predicting rotational diffusion tensors of globular proteins using an ellipsoid
representation. Journal of the American Chemical Society 2006, 128 (48), 15432-15444.
190. Paillard, L.; Legagneux, V.; Maniey, D.; Osborne, H., c-Jun ARE targets mRNA
deadenylation by an EDEN-BP (embryo deadenylation element-binding protein)-
dependent pathway. Journal of Biological Chemistry 2002, 277 (5), 3232-3235.
191. Sickmier, E.; Frato, K.; Shen, H.; Paranawithana, S.; Green, M.; Kielkopf, C.,
Structural basis for polypyrimidine tract recognition by the essential pre-mRNA splicing
factor U2AF65. Molecular Cell 2006, 23 (1), 49-59.
192. Mackereth, C.; Madl, T.; Bonnal, S.; Simon, B.; Zanier, K.; Gasch, A.; Rybin, V.;
Valcarcel, J.; Sattler, M., Multi-domain conformational selection underlies pre-mRNA
splicing regulation by U2AF. Nature 2011, 475 (7356), 408-U174.

308
193. Muto, Y.; Yokoyama, S., Structural insight into RNA recognition motifs: versatile
molecular Lego building blocks for biological systems. Wiley Interdisciplinary Reviews-
RNA 2012, 3 (2), 229-246.
194. Deo, R.; Bonanno, J.; Sonenberg, N.; Burley, S., Recognition of polyadenylate
RNA by the poly(A)-binding protein. Cell 1999, 98 (6), 835-845.
195. Keizers, P.; Ubbink, M., Paramagnetic tagging for protein structure and
dynamics analysis. Progress in Nuclear Magnetic Resonance Spectroscopy 2011, 58 (1-
2), 88-96.
196. Beattie, J.; Fensom, D.; Freeman, H.; Woodcock, E.; Hill, H.; Stokes, A., NMR
investigation of electron-transfer in copper-protein, plastocyanin. Biochimica Et
Biophysica Acta 1975, 405 (1), 109-114.
197. Lee, L.; Sykes, B.; Birnbaum, E., Determination of the relative compactness of
the Ca2+-binding sites of a Ca2+-binding fragment of troponin-c and parvalbumin using
lanthanide-induced H-1 NMR shifts. FEBS Letters 1979, 98 (1), 169-172.
198. Griffith, O.; McConnel, H., A nitroxide-maleimide spin label. Proceedings of the
National Academy of Sciences of the United States of America 1966, 55 (1), 8-&.
199. Anglister, J.; Frey, T.; McConnell, H., NMR technique for assessing contributions
of heavy and light-chains to an antibody combining site. Nature 1985, 315 (6014), 65-
67.
200. Lee, Y.; Currie, B.; Johnson, M., Interaction of a spin-labeled phenylalanine
analog with normal and sickle hemoglobins - detection of site-specific interactions
through spin-label-induced H-1-NMR relaxation. Biochemistry 1986, 25 (19), 5647-5654.
201. Cutting, B.; Strauss, A.; Fendrich, G.; Manley, P.; Jahnke, W., NMR resonance
assignment of selectively labeled proteins by the use of paramagnetic ligands. Journal of
Biomolecular NMR 2004, 30 (2), 205-210.
202. Folkers, P.; Vanduynhoven, J.; Vanlieshout, H.; Harmsen, B.; Vanboom, J.;
Tesser, G.; Konings, R.; Hilbers, C., Exploring the DNA-binding domain of gene-V protein

309
encoded by bacteriophage M13 with the aid of spin-labeled oligonucleotides in
combination with H-1-NMR. Biochemistry 1993, 32 (36), 9407-9416.
203. Cai, S.; Zhu, L.; Zhang, Z.; Chen, Y., Determination of the three-dimensional
structure of the Mrf2-DNA complex using paramagnetic spin labeling. Biochemistry
2007, 46 (17), 4943-4950.
204. Jin, J.; Wang, G.; Salisbury, E.; Timchenko, L.; Timchenko, N., GSK3 beta-cyclin
D3-CUGBP1-eIF2 pathway in aging and in myotonic dystrophy. Cell Cycle 2009, 8 (15),
2356-2359.
205. Maciejewski, P.; Peterson, F.; Anderson, P.; Brooks, C., Mutation of serine-90 to
glutamic-acid mimics phosphorylation of bovine prolactin. Journal of Biological
Chemistry 1995, 270 (46), 27661-27665.
206. Leger, J.; Kempf, M.; Lee, G.; Brandt, R., Conversion of serine to aspartate
imitates phosphorylation-induced changes in the structure and function of microtubule-
associated protein tau. Journal of Biological Chemistry 1997, 272 (13), 8441-8446.
207. Korner, C.; Wahle, E., Poly(A) tail shortening by a mammalian poly(A)-specific 3'-
exoribonuclease. Journal of Biological Chemistry 1997, 272 (16), 10448-10456.
208. Korner, C.; Wormington, M.; Muckenthaler, M.; Schneider, S.; Dehlin, E.; Wahle,
E., The deadenylating nuclease (DAN) is involved in poly(A) tail removal during the
meiotic maturation of Xenopus oocytes. EMBO Journal 1998, 17 (18), 5427-5437.
209. Copeland, P.; Wormington, M., The mechanism and regulation of
deadenylation: Identification and characterization of Xenopus PARN. RNA-A Publication
of the RNA Society 2001, 7 (6), 875-886.
210. Wu, M.; Reuter, M.; Lilie, H.; Liu, Y.; Wahle, E.; Song, H., Structural insight into
poly(A) binding and catalytic mechanism of human PARN. EMBO Journal 2005, 24 (23),
4082-4093.
211. Martinez, J.; Ren, Y.; Thuresson, A.; Hellmann, U.; Astrom, J.; Virtanen, A., A 54-
kDa fragment of the poly(A)-specific ribonuclease is an oligomeric, processive, and cap-

310
interacting poly(A)-specific 3 ' exonuclease. Journal of Biological Chemistry 2000, 275
(31), 24222-24230.
212. Niedzwiecka, A.; Lekka, M.; Nilsson, P.; Virtanen, A., Global architecture of
human poly(A)-specific ribonuclease by atomic force microscopy in liquid and dynamic
light scattering. Biophysical Chemistry 2011, 158 (2-3), 141-149.
213. Henriksson, N.; Nilsson, P.; Wu, M.; Song, H.; Virtanen, A., Recognition of
Adenosine Residues by the Active Site of Poly(A)-specific Ribonuclease. Journal of
Biological Chemistry 2010, 285 (1), 163-170.
214. Nilsson, P.; Henriksson, N.; Niedzwiecka, A.; Balatsos, N.; Kokkoris, K.; Eriksson,
J.; Virtanen, A., A multifunctional RNA recognition motif in poly(A)-specific ribonuclease
with cap and poly(A) binding properties. Journal of Biological Chemistry 2007, 282 (45),
32902-32911.
215. Henriksson, N.; Nilsson, P.; Mousheng, W.; Song, H.; Virtanen, A., Poly(A)-
specific ribonuclease (PARN): Molecular mechanisms of mRNA cap and poly(A) tail
recognition. FEBS Journal 2010, 277, 194-194.
216. Liu, W.; Zhang, A.; He, G.; Yan, Y., The R3H domain stabilizes poly(A)-specific
ribonuclease by stabilizing the RRM domain. Biochemical and Biophysical Research
Communications 2007, 360 (4), 846-851.
217. Ren, Y.; Kirsebom, L.; Virtanen, A., Coordination of divalent metal ions in the
active site of poly(A)-specific ribonuclease. Journal of Biological Chemistry 2004, 279
(47), 48702-48706.
218. Selenko, P.; Gregorovic, G.; Sprangers, R.; Stier, G.; Rhani, Z.; Kramer, A.; Sattler,
M., Structural basis for the molecular recognition between human splicing factors
U2AF(65) and SF1/mBBP. Molecular Cell 2003, 11 (4), 965-976.
219. Kielkopf, C.; Rodionova, N.; Green, M.; Burley, S., A novel peptide recognition
mode revealed by the X-ray structure of a core U2AF-(35)/U2AF(65) heterodimer. Cell
2001, 106 (5), 595-605.

311
220. Elantak, L.; Wagner, S.; Herrmannova, A.; Karaskova, M.; Rutkai, E.; Lukavsky, P.;
Valasek, L., The Indispensable N-Terminal Half of eIF3j/HCR1 Cooperates with its
Structurally Conserved Binding Partner eIF3b/PRT1-RRM and with eIF1A in Stringent
AUG Selection. Journal of Molecular Biology 2010, 396 (4), 1097-1116.
221. Rideau, A.; Gooding, C.; Simpson, P.; Monie, T.; Lorenz, M.; Huttelmaier, S.;
Singer, R.; Matthews, S.; Curry, S.; Smith, C., A peptide motif in Raver1 mediates splicing
repression by interaction with the PTB RRM2 domain. Nature Structural & Molecular
Biology 2006, 13 (9), 839-848.
222. Fribourg, S.; Gatfield, D.; Izaurralde, E.; Conti, E., A novel mode of RBD-protein
recognition in the Y14-Mago complex. Nature Structural Biology 2003, 10 (6), 433-439.
223. Kadlec, J.; Izaurralde, E.; Cusack, S., The structural basis for the interaction
between nonsense-mediated mRNA decay factors UPF2 and UPF3. Nature Structural &
Molecular Biology 2004, 11 (4), 330-337.
224. Wang, Z.; Song, J.; Milne, T.; Wang, G.; Li, H.; Allis, C.; Patel, D., Pro
Isomerization in MLL1 PHD3-Bromo Cassette Connects H3K4me Readout to CyP33 and
HDAC-Mediated Repression. Cell 2010, 141 (7), 1183-U151.
225. Zhu, Y.; Chen, G.; Lv, F.; Wang, X.; Ji, X.; Xu, Y.; Sun, J.; Wu, L.; Zheng, Y.; Gao, G.,
Zinc-finger antiviral protein inhibits HIV-1 infection by selectively targeting multiply
spliced viral mRNAs for degradation. Proceedings of the National Academy of Sciences
of the United States of America 2011, 108 (38), 15834-15839.

312
11 Appendix
11.1 Primers
Construct Primer Sequence
RRM1 GCC GAC AGT GAA AAG TAA AAT GCT GTG GAA G
C TTC CAC AGC ATT TTA CTT TTC ACT GTC GGC
RRM2 CGTT GCT AGC ATG CGA AAG CTA TTT ATC GGA ATG G
CGTT AAG CTT TCA GTC TGC GAA CTT TAC CAC TAT TGG
RRM3 GA CAA AAG*GCT AGC CAT ATG GCT GCC GCG
CAT ATG GCT AGC*CTT TTG TCA CAA CAG GGT TTG
RRM123 G TGA CAA AAG*CCA CAT TGA GGC TGC ATT GAG CTG
C TCA ATG TGG*CTT TTG TCA CAA CAG GGT TTG GGG GC
S28D GGT CAG GTT CCT CGA AGC TGG GAC GAG AAA GAG CTA
AG
CT TAG CTC TTT CTC GTC CCA GCT TCG AGG AAC CTG
ACC
RRM23 C ATT ATT*GCT AGC CAT ATG GCT GCC GCG
CAT ATG GCT AGC*AAT AAT GCT GTG GAA GAC CGA AAG
* - Indicates position of the deletion site in the primers used for one-step deletion
methods.

313
11.2 NMR Assignments
11.2.1 RRM1 Wild Type Assignment
Number Residue
HN Chemical
Shift NH Chemical Shift
1 Met1 - -
2 Asn2 8.27 119.89
3 Gly3 8.22 110.02
4 Thr4 7.90 114.20
5 Met5 8.24 122.68
6 Asp6 8.08 122.02
7 His7 7.67 116.12
8 Pro8 - -
9 Asp9 8.51 120.30
10 His10 7.83 118.35
11 Pro11 - -
12 Asp12 - -
13 Pro13 - -
14 Asp14 7.97 114.98
15 Ser15 7.34 114.46
16 Ile16 7.83 121.89
17 Lys17 8.59 129.52
18 Met18 8.67 127.86
19 Phe19 9.60 125.36
20 Val20 8.19 129.28
21 Gly21 9.06 112.78
22 Gln22 8.07 110.05
23 Val23 7.09 115.91
24 Pro24 - -
25 Arg25 9.02 123.39
26 Ser26 7.63 109.29
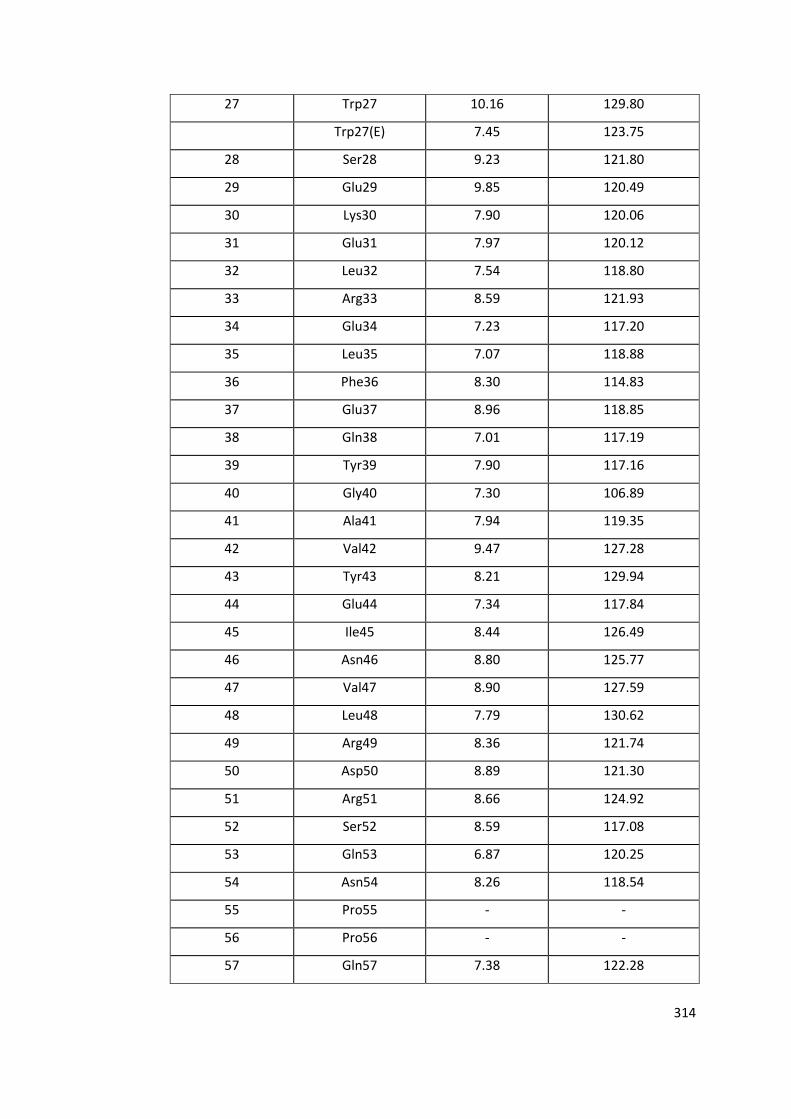
314
27 Trp27 10.16 129.80
Trp27(E) 7.45 123.75
28 Ser28 9.23 121.80
29 Glu29 9.85 120.49
30 Lys30 7.90 120.06
31 Glu31 7.97 120.12
32 Leu32 7.54 118.80
33 Arg33 8.59 121.93
34 Glu34 7.23 117.20
35 Leu35 7.07 118.88
36 Phe36 8.30 114.83
37 Glu37 8.96 118.85
38 Gln38 7.01 117.19
39 Tyr39 7.90 117.16
40 Gly40 7.30 106.89
41 Ala41 7.94 119.35
42 Val42 9.47 127.28
43 Tyr43 8.21 129.94
44 Glu44 7.34 117.84
45 Ile45 8.44 126.49
46 Asn46 8.80 125.77
47 Val47 8.90 127.59
48 Leu48 7.79 130.62
49 Arg49 8.36 121.74
50 Asp50 8.89 121.30
51 Arg51 8.66 124.92
52 Ser52 8.59 117.08
53 Gln53 6.87 120.25
54 Asn54 8.26 118.54
55 Pro55 - -
56 Pro56 - -
57 Gln57 7.38 122.28

315
58 Ser58 8.03 115.88
59 Lys59 8.88 125.26
60 Gly60 9.47 110.79
61 Cys61 7.08 111.43
62 Cys62 8.86 114.59
63 Phe63 8.43 115.82
64 Ile64 9.18 121.40
65 Thr65 8.66 125.91
66 Phe66 9.76 130.29
67 Tyr67 8.09 119.33
68 Thr68 8.26 104.76
69 Arg69 9.67 126.83
70 Lys70 8.42 117.76
71 Ala71 7.52 121.12
72 Ala72 6.54 118.42
73 Leu73 7.77 116.47
74 Glu74 8.20 122.48
75 Ala75 8.14 123.54
76 Gln76 8.02 118.13
77 Asn77 8.07 115.22
78 Ala78 7.62 119.99
79 Leu79 7.78 114.09
80 His80 8.50 120.17
81 Asn81 9.02 122.28
82 Met82 7.93 116.65
83 Lys83 7.27 121.48
84 Val84 8.52 128.49
85 Leu85 8.91 130.93
86 Pro86 - -
87 Gly87 8.32 112.12
88 Met88 7.61 118.36
89 His89 8.10 122.06
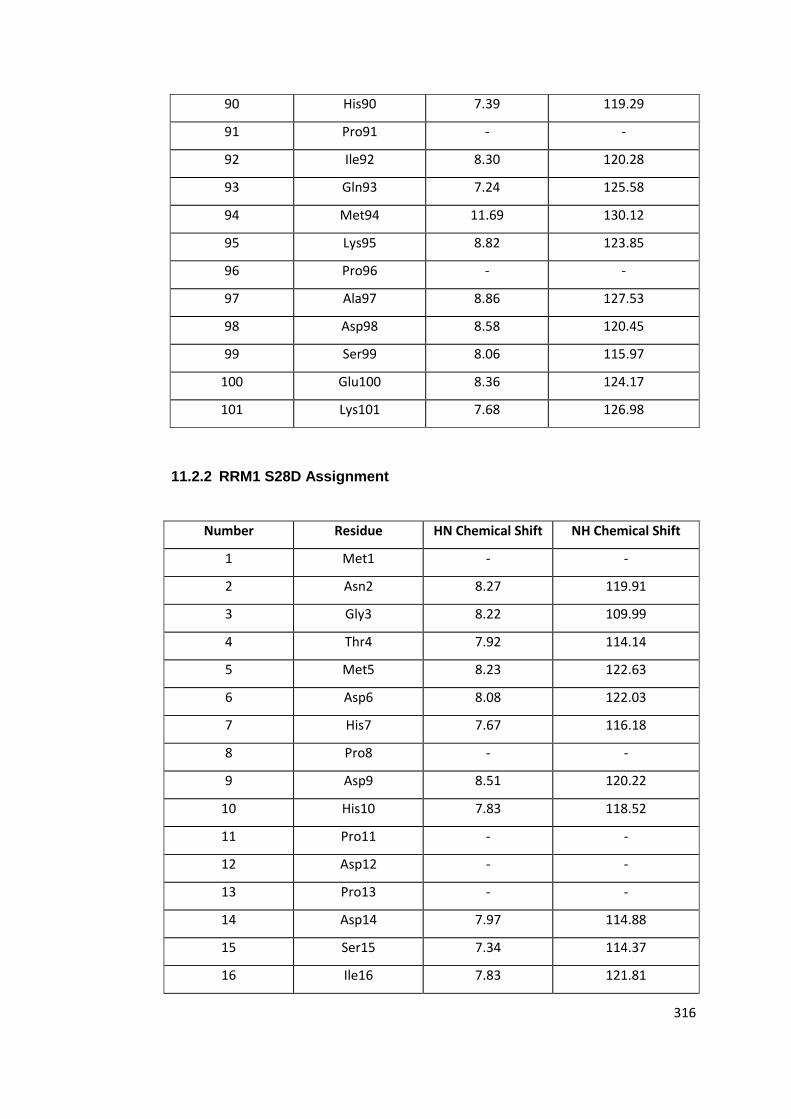
316
90 His90 7.39 119.29
91 Pro91 - -
92 Ile92 8.30 120.28
93 Gln93 7.24 125.58
94 Met94 11.69 130.12
95 Lys95 8.82 123.85
96 Pro96 - -
97 Ala97 8.86 127.53
98 Asp98 8.58 120.45
99 Ser99 8.06 115.97
100 Glu100 8.36 124.17
101 Lys101 7.68 126.98
11.2.2 RRM1 S28D Assignment
Number Residue HN Chemical Shift NH Chemical Shift
1 Met1 - -
2 Asn2 8.27 119.91
3 Gly3 8.22 109.99
4 Thr4 7.92 114.14
5 Met5 8.23 122.63
6 Asp6 8.08 122.03
7 His7 7.67 116.18
8 Pro8 - -
9 Asp9 8.51 120.22
10 His10 7.83 118.52
11 Pro11 - -
12 Asp12 - -
13 Pro13 - -
14 Asp14 7.97 114.88
15 Ser15 7.34 114.37
16 Ile16 7.83 121.81

317
17 Lys17 8.58 129.47
18 Met18 8.66 127.71
19 Phe19 9.60 125.34
20 Val20 8.20 129.30
21 Gly21 9.06 112.64
22 Gln22 8.05 110.11
23 Val23 7.12 115.77
24 Pro24 - -
25 Arg25 9.02 123.36
26 Ser26 7.60 109.15
27 Trp27 10.12 129.62
Trp27(E) 7.42 123.83
28 Asp28 8.94 126.87
29 Glu29 9.86 122.09
30 Lys30 8.31 118.76
31 Glu31 7.96 120.12
32 Leu32 7.76 119.32
33 Arg33 8.89 121.70
34 Glu34 7.26 117.51
35 Leu35 7.04 118.62
36 Phe36 8.34 114.63
37 Glu37 9.02 118.65
38 Gln38 7.00 117.04
39 Tyr39 7.89 117.17
40 Gly40 7.30 106.82
41 Ala41 7.95 119.30
42 Val42 9.51 127.17
43 Tyr43 8.21 130.06
44 Glu44 7.31 117.72
45 Ile45 8.51 126.89
46 Asn46 8.81 125.75
47 Val47 8.96 127.88

318
48 Leu48 7.78 130.50
49 Arg49 8.38 121.28
50 Asp50 8.91 121.28
51 Arg51 8.70 124.79
52 Ser52 8.58 116.95
53 Gln53 6.88 120.22
54 Asn54 8.25 118.47
55 Pro55 - -
56 Pro56 - -
57 Gln57 7.40 122.46
58 Ser58 8.03 115.88
59 Lys59 8.86 125.10
60 Gly60 9.51 110.94
61 Cys61 7.10 111.48
62 Cys62 8.85 114.44
63 Phe63 8.44 115.57
64 Ile64 9.20 121.18
65 Thr65 8.64 125.82
66 Phe66 9.76 130.18
67 Tyr67 8.09 119.21
68 Thr68 8.26 104.72
69 Arg69 9.66 126.72
70 Lys70 8.42 117.60
71 Ala71 7.52 121.07
72 Ala72 6.53 118.35
73 Leu73 7.76 116.34
74 Glu74 8.20 122.44
75 Ala75 8.13 123.45
76 Gln76 8.02 118.05
77 Asn77 8.09 115.27
78 Ala78 7.62 119.90
79 Leu79 7.78 114.04

319
80 His80 8.49 120.04
81 Asn81 9.03 122.21
82 Met82 7.94 116.61
83 Lys83 7.26 121.42
84 Val84 8.52 128.37
85 Leu85 8.93 130.90
86 Pro86 - -
87 Gly87 8.32 112.08
88 Met88 7.61 118.29
89 His89 8.10 122.03
90 His90 7.41 118.93
91 Pro91 - -
92 Ile92 8.30 120.35
93 Gln93 7.29 125.61
94 Met94 11.68 129.92
95 Lys95 8.83 123.85
96 Pro96 - -
97 Ala97 8.85 127.36
98 Asp98 8.51 120.22
99 Ser99 8.04 116.00
100 Glu100 8.35 123.95
101 Lys101 7.69 127.07
11.2.3 RRM2 Assignment
Number Residue HN Chemical Shift NH Chemical Shift
108 Arg108 7.98 114.72
109 Lys109 7.46 121.78
110 Leu110 9.51 126.92

320
111 Phe111 9.25 123.34
112 Ile112 8.14 128.04
113 Gly113 9.25 112.16
114 Met114 8.25 114.18
115 Val115 7.26 111.30
116 Ser116 7.04 117.51
117 Lys117 8.98 127.78
118 Asn118 7.99 114.23
119 Cys119 7.05 117.68
120 Asn120 9.34 123.23
121 Glu121 9.40 120.25
122 Asn122 8.20 118.07
123 Asp123 7.88 121.67
124 Ile124 7.48 119.92
125 Arg125 8.60 121.42
126 Ala126 7.88 121.30
127 Met127 7.40 115.75
128 Phe128 7.66 112.71
129 Ser129 8.47 120.76
130 Pro130 - -
131 Phe131 7.20 112.49
132 Gly132 7.51 104.46
133 Gln133 7.59 120.35
134 Ile134 8.45 127.47
135 Glu135 8.78 129.54
136 Glu136 7.10 116.69
137 Cys137 8.74 126.46
138 Arg138 8.62 126.54
139 Ile139 8.66 125.34
140 Leu140 8.17 129.67
141 Arg141 8.34 123.16
142 Gly142 8.34 108.43
143 Pro143 - -

321
144 Asp144 7.80 115.85
145 Gly145 8.16 108.21
146 Met146 7.77 120.80
147 Ser147 8.74 117.21
148 Arg148 9.04 125.08
149 Gly149 9.45 110.44
150 Cys150 6.91 111.11
151 Ala151 8.93 122.37
152 Phe152 8.52 114.78
153 Val153 8.46 121.08
154 Thr154 8.62 123.92
155 Phe155 8.34 126.95
156 The156 8.40 112.16
157 Thr157 7.56 108.68
158 Arg158 9.05 123.34
159 Ser159 8.41 115.88
160 Met160 7.21 121.76
161 Ala161 6.57 119.53
162 Gln162 8.41 115.55
163 Met163 7.66 120.21
164 Ala164 7.57 123.43
165 Ile165 7.60 118.38
166 Lys166 7.46 117.82
167 Ser167 7.46 110.52
168 Met168 7.87 115.61
169 His169 8.09 120.32
170 Gln170 8.45 121.61
171 Ala171 7.75 120.36
172 Gln172 7.07 110.75
173 Thr173 8.54 119.31
174 Met174 9.72 128.23
175 Glu175 8.44 121.92
176 Gly176 8.69 114.34

322
177 Cys177 7.79 119.11
178 Ser178 - -
179 Ser179 7.33 117.03
180 Pro180 - -
181 Ile181 7.96 118.29
182 Val182 8.07 127.84
183 Val183 10.98 129.69
184 Lys184 8.64 122.00
185 Phe185 8.21 120.11
186 Ala186 8.66 125.13
187 Asp187 7.94 125.92
11.2.4 RRM3 Assignment
Number Residue HN Chemical Shift NH Chemical Shift
390 Gly390 8.50 110.75
391 Leu391 8.04 122.22
392 Gly392 8.28 110.18
393 Ala393 8.09 122.80
394 Ala394 - -
395 Gly395 - -
396 Ser396 7.75 116.25
397 Gln397 8.21 121.56
398 Lys398 7.98 123.90
399 Glu399 8.27 123.75
400 Gly400 8.93 110.90
401 Pro401 - -
402 Glu402 8.21 119.96
403 Gly403 8.35 113.21
404 Ala404 8.16 120.49
405 Asn405 7.26 115.95

323
406 Leu406 9.15 124.22
407 Phe407 8.93 119.35
408 Ile408 8.37 122.39
409 Tyr409 9.25 123.82
410 His410 8.43 112.81
411 Leu411 7.35 115.03
412 Pro412 - -
413 Gln413 8.91 126.21
414 Glu414 8.95 115.23
415 Phe415 7.44 123.33
416 Gly416 9.40 114.88
417 Asp417 8.48 120.87
418 Gln418 8.70 118.36
419 Asp419 6.90 119.79
420 Leu420 7.52 120.87
421 Leu421 7.57 119.92
422 Gln422 7.81 116.41
423 Met423 7.35 116.47
424 Phe424 7.45 113.61
425 Met425 8.45 128.29
426 Pro426 - -
427 Phe427 6.43 110.65
428 Gly428 7.50 106.59
429 Asn429 8.84 117.95
430 Val430 8.18 128.72
431 Val431 8.79 130.28
432 Ser432 7.08 114.01
433 Ser433 7.60 116.22
434 Lys434 8.40 125.39
435 Val435 8.43 125.68
436 Phe436 8.09 127.79
437 Ile437 8.13 121.93

324
438 Asp438 8.55 127.07
439 Lys439 8.74 128.05
440 Gln440 8.51 117.86
441 Thr441 7.63 107.81
442 Asn442 8.32 117.66
443 Leu443 7.48 118.57
444 Ser444 8.59 115.96
445 Lys445 9.12 126.03
446 Cys446 10.02 113.78
447 Phe447 7.54 115.76
448 Gly448 9.11 108.50
449 Phe449 8.64 120.68
450 Val450 7.65 124.26
451 Ser451 8.18 119.96
452 Tyr452 8.25 121.67
453 Asp453 7.73 114.18
454 Asn454 7.07 114.67
455 Pro455 - -
456 Val456 7.91 121.99
457 Ser457 7.72 118.61
458 Ala458 6.19 120.78
459 Gln459 7.57 116.71
460 Ala460 7.68 123.73
461 Ala461 7.69 122.44
462 Ile462 7.91 119.25
463 Gln463 7.69 117.52
464 Ser464 7.39 111.41
465 Met465 8.17 114.91
466 Asn466 8.23 119.43
467 Gly467 8.83 118.76
468 Phe468 7.78 123.99
469 Gln469 7.88 129.25

325
470 Ile470 8.32 126.95
471 Gly471 8.80 118.33
472 Met472 8.79 123.74
473 Lys473 7.70 120.26
474 Arg474 7.98 120.18
475 Leu475 8.92 123.33
476 Lys476 7.91 124.23
477 Val477 8.61 127.49
478 Gln478 8.97 124.04
479 Leu479 8.57 123.28
480 Lys480 8.20 124.81
481 Arg481 - -
482 Ser482 - -
483 Lys483 - -
484 Asn484 - -
485 Asp485 7.96 121.63
486 Ser486 8.03 116.32
487 Lys487 7.95 124.34
488 Pro488 - -
489 Tyr489 7.30 124.49

326