educational technology needs assessment final
TRANSCRIPT

Nevada Schools Educational Technology Needs Assessment
Report to the Nevada Commission on Educational Technology & the Nevada
Department of Education
May 2008
By
Kendall Hartley, Ph.D.
Neal Strudler, Ph.D.
Gregg Schraw, Ph.D.
College of Education
University of Nevada, Las Vegas

2
Table of Contents
!"#$%&'(#)*%++,-.//////////////////////////////////////////////////////////////////////////////////////////////////////////////////////////////////0!
1%-234# ////////////////////////////////////////////////////////////////////////////////////////////////////////////////////////////////////////////////////////5!
6##74)844#44+#9&):#4';9 //////////////////////////////////////////////////////////////////////////////////////////////////////////////////////5!
!"#$%"&'()&*"+,,,,,,,,,,,,,,,,,,,,,,,,,,,,,,,,,,,,,,,,,,,,,,,,,,,,,,,,,,,,,,,,,,,,,,,,,,,,,,,,,,,,,,,,,,,,,,,,,,,,,,,,,,,,,,,,,,,,,,,,,,,,,,,,,,,,,,,,,,,,,,,,,,,,,,,,,,,,,,,,-!
!"$%./0/1+'2//&34.#5/&6'()&*"+ ,,,,,,,,,,,,,,,,,,,,,,,,,,,,,,,,,,,,,,,,,,,,,,,,,,,,,,,,,,,,,,,,,,,,,,,,,,,,,,,,,,,,,,,,,,,,,,,,,,,,,,,,,,,,,,,,,,,,,,,,,,,,7!
8.5"&*4"96 ,,,,,,,,,,,,,,,,,,,,,,,,,,,,,,,,,,,,,,,,,,,,,,,,,,,,,,,,,,,,,,,,,,,,,,,,,,,,,,,,,,,,,,,,,,,,,,,,,,,,,,,,,,,,,,,,,,,,,,,,,,,,,,,,,,,,,,,,,,,,,,,,,,,,,,,,,,,,,,,,,,,,,,,,,, 7!
:5%"&';#5#'(/)&$"6,,,,,,,,,,,,,,,,,,,,,,,,,,,,,,,,,,,,,,,,,,,,,,,,,,,,,,,,,,,,,,,,,,,,,,,,,,,,,,,,,,,,,,,,,,,,,,,,,,,,,,,,,,,,,,,,,,,,,,,,,,,,,,,,,,,,,,,,,,,,,,,,,,,,,,,,7!
<#4%=&4 //////////////////////////////////////////////////////////////////////////////////////////////////////////////////////////////////////////////////////////>!
:&1#.4<#54/. ,,,,,,,,,,,,,,,,,,,,,,,,,,,,,,,,,,,,,,,,,,,,,,,,,,,,,,,,,,,,,,,,,,,,,,,,,,,,,,,,,,,,,,,,,,,,,,,,,,,,,,,,,,,,,,,,,,,,,,,,,,,,,,,,,,,,,,,,,,,,,,,,,,,,,,,,,,,,,,,,,,,, =!
;465&4$5'2#5"1/&4"6 ,,,,,,,,,,,,,,,,,,,,,,,,,,,,,,,,,,,,,,,,,,,,,,,,,,,,,,,,,,,,,,,,,,,,,,,,,,,,,,,,,,,,,,,,,,,,,,,,,,,,,,,,,,,,,,,,,,,,,,,,,,,,,,,,,,,,,,,,,,,,,,,,,,,,,,,,,=!
;465&4$5'!"$%./0/1+'>0#.6,,,,,,,,,,,,,,,,,,,,,,,,,,,,,,,,,,,,,,,,,,,,,,,,,,,,,,,,,,,,,,,,,,,,,,,,,,,,,,,,,,,,,,,,,,,,,,,,,,,,,,,,,,,,,,,,,,,,,,,,,,,,,,,,,,,,,,,, ?@!
(5#5"'!"$%./0/1+'>0#.,,,,,,,,,,,,,,,,,,,,,,,,,,,,,,,,,,,,,,,,,,,,,,,,,,,,,,,,,,,,,,,,,,,,,,,,,,,,,,,,,,,,,,,,,,,,,,,,,,,,,,,,,,,,,,,,,,,,,,,,,,,,,,,,,,,,,,,,,,,,,,, ?@!
!"$%./0/1+'>0#.'8AB#$5,,,,,,,,,,,,,,,,,,,,,,,,,,,,,,,,,,,,,,,,,,,,,,,,,,,,,,,,,,,,,,,,,,,,,,,,,,,,,,,,,,,,,,,,,,,,,,,,,,,,,,,,,,,,,,,,,,,,,,,,,,,,,,,,,,,,,,,,,,, ??!
C).34.1'D'E)43#.$",,,,,,,,,,,,,,,,,,,,,,,,,,,,,,,,,,,,,,,,,,,,,,,,,,,,,,,,,,,,,,,,,,,,,,,,,,,,,,,,,,,,,,,,,,,,,,,,,,,,,,,,,,,,,,,,,,,,,,,,,,,,,,,,,,,,,,,,,,,,,,,,,,, ?F!
:5%"&'(5#5"6 ,,,,,,,,,,,,,,,,,,,,,,,,,,,,,,,,,,,,,,,,,,,,,,,,,,,,,,,,,,,,,,,,,,,,,,,,,,,,,,,,,,,,,,,,,,,,,,,,,,,,,,,,,,,,,,,,,,,,,,,,,,,,,,,,,,,,,,,,,,,,,,,,,,,,,,,,,,,,,,,,,,, ?G!
E"."�':H6"&*#54/.6,,,,,,,,,,,,,,,,,,,,,,,,,,,,,,,,,,,,,,,,,,,,,,,,,,,,,,,,,,,,,,,,,,,,,,,,,,,,,,,,,,,,,,,,,,,,,,,,,,,,,,,,,,,,,,,,,,,,,,,,,,,,,,,,,,,,,,,,,,,,,,,,, ?G!
!7%$,&'39,=)?#$@93=3;'#4)A+2-3('9;)A94&-%$&'39,=):#(#=32+#9&B):#='(#-.B),97)
844#44+#9&)'9)6#(,7, ////////////////////////////////////////////////////////////////////////////////////////////////////////////////////////// C0!
2/AB)5"&IH#6"3'J66"66A".56 ,,,,,,,,,,,,,,,,,,,,,,,,,,,,,,,,,,,,,,,,,,,,,,,,,,,,,,,,,,,,,,,,,,,,,,,,,,,,,,,,,,,,,,,,,,,,,,,,,,,,,,,,,,,,,,,,,,,,,,,,,,,,,,,, ?K!
LMB#.3"3'N6"'/O'P#B5/B'2/AB)5"&6 ,,,,,,,,,,,,,,,,,,,,,,,,,,,,,,,,,,,,,,,,,,,,,,,,,,,,,,,,,,,,,,,,,,,,,,,,,,,,,,,,,,,,,,,,,,,,,,,,,,,,,,,,,,,,,,,,,,, ?Q!
E"."�':H6"&*#54/.6,,,,,,,,,,,,,,,,,,,,,,,,,,,,,,,,,,,,,,,,,,,,,,,,,,,,,,,,,,,,,,,,,,,,,,,,,,,,,,,,,,,,,,,,,,,,,,,,,,,,,,,,,,,,,,,,,,,,,,,,,,,,,,,,,,,,,,,,,,,,,,,,, ?7!
D%--#9&)D,2,$'&.)3E)6#(,7,)*$@33=4 //////////////////////////////////////////////////////////////////////////////////////////////// C>!
R"*#3#'20#66&//A6,,,,,,,,,,,,,,,,,,,,,,,,,,,,,,,,,,,,,,,,,,,,,,,,,,,,,,,,,,,,,,,,,,,,,,,,,,,,,,,,,,,,,,,,,,,,,,,,,,,,,,,,,,,,,,,,,,,,,,,,,,,,,,,,,,,,,,,,,,,,,,,,,,,,, ?=!
($%//06,,,,,,,,,,,,,,,,,,,,,,,,,,,,,,,,,,,,,,,,,,,,,,,,,,,,,,,,,,,,,,,,,,,,,,,,,,,,,,,,,,,,,,,,,,,,,,,,,,,,,,,,,,,,,,,,,,,,,,,,,,,,,,,,,,,,,,,,,,,,,,,,,,,,,,,,,,,,,,,,,,,,,,,,,,,,,, FF!
C&"S)".$+'/O'!"$%./0/1+'N6",,,,,,,,,,,,,,,,,,,,,,,,,,,,,,,,,,,,,,,,,,,,,,,,,,,,,,,,,,,,,,,,,,,,,,,,,,,,,,,,,,,,,,,,,,,,,,,,,,,,,,,,,,,,,,,,,,,,,,,,,,,,,,,,, FQ!
1-#2,-,&'39)F)1-3E#44'39,=):#(#=32+#9& //////////////////////////////////////////////////////////////////////////////////// GH!
>&"B#6/.,,,,,,,,,,,,,,,,,,,,,,,,,,,,,,,,,,,,,,,,,,,,,,,,,,,,,,,,,,,,,,,,,,,,,,,,,,,,,,,,,,,,,,,,,,,,,,,,,,,,,,,,,,,,,,,,,,,,,,,,,,,,,,,,,,,,,,,,,,,,,,,,,,,,,,,,,,,,,,,,,,,, F7!
>&/O"664/.#0';"*"0/BA".5 ,,,,,,,,,,,,,,,,,,,,,,,,,,,,,,,,,,,,,,,,,,,,,,,,,,,,,,,,,,,,,,,,,,,,,,,,,,,,,,,,,,,,,,,,,,,,,,,,,,,,,,,,,,,,,,,,,,,,,,,,,,,,,,,,,,,,,,, F=!
877'&'39,=)IJ4#-(,&'394////////////////////////////////////////////////////////////////////////////////////////////////////////////////////// KG!
>#&".5'>"&$"B54/.'/O'!"$%./0/1+'#.3'($%//06 ,,,,,,,,,,,,,,,,,,,,,,,,,,,,,,,,,,,,,,,,,,,,,,,,,,,,,,,,,,,,,,,,,,,,,,,,,,,,,,,,,,,,,,,,,,,,,,, GF!

3
N6"'/O'!"$%./0/1+'#.3'5%"'T"0#54/.6%4B'5/'(5)3".5':)5$/A"6 ,,,,,,,,,,,,,,,,,,,,,,,,,,,,,,,,,,,,,,,,,,,,,,,,,,,,,,,,,,,,,,, GG!
D39$=%4'394 ////////////////////////////////////////////////////////////////////////////////////////////////////////////////////////////////////////////// KL!
<#E#-#9$#4 //////////////////////////////////////////////////////////////////////////////////////////////////////////////////////////////////////////////// K5!
822#97'$#4/////////////////////////////////////////////////////////////////////////////////////////////////////////////////////////////////////////////// KH!
JBB".34M'J'I'!"#$%"&'()&*"+,,,,,,,,,,,,,,,,,,,,,,,,,,,,,,,,,,,,,,,,,,,,,,,,,,,,,,,,,,,,,,,,,,,,,,,,,,,,,,,,,,,,,,,,,,,,,,,,,,,,,,,,,,,,,,,,,,,,,,,,,,,,,,,,,, G7!
JBB".34M'U'V'!"#$%"&'()&*"+'85"A6,,,,,,,,,,,,,,,,,,,,,,,,,,,,,,,,,,,,,,,,,,,,,,,,,,,,,,,,,,,,,,,,,,,,,,,,,,,,,,,,,,,,,,,,,,,,,,,,,,,,,,,,,,,,,,,,,,,, GW!
JBB".34M'2'V'2//&34.#5/&'8.5"&*4"9'>&/5/$/0,,,,,,,,,,,,,,,,,,,,,,,,,,,,,,,,,,,,,,,,,,,,,,,,,,,,,,,,,,,,,,,,,,,,,,,,,,,,,,,,,,,,,,,,,,,,,,,, KG!
JBB".34M';'V'!"$%./0/1+'2//&34.#5/&'()&*"+,,,,,,,,,,,,,,,,,,,,,,,,,,,,,,,,,,,,,,,,,,,,,,,,,,,,,,,,,,,,,,,,,,,,,,,,,,,,,,,,,,,,,,,,,,,,,,, KQ!
JBB".34M'L'V'>#&".5'()&*"+,,,,,,,,,,,,,,,,,,,,,,,,,,,,,,,,,,,,,,,,,,,,,,,,,,,,,,,,,,,,,,,,,,,,,,,,,,,,,,,,,,,,,,,,,,,,,,,,,,,,,,,,,,,,,,,,,,,,,,,,,,,,,,,,,,,, K7!
'
'

4
Executive Summary
The amount of technology available in Nevada schools and classrooms is
significant and growing. Virtually every classroom in the state has at least one
computer connected to the Internet. More than half of the teachers who
responded to a survey reported that their classroom had some type of computer
projection device (e.g., LCD Projector, interactive whiteboard or computer-TV
converter). However, only 23% of classrooms have more than three computers
for students to use for learning. In other words, while a number of classrooms
are well equipped for teacher-led instruction, very few are equipped for
student-centered instruction that utilizes computers. Teachers do have
additional resources available through the shared use of mobile laptop carts
and computer labs that can be used temporarily in the classroom. Thirty one
percent of the responding teachers reported that they had access to a mobile
laptop cart from their school.
Teachers reported being moderately well prepared to use technology in the
classroom and they were generally positive about the technical support
systems in place. However, they felt that the professional development
opportunities were relatively low in quality and difficult to participate in due to
time and budget constraints. Technology coordinators described significant
challenges to offering high quality professional development programs that
could be widely implemented.
Statewide technology planning is viewed as an important function and in need
of increased attention. While the level of technology planning varies by district
and school, those who have allocated significant time and resources to planning
report that the results have been beneficial. An emphasis on technology
planning can a) help make decisions regarding resource allocation, b) increase
buy-in from district and school leaders, and c) inform other planning
documents such as school improvement plans. Technology planning is at times
frustrated by inconsistent (sometimes absent) funding mechanisms. In
addition, participants in this study reported that guidance from the Nevada

5
Department of Education and the Commission on Educational Technology
would greatly improve their capacity to engage in substantive technology
planning.
Overall, the technology needs of Nevada classrooms and schools remain
immense and in need of continued and consistent support. The technology
penetration has reached the classroom, but not necessarily the students. In
other words, classrooms are relatively well equipped to present information but
not as well equipped to engage students as active participants. The same can
be said for the capacity of teachers. While the initial preparation might be
adequate, the professional development opportunities are not sufficient to
support the more effective uses of computer technology in the classroom. As
one teacher stated in response to a question about the potential for technology
use in their classroom: “I could do so much more.”

6
Purpose
The purpose of this document is to present the findings of the 2008 Educational
Technology Needs Assessment for Nevada schools and districts. The needs
assessment was guided by the requirements set forth in SB184 (sections 19.1d,
19.6a-b, and 27.1-27.3). The following research questions were developed to
address these requirements.
1. What is the current status of the state and district educational
technology plans?
2. In what ways can educational technologies, such as computer-based
assessments, laptop computers and web-based tools, improve
instructional development, delivery, and assessment in Nevada?
3. What is the current capacity of schools in Nevada to positively impact the
achievement of students through the use of educational technologies?
4. How prepared are Nevada teachers to integrate technology into the
classroom?
Needs Assessment Design
To address these questions a research plan with a focus on Nevada classrooms
was developed and implemented. The primary sources of the data reported
here are Nevada K-12 classroom teachers and technology coordinators. This
data was gathered through the use of a teacher survey, a technology
coordinator survey and a limited number of interviews.
Teacher Survey
A Web-based survey for teachers was developed to collect information
regarding the current technology capacity of their classrooms, schools and
districts. Items in this section included questions such as: Do you have an LCD
projector in your classroom? and Do you have computers that students can use?
In addition to the access questions, the survey solicited information regarding

7
their preparation and professional development opportunities in technology.
Items in this section included questions such as: How would you rate the
quality of the professional development opportunities provided by your district?
and How well prepared are you to integrate technology into the classroom?
One thousand four hundred and seventy eight Nevada classroom teachers
provided information via the Web-based survey. Details on the development,
implementation and participant selection can be found in Appendix A. The
survey items can be found in Appendix B.
Technology Coordinators Survey
A Web-based survey for district technology coordinators was also developed.
This 27-item survey consisted of mostly open-ended questions regarding
technology planning, classroom capacity, school resources, teacher preparation
and professional development. All of the state technology coordinators were
invited to complete the survey. The items presented in this survey can be
viewed in Appendix D.
Interviews
A limited number of interviews were also conducted to support the assessment.
Eight individual interviews were conducted. Five of these were with district
technology coordinators, two with school-based coordinators and one with a
technology representative from the Nevada Department of Education. In
addition, a focus group session was conducted with four representatives from
the Clark County School District. The interview questions are listed in
Appendix C.
Other Data Sources
Other significant sources of information included the state technology plan,
district technology plans, Nevada public school accountability Web site
(Nevada Report Card), and district applications for state technology
implementation funds. In addition, numerous research and evaluation studies
in the applicable areas were reviewed.

8
Results
Organization
The results will be organized by the research questions. The first section deals
with the state and district technology plans specifically and technology
planning in general. The second section will address the findings regarding
specific initiatives such as computer-based assessments and laptop initiatives.
The third section describes the technology available in Nevada classrooms and
schools. The final section addresses questions of teacher preparation and
professional development in the area of technology integration.
District Categories
Succinctly describing the technology needs of an entire state is challenging.
This is due in part to the great variations that exist in the state districts and
schools. Geography, diversity, economics and enrollments all make a critical
contribution to the unique needs of each district, school and ultimately the
classroom. The data collected to support this assessment can provide the
information necessary to tease out how these contributions relate to the
technology needs of each district. Much of the findings reported here depend
upon the enrollment of the school district. To facilitate a richer description of
the findings, this report will refer to large, medium and small school districts
using the demarcations described in Table 1.

9
Table 1. Size definitions
Size
Student
Enrollments Districts
Small < 2000 Esmerelda
Eureka
Lander
Lincoln
Mineral
Pershing
Storey
White Pine
Medium 2000 – 20,000 Carson City
Churchill
Douglas
Elko
Humboldt
Lyon
Nye
Large > 20,000 Clark
Washoe
Technology Plans
The primary sources of information for this section were the interviews with
technology coordinators, the survey of technology coordinators and a review of
the state and district educational technology plans.
The reported use of the state and district educational technology plans varies
seemingly with the size of the school district. Large districts have made
significant commitments to administrative positions directing technology
initiatives. These districts tend to use their own plans regularly in the
planning of technology initiatives. While most noted that the state plan is
dated, they do utilize it to guide some of the decision making related to
technology. Medium districts use of the plans varied. Many would utilize the
state plan when required and used it to support the development of their
district plan. The small districts utilized the state plan to guide requests for

10
funding and the development of their own plans. All of the districts felt that a
new state plan was needed.
District Technology Plans
District plans are used extensively for technology planning in most districts.
The plans are regularly reviewed and updated in part due to requirements
from the state and federal governments. For most districts these plans impact
district-level decisions, but few seem to have a consistent impact on what
happens with school technology purchases.
The involvement of district leaders in the development, approval, and
implementation of the technology plans was often noted in interviews as a
critical feature of an effective plan. Some districts did this through the sharing
of the technology plan with the school board on an annual basis. Others
accomplished this through the inclusion of district administrators on the
district technology committee. Another critical feature of effective plans was
the regular review and updating of plans. These reviews would include
assessing progress towards goals, updates in the language and technologies.
Reviews would also include updates that reflected changes to district
improvement plans and academic standards. Districts have attempted to have
these reviews coincide with updates to the state plan. However, the lack of
predictable revisions to the state plan has made this difficult.
State Technology Plan
The overall alignment of the state and district plans was strong. This indicates
there is significant value in having a thoughtful and useful state plan in place.
Districts will look to the state plan for guidance, which can in turn impact
school plans. However, the connection between the school plans and district
plans seems limited in most of the small and medium districts where there is
not an onsite technology representative. Virtually every district plan referred
to the goals laid out in the state plan. While this may have been due in large
part to requirements established by the state technology office, it is clear that
the use of a common set of goals can help to guide planning at multiple levels.

11
Technology Plan Impact
The systematic development and review of technology plans has the potential
for broad positive impact on student outcome measures such as achievement
and motivation. This can be accomplished through the use of a shared vision
that is presented in a common language. Once this vision and language is
established, more progress can be made in these areas.
At present, the impact of the state and district plans on technology integration
and student achievement is difficult to ascertain. While the goals of the state
plan are frequently referenced in grant applications, there does not appear to
be a strong consensus around what these goals mean. For example, the state
plan goal number 2 states:
High-quality content materials are available and accessible to both
students and teachers to support a standards-based curriculum.
This goal is frequently referenced in applications for state grants for requests
as varied as iPods, interactive whiteboards and supporting distance-learning
programs. If the goals articulated in the state plans were clear to all the
districts, one would expect more consistency in the types of activities that are
conducted under the premise that they help meet a particular goal. As it stands
now, districts are more likely to reference a goal simply because it is required
rather than as a mechanism to help focus resources in critical areas.
One district emphasized the need for the state plan to include measurable
targets and timelines. This can better support the evaluation of the progress
towards educational goals. One of the areas where the current state plan did
include specifics was the description of the Levels of Technology Integration.
Several coordinators would describe their schools in terms of these levels. It
was also clear that the need to achieve level one integration in terms of
hardware (1 computer in every classroom) had driven some of the early
allocations of resources. The evidence suggests that virtually every classroom
has at least one Internet connected computer. Unfortunately, few classrooms
go beyond meeting the requirements for level one integration. Classroom
technology capacity will be described in more detail later in the report. The

12
important point here is that the technology plan can provide a common
language and set of goals that can be used to discuss and plan for technology
needs.
Funding & Guidance
In interviews and surveys, technology coordinators repeatedly indicated that
inconsistent funding and guidance made it extremely difficult to plan. Some
districts reported they had a small amount of dependable funding from
operational funds. State, federal and other grants provide the bulk of the funds
for technology. This dependence upon irregular funds results in a number of
one-year (or less) programs that are difficult to evaluate.
Restrictions on how funds can be used were noted as significant challenges. In
some instances, these restrictions have resulted in schools becoming rich in
hardware but so poor in other areas such as bandwidth and/or professional
development that the hardware could not be effectively utilized. The teacher
survey results presented below describe a state where district needs vary
greatly depending upon how they have allocated prior resources.
Guidance from the state was also noted as a challenge for many in terms of
planning for technology integration. Over the past several years, there has
been a limited amount of support from the state. The Technology and
Innovative Programs office is not equipped to adequately and consistently
support the necessary granting, documentation, planning and communication
functions that are now required of state departments of education. A cursory
look at comparable states reveals that other offices are staffed at a much
higher level. Reviews of the staff listings from the web sites of surrounding
states indicated that the comparable state offices had significantly more
resources committed to technology. The web site of the State Educational
Technology Directors Association (SETDA) also lists the EdTech Team
members for each state and appears to support the assertion that when
compared to western states with similar populations, Nevada is on the low end
of allocating personnel resources to educational technology. This preliminary
look should not be construed as a thorough comparison of resource allocations

13
at the state level. However, it does indicate that a more in depth review is
warranted.
Other States
Like Nevada, surrounding states have developed educational technology plans
to support an efficient use of resources and meaningful planning. There is a
wealth of resources available on the Internet to support these activities.
Identifying a few of the most valuable sites will help guide future revisions of
the state technology plan.
Several states explicitly refer to the International Society for Technology in
Education (ISTE) standards in their technology plans. The plans include
general mission statements and attempt to specify the purpose of the
document. The plans include general goals but often expand on the goals to
include specific indicators that would imply progress towards the goals.
General Observations
The state technology plan is in many ways the starting point of educational
technology for district technology coordinators. Districts are looking for the
state to provide guidance in this area. An up-to-date and well articulated state
plan can guide plan development in each district and provide a common
document upon which substantive collaborations can be built.
Coordination with national standards can support the planning process in a
number of ways. ISTE is a non-profit organization that has committed
significant resources to supporting technology planning and the development of
academic and professional standards. Using ISTE’s planning resources and
standards as a basis for the development of a new state technology plan is
recommended.

14
Educational Technologies Improving Instructional
Development, Delivery, and Assessment in Nevada
The integration of technology in teaching and learning has widespread support
from educators, policy makers, parents, and industry. The premise for this
support often includes considerations of efficiency, improvements in
achievement, and the need for technology skills amongst graduates. Rather
than looking at technology integration in general terms, this section of the
report will focus on some specific activities that many believe can support these
larger goals. In particular, this section will address the potential for expanding
the use of computer-based assessments, laptop computers, and web-based
collaborative technologies.
Computer-based Assessments
The educational reform movements of the past twenty years have placed a
strong emphasis upon accountability and data-driven decision-making.
Assessment development and implementation are resource intensive activities.
The need to utilize technology to increase efficiency in the process is important
for a number of reasons. One of the most widely cited reasons is the need to
provide timely feedback for students and teachers. In addition, the costs of
printing and distributing paper tests can be eliminated.
When asked about the possibility of expanding the use of computer-based
assessments most technology coordinators in the state expressed optimism and
support. However, they quickly acknowledged the tremendous challenges that
this would present with the current infrastructure. The discussion of computer-
based assessments was telling in that it provided an excellent example of the
potential for technology to greatly improve a major task of schools but how the
poor infrastructure renders it virtually impossible to realize the potential.
Discussions with assessment experts in the state and elsewhere reflected a
similar level of optimism. Their reactions were also quickly tempered with the
realization that the infrastructure to support wide-scale implementation is not
in place. They noted that when every student in a school takes a paper and

15
pencil test, the physical resources necessary are easily accessible. Once the
same exam is moved to a computer, every student needs a dependable computer
and Internet connection. When asked to consider rotating students through
computer labs or the use of portable laptop carts most felt that for the majority
of schools, this would not be practical. In addition, to deal with technical issues
there would need to be someone on site—something that is not common in
Nevada schools.
There are limited instances of computer-based assessments being utilized on a
broad scale in Nevada and elsewhere in the United States. Several medium
sized Nevada school districts are using MAP testing for literacy and
mathematics. Those districts reported that this approach has been positive
overall but they rely on wide testing windows to facilitate rotation cycles and
dependable Internet connectivity. The districts involved are also on the higher
end in terms of numbers of computers per-student. In other states where
computers are being used on a wide scale to support assessments, the
infrastructure commitments are extensive. Maine, for example, has committed
to providing every middle school student with a laptop computer.
In addition to infrastructure, many raised concerns around test integrity and
quality. For example, if students rotated through computer labs over several
weeks to take the test, will those taking the exams later be advantaged? In
addition, each student will need unique logins and methods for insuring
identity to avoid cheating. While these challenges are not unique to online
testing, it is important that concerns are adequately addressed before any
broad changes are initiated.
Expanded Use of Laptop Computers
Many have argued that to truly take advantage of the educational power of
computers, students and teachers should have their own computer. This was
one premise of the Apple Classrooms of Tomorrow (ACOT) study initiated over
20 years ago. The ACOT study evaluated classrooms that had been immersed
in technology to such a degree that the computers became an integral part of
the educational setting (Dwyer, 1994). This included giving each student and

16
teacher a computer for his or her home. This was done with an eye toward the
future when computers would be more mobile and less expensive. The
outcomes of this study have engendered optimism towards the use of
computers as a catalyst for critical educational reforms. Most notably is the
need to shift classrooms to more student-centered environments. This shift was
frequently observed in the ACOT classrooms (Dwyer, 1994).
Educational pricing for well-equipped laptop computers is currently under
$1000. In addition, a new category of laptops has emerged that utilize
innovative designs, more efficient software and emphasize connectivity
(Trotter, 2008). Laptops in this emerging category are being sold at less than
$500. It is clear that there will be a time when every student will have some
type of computer to use in school. A near one-one computer to student ratio
currently exists when one considers that today’s cell phones are more powerful
than computers that were introduced in the ACOT program 20 years ago. A
recent survey of Washoe County School District high school students revealed
that 78% of students had their own cell phone (Anstee & Christiansen, 2007).
Currently the use of laptops in Nevada schools generally involves the use of a
cart containing a classroom set of computers. Teachers check these out and
have them wheeled into their classroom for use (see the Classroom Capacity
section for more details on availability). The technology coordinators report
that teachers find these carts very useful for short lessons. Unfortunately, the
check out system can frustrate teachers who would prefer to use the technology
for more in-depth activities that might run for a few days.
A number of large-scale laptop computing initiatives have been undertaken in
the United States. Each of these have been studied extensively and the results
are positive (Muir et al., 2006). For example, the Maine Learning Technology
Initiative (MLTI) involved giving every middle school student in the state a
laptop for use at home and school. The evaluation studies of these schools find
that students are more engaged and are less likely to be referred for
disciplinary reasons (Muir et al., 2006). MLTI evaluations have also focused on
more specific initiatives to ascertain impacts on achievement. One such study
investigated the use of online virtual manipulatives in mathematics courses.

17
The students’ use of these environments had a positive impact on student
achievement. Other large scale laptop initiatives in Irving, Texas and
Fullerton, California have reported similar outcomes.
One potential outcome of expanded access to laptops for students is a reduced
dependence upon traditional textbooks. For some schools, such as the Clark
County Virtual High School and Washoe County’s vision of a redesigned
Regional Technical Institute, textbooks are already being replaced by electronic
content. These are unique instances in that the technology is pervasive for
these schools but it is indicative of what can happen if sufficient resources are
present.
Some districts currently negotiate access to electronic versions (in addition to
print) of content when they negotiate textbook contracts. There are also limited
initiatives where school districts are getting teachers contributing activities to
shared spaces. Wiki-Teacher.com is one such initiative in Clark County where
teachers can contribute activities that are based on state standards. The
system includes a process of reviewing and rating contributions.
For most districts, the consideration of replacing of textbooks with electronic
materials largely assumed the continued use of traditional publishing houses.
There was little recognition of opportunities available to utilize the Internet as
either a primary source of content or a medium through which quality content
could be collaboratively developed and distributed. When prompted to consider
alternative models for distributing content, technology coordinators expressed
skepticism based upon a lack of infrastructure. They were also concerned about
the lack of time needed to investigate and ultimately implement alternative
models of curriculum distribution.
General Observations
The potential for technologies such as computer-based assessments, electronic
textbooks, and laptops to enhance the educational environment in the state are
tremendous. However, the infrastructure necessary to support and implement
these technologies is dependent upon a consistent and strong commitment to
funding that has not yet materialized.

18
Current Capacity of Nevada Schools
This section describes the capacity of Nevada classrooms and schools largely
from a teacher’s perspective. Much of the information provided here comes
from the results of a survey of 1,478 Nevada classroom teachers. These results
are supplemented with data provided by district technology coordinators. A
complete description of the survey methodology can be viewed in Appendix A.
Nevada Classrooms
The intent of this section is to provide a view of what the typical Nevada
classroom looks like. Teachers were asked to describe the technology they have
in their classroom at all times. A subsequent section solicited information
regarding technologies available from the school for defined periods of time
(i.e., check out).
Virtually every classroom in the state (99%) has at least one computer that the
teacher can use for administrative tasks. The computer is generally 2-3 years
old (see Figure 1).
Figure 1.
New or 1
year old
17%
2-3 years
old
44%
4-5 years
old
32%
> 6
years
8%
Age of Teacher Computer

19
Sixty percent of the teachers responding to the survey reported having some
type of classroom display (e.g., LCD Projector, Interactive Whiteboard or VGA
to TV converter) in their own classroom (see Figure 2). This was consistent
across small, medium and large districts.
Figure 2
While the percentage of classrooms that had some way to display the computer
screen to the class was consistent, how this is done varies by the size of the
school district (see Figure 3). For example, interactive whiteboards appear in a
much higher percentage of small district classrooms.
Figure 3
0%
10%
20%
30%
40%
50%
60%
Large Medium Small
School District Size
At Least One Display Device
0%
10%
20%
30%
40%
50%
60%
Large Medium Small
School District Size
LCD Projector
0%
10%
20%
30%
40%
50%
60%
Large Medium Small
School District Size
Interactive Whiteboard
0%
10%
20%
30%
40%
Large Medium Small
School District Size
Computer to TV Converter
20
In addition, 15% of all classrooms have a digital camera and five percent have
a digital video camera.
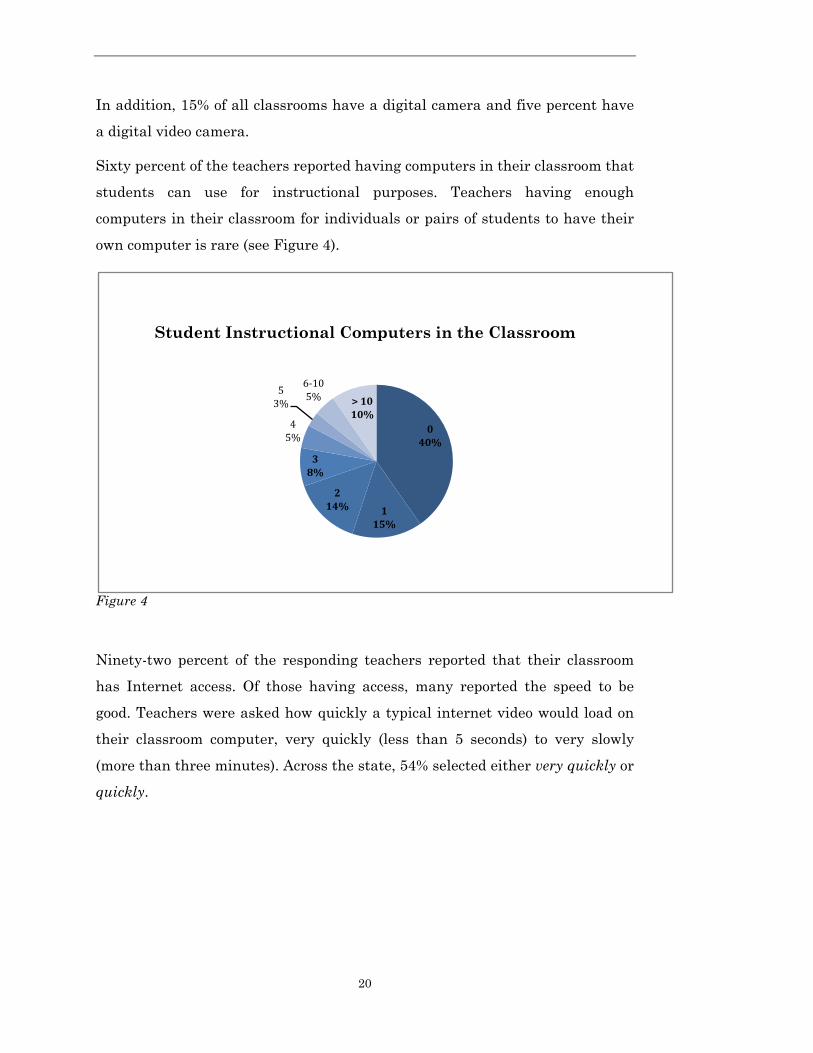
Sixty percent of the teachers reported having computers in their classroom that
students can use for instructional purposes. Teachers having enough
computers in their classroom for individuals or pairs of students to have their
own computer is rare (see Figure 4).
Figure 4
Ninety-two percent of the responding teachers reported that their classroom
has Internet access. Of those having access, many reported the speed to be
good. Teachers were asked how quickly a typical internet video would load on
their classroom computer, very quickly (less than 5 seconds) to very slowly
(more than three minutes). Across the state, 54% selected either very quickly or
quickly.
M)
0MN)
C)
CLN)
G)
C0N)
K)
>N)
"!
#$!
#!
%$!
&'()!
#$! O)CM)
CMN)
Student Instructional Computers in the Classroom

21
Figure 5
While the responses did not indicate any trends from small to large districts,
they did vary significantly within groups. For example, while 59% of Clark
teachers report that Internet access is very quick or quick, Washoe teachers
selected these options 38% of the time (see Figure 6).
0%
5%
10%
15%
20%
25%
30%
35%
40%
45%
50%
Very quickly
(less than 5
seconds)
Quickly (5-15
seconds)
OK (16-45
seconds)
Slowly (1-3
minutes)
Very slowly
(more than 3
minutes)
Internet Access Speed

22
Figure 6
Schools
This section will describe the technology capacity of Nevada schools. Most
schools will utilize a reservation policy to stretch limited resources across an
entire school.
An increasingly popular way for schools to get more computers into classrooms
is to use a laptop cart. These carts can easily be rolled from classroom to
classroom. The power of these carts is magnified when the school has wireless
network access. Thirty-one percent of the respondents reported that they have
access to a laptop cart at school.
Display devices are also common items available for check out in schools. Fifty
nine percent of respondents reported having access to an LCD projector in their
school. Twenty three percent have access to an interactive whiteboard. These
percentages vary slightly by district size with larger districts more likely to
have LCD projectors and the smaller districts having proportionally more
0%
5%
10%
15%
20%
25%
30%
35%
40%
45%
50%
Very quickly
(less than 5
seconds)
Quickly (5-15
seconds)
OK (16-45
seconds)
Slowly (1-3
minutes)
Very slowly
(more than 3
minutes)
Clark and Washoe Access Speed
Washoe
Clark

23
interactive whiteboards. Interestingly, 15% of respondents were unsure about
the availability of these technologies in their own school.
Technical support is another important consideration as teachers try to
integrate technology into the classroom. Overall, teachers tend to agree with
statements such as The system in place for technical support is adequate
(Figure 7) and The computers in my classroom are in good working condition
(Figure 8).
Figure 7
Figure 8
0.0%
5.0%
10.0%
15.0%
20.0%
25.0%
30.0%
Strongly
Agree
Agree Slightly
Agree
Neutral Slightly
Disagree
Disagree Strongly
Disagree
Time Required to Get Technical Support is Minimal
0.0%
5.0%
10.0%
15.0%
20.0%
25.0%
30.0%
35.0%
Strongly
Agree
Agree Slightly
Agree
Neutral Slightly
Disagree
Disagree Strongly
Disagree
Technical Support System in Place is Adequate

24
Since Clark has a unique approach, site-based support through the
Educational Computing Strategist, it is informative to evaluate how their
results differ in some of these categories. For example, the Clark teachers are
more likely to agree with statements regarding the adequacy of technical
support in their school (see Figure 9). Teachers also have more positive views
of the time required to get assistance (see Figure 10).
Figure 9
Figure 10
0.0%
5.0%
10.0%
15.0%
20.0%
25.0%
30.0%
35.0%
Strongly
Agree
Agree Slightly
Agree
Neutral Slightly
Disagree
Disagree Strongly
Disagree
Time Required to Get Technical Support is Minimal
Clark
All Other
0.0%
5.0%
10.0%
15.0%
20.0%
25.0%
30.0%
35.0%
Strongly
Agree
Agree Slightly
Agree
Neutral Slightly
Disagree
Disagree Strongly
Disagree
Technical Support System is Adequate
Clark
All Other

25
Frequency of Technology Use
Given this access to technology and technical support, what is the probability
that a visitor will find teachers using the technology in their teaching? What is
the probability that a visitor would find the students using technology? To
address this question, teachers were asked to consider their most recent 60
minutes of instructional time. First, they were asked if during that time they
had used a computer or the Internet for instructional purposes. Across the
state, 56% of the respondents reported using the computer for instructional
purposes and 48% reported using the Internet.
Thirty-five percent of the teachers reported having students use computers
during the most recent 60 minutes of instructional time. Of those classrooms
where students were using computers, the most typical arrangement was one
where every student had a computer (see Figure 11).
Figure 11
Fewer than 1/4
of the students.
19%
Approximately
1/4 of the
students. 13%
About 1/2 the
students.
8% About 3/4 of
the students.
11%
All of the
students.
49%
Configurations of Student Computer Use

26
Teachers were also asked to describe the number of times that same class (the
most recent one) had used technology during the past academic year (see
Figure 12).
Figure 12
As one might expect, teachers with better access to technology are more likely
to integrate technology in the classroom. Access to computers in the classroom
and technical support were all related to the frequency with which teachers
would engage students in computer-based activities.
Never
14%
1-10
34%
11-20
13%
21-40
(Weekly)
14%
41-80 (Twice
a week)
10%
80+ (3-5 Times
a week)
16%
Number of Time Computers Were Used in the
Classroom This Academic Year
27
Preparation & Professional Development
A key concern regarding the use of technology to support learning is the
capacity of the teacher to utilize the tools effectively. Developing this capacity
in Nevada requires effective teacher preparation programs, systematic
professional development, and ongoing support.
Preparation
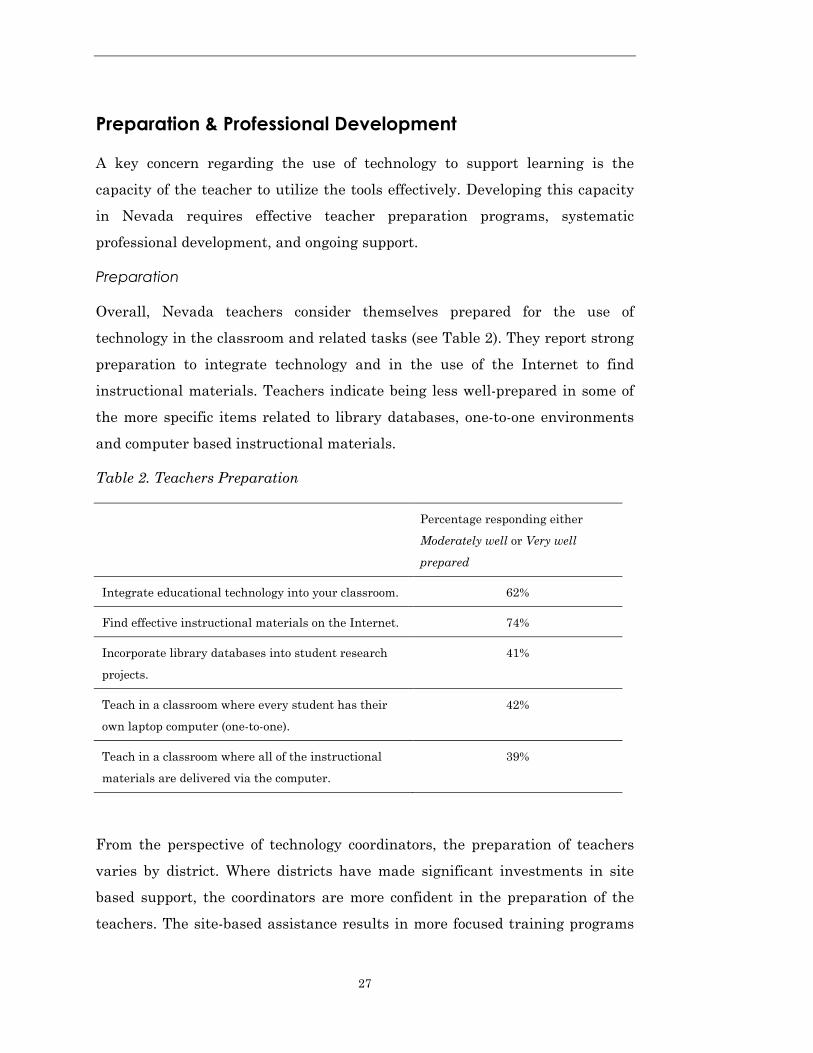
Overall, Nevada teachers consider themselves prepared for the use of
technology in the classroom and related tasks (see Table 2). They report strong
preparation to integrate technology and in the use of the Internet to find
instructional materials. Teachers indicate being less well-prepared in some of
the more specific items related to library databases, one-to-one environments
and computer based instructional materials.
Table 2. Teachers Preparation
Percentage responding either
Moderately well or Very well
prepared
Integrate educational technology into your classroom. 62%
Find effective instructional materials on the Internet. 74%
Incorporate library databases into student research
projects.
41%
Teach in a classroom where every student has their
own laptop computer (one-to-one).
42%
Teach in a classroom where all of the instructional
materials are delivered via the computer.
39%
From the perspective of technology coordinators, the preparation of teachers
varies by district. Where districts have made significant investments in site
based support, the coordinators are more confident in the preparation of the
teachers. The site-based assistance results in more focused training programs

28
and much more extensive one-on-one activities. The formal preparation that
teachers are receiving is somewhat of a mystery to some of the technology
coordinators. It is not clear to many coordinators what is occurring in teacher
preparation programs regarding technology. It is worth noting that acceptance
of a common set of standards (e.g., ISTE – NETS for Teachers) would help a
great deal in establishing common ground across and within institutions.
Professional Development
Teachers in Nevada have access to a wide variety of professional development
opportunities. In addition, the technology coordinators in the state have a clear
sense of the importance of professional development. Overall, teachers seem
pleased with the quantity of the opportunities available but are frustrated due
to the inability to take advantage.
Table 3. Professional Development Frequency
Which of the following professional development
opportunities have been available to you during the
current school year?
Percentage responding
Yes
One-on-one training from a technology specialist. 26%
Online professional development courses. 33%
Informal training from colleagues. 52%
Inservice training related to technology. 56%
A large number of coordinators and teachers noted how difficult it is to find
time for professional development activities. Many teachers would like to be
doing much more but do not feel they can justify the time it takes to learn new
technologies or plan technology based activities.
One interview with a teacher at a technology-rich school was telling in how
powerful time to learn can enhance a school. This particular school has been
successful at earning grants to support not only new technologies, but travel to
technology conferences. The technology conferences were very successful in
getting teachers engaged in the process and seeing what can be done. Others

29
noted this need for modeling of effective uses. Unfortunately, due to budget
constraints and teacher shortages, these types of professional development
opportunities rarely occur.
Teachers were somewhat critical of the quality of professional development
opportunities available. When asked to rate the quality of the professional
development opportunities from very high to very low on a 7-point scale,
teachers gave the lowest marks of any item on the survey. On comparable
items in the survey, teachers more frequently responded on the positive side of
the ratings (i.e., high). This indicates that professional development quality is a
significant concern for teachers. This finding was consistent across professional
development providers such as schools, districts and the regional professional
development programs (Figure 13). Although still rated quite low, higher
education did receive moderately higher ratings. This may be due in part to the
more focused and extended nature of college classes. These are characteristics
that many teachers and coordinators noted are missing from school and district
professional development options.

30
Figure 13
0.0
10.0
20.0
30.0
40.0
Professional Development Quality - District
0.0
10.0
20.0
30.0
40.0
Professional Development Quality - School
0.0
10.0
20.0
30.0
40.0
Professional Development Quality - RPDP
0.0
10.0
20.0
30.0
40.0
Professional Development Quality - Higher Ed

31
This finding is consistent with a large-scale study of US federally funded
Eisenhower projects that identified various factors associated with successful
professional development (Garet, Porter, Desimone, Birman & Yoon, 2001)
including:
(1) The duration of the activity (both time per session and number of
sessions). Findings indicate that longer is better.
(2) Collective participation of groups of teachers from the same school,
department, or grade was found to be more effective than individual
participation.
(3) Active learning opportunities were associated with effective
professional development.
(4) Content focus was deemed more effective than generic teaching
strategies not tied to particular content areas.
(5) Coherence is the degree to which the activity is tied to school goals,
policies, standards, etc. The greater the coherence for teachers, the
more effective is the professional development.

32
Additional Observations
Through the course of the project, questions beyond the original proposal were
raised in discussions with commissioners and technology coordinators. These
questions are addressed below with the caveat that the conclusions are based
on limited information and lacked the more systematic evaluation plan used to
address the prior questions.
Parent Perception of Technology and Schools
Parent’s perception and expectations of technology in schools is likely shaped
by a number of factors. These include what they hear from their own child,
what they see in the media, and how the school presents itself (both in the
building and on the Internet).
Given the emphasis on the importance of technology to society, most parents do
expect their child to learn a good deal about computers in schools. The results
of a parent survey supported this notion. They expect technology to be used
regularly during school. What they hear from their children is that much of
what is done on the computer is testing. There was limited evidence of any in-
depth activities going on with technology.
Parents are also concerned about safety online. Their own experiences with the
Internet and what they hear from the media lead them to believe this powerful
tool needs to be approached with caution. However, most of them view this as a
reason to do more with the technology rather than less.
Parent’s views are also shaped by how the schools present themselves.
Computer labs, interactive whiteboards, and laptop carts are often featured in
parent newsletters, tours, and school websites. Ironically, the web sites for
these schools, while very prominent often present a distinctly unprofessional
image to visitors. Through the course of this evaluation over fifty school web
sites were accessed in an attempt to clarify inconsistencies in staffing. While
this does not represent a systematic evaluation of Nevada school web sites, it is
clear that many of them are out of date, poorly designed, and provide extremely
limited information.

33
Use of Technology and the Relationship to Student Outcomes
The purchase of technologies for schools represents a massive investment by
taxpayers. They expect evidence that the investments are rewarded with
commensurate returns in student outcomes. However, the difficulty in making
causal connections between investments in technology and test scores cannot
be overstated.
Technology money allocated by the state has been used for a wide variety of
initiatives in the state. Allocations have been spent for technology coordinator
training, online teacher training, laptop carts, interactive whiteboards, and a
myriad of software titles just to name a few. Thus, any evaluation of these
activities should focus on the particular initiatives and goals of the funded
projects. The recent Evaluation of Educational Technology in Nevada Report
conducted by Shepperdson and Associates (2007) is one possible source of
information regarding specific initiatives.
In terms of more general conclusions regarding investments in technology, the
teacher survey conducted here may provide some useful information regarding
the impact of technology in schools. One notable finding from the data
collected in this survey is the relationship between the use of computers and
student attendance. In elementary schools where teachers report using
computers more frequently with students, the student attendance tends to be
significantly higher (see Figure 14).

34
Figure 14
90
91
92
93
94
95
96
97
98
1-10 Times a
year
11-20 Times
a year
Weekly Twice a Week 3-5 Times a
Week
Average Daily Attendance and Computer Use

35
Conclusions
The overall assessment of educational technology needs in Nevada is a
combination of optimism and frustration. A number of initiatives and
experiences have prompted Nevada educators to be optimistic that technology
can prove to be a valuable tool in addressing the many challenges in
classrooms. The advances in technology and the growing capacity of teachers
indicate that some of the requirements for a technology rich educational
experience are being established.
This optimism is tempered with the realization that the infrastructure is not in
place to maintain and support systematic and wide scale implementation of
computer technologies. The most encouraging experiences described by
coordinators and teachers were those in which individual students (or at a
minimum pairs of students) had their own computer. The information gathered
indicates that this configuration is very rare in Nevada schools.
Frustration is also noted when one looks at the larger picture of technology
implementation requirements. Nevada districts distribute resources in
different ways. What is similar is that no one school district has been able to
distribute it in a way that produces a dependable model for technology
integration. While some districts emphasize professional development and
support, they are generally left with too few computers to take advantage of
their skills. Other districts have invested heavily in hardware only to find the
use limited due to an inability to get teachers trained.
Moving forward, the state would benefit from increased coordination and
collaboration between the districts. This may be even more beneficial if done
between districts of similar sizes. While there are some common issues that all
districts face, more frequently the challenges and possible solutions are tied to
the size of the student population. Districts naturally look to the state to
provide a mechanism to support these collaborations. However, from the
perspective of the district technology coordinators, the Nevada Department of
Education is not staffed to provide substantive contributions to state
technology initiatives.

36
References
Anstee, J. & Christiansen, E. (2007) WCSD Technology Use Survey Overview.
Technical Report prepared by the University of Nevada, Reno Center for
Program Evaluation.
Becker, H. J. (1999). Internet use by teachers: Conditions of professional use
and teacher-directed student use. Teaching, Learning and Computing:
1998 National Survey.
Dwyer, D. (1994). Apple classrooms of tomorrow: What we've learned.
Educational Leadership, 51(7), 4-10.
Garet, M.S., Porter, A.C., Desimone, L., Birman, B, & Yoon, K.S. (2001). What
makes professional development effective? Results from a national
sample of teachers. American Education Research Journal, 38, 915–945.
Muir, M., Owen, A., Knezek, G., Christensen, R., Soloway, E., & Norris, C.
(2006). Lessons learned from 1-to-1 laptop initiatives: Reflections on
the critical components. In C. Crawford et al. (Eds.), Proceedings of
Society for Information Technology and Teacher Education
International Conference 2006 (pp. 4366-4371). Chesapeake, VA: AACE.
Shepperson, T, Thronton, W., Crippen, K., Hill, G. & Usinger, J. (2007).
Evaluation of Educational Technology In Nevada. Technical Report for
the Nevada Legislative Counsel Bureau.
Trotter, A. (2008). Companies Targeting Low-Cost ‘Netbooks’ Directly at
Education. Education Week. Accessed online:
http://www.edweek.org/ew/articles/2008/04/23/34laptop_ep.h27.html

37
Appendices
Appendix A - Teacher Survey
The majority of the survey items were drafted by the authors to directly
address the research questions. Questions designed to measure the teaching
philosophy of teachers were based upon items from Becker’s (1999) Teaching,
Learning and Computing survey. These initial items were then revised based
upon feedback from content and assessment experts. The revised survey was
then evaluated by 16 educational technology experts. The final version of the
survey was developed based upon the results of this evaluation.
A purposeful sample of 132 Nevada schools were identified through the
following process. In school districts with fewer than 1000 students, all of the
schools and classroom teachers were surveyed. In districts with a student
population between 1000 and 10,000, 2 elementary schools, 1 middle school
and 1 high school were randomly chosen. In districts with enrollments in
excess of 10,000, 20% of the schools were randomly selected.
The names of classroom teachers were identified through the Nevada 2007-
2008 Directory of Licensed Personnel. Only classroom teachers where a
legitimate email address could be identified were included in the study. The
sampling was conducted in a manner that insured a cross-section of classroom
teachers were invited to participate.
Teacher Selection Parameters:
1. Elementary personnel with an assignment code of 101-105 (grade 1-5)
2. Secondary personnel with a non administrative or special services code
(< 600)
3067 teachers were sent email invitations to participate. 1478 teachers (49%)
provided usable responses to the survey invitation. 398 of these respondents
did not complete the entire survey. Partial responses were included in the
analysis.

38
Technology Coordinators Survey
Twenty-seven open-ended questions were drafted by the authors to address the
research questions. Each district was asked to designate at least one district
technology representative to complete a survey regarding the use of technology
in the school district. Thirteen designees completed the survey (Appendix D).
Interviews
Eight individual interviews were conducted to address the research questions.
Five of these were with district technology coordinators, two with school based
coordinators and one with a technology representative from the NDE. In
addition, a focus group session was conducted with four representatives from
the Clark County School District. Each interview and focus group was guided
by an interview protocol based upon the original research questions. These
sessions were recorded by computer. Notes were taken during the session and
later augmented with notes from a subsequent review of the recording.
An additional focus group was conducted with assessment experts from NDE
and Measured Progress. This session focused specifically upon the potential for
Nevada schools to move towards computer-based testing in state exams such as
the High School Proficiency Exam.
Parent Survey
A seven item survey was developed to measure parent’s perceptions of the use
of technology in Nevada schools. An invitation to participate was sent to
twenty nine parents known to have school-aged children. Four completed the
survey.

39
Appendix B – Teacher Survey Items
In my classroom, I have a computer that I can use for administrative tasks
(e.g., attendance, lesson planning). (Yes/No)
In general, I find this computer easy to use. (strongly agree – strongly
disagree)
How old is this computer?
In my classroom, I have at least one computer that students can use for
instructional purposes. (Yes/No)
What is the average age of the computer(s) the students use?
What is the ratio of students to computers during a typical class?
How many computers do you have in your classroom (do not include the
computer you use for administrative tasks)?
In general, these computers are easy to use. (strongly agree – strongly
disagree)
The computer(s) in my classroom have Internet access. (Yes/No)
The connection speed for classroom computers is such that typical online
videos will begin playing . . . (very quickly – very slowly)
The LCD Projector is easy to setup. (strongly agree – strongly disagree)
What comments do you have regarding the technology capacity in your
classroom?
Please indicate how well prepared you feel you are to accomplish the
following. (very well prepared – not at all prepared)
• Teach in a classroom where every student has their own laptop
computer.
• Access and use state assessment data (e.g., CRT scores) to support
instructional decisions.
• Access and use district assessment data (e.g., for Clark, IDMS) to
support instructional decisions.
• Teach in a classroom where all of the instructional materials are
delivered via the computer.
• Find effective instructional materials on the Internet.
• Integrate educational technology into your classroom.
• Incorporate library databases into student research projects.
Which of the following professional development opportunities have been
available to you during the current school year?

40
• One-on-one training from a technology specialist.
• Informal training from colleagues.
• Inservice training related to technology.
• Online professional development courses.
Estimate the number of hours you have participated in available technology
professional development activities during the current school year.
• One on one training from a technology specialist.
• Informal training from colleagues.
• Inservice training related to technology.
• Online professional development courses.
• One on one training from a technology specialist.
How would you rate the quality of the technology related professional
development opportunities offered by the following entities?
• District
• Local higher education institutions
• Regional Professional Development Program
• School
Different teachers have described very different teaching philosophies to
researchers. For each of the following pairs of statements, select the point
that best shows how closely your own beliefs are to each of the statements
in a given pair. The closer your beliefs to a particular statement, the closer
the option you select. (see Becker, 1999).
What comments do you have regarding your preparation and professional
development opportunities?
Please rate your agreement with the following statements as they relate to
your technology professional development opportunities. (strongly agree –
strongly disagree)
• They are appropriate for content I am expected to teach.
• The activities focus on general integration strategies.
• They are appropriate for the grade level of my students.
• They generally provide me with opportunities to try what I've
learned.
• The activities are ongoing.
• They are best described as 'one-shot' presentations.
• The different activities are a part of a larger related plan.
• They provide opportunities to work with other teachers in my
content area.
• They provide opportunities to work with other teachers in my grade
level.
• Activities are frequently targeted to specific strategy or method.
• The activities are directed towards the needs of my grade level.
• The activities are directed towards the needs of my school.
Indicate whether or not the following are true as they relate to your most

41
recent 60 minutes of classroom time. (Yes/No)
• I used a computer for instructional purposes.
• I used the Internet for instructional purposes.
List the five most recent computer applications or web sites that your
students used in your class.
List the five most recent computer applications or web sites that you used
in your class.
On how many days since the beginning of the school year has a typical
student in this particular class (the one you last taught) used a computer
for instructional purposes?
Typically, how many students operate any one computer at one time during
this class?
What comments do you have regarding your use of technology?
During your most recent 60 minutes of classroom time students used a
computer for instructional purposes. (Yes/No)
How many students used computers?
Which of the following technologies do you have in your classroom all the
time. (Don't include items you can check out or get from other places. We'll
ask about these items on the next page).
• Digital camera
• Digital video camera
• An LCD projector
• A device that allows me to project my computer screen on the TV
• An interactive whiteboard (e.g., SmartBoard or Promethean)
Rate your level of agreement with the following statements
• The system in place for technical support is adequate.
• The time required to get technical assistance is minimal.
• The computers in my classroom are in good working condition.
• I can manage the majority of the technical issues that arise with my
classroom computers.
• The Internet connection in my classroom is dependable.
• I can access the web sites I need for instruction.
Through a sign up or check out procedure, I can arrange to have the
following technologies available for a finite time in my classroom. (Yes/No).
• A video camera
• A digital camera
• An interactive whiteboard (e.g., SmartBoard or Promethean
Activboard)
• An LCD projector

42
• A classroom set of laptop computers
• A set of laptop computers that permits group work (i.e., one
computer per group of 3-5 students)
I believe the Internet filter used at my school is (too restrictive, about right,
not restrictive enough)
Rate the ease of accomplishing the following tasks from your classroom
computer.
• Checking my school email account via the Web browser.
• Printing and copying documents.
• Accessing storage space on the school network.
• Students accessing storage space on the school network.
• Printing documents.
• Reviewing standardized assessment results for my students.
• Updating grades with our gradebook software.
• Using technology to collaborate with other teachers on the
development of instructional materials.
Do you regularly plan lessons with other teachers who teach the same level
or content area? (Yes/No)
In what ways do you coordinate this work?
• Using web-based tools that permit document sharing (e.g., Google
Docs).
• Using a shared space on the school network.
• Emailing files.
• Printing and copying documents.
Do you have access via the Internet to the following materials? (Yes/No)
• District content objectives.
• Lessons developed by other district teachers.
• District curriculum materials.
• Videos related to the curriculum.
What comments do you have regarding the technology capacity in your
school?

43
Appendix C – Coordinator Interview Protocol
Questions Response Notes Tech Plan Notes
1. What is the current status of the district (or
school) educational technology plan? (NOTE:
Districts representatives can speak about
the district plan, school technology
coordinators may be able to discuss school
and district plans).
1. When was your district educational
technology plan last updated?
2. What measurable goals were included
and what, if any, data was collected?
3. How well aligned is your district plan
with the state and national
educational technology plans?
4. How well did the district plans support
planning for technology integration?
5. How well did the district plans
subsequently impact achievement?
2. In what ways can educational technologies
improve instructional development, delivery,
and assessment in your district and/or
school?
1. Is your district using any computer-
based assessments at this time?
(Please describe)
1. What would your reaction be
to the use of computer-based
assessments for the high
school proficiency exam (if
applicable, or CRT's for elem
coord)
1. Advantages
2. Disadvantages
2. Is your district currently involved in
any laptop initiatives (e.g., 1-1 or
laptop carts)?
3. Is your district currently involved in
any initiatives to replace traditional
textbooks with electronic content?
4. Is your district currently involved in
any initiatives to use of web-based
collaborative technologies to support
teachers’ lesson planning?

44
3. Capacity of the district (or school) in Nevada
1. What is the probability that a
classroom teacher in your district (or
school) at any given moment will
have in their classroom:
1. A computer that is less than
five years old, internet
connected, and currently in
good working condition?
Filtering?
2. A ratio of students to
computers in the classroom
that is less than 5 to 1
3. A projection device that
permits all of the students in
the classroom to view the
computer display and
requires minimal setup in
terms of time and expertise
4. Access to timely, dependable
and effective technical
support?
2. What is the probability that a
classroom teacher in your district (or
school) will have on any given day:
1. Utilized technology to
support the delivery of a
lesson?
2. Asked students to utilize
technology to complete and
individual activity?
3. Asked students to utilize
technology to complete an
activity that requires
students to engage in
analytic or evaluative tasks.
3. What are the relationships between
the access and use?
1. Is this a direct relationship
or are their other factors?

45
Appendix D – Technology Coordinator Survey
(1) Describe the role of the current state educational technology plan in
the design, delivery and planning of educational technology in your
district.
(2) Describe the role of the current district educational technology plan
in the design, delivery and planning of educational technology in
your district.
(3) Do the schools in your district typically engage in significant
technology planning? If so, how does this occur? Do they have school
technology plans? Do they have technology committees?
(4) Describe the status of planning for technology in your district. What
are the major challenges?
(5) Describe in general terms the funding for technology in your
district. What are the major sources of funding? Is the funding
consistent and predictable?
(6) What other comments do you have regarding technology planning in
your district?
(7) What do you see as the opportunities and challenges associated with
increasing the use of computer-based assessments in your district?
(8) What do you see as the opportunities and challenges associated with
the expanded use of laptops to supplement and in some instances
replace textbooks?
(9) Would the expanded distribution of laptop computers have a
positive impact on student outcomes? Why or why not?
(10) What are some of the more advanced ways teachers in your district
are utilizing the Internet to improve student outcomes?
(11) What are some of the greatest challenges associated with the
increased use of the Internet for teachers in your district?

46
(12) Are teachers in your district using the Internet to collaborate with
other teachers in your district? If yes, how?
(13) What are some of the most important ways teachers can utilize the
web to support teaching?
(14) What other comments do you have regarding the role of technologies
in your district classrooms?
(15) In the following three text boxes, describe three relatively common
classrooms that a visitor might see in your district. The three
classrooms should represent your view of the low, middle and top in
terms of technology availability in your district. In your description
include the approximate number, age and condition of the
computers in the room, the presence or absence of a projector, the
Internet connection capacity and any other technologies that might
be available.
a. Common Low-end classroom
b. Common middle classroom
c. Common high-end classroom
(16) Next to each of the designations below, provide a number that
represents the approximate percentage of classrooms that closely fit
the description.
(17) What role does open source software such as OpenOffice, Apache or
Firefox have in your district's technology planning?
(18) What support is available to teachers when they need technical
assistance in their classroom?
(19) What other comments do you have regarding the technology
capacity your district classrooms?
(20) What type of professional development is available to teachers in
your district?

47
(21) Describe what you believe are the key components to effective
professional development.
(22) How do these key components compare to the professional
development opportunities you are able to provide to teachers?
(23) Is there anything else you would like to share before completing the
survey?
Appendix E – Parent Survey
(1) Does your student regularly use technology to complete homework?
If so, what types of activities do they complete?
(2) Does your student use technology regularly in school? If so, what
types of activities do they complete?
(3) What are your expectations regarding technology use in schools?
Are these expectations being met?
(4) What other comments do you have regarding the use of technology
in your students school?
(5) What are your concerns regarding your student's use of technology
in school?
(6) What school district is your student enrolled in?
(7) What level school is your child currently enrolled in? If you have
multiple children in school, select all the applicable levels.