educational opportunities in hard times - ucla/idea
TRANSCRIPT
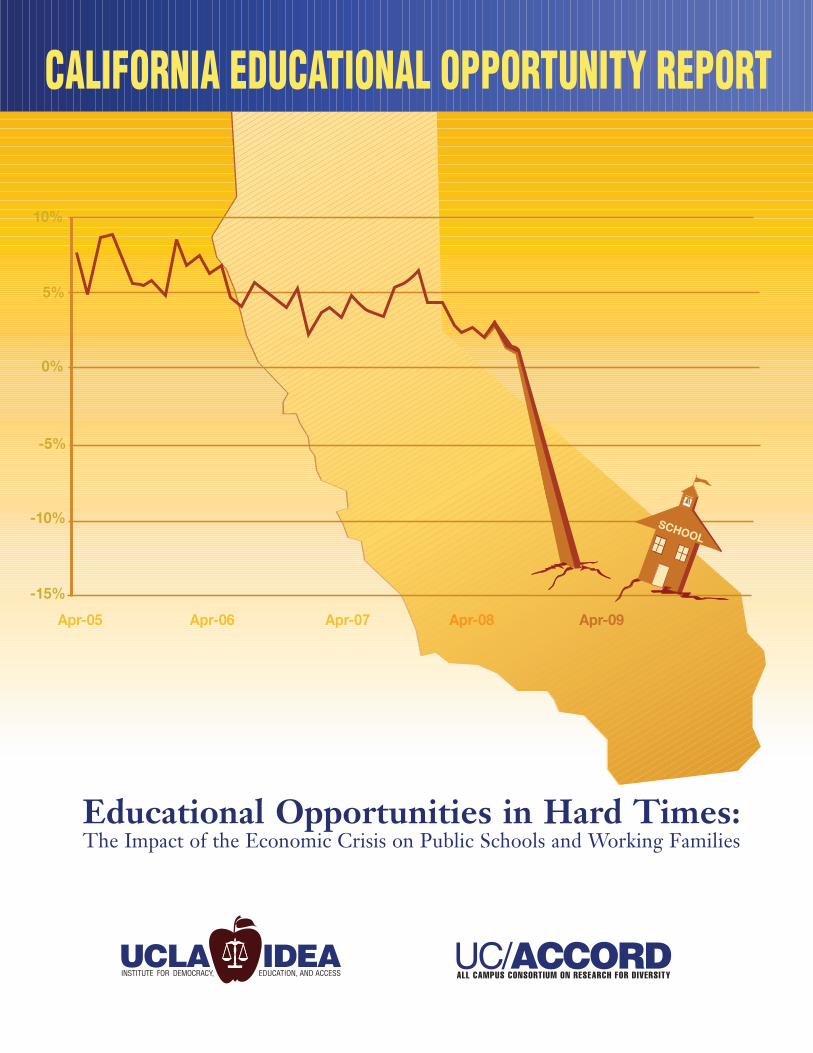
Educational Opportunities in Hard Times:The Impact of the Economic Crisis on Public Schools and Working Families

UC/ACCORDALL CAMPUS CONSORTIUM ON RESEARCH FOR DIVERSITY
Recommended Citation Format:
Rogers, J., Fanelli, S., Freelon, R., Medina, D., Bertrand, M., Del Razo, M. (2010). Educational Opportunities in Hard Times: The Impact of the EconomicCrisis on Public Schools and Working Families. Los Angeles: UCLA IDEA, UC /ACCORD.
By: John Rogers, Sophie Fanelli, Rhoda Freelon, David Medina,Melanie Bertrand, Maritza Del Razo
January 2010
Copyright © 2010UCLA’s Institute for Democracy, Education, and AccessUC All Campus Consortium on Research for Diversity
To access this report online, please visit http://www.edopp.org
UCLA IDEA and UC/ACCORD1041 Moore Hall, Box 951521, Los Angeles, CA 90095
phone: (310) 206-8725 fax: (310) 206-8770 email: [email protected]
Support for the California Educational Oportunity Report was provided by:The William and Flora Hewlett Foundation, The Ford Foundation,
and the University of California.
Educational Opportunities in Hard Times:The Impact of the Economic Crisis on Public Schools and Working Families
INSTITUTE FOR DEMOCRACY, EDUCATION, AND ACCESS
CALIFORNIAEDUCATIONALOPPORTUNITY
REPORT
The Impact of the Economic Crisis on Public Schools and Working Families
UCLA/IDEA and UC/ACCORD 1
EXECUTIVE SUMMARY
“It’s the bleakest I’ve ever seen.” — Principal of a southern California high school describing the impact of the recession on her school and students
Even before the current recession began, California public schools were ill-equipped to meet the learning and social welfare needs of many students. Consider this brief glimpse of California’s serious education challenges and standing compared to the rest of the nation just a year and a half ago:
Before the recession: One in six California students lived in families that earned below the federal poverty level, and
more than a half lived in families with earnings that qualified students for the federal Free and Reduced Lunch Program.
Many California students experienced unstable housing and lack of secure access to food. Ranking 46th of all states in per-pupil expenditures, California provided its students with less
access to quality learning conditions than the rest of the nation. California’s middle school and high school classrooms were more overcrowded than classrooms
in any other state. California’s high school counselors served more students than counselors anywhere else in the
nation. While almost all California students received less than students in other states, students
attending schools serving primarily low-income Latino, African American, and American Indian students were the most likely to experience critical problems in their schools. For example, such schools were eight times as likely as other schools in the state to face severe shortages of qualified teachers.
Now:Today, these conditions, challenges, and comparisons are worse. Much worse. Today, for example, one in four California students lives in poverty and is likely attending a school with reduced funding, larger classes, and fewer instructional materials.
To illuminate the current “real time” effects of the recession on California children and public schools, UCLA’s Institute for Democracy, Education, and Access (IDEA) conducted interviews with a representative sample of 87 principals from across the state. The immediacy of these interviews removes a certain abstraction that often accompanies data reports on California’s schools. The principals speak of conditions that children face today, on Monday morning when the school bell rings, and when they leave school and return to their families.
The principals in our study lead public schools that proportionately represent California’s wide diversity of geography, school size, school type, and student demographics. Our interviews reveal common themes across the socio-economic and demographic diversity of the principals’ communities and differences in the degree of impact on families and school programs.
Educational Opportunities in Hard Times:
UCLA/IDEA and UC/ACCORD2
Key findings include:
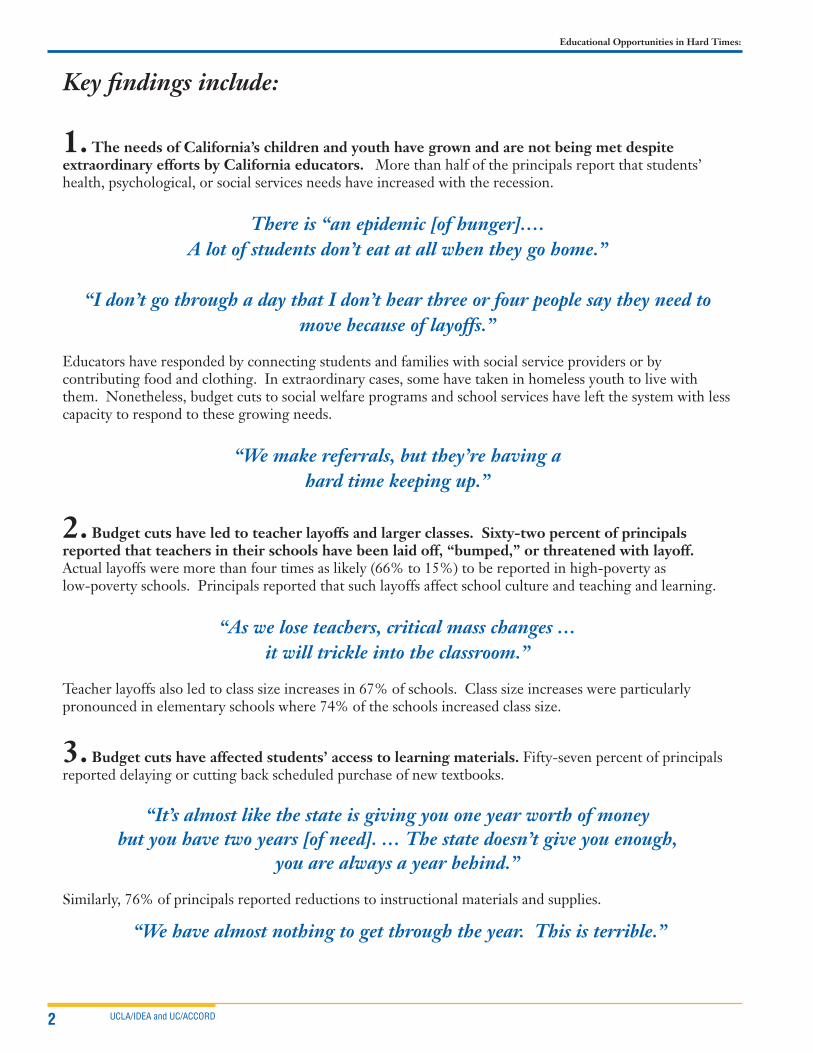
1. The needs of California’s children and youth have grown and are not being met despite extraordinary efforts by California educators. More than half of the principals report that students’ health, psychological, or social services needs have increased with the recession.
There is “an epidemic [of hunger]…. A lot of students don’t eat at all when they go home.”
“I don’t go through a day that I don’t hear three or four people say they need to move because of layoffs.”
Educators have responded by connecting students and families with social service providers or by contributing food and clothing. In extraordinary cases, some have taken in homeless youth to live with them. Nonetheless, budget cuts to social welfare programs and school services have left the system with less capacity to respond to these growing needs.
“We make referrals, but they’re having a hard time keeping up.”
2. Budget cuts have led to teacher layoffs and larger classes. Sixty-two percent of principals reported that teachers in their schools have been laid off, “bumped,” or threatened with layoff. Actual layoffs were more than four times as likely (66% to 15%) to be reported in high-poverty as low-poverty schools. Principals reported that such layoffs affect school culture and teaching and learning.
“As we lose teachers, critical mass changes … it will trickle into the classroom.”
Teacher layoffs also led to class size increases in 67% of schools. Class size increases were particularly pronounced in elementary schools where 74% of the schools increased class size.
3. Budget cuts have affected students’ access to learning materials. Fifty-seven percent of principals reported delaying or cutting back scheduled purchase of new textbooks.
“It’s almost like the state is giving you one year worth of money but you have two years [of need]. … The state doesn’t give you enough,
you are always a year behind.”
Similarly, 76% of principals reported reductions to instructional materials and supplies.
“We have almost nothing to get through the year. This is terrible.”

The Impact of the Economic Crisis on Public Schools and Working Families
UCLA/IDEA and UC/ACCORD 3
4. Programs outside the instructional core (of reading and math) were cut back or eliminated, with many costs shifted to parents. Seventy percent of principals reported that summer school was reduced or eliminated. High-poverty schools were almost three times as likely (49% to 17%) as low-poverty schools to eliminate summer school outright. At times, this elimination of summer school was quite dramatic. Students in one Central Valley elementary school were “literally told to go home.” In addition, roughly half of principals surveyed reported reductions to after school programs, field trips, art and music.
[Programs are] “hanging by the skin of their teeth.”
5. Seventy percent of the principals report reductions to professional development. Many described how budget cuts limited instructional improvement.
“Principals [are] dealing with problems on campus instead of focus[ing] on student learning as we should be and the state is mandating us to do. It’s less resources,
more distractions, while trying to run the school.”
6. Local strategies aimed at filling budget gaps are likely to exacerbate inequalities. On average, low-poverty schools in our study received $167,797 in donations, or roughly eight times as much as high-poverty schools which received $21,319.
These findings point to tremendous needs of California students and California public schools—needs that the federal government is best positioned to address in the short term. The short term is crucial for the millions of students who can’t wait for the economy to improve. They only get one chance to have a high-quality and equal education. But California also needs to reform its system for funding public schools.
“I’ve lived in California most of my life and I find it hard to believe how bad we have become with our funding for education.”
This report represents the fourth annual California Educational Opportunity Report produced by UCLA’s Institute for Democracy, Education, and Access (IDEA) in partnership with UC/ACCORD. As in past reports, we examine the quality and distribution of educational opportunities across California’s public schools. A broader set of analyses of educational conditions and outcomes, including reports on each California legislative district and reports on each public high school and middle school in the state, can be found online at www.edopp.org.

Educational Opportunities in Hard Times:
UCLA/IDEA and UC/ACCORD4
Educational Opportunities in Hard Times: The Impact of the Economic Crisis on Public Schools and Working Families
I. IntroductionAs we enter the second decade of the 21st Century, the worst economic downturn since the Depression places new strains on California public schools and families. Needs are escalating as school budgets and social services are being cut.
The current economic downturn may not reach the levels of the Depression, but families and schools face similar challenges and disruptions. In the 1930s, educators joined students and parents to call for state governments to support social welfare and public schools. Many educators responded to the social problems unleashed by the failing economy. Detroit teachers collected shoes so students could attend class. Teachers in San Jose donated 5% of their salary to pay for students’ clothing, blankets, medicine, and food. But even as educators stepped up to meet the crisis, more budget cuts eroded educational programs and undermined the schools’ capacity to serve students. Millions of young people lacked stable housing and suffered from malnutrition. School facilities deteriorated, instructional materials were cut back, class sizes increased, and teachers were laid off. Critical educational programs and services—music, art, summer school—were often eliminated.1
Two factors make California students and public schools particularly vulnerable to today’s financial troubles. First, for several years California has had very low school expenditures relative to the rest of the country. Second, California entered the recession with a deep structural deficit. Taken together, California’s weak educational and fiscal infrastructure magnify the impact of the recession on the state’s students and its public schools.
Not surprisingly, this year’s Education Opportunity Report (the Report) finds deepened gaps between what California public schools and students need and what they receive. The Report addresses two questions. First, to what extent have California public schools been able to meet the growing social welfare needs of students and families in midst of recession? Second, how have budget cuts that have accompanied the recession impacted learning opportunities across California public schools?
In previous years, UCLA IDEA (in partnership with UC ACCORD) has produced the Report by analyzing publically accessible state and national data sets on learning conditions and outcomes across California public schools. While such data continue to offer a clear (and sobering) picture of the state of California’s public education, it cannot shed much light on the impact of the recession.2 Publicly available education data represents something of a lagging indicator when it comes to the recession. The most recent available data is at least a year old. Further, existing state educational data often is not collected in a manner meant to highlight the impact of economic downturns and budget cuts.
To illuminate the current, “real time” effects of the recession on California children and public schools, we conducted interviews with a representative sample of public school principals from across the state. Given their daily interaction with students and families as well as their programmatic responsibilities, principals are ideally situated to report
The Impact of the Economic Crisis on Public Schools and Working Families
UCLA/IDEA and UC/ACCORD 5
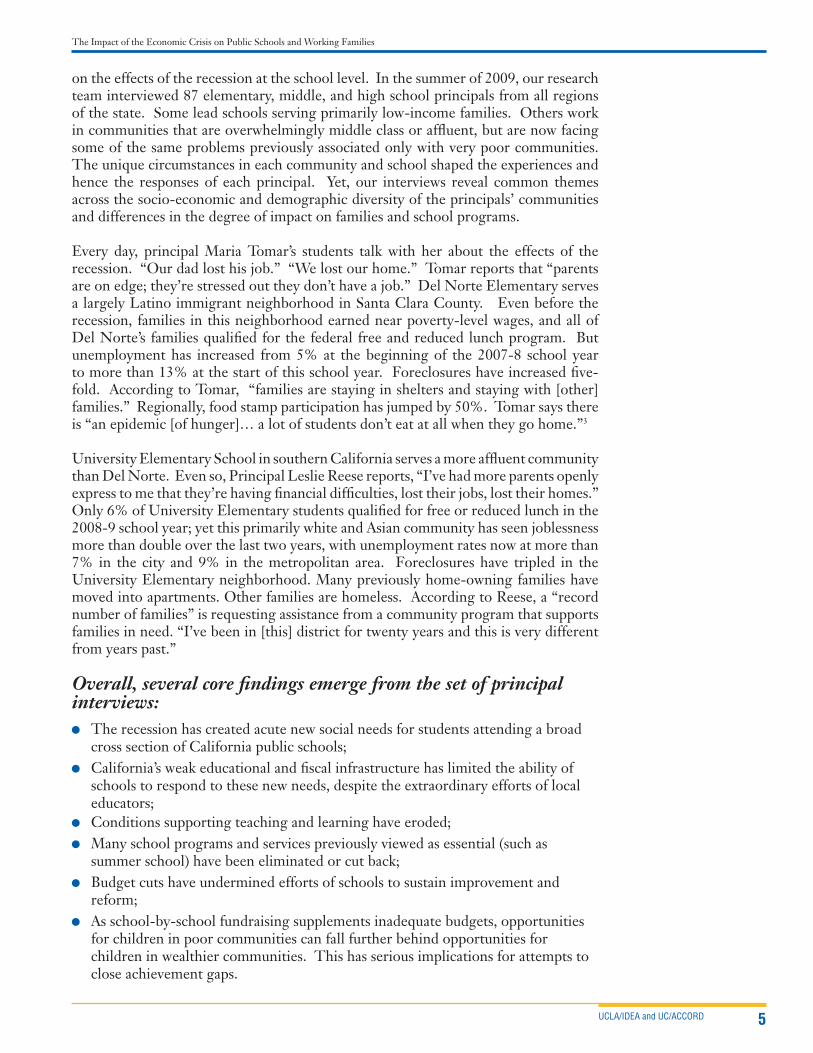
on the effects of the recession at the school level. In the summer of 2009, our research team interviewed 87 elementary, middle, and high school principals from all regions of the state. Some lead schools serving primarily low-income families. Others work in communities that are overwhelmingly middle class or affluent, but are now facing some of the same problems previously associated only with very poor communities. The unique circumstances in each community and school shaped the experiences and hence the responses of each principal. Yet, our interviews reveal common themes across the socio-economic and demographic diversity of the principals’ communities and differences in the degree of impact on families and school programs.
Every day, principal Maria Tomar’s students talk with her about the effects of the recession. “Our dad lost his job.” “We lost our home.” Tomar reports that “parents are on edge; they’re stressed out they don’t have a job.” Del Norte Elementary serves a largely Latino immigrant neighborhood in Santa Clara County. Even before the recession, families in this neighborhood earned near poverty-level wages, and all of Del Norte’s families qualified for the federal free and reduced lunch program. But unemployment has increased from 5% at the beginning of the 2007-8 school year to more than 13% at the start of this school year. Foreclosures have increased five-fold. According to Tomar, “families are staying in shelters and staying with [other] families.” Regionally, food stamp participation has jumped by 50%. Tomar says there is “an epidemic [of hunger]… a lot of students don’t eat at all when they go home.”3
University Elementary School in southern California serves a more affluent community than Del Norte. Even so, Principal Leslie Reese reports, “I’ve had more parents openly express to me that they’re having financial difficulties, lost their jobs, lost their homes.” Only 6% of University Elementary students qualified for free or reduced lunch in the 2008-9 school year; yet this primarily white and Asian community has seen joblessness more than double over the last two years, with unemployment rates now at more than 7% in the city and 9% in the metropolitan area. Foreclosures have tripled in the University Elementary neighborhood. Many previously home-owning families have moved into apartments. Other families are homeless. According to Reese, a “record number of families” is requesting assistance from a community program that supports families in need. “I’ve been in [this] district for twenty years and this is very different from years past.” Overall, several core findings emerge from the set of principal interviews:
The recession has created acute new social needs for students attending a broad cross section of California public schools;
California’s weak educational and fiscal infrastructure has limited the ability of schools to respond to these new needs, despite the extraordinary efforts of local educators;
Conditions supporting teaching and learning have eroded; Many school programs and services previously viewed as essential (such as
summer school) have been eliminated or cut back; Budget cuts have undermined efforts of schools to sustain improvement and
reform; As school-by-school fundraising supplements inadequate budgets, opportunities
for children in poor communities can fall further behind opportunities for children in wealthier communities. This has serious implications for attempts to close achievement gaps.
Educational Opportunities in Hard Times:
UCLA/IDEA and UC/ACCORD6
The remainder of this report is presented in four parts. First, we look at California’s educational infrastructure as it entered the recession. This section highlights a set of gaps between California and the rest of the nation, as well as between different groups of schools in California. Second, we describe how we conducted our principal interviews and how the schools represented in our study compare with California public schools generally. Third, we present the findings from our principal study, highlighting both the new social welfare needs created by the recession as well as the impact of the budget cuts. In this section we report common findings across all schools as well as differences between schools serving small proportions and large proportions of low-income families. We conclude the report with a set of implications for public policy.
II. The Context of Crisis: California’s Pre-Existing Education Gaps California’s public schools were characterized by a number of gaps prior to the onset of the current recession. That is, even before the recent budget cuts, California’s public education system lagged behind much of the nation, and quality of schools differed markedly across California’s communities. We have reported extensively on these gaps in previous California Educational Opportunity Reports. Below we highlight a few of the most consequential gaps compromising educational quality and equality in California. A broader set of analyses of educational conditions and outcomes, including reports on each California legislative district and reports on each public high school and middle school in the state, can be found online at www.edopp.org.
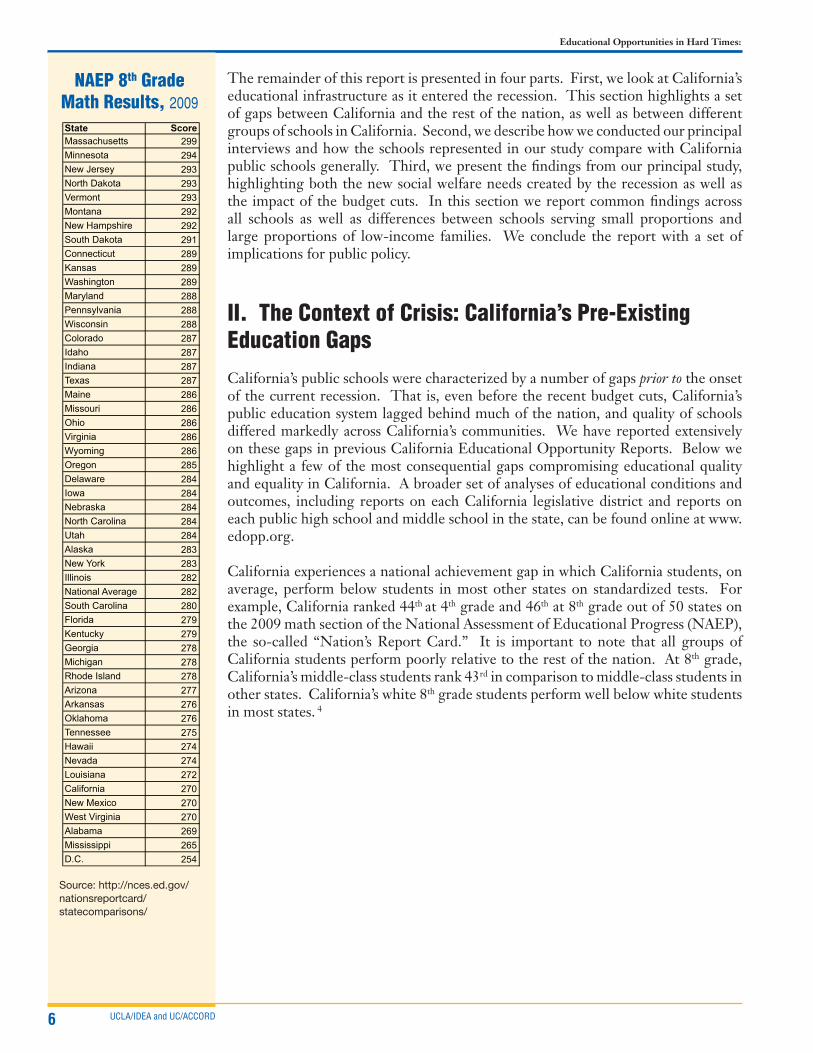
California experiences a national achievement gap in which California students, on average, perform below students in most other states on standardized tests. For example, California ranked 44th at 4th grade and 46th at 8th grade out of 50 states on the 2009 math section of the National Assessment of Educational Progress (NAEP), the so-called “Nation’s Report Card.” It is important to note that all groups of California students perform poorly relative to the rest of the nation. At 8th grade, California’s middle-class students rank 43rd in comparison to middle-class students in other states. California’s white 8th grade students perform well below white students in most states. 4
NAEP 8th Grade Math Results, 2009
Source: http://nces.ed.gov/nationsreportcard/statecomparisons/
State Score
Massachusetts 299
Minnesota 294
New Jersey 293
North Dakota 293
Vermont 293
Montana 292
New Hampshire 292
South Dakota 291
Connecticut 289
Kansas 289
Washington 289
Maryland 288
Pennsylvania 288
Wisconsin 288
Colorado 287
Idaho 287
Indiana 287
Texas 287
Maine 286
Missouri 286
Ohio 286
Virginia 286
Wyoming 286
Oregon 285
Delaware 284
Iowa 284
Nebraska 284
North Carolina 284
Utah 284
Alaska 283
New York 283
Illinois 282
National Average 282
South Carolina 280
Florida 279
Kentucky 279
Georgia 278
Michigan 278
Rhode Island 278
Arizona 277
Arkansas 276
Oklahoma 276
Tennessee 275
Hawaii 274
Nevada 274
Louisiana 272
California 270
New Mexico 270
West Virginia 270
Alabama 269
Mississippi 265
D.C. 254
h"p://nces.ed.gov/na0onsreportcard/statecomparisons/

The Impact of the Economic Crisis on Public Schools and Working Families
UCLA/IDEA and UC/ACCORD 7
California also has low rates of high school graduation and college going. Almost 550,000 students enrolled as 9th graders in California public schools in the fall of 2004. Four years later, 376,000 students graduated in June 2008, a little less than two thirds of the original cohort. About one quarter of the original cohort graduated eligible for a four-year college or university. In fall 2008, roughly one in eight enrolled as first-year students at a California State University or University of California campus. California graduates a smaller proportion of its high school students than most other states and sends fewer graduates directly to four-year colleges and universities than all but three states.5
CaliforniaClass of 2008: Pathway to College
59
2125
65
7685
94100
0102030405060708090
100
9thGrade
10thGrade
11thGrade
12thGrade
Grads2007
A-GGrads
CommunityCollege1st Year
CSU1st Year
UC1st Year
Per
cent
age
of 9
th g
rade
enr
ollm
ent
Sources: California Basic Education Data System and California Postsecondary Education Commission (CPEC)
Why is California on the wrong side of this national achievement gap? One critical reason is that California is on the wrong side of a national resource gap. Education Week ranked California 46th of all states in its spending for each student. In 2007, the most recent year for which national data is available, California spent 77% of the national average for each student and roughly half for each student of states such as Vermont and Rhode Island, who boast high graduation rates and high NAEP scores. 6
The resource gap leads directly to an educational opportunity gap. That is, California students lack critical educational opportunities provided to students in most other states. For example, California’s secondary classrooms were more overcrowded than classrooms in any other state prior to the recession and the most recent round of budget cuts. The average secondary teacher in California serves almost twice as many students as the average secondary teacher across the nation.7 This overall environment of scarcity exacerbates inequalities between different schools in the state. And combined with patterns of residential segregation, these differences produce a racial opportunity gap across California’s public schools. California’s public schools serving primarily Latino, African American, and American Indian students are much more likely to have inadequate conditions than schools enrolling a majority of white and Asian students. California schools serving 90% or more Latino, African American, and American Indian students are the most likely to be designated as critically overcrowded. These schools are eight times as likely as other schools in the state to face a severe shortage of qualified teachers, and are far more likely to have severe shortages of qualified college prep teachers and advanced placement classes.
Secondary Teacher– Student Ratios, 2009
Source: “Secondary” (grades 9-12) student-teacher ratios,http://nces.ed.gov/pubs2010/2010309.pdf
State
Student/
Teacher
Ratio
South Carolina 6.8
Kansas 7.6
D.C. 7.7
West Virginia 7.8
Wyoming 8.1
Rhode Island 8.2
Missouri 8.6
North Carolina 8.6
Vermont 8.6
New Jersey 8.9
Oklahoma 8.9
Delaware 9.2
Iowa 9.4
Pennsylvania 9.4
Wisconsin 9.4
Alabama 10.2
Arkansas 10.3
Georgia 10.3
Hawaii 10.3
Virginia 10.3
Mississippi 10.5
Texas 10.5
North Dakota 10.6
Maryland 10.8
Illinois 10.9
Ohio 11.2
Alaska 11.3
Colorado 11.3
Idaho 11.3
Indiana 11.3
Minnesota 11.4
Nebraska 11.6
National Average 11.9
New York 12
Florida 12.1
Louisiana 12.5
Massachusetts 12.5
Maine 12.6
Montana 13.5
New Hampshire 13.5
Michigan 14.3
Connecticut 14.4
Washington 14.9
New Mexico 15
Nevada 15.1
South Dakota 15.1
Tennessee 15.2
Utah 17.1
Kentucky 19.4
Oregon 19.9
Arizona 20.8
California 23.4
"Secondary"
(grades 9-12)
student-teacher
ratios
h"p://nces.ed.gov/pubs2010/2010309.pdf

Educational Opportunities in Hard Times:
UCLA/IDEA and UC/ACCORD8
In the last few years, there have been some hopeful signs that California was beginning to address its opportunity gaps. In response to lawsuits by civil rights organizations (Williams v. California) and education advocacy groups (CTA vs. Schwarzenegger), the state enacted legislation in 2004 and 2006 that helped schools improve facilities, purchase needed instructional materials, and hire more counselors. In addition, several forces—including the No Child Left Behind Act and demographic shifts—contributed to a steady reduction in the number of underprepared teachers in California. The number of underprepared teachers in the state shrank from more than 42,000 in 2000 to less than 11,000 in 2008-9.8
Yet, even with these gains, California lagged behind the rest of the nation on a number of key indicators of educational quality, and the gaps were even more pronounced in schools serving large numbers of Latino, African American, and American Indian students. Such was the state of California schools before the recession created new demands and prompted deep cuts to education budgets. How have California schools fared in the face of economic and fiscal crisis?
The schools represented in the Principal Interview Study are from 32 counties located in southern, central, and northern California.
��� ����������
������
������
���������
����
�� �����
��� ���
��������
�����
��� ������
������������
����
������
�������
���� � �� �����
����� �������
��������
������
����
������
������
��� �������
�� �����
����� �����
�����
�����
��� ���
����� ����
������ �����
����� ���
������
�������� ������� �� ��� ��������� ��������� �����
�������� ��� ������� �� ��� ��������� ��������� �����

The Impact of the Economic Crisis on Public Schools and Working Families
UCLA/IDEA and UC/ACCORD 9
III. The Principal StudyBetween July 4 and Labor Day of 2009, the UCLA IDEA research team conducted interviews with 87 principals from across California’s public schools. Our randomly selected sample of principals proportionately represented California’s wide diversity of geography, school size, school type, and student demographics. Teams of UCLA researchers interviewed the principals by phone, with one researcher posing questions and the other taking verbatim notes. The interviews generally lasted between 30-45 minutes. Questions focused on the effects and extent of the economic crisis on families in the school community and the impact of the budget cuts on the school’s program. Principals were promised confidentiality.9
The schools represented by the 87 principals who participated in the study reflect California’s public schools taken as a whole. Schools are from 32 counties located in southern, central, and northern California. Principals led small, medium, and large schools in proportion to the distribution of school size in the state. Five percent of the schools in the sample are charter schools, again roughly the same as for the state. Fifty-eight percent are elementary schools, 15% middle schools, and 28% high schools.
The student demographics of our principal sample are similar to the demographics of California’s public schools. In past years, the California Educational Opportunity Report has compared conditions and outcomes across schools enrolling different percentages of Latino, African American, and American Indian students who are underrepresented in California’s higher education system. Near identical proportions of schools in the sample and the state enroll a) 0-49% underrepresented students; b) 50-89% underrepresented students; c) 90-100% underrepresented students. Elementary and middle schools in the principal sample, on average, have slightly higher proportions of students participating in the free and reduced price lunch program than elementary and middle schools in the state as a whole. In contrast, high schools in the sample, on average, have a slightly lower proportion of students participating in the lunch program than other high schools in the state. (Children from families with incomes at or below 130 percent of the federal poverty level qualify for free lunch. Children from families with incomes between 130 and 185 percent of the poverty line can be charged no more than 30 cents per meal.)
2007–2008California Schools
Source: California Basic Education Data System, available at www.cde.ca.gov/ds/sd/cb/
Student Enrollment by type of School
Summer 2009Principal Interview Sample
�����
�����
�����
�����
������
������������
���
����� �������������������������������
Educational Opportunities in Hard Times:
UCLA/IDEA and UC/ACCORD10
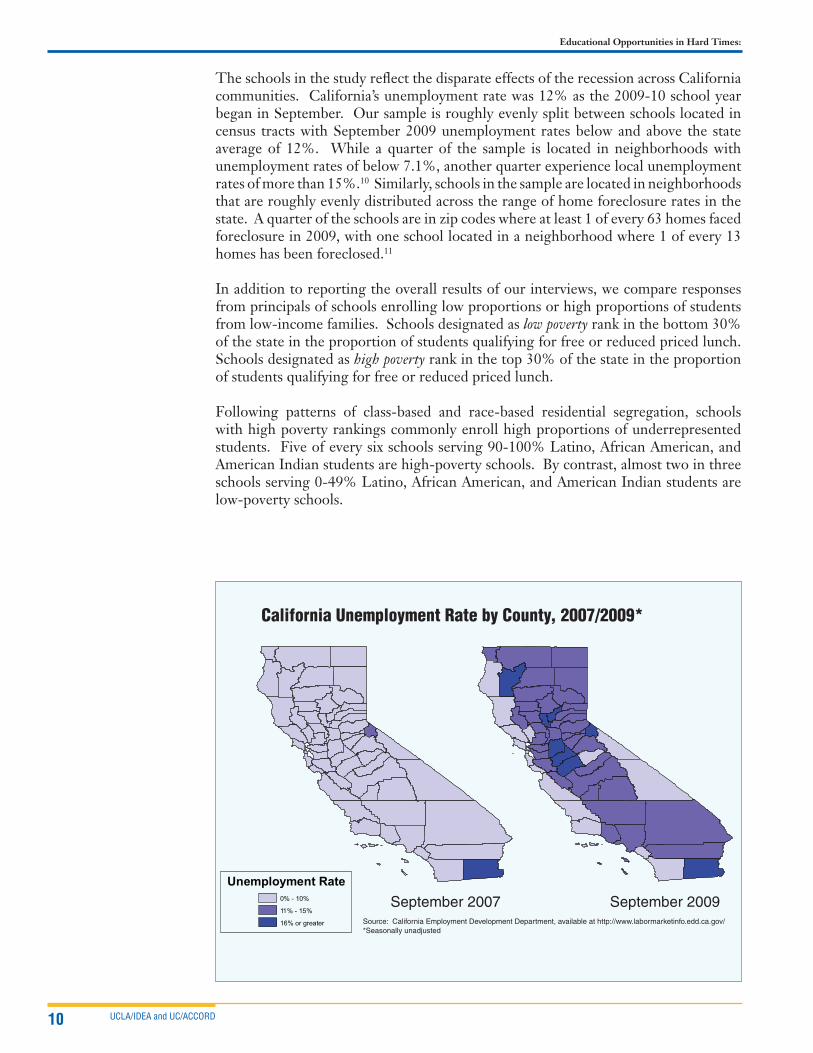
The schools in the study reflect the disparate effects of the recession across California communities. California’s unemployment rate was 12% as the 2009-10 school year began in September. Our sample is roughly evenly split between schools located in census tracts with September 2009 unemployment rates below and above the state average of 12%. While a quarter of the sample is located in neighborhoods with unemployment rates of below 7.1%, another quarter experience local unemployment rates of more than 15%.10 Similarly, schools in the sample are located in neighborhoods that are roughly evenly distributed across the range of home foreclosure rates in the state. A quarter of the schools are in zip codes where at least 1 of every 63 homes faced foreclosure in 2009, with one school located in a neighborhood where 1 of every 13 homes has been foreclosed.11
In addition to reporting the overall results of our interviews, we compare responses from principals of schools enrolling low proportions or high proportions of students from low-income families. Schools designated as low poverty rank in the bottom 30% of the state in the proportion of students qualifying for free or reduced priced lunch. Schools designated as high poverty rank in the top 30% of the state in the proportion of students qualifying for free or reduced priced lunch.
Following patterns of class-based and race-based residential segregation, schools with high poverty rankings commonly enroll high proportions of underrepresented students. Five of every six schools serving 90-100% Latino, African American, and American Indian students are high-poverty schools. By contrast, almost two in three schools serving 0-49% Latino, African American, and American Indian students are low-poverty schools.
��������
����� ���
��� ����������
September 2007 September 2009Source: California Employment Development Department, available at http://www.labormarketinfo.edd.ca.gov/*Seasonally unadjusted
California Unemployment Rate by County, 2007/2009*

The Impact of the Economic Crisis on Public Schools and Working Families
UCLA/IDEA and UC/ACCORD 11
IV. Findings: The Recession in California and the Impact of Budget Cuts on Students and Schools
Children of the Recession“The bottom line is that the current recession is likely to generate for children
in the United States the greatest level of material deprivation that we will see in our professional lifetimes. The recession is harming children by both reducing the
earning power of their parents and the capacity of the safety net to respond.” — Paul Wise, MD MPH, “Children of the Recession”12
Unemployment and underemployment of adults has a profound impact on children’s health and well being. It also influences educational outcomes.13 Even before the current recession, roughly one in six California children lived in poverty. Childhood poverty rates varied greatly across the state. In affluent San Mateo County, 1 in 18 children were poor in 2007, while in Los Angeles County, more than 1 in 5 children were poor.14 These figures have certainly grown during the recession. California’s unemployment rate is among the highest in the nation, with greater job losses than during any previously recorded downturn. Further, according to the California Budget Project, the number of underemployed adults—those working part-time “involuntarily”—doubled over the last two years, further eroding family wages.15 Demographer Kenneth Land and his colleagues have projected that the current recession will increase dramatically California’s childhood poverty rates. They estimate that more than 1 in 4 California children will be poor in 2010, with more than 1 in 3 children in Los Angeles County living in poverty.16
California’s principals have witnessed first hand the growth of joblessness and family poverty. Many mentioned plant closings or mass layoffs in their community. Mike Wan, Principal of Seashore Elementary in northern California, recounted an advisory council meeting for Spanish-speaking parents where he learned that three fourths of the council had lost their jobs since their last meeting. Alicia Gomez of Naranja Elementary reported that a lot of the small stores have shut down in her southern California community. “I don’t go through a day that I don’t hear three or four people say they need to move because of layoffs.”
Increasing poverty has led to greater food insecurity. Patti Webb, principal of Farmdale Elementary in the Central Valley, encourages community members to let her know when they need assistance. “Lately it’s been kids telling me ‘We’re hungry, we don’t have food.’” Webb adds that she recently has been approached by parents who previously never needed support. “Even some PTA parents are saying they don’t have enough food.” Ron Miller, who leads another Central Valley school reports: “We know we’re their only source of food.” Nationally, the number of students receiving free or reduced price lunch grew by 859,000 from the 2007-8 school year to 2008-9, the largest increase since the recession of 1992.17 California accounted for 14% of this increase, serving 120,389 additional students.18 The proportion of California residents receiving food stamps rose by 25% between September 2008 and September 2009.19

Educational Opportunities in Hard Times:
UCLA/IDEA and UC/ACCORD12
The recession has prompted increased residential mobility and homelessness. California has been a national epicenter of the mortgage crisis, leading to extremely high foreclosure rates. More than 1 in every 100 homes in California was foreclosed in 2009. Foreclosure rates were even higher in many working class communities of color where mortgage-granting institutions have targeted subprime loans to high-risk, first-time home buyers in recent years.20 Two thirds of the principals in our study noted growing housing insecurity in the families they serve, with families moving in or out of the community or moving in with neighbors or extended family. “I’ve been a principal for 15 years [and] I didn’t have a lot of mobility,” recounts Alicia Gomez of Naranja Elementary. “Now, oh my God, it’s like a revolving door.” Almost one third of the principals reported increased homelessness either of families or youth. Several principals indicated that the incidence of homeless students was the first they had experienced at their school.
More than half of the principals reported that the recession had increased the health, psychological, or social service needs of their students. (Many other principals reported that student needs in these areas were already high prior to the recession.) Ernest Wilson of Fremont High School in Contra Costa County echoed a common theme: “The biggest impact [of the recession] has been the emotional impact.” Stress has carried over from homes into the school. Alan Jenkins, whose Central Valley elementary school serves a neighborhood with a 17% unemployment rate, noted, “We’ve had kids having problems because their parents are frustrated and so angry.”
Public Schools Responding to Student Social Welfare Needs
California educators do what they can to meet the growing needs of California students during the recession. Almost every principal shared stories of staff demonstrating their care for students through kindness and personal contributions.21 At Mission Middle School, serving a community with a very high unemployment rate in Riverside County, the front office staff collects “money to help families pay rent, bills.” Teachers at Roosevelt Elementary in Los Angeles County have bought clothes and food for needy families. Principal Randi Wilson notes that this practice is something new for Roosevelt. “I’ve been at this school for over twenty years and I’ve never seen this happen before.” As teachers have become more aware of the challenges their students face, many have become more engaged in their students’ lives. Eddie Johnson of Bayside High School in Alameda County reports that several of his teachers have taken in homeless youth to live with them.
Two thirds of the principals reported that their schools connected students and families to health and social service providers in the community. Although some schools had served for several years as a community hub of social services, other schools were new to the task. Randi Wilson of Roosevelt Elementary found a social services resource book and distributed copies of relevant pages to families at her school. Still other principals stepped reluctantly into the role of social service guide. The southern California community Sam Smith works in has an unemployment rate nearly double the state average. He reasons that while directing families to social services is “not our mission, … we do as much as we can … [because] we have the customers.”
One third of the principals report that the recession has left outside providers with fewer resources and less capacity to support families. Communities with the greatest economic need have the greatest difficulty accessing outside services.
Principals reported that more students need social services than before the recession.

The Impact of the Economic Crisis on Public Schools and Working Families
UCLA/IDEA and UC/ACCORD 13
Principals in high-poverty schools were almost three times as likely (44% to 15%) as low-poverty schools to say that services outside the school had been cut. Consider, for example, Clinton Elementary School, located in an Inland Empire community that has been particularly hard hit by the recession. The unemployment rate is over 15% and the foreclosure rate (one of every 33 homes) is among the highest in the nation. Clinton’s principal Sara Ride has tried to refer more families to public agencies. “In some cases, especially the state [and] county service, they’ve been drastically cut back as well. So we make referrals but they’re having a hard time keeping up as well.”
Similarly, many California public schools have experienced cutbacks in social services provided through community-based social service providers or by school personnel. Edwin Randle has relied on the local YMCA to provide a variety of psychological and social services to his high-poverty middle school in southern California. Now, due to the YMCA’s shrinking budget, Randle worries that his students won’t be able to access the one remaining social worker, whereas in the past the YMCA had six or seven. Some school districts have cut back school personnel who provide social and psychological services. More than a quarter of all principals reported their school reduced student access to school psychologists, social workers, and nurses. These cuts were more common in high-poverty schools.
The capacity of both the social welfare and public education systems has diminished as the need for social services has increased. Ana Beltran, from Stevens Elementary School in Humboldt County, wanted to inform the school community about how to access healthcare at low or no cost through the state’s “Healthy Families” program. She trained her receptionist to contact families experiencing economic hardship and provide them with information in a sensitive and respectful manner. Then, district budget cuts forced her to lay off her receptionist. Beltran explains, “So I have to figure out how to” provide that service now.
Budget Cuts Erode Conditions for Teaching and Learning
For many years before the recession, California’s principals have had to “make do” with fewer resources than principals in other states. California spent $2393 less per student than the national average prior to the recession.22 Over the last year and a half, budgetary uncertainty, fiscal instability and deep cuts have magnified principals’ struggles to run their schools, and California’s Department of Finance describes the current year as “the worst budget crisis in the state’s history.”23
In September 2008, the state projected a modest increase in education spending. Five months later, in February 2009, facing a $42 billion General Fund budget gap, the state cancelled the increase for k-12 education and cut $2.4 billion. By July, the legislature and governor agreed to another $24 billion cut that impacted social welfare and k-12 programs. Although Proposition 98 funding (the state’s primary contribution to k-12) fell by more than 10%, this reduction was mitigated by new federal stimulus funding. Accounting for stimulus funds and other budgetary measures, the July budget agreement left California k-12 public schools with 3.8% less funds in 2008-9 than in the previous school year (2007-8) and 6.2% less for the current year than two years previously (2007-8.)24
Principals of high-poverty schools were more likely than principals of low-poverty schools to report that services outside the school had been cut.
0
5
10
15
20
25
30
35
40
45
44%
15%
“In some cases, especially the state [and] county service, they’ve been drastically cut back as well. So we make referrals but they’re having a hard time keeping up as well.”
Educational Opportunities in Hard Times:
UCLA/IDEA and UC/ACCORD14
Along with reducing education funding, the state eliminated or modified some requirements on how districts spend their state dollars. The state allowed districts to increase class size in grades k-3; postpone requirements for purchase of instructional materials; reduce the number of instructional days in the school year; and lower funding for school maintenance.25 These so-called “flexibility provisions” aimed to give local officials discretion in addressing school needs during the crisis. Greater local flexibility also allows for more differentiation between the educational programs offered across districts and raises the possibility that inequalities in learning opportunities will be exacerbated. How then have budget cuts and increased local discretion affected conditions for teaching and learning across California public schools?
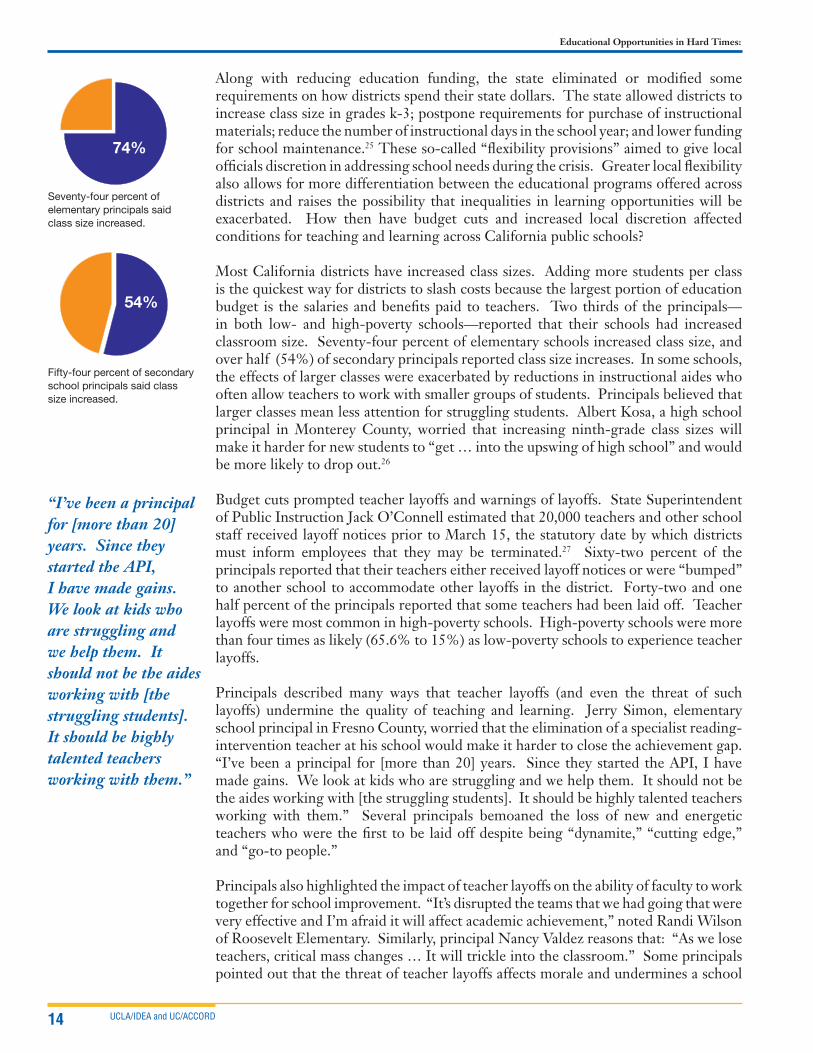
Most California districts have increased class sizes. Adding more students per class is the quickest way for districts to slash costs because the largest portion of education budget is the salaries and benefits paid to teachers. Two thirds of the principals—in both low- and high-poverty schools—reported that their schools had increased classroom size. Seventy-four percent of elementary schools increased class size, and over half (54%) of secondary principals reported class size increases. In some schools, the effects of larger classes were exacerbated by reductions in instructional aides who often allow teachers to work with smaller groups of students. Principals believed that larger classes mean less attention for struggling students. Albert Kosa, a high school principal in Monterey County, worried that increasing ninth-grade class sizes will make it harder for new students to “get … into the upswing of high school” and would be more likely to drop out.26
Budget cuts prompted teacher layoffs and warnings of layoffs. State Superintendent of Public Instruction Jack O’Connell estimated that 20,000 teachers and other school staff received layoff notices prior to March 15, the statutory date by which districts must inform employees that they may be terminated.27 Sixty-two percent of the principals reported that their teachers either received layoff notices or were “bumped” to another school to accommodate other layoffs in the district. Forty-two and one half percent of the principals reported that some teachers had been laid off. Teacher layoffs were most common in high-poverty schools. High-poverty schools were more than four times as likely (65.6% to 15%) as low-poverty schools to experience teacher layoffs.
Principals described many ways that teacher layoffs (and even the threat of such layoffs) undermine the quality of teaching and learning. Jerry Simon, elementary school principal in Fresno County, worried that the elimination of a specialist reading-intervention teacher at his school would make it harder to close the achievement gap. “I’ve been a principal for [more than 20] years. Since they started the API, I have made gains. We look at kids who are struggling and we help them. It should not be the aides working with [the struggling students]. It should be highly talented teachers working with them.” Several principals bemoaned the loss of new and energetic teachers who were the first to be laid off despite being “dynamite,” “cutting edge,” and “go-to people.”
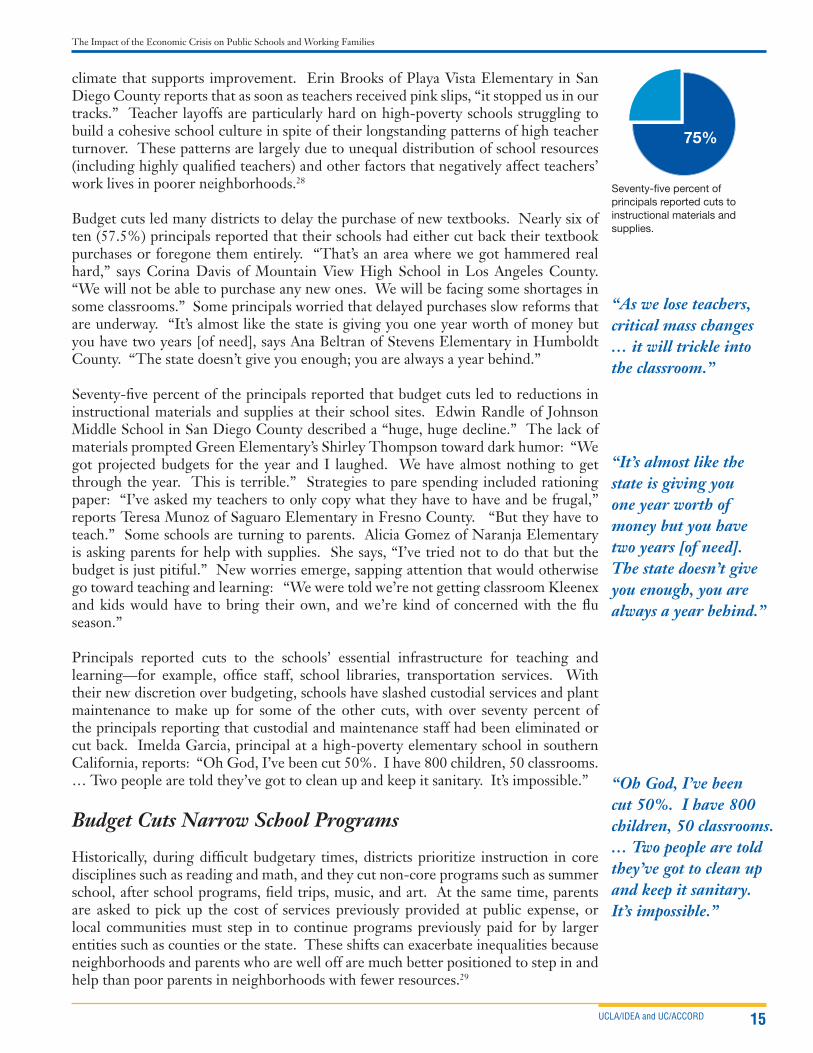
Principals also highlighted the impact of teacher layoffs on the ability of faculty to work together for school improvement. “It’s disrupted the teams that we had going that were very effective and I’m afraid it will affect academic achievement,” noted Randi Wilson of Roosevelt Elementary. Similarly, principal Nancy Valdez reasons that: “As we lose teachers, critical mass changes … It will trickle into the classroom.” Some principals pointed out that the threat of teacher layoffs affects morale and undermines a school
74%
Seventy-four percent of elementary principals said class size increased.
Fifty-four percent of secondary school principals said class size increased.
54%
“I’ve been a principal for [more than 20] years. Since they started the API, I have made gains. We look at kids who are struggling and we help them. It should not be the aides working with [the struggling students]. It should be highly talented teachers working with them.”
The Impact of the Economic Crisis on Public Schools and Working Families
UCLA/IDEA and UC/ACCORD 15
climate that supports improvement. Erin Brooks of Playa Vista Elementary in San Diego County reports that as soon as teachers received pink slips, “it stopped us in our tracks.” Teacher layoffs are particularly hard on high-poverty schools struggling to build a cohesive school culture in spite of their longstanding patterns of high teacher turnover. These patterns are largely due to unequal distribution of school resources (including highly qualified teachers) and other factors that negatively affect teachers’ work lives in poorer neighborhoods.28
Budget cuts led many districts to delay the purchase of new textbooks. Nearly six of ten (57.5%) principals reported that their schools had either cut back their textbook purchases or foregone them entirely. “That’s an area where we got hammered real hard,” says Corina Davis of Mountain View High School in Los Angeles County. “We will not be able to purchase any new ones. We will be facing some shortages in some classrooms.” Some principals worried that delayed purchases slow reforms that are underway. “It’s almost like the state is giving you one year worth of money but you have two years [of need], says Ana Beltran of Stevens Elementary in Humboldt County. “The state doesn’t give you enough; you are always a year behind.”
Seventy-five percent of the principals reported that budget cuts led to reductions in instructional materials and supplies at their school sites. Edwin Randle of Johnson Middle School in San Diego County described a “huge, huge decline.” The lack of materials prompted Green Elementary’s Shirley Thompson toward dark humor: “We got projected budgets for the year and I laughed. We have almost nothing to get through the year. This is terrible.” Strategies to pare spending included rationing paper: “I’ve asked my teachers to only copy what they have to have and be frugal,” reports Teresa Munoz of Saguaro Elementary in Fresno County. “But they have to teach.” Some schools are turning to parents. Alicia Gomez of Naranja Elementary is asking parents for help with supplies. She says, “I’ve tried not to do that but the budget is just pitiful.” New worries emerge, sapping attention that would otherwise go toward teaching and learning: “We were told we’re not getting classroom Kleenex and kids would have to bring their own, and we’re kind of concerned with the flu season.”
Principals reported cuts to the schools’ essential infrastructure for teaching and learning—for example, office staff, school libraries, transportation services. With their new discretion over budgeting, schools have slashed custodial services and plant maintenance to make up for some of the other cuts, with over seventy percent of the principals reporting that custodial and maintenance staff had been eliminated or cut back. Imelda Garcia, principal at a high-poverty elementary school in southern California, reports: “Oh God, I’ve been cut 50%. I have 800 children, 50 classrooms. … Two people are told they’ve got to clean up and keep it sanitary. It’s impossible.”
Budget Cuts Narrow School Programs
Historically, during difficult budgetary times, districts prioritize instruction in core disciplines such as reading and math, and they cut non-core programs such as summer school, after school programs, field trips, music, and art. At the same time, parents are asked to pick up the cost of services previously provided at public expense, or local communities must step in to continue programs previously paid for by larger entities such as counties or the state. These shifts can exacerbate inequalities because neighborhoods and parents who are well off are much better positioned to step in and help than poor parents in neighborhoods with fewer resources.29
Seventy-five percent of principals reported cuts to instructional materials and supplies.
75%
“Oh God, I’ve been cut 50%. I have 800 children, 50 classrooms. … Two people are told they’ve got to clean up and keep it sanitary. It’s impossible.”
“As we lose teachers, critical mass changes … it will trickle into the classroom.”
“It’s almost like the state is giving you one year worth of money but you have two years [of need]. The state doesn’t give you enough, you are always a year behind.”

Educational Opportunities in Hard Times:
UCLA/IDEA and UC/ACCORD16
Seventy percent of the principals we surveyed reported that summer school had been cut back severely or eliminated entirely. High-poverty schools were almost three times as likely (48.7% to 16.7%) as low-poverty schools to eliminate summer school outright. In at least one school, summer school was cancelled after it had begun when district officials realized that they could not pay for it. Students at Horace Mann Elementary in the Central Valley were “literally told to go home.” Several principals lamented new restrictions on who was eligible for summer school. Often only special education students qualified, leaving schools unable to support English Learners or students struggling to achieve proficiency on state assessments. “In the past,” explains Imelda Garcia of King Elementary School in Los Angeles County, “all children who needed to go—like Far Below Basic and Below Basic children—would go to summer school … but all that’s been stopped.”
Similarly, 48% of the principals surveyed reported that after-school programs had been cut or eliminated. In many cases, this meant the end of tutoring or other remediation programs. Angela Cross notes that she has started charging parents for after-school tutoring and homework clubs at Olive Elementary in Contra Costa County. Since many parents cannot afford the additional expense, their children are cut off from supplemental learning opportunities. Also disrupted are parents who have relied on after school programs as a high-quality child care option while they are working.
Many schools have shifted costs for field trips to parents and community groups. Forty-one percent of principals reported that budget cuts had led them to ask parents or community groups to cover the expense of field trips. “I’m just not going to be able to support any field trip that isn’t fully funded by the group itself,” notes Corina Davis, principal of a low-poverty high school in southern California. Marisa Chavez’s high-poverty elementary school in Napa County doesn’t have that option. Chavez says she can only go to the parents once to ask for support. “Any more is asking too much.”
Like almost half of principals surveyed, Alicia Gomez reported that arts and music programs had been cut or eliminated. These programs are “hanging by the skin of their teeth.” Many principals, particularly those in more affluent communities, pointed out that their music and arts programs had relied in the past on private support. As donations to arts programs dried up in the wake of the recession, these schools scrambled to make up for the lost resources. “There aren’t as many donations this year,” notes Amanda Butler, principal of a low-poverty school in the Bay Area. “So we had to cut music teachers’ time in half and we had … to let go of the [art] coordinator.” Cuts were more dramatic in other schools. High-poverty Naranja Elementary that had offered art once a month will not have any art this coming year.
Budget Cuts undermine reform and improvement
Principals worry about cuts to programs and services, but when asked about their greatest challenge, they take a broad view of the instructional program in its entirety and of thwarted opportunities for the school to improve. Teresa Muñoz of Saguaro Elementary in Fresno County said, “Not being able to provide the teachers with the tools they need to be successful and asking them to do more … [to meet NCLB goals by enabling] 55% of the students to be proficient or better this year.” Muñoz and other principals lament the dramatic reduction in professional development. They regret that new and pressing claims on their time divert attention from instructional leadership.
Seventy percent of principals said summer school had been cut or eliminated.
Forty-eight percent of principals said after-school programs had been cut or eliminated.
48%
“There aren’t as many donations this year... So we had to cut music teachers’ time in half and we had … to let go of the [art] coordinator.”

The Impact of the Economic Crisis on Public Schools and Working Families
UCLA/IDEA and UC/ACCORD 17
Over seventy percent of principals reported deep cuts to professional development jeopardizing opportunities for faculties to develop collegial learning cultures at their schools. At many schools, few or no funds were allocated to professional development. “We used to have “buy-back” days [dedicated to teacher professional development],” noted Tom Harden of Arroyo Elementary in the Central Valley. “We used to bring outside consultants …We used to have food during staff meeting, and now we don’t even have coffee, nothing, absolutely nothing.” Similarly Erin Brooks of Playa Vista Elementary in San Diego County bemoans the loss of scheduled staff retreats that allowed her faculty to use data to examine and improve on their practice. “To really step it up, you want to have time to look at student scores.” Shirley Thompson elaborates what has been lost: “It’s just tough not to have the time to do the work … and dig into special instructional issues and internalize what that means and provide that to kids.”
Principals said that the budget cuts drew their attention away from instruction. “It sidetracks your efforts to improve student learning because you are dealing with budget issues that have a ripple effect on the whole program,” argues Albert Kosa of Pacific High School in Monterey County. “Principals [are] dealing with problems on campus instead of focusing on student learning as we should be and the state is mandating us to do. It’s less resources, more distractions, while trying to run the school.” Angela Cross of Olive Elementary worries that she is becoming an “Ebenezer Scrooge manager of money” rather than an “instructional leader [who moves] kids forward.” Lacking “money [to] spend on your ideas … hinders your ability to be a creative instructional leader.” Many principals also pointed to a growing list of administrative responsibilities that they had been forced to take on after the district eliminated other positions—assistant principals, office staff, or district support staff. “My role is supposed to be as an instruction leader,” noted Steven Davis of Archibald Elementary in Los Angeles County. “But I’m having to do a lot more operational things and it takes away from my responsibility.” The Oceanview District in southern California shut down its warehouse as a cost cutting measure. Now, Oceanview High School’s Diane Riordan worries about the “headaches” associated with being responsible for ordering and delivering supplies.
V. Responding to the Economic and Fiscal CrisisThe recession and budget crisis have had an immediate and profound impact on California’s students and California public schools. Many more young people (at least one of every four) are experiencing stress associated with poverty, including food insecurity, unstable housing, and being cared for by adults who struggle to provide basic needs. California public school educators have made extraordinary efforts to address these growing needs, providing services, referring families to outside providers, and making personal contributions of food and clothing. Yet, their efforts have been limited by cuts to social welfare programs and to public education. Budget cuts to education also have diminished the daily quality of life that students experience. Classrooms are more overcrowded, instructional materials less available, and facilities less clean. Students have less access to music, art, field trips, after-school, and summer school programs. Poor students are confronted with sacrifices their parents are asked to make when the schools, increasingly, want parents to pay for these services. Further, budget cuts have diverted attention and capacity from the important work of school reform. Jane Hope, Principal of Egen High School in southern California, speaks for many educators when she says: “It’s the bleakest I’ve ever seen.”
“To really step it up, you want to have time to look at student scores. It’s just tough not to have the time to do the work … and dig into special instructional issues and internalize what that means and provide that to kids.”

Educational Opportunities in Hard Times:
UCLA/IDEA and UC/ACCORD18
What is the way forward for California in these hard times? In this final section, we consider responses of educators and community members who seek to meet growing needs through greater local effort and resolve. While acknowledging the value of this energy and commitment, we also point to its limits as social policy. We close with a few thoughts on building a new finance structure that meets the needs of California’s young people.
Most of the principals we interviewed expressed a strong determination to provide a quality education, even in the face of difficult circumstances. “I won’t let this happen,” responded Edwin Randle when asked whether he expects budget cuts to impact the quality of instruction in his high-poverty school in San Diego County. “Our kids are showing up every day so they deserve the best. You know our demographic and you know the dropout rate and graduation rate and we’re the gatekeepers at the middle school level so we either make them or break them.” Echoing this sentiment, Rhoda Flanders, a principal in rural northern California, noted, “We’ll just have to work harder. … I believe we will find a way to keep the quality of education the same or higher.” And then, as if to convince herself, she added: “I have to think that way; I have to believe that.” Expressing this same sense of grit, Denise Roth of Moss Elementary in Marin County told us: “Even if the lights go out, we can still teach.”
There is much to appreciate about this commitment, determination, and faith. But these values, however important, cannot alone produce quality educational outcomes across a broad system of public education. Even when educators are “working harder than ever,” says Janet Peterson of Riverdale Elementary in Sonoma County, they may not have enough resources to achieve desired results. “Our teachers are so dedicated, but there is only so much you can squeeze out.”
With less funding for public education coming from the state, many have called for their local communities to address the growing financial gap through donations or parcel taxes. Such initiative expresses an important commitment to sustaining local institutions through difficult times. It also coincides with greater interest among some state policy makers in enhancing “local control” of public schools.
Yet, evidence to date suggests that these strategies are likely to exacerbate inequalities between low-poverty and high-poverty schools and districts. About 80% of the principals in the study reported that their schools receive donations from parent and community groups. But on average, low-poverty schools received $167,797. By contrast, high-poverty schools received $21,319. Hence, more affluent schools generated eight times the private funding as poorer schools.
A similar pattern holds for parcel taxes. Parcel taxes are additional levies on top of property taxes, and require approval by two-thirds of the voters. They are based on a fixed amount of money per “lot,” and are not calculated according to the value of the land itself. In 2009, 29 districts in the state (out of more than 1000) placed parcel tax votes before their communities. In the 20 districts that passed the parcel tax, the average percentage of the students receiving free or reduced price lunch was 15.3%. In the nine districts that placed the parcel tax on the ballot and lost, an average of 56% of students received free or reduced priced lunch. (Statewide, 53% of students receive free or reduced price lunch.) No district in the state enrolling more than 40% of students receiving free and reduced price lunch passed the parcel tax. Hence, while local revenue generation through parcel taxes may hold some hope for more affluent districts, it does not seem to be a strategy that can ease the burden of districts serving substantial numbers of low-income families.

The Impact of the Economic Crisis on Public Schools and Working Families
UCLA/IDEA and UC/ACCORD 19
California School District Parcel Tax, 2009
TOTAL No Parcel
Tax on BallotAttempted/Passed
Parcel TaxAttempted/Failed
Parcel TaxCA School Districts 1035 1006 20 9
StudentEnrollment 6,199,863 5,879,638 142,946 177,279% FRPL* 53% 53.8% 15.3% 56%
Source: California Department of Education and Individual County Election Offices.* Free or Reduced Price Lunch
California requires a public policy response that addresses the basic needs of all its children and youth. The need for action is immediate, and the quality of this action will have long-term implications for the state. “It’s not just what’s happening now,” points out Ron Miller, the principal of a high-poverty elementary school in the Central Valley. “The longer this goes on, the greater the disservice to students.”
The federal government has demonstrated that it can address quickly the immediate, short-term needs of California’s students. Federal stimulus dollars played a crucial role in limiting the most deleterious effects of California’s recession. But, the first round of stimulus funding was not sufficient and many school districts still were forced to lay off staff—teachers, classroom aides, nurses, counselors, office staff, bus drivers, and custodial workers. These layoffs represent a drag on California’s economy. And, because so many of these laid-off workers are also public school parents, the cutbacks create additional stresses on the educational system. Given the continuing challenges to California’s economy and state budget, more federal support is essential.
While the federal government can help stave off some of the worst effects of the recession, the state must move forward by building a new system of education funding. California’s education funding system, severely impaired for decades, is near collapse with the current economic downturn. Now, a generation of children are being denied educational opportunities because they happen to be of school age when the state and national economy struggle. Many of the principals who spoke passionately about refusing to let their students fail, also see limits to their best efforts. “I’ve lived in California most of my life,” reported John Howard of Lincoln Elementary in Riverside County. “I find it hard to believe how bad we have become with our funding for education.” In San Diego County, Erin Brooks says the education finance system is the “absolute most frustrating thing.” She adds: “There have to be some fundamental changes to funding education.”
Although we did not ask California principals to design a new education funding system, three ideas emerge from their comments. First, California needs to invest in the core infrastructure that supports quality teaching and learning and ongoing improvement of staff. More resources are needed everywhere, but there clearly is greater need in high-poverty schools. Second, California should invest in the capacity of schools to partner with community-based organizations in a manner that enables students and families to receive the various forms of social, psychological and health services that they need. Third, and likely a key to the first two, is to engage communities

Educational Opportunities in Hard Times:
UCLA/IDEA and UC/ACCORD20
in developing a transparent education funding policy. If community members are equipped with knowledge of schools’ needs along with where and how public money is spent, their public engagement can stimulate a statewide climate for investing in schools at least on par with other states. Further, and beyond fiscal concerns, robust public engagement is, in itself, necessary to sustain education reforms at the school, district, and state levels. As Marisa Chavez at Vine Elementary in Napa Valley notes: “I believe in teaching people that you’ve got to pay attention to the kids … how important it is to help their future which will in turn help our future.”
When we spoke with principal Nancy Valdez this summer, she also was focused on the future. The community where she works in Los Angeles County has been hard hit by the recession. More than 15% of the residents around her school are unemployed. Nearly all of the families her school serves qualify for free or reduced priced lunch. Budget cuts have led the district to cut Valdez’s assistant principal and a couple of the “go-to” people on her faculty. Talking about the upcoming school year, Valdez sought to strike a note of hopefulness: “I just try to be optimistic and say, ‘We can do this.’ What we all have to keep in mind is what educational foundations kids [need] to be successful. They have to leave us being able to make change in the world.” But, while committing herself to doing the best with what she has, Valdez remains a realist. “I’m not going to delude myself into thinking I can do everything I did before … [I don’t] have the energy to do everyone’s job. … Am I preparing myself for a difficult year? Yes I am.”
“I’m not going to delude myself into thinking I can do everything I did before … [I don’t] have the energy to do everyone’s job. … Am I preparing myself for a difficult year? Yes I am.”

The Impact of the Economic Crisis on Public Schools and Working Families
UCLA/IDEA and UC/ACCORD 21
Endnotes
1 For a general discussion of education during the Depression, see David Tyack, Robert Lowe and Elisabeth Hansot, Public Schools in Hard Times (Cambridge, Massachusetts: Harvard University Press, 1984).
2 We share some of this analysis below. A full range of updated findings on the conditions and outcomes in California public schools are available at www.edopp.org.
3 This report uses pseudonyms for the names of public school principals and their schools. The data on Del Norte Elementary and its surrounding community (like data on other public schools in this report) is drawn from a variety of public sources including CBEDS, the U.S. Census, California’s Employment Development Department, RAND, and the California Department of Social Services. The quotations reported here come from UCLA IDEA’s interviews with California public school principals. See “Data and Definitions: A Technical Appendix” (www.edopp.org) for a full discussion of the methodology for this study.
4 “The Nation’s Report Card: Mathematics 2009” (National Center for Education Statistics, 2009). http://nationsreportcard.gov/math_2009/math_2009_report/.
5 “Student Pipeline - Transition and Completion Rates from 9th Grade to College” (NCHEMS Information Center for High Education Policymaking and Analysis). http://www.higheredinfo.org/dbrowser/index.php?submeasure=119&year=2006&level=nation&mode=data&state=0.
6 “Quality Counts,” Education Week, (2010), http://www.edweek.org/media/ew/qc/2010/17sos.h29.finance.pdf. (Note: Education Week’s “Spending Index” adjusts expenditures for regional cost differences.)
7 “Public Elementary and Secondary School Student Enrollment and Staff Counts From the Common Core of Data: School Year 2007–08” (National Center for Education Statistics, 2010). http://nces.ed.gov/pubs2010/2010309.pdf, 12.
8 “Status of the Teaching Profession” (The Center for the Future of Teaching and Learning, 2009). http://www.cftl.org/documents/2009/TCFSummaryFact09.pdf.
9 For a more complete description of our methodology, see “Data and Definitions: A Technical Appendix” (www.edopp.org).
10 That some communities have lower than average unemployment rates in the midst of the recession does not mean that their jobless rates are low compared with historical patterns. Almost all communities with jobless rates in the lowest quartile of the sample have unemployment rates that exceed California’s statewide unemployment rate prior to the recession.
11 Our calculations of 2009 foreclosure rates are based on data from RAND as well as the U.S. Census. For a complete description of our methodology, see “Data and Definitions: A Technical Appendix” (www.edopp.org).
12 Paul Wise, “Children of the Recession,” Archives of Pediatrics and Adolescent Medicine 163, no. 11 (2009): 1063-1064.

Educational Opportunities in Hard Times:
UCLA/IDEA and UC/ACCORD22
13 Richard Rothstein, Class and Schools: Using Social, Economic and Educational Reform to Close the Black-White Achievement Gap (New York: Teachers College Press, 2004). See also David Berliner, The State Versus the Poor: Inequality in Education and Its Reduction (Berlin: The Liberal Institute, 2006).
14 “Child Poverty in California” (Public Policy Institute of California, May 2009). http://www.ppic.org/content/pubs/jtf/JTF_ChildPovertyJTF.pdf.
15 “In the Midst of the Great Recession: The State of Working California, 2009” (The California Budget Project, 2009). http://www.cbp.org/pdfs/2009/090906_labor_day.pdf.
16 Qiang Fu, Vicki L. Lamb, and Kenneth C. Land, “California Child and Youth Well-Being Index, 1995-2007: Trends, Changes and Projections to 2012” (Lucile Packard Foundation for Children’s Health, December 7, 2009). http://www.kidsdata.org/index/indexreport.pdf.
17 Rachel Cooper and Madeleine Levin, “School Breakfast Scorecard: School Year 2008-2009” (Food Research Action Center, December 2009). www.frac.org/pdf/breakfast08.pdf, 1.
18 Cooper and Levin, 16.
19 “Supplemental Nutrition Assistance Program: Number of Persons Participating – 1 Year Change” (Food Research Action Center, December 3, 2009). http://www.frac.org/data/FSPparticipation/2009_09.pdf#page=4.
20 Carolina Reid and Elizabeth Laderman, “The Untold Costs of Subprime Lending: Examining the Links among Higher‐Priced Lending, Foreclosures and Race in California” (Federal Reserve Bank of San Francisco; Paper presented at the Institute for Assets and Social Policy, Brandeis University, April 15, 2009). See also Amaad Rivera, Brenda Cotto-Escalera, Anisha Desai, Jeannette Huezo and Dedrick Muhammad, “Foreclosed: State of the Dream 2008” (United for a Fair Economy, 2008). http://www.faireconomy.org/dream. According to Rivera et al., middle and high income Latino and African American home-buyers were two to three times more likely to receive subprime mortgage loans than middle and high income whites.
21 A national survey of elementary and middle school teachers similarly found that half of all teachers regularly bought food for students in their classrooms who were hungry. See “Hunger in America’s Classrooms: Share Our Strength’s Teachers Report” (Share Our Strength, Lake Research Partners, November 2009). http://strength.org/teachers/assets/SOS_Report_MedRes_Final.pdf, 14.
22 This figure is derived from Education Week’s annual “Quality Counts” report which accounts for regional cost of living differences in comparing state education expenditures. “Quality Counts,” Education Week, (2010), http://www.edweek.org/media/ew/qc/2010/17sos.h29.finance.pdf.
23 “California State Budget 2009-10” (California Department of Finance).http://www.dof.ca.gov/budget/historical/2009-10/governors/summary/documents/enacted/FullBudgetSummary.pdf.
24 “The Budget Package: 2009-2010 California Spending Plan” (California Legislative Analyst’s Office, October 2009). http://www.lao.ca.gov/2009/spend_plan/spending_plan_09-10.pdf.
The Impact of the Economic Crisis on Public Schools and Working Families
UCLA/IDEA and UC/ACCORD 23
25 “The Budget Package,” 30.
26 The concerns expressed by Kosa and other principals in our study echo a substantial body of research which suggests that larger classes significantly decreases student achievement, especially for students in the early grades and students whose families are poor. For a review of this research, see: Bruce J. Biddle and David C. Berliner, “Small Class Size and Its Effects” In Jeanne H. Ballantine and Joan Z. Spade (Eds), Schools and Society (Thousand Oaks, CA: Sage Publications, Inc., 2008).
27 “State Schools Chief Jack O’Connell, Teachers, Support Staff, Administrators Announce More Than 20,000 Teachers and Support Staff Getting Layoff Notices Due to Budget Crisis” (California Department of Education). http://www.cde.ca.gov/nr/ne/yr08/yr08rel31.asp.
28 Ken Futernick, “A Possible Dream: Retaining California’s Teachers So All Students Can Learn” (The Center for Teaching Quality at California State University, 2007).
29 Martha Ross, “The Breaking Point,” Diablo Magazine, (September 2009), http://www.diablomag.com/Diablo-Magazine/September-2009/The-Breaking-Point/. See also Ben Enos, “High School Programs Across Bay Area Reeling from Cuts,” Oakland Tribune, (July 4, 2009).

Educational Opportunities in Hard Times:
UCLA/IDEA and UC/ACCORD24
ACKNOWLEDGEMENTS
The UCLA IDEA research team wants to thank the students from UCLA’s Principal Leadership Institute (PLI) Cohort 9 listed below for their invaluable contributions to the Principal Interview Study.
Participating UCLA’s PLI students:Maria Aceves, Mary Arias, Osvaldo Avelar, Gabi Benitez, David Bensinger, Anabel Bonney, Erin Campbell,
Cindy Castellanos, Carlos Castillo, Esther Chai, Stephanie Cole, Anne Donnellan, Rodolfo Duenas, Monica
Esparza, Maria Garcia-Haro, Ben Gertner, Cynthia Gonzalez, Justin Heath, Estella Hernandez, Strawn
Holmes, Edit Khachatryan, Theresa Laura, Barbara Laux, Shannon Leonard, Lewis Lester, Jorge Lopez, Robert
Ly, John Lynch, Ashley McKinney, James Raymond, Nancy Reyes, Michael Rodriguez, Imelda Sanchez, Bruno
Serrano, Marion Shows, Dianne Sievenpiper, Lisette Sosa, Carla-Anne Thomas, Gabriel Tsuei, Amy Uyeshima,
Lisa Vargas, Aide Villalobos, Erica Villarreal, Deonna Williams, Anthony Yom.
We also want to extend our deep gratitude to the school principals across the state for their participation in this study. Without their contribution this report would not have been possible.
The Impact of the Economic Crisis on Public Schools and Working Families
UCLA/IDEA and UC/ACCORD 25
NOTES

UCLA IDEA is a research institute seeking to understand and challenge pervasive racial and social class inequalities in education. In addition to conducting independent research and policy analysis, IDEA supports educators, public officials, advocates, community activists, and young people as they design, conduct, and use research to make high-quality public schools and successful college participation routine occurrences in all communities. IDEA also studies how research combines with strategic communications and public engagement to promote widespread participation in civic life. www.ucla-idea.org
UC/ACCORDALL CAMPUS CONSORTIUM ON RESEARCH FOR DIVERSITY
INSTITUTE FOR DEMOCRACY, EDUCATION, AND ACCESS
University of California’s All Campus Consortium on Research for Diversity (UC/ACCORD) is an interdisciplinary, multi-campus research center. UC/ACCORD serves as an information and research clearinghouse and catalyst for promoting the delivery of high-quality, equitable schooling to all students. UC ACCORD harnesses the research expertise of the University of California to identify strategies that will increase college preparation, access, and retention. www.ucaccord.org
UC/ACCORDALL CAMPUS CONSORTIUM ON RESEARCH FOR DIVERSITY
INSTITUTE FOR DEMOCRACY, EDUCATION, AND ACCESS
This report can be accessed online at http://www.edopp.org
For information about the sources used for this legislative report, please see the Data and Definitions: A Technical Appendix document online at http://www.edopp.org
For further information, contact UCLA IDEA phone: (310) 206-8725; fax: (310) 206-8770; email: [email protected]
Principal ResearchersJohn Rogers
Sophie FanelliRhoda FreelonDavid Medina
Melanie BertrandMaritza Del Razo
Contributing EditorsMartin LiptonCarolyn Castelli
Design and ProductionNery Orellana
Jared PlanasJessie Castro
CALIFORNIA EDUCATIONAL OPPORTUNITY REPORT