educational group visits for the management of chronic health conditions: a systematic review
TRANSCRIPT

Patient Education and Counseling 95 (2014) 3–29
Review
Educational group visits for the management of chronic healthconditions: A systematic review
Ana R. Quinones a,b,*, Jeannette Richardson a, Michele Freeman a, Rochelle Fu a,b,Maya E. O’Neil a,c, Makalapua Motu’apuaka a, Devan Kansagara a,d
a Portland VA Medical Center, Health Services Research & Development, Portland, USAb Oregon Health & Science University, Public Health & Preventive Medicine, Portland, USAc Oregon Health & Science University, Psychiatry, Portland, USAd General Internal Medicine, Oregon Health & Science University, Portland, USA
Contents
1. Introduction . . . . . . . . . . . . . . . . . . . . . . . . . . . . . . . . . . . . . . . . . . . . . . . . . . . . . . . . . . . . . . . . . . . . . . . . . . . . . . . . . . . . . . . . . . . . . . . . . . . . . . . 4
2. Methods . . . . . . . . . . . . . . . . . . . . . . . . . . . . . . . . . . . . . . . . . . . . . . . . . . . . . . . . . . . . . . . . . . . . . . . . . . . . . . . . . . . . . . . . . . . . . . . . . . . . . . . . . . 4
2.1. Data sources and search strategy. . . . . . . . . . . . . . . . . . . . . . . . . . . . . . . . . . . . . . . . . . . . . . . . . . . . . . . . . . . . . . . . . . . . . . . . . . . . . . . . . 4
2.2. Eligibility criteria and abstraction methods. . . . . . . . . . . . . . . . . . . . . . . . . . . . . . . . . . . . . . . . . . . . . . . . . . . . . . . . . . . . . . . . . . . . . . . . . 4
2.3. Data extraction . . . . . . . . . . . . . . . . . . . . . . . . . . . . . . . . . . . . . . . . . . . . . . . . . . . . . . . . . . . . . . . . . . . . . . . . . . . . . . . . . . . . . . . . . . . . . . . 4
2.4. Data synthesis . . . . . . . . . . . . . . . . . . . . . . . . . . . . . . . . . . . . . . . . . . . . . . . . . . . . . . . . . . . . . . . . . . . . . . . . . . . . . . . . . . . . . . . . . . . . . . . . 5
3. Results . . . . . . . . . . . . . . . . . . . . . . . . . . . . . . . . . . . . . . . . . . . . . . . . . . . . . . . . . . . . . . . . . . . . . . . . . . . . . . . . . . . . . . . . . . . . . . . . . . . . . . . . . . . 5
3.1. Arthritis . . . . . . . . . . . . . . . . . . . . . . . . . . . . . . . . . . . . . . . . . . . . . . . . . . . . . . . . . . . . . . . . . . . . . . . . . . . . . . . . . . . . . . . . . . . . . . . . . . . . . 5
3.2. History of falls. . . . . . . . . . . . . . . . . . . . . . . . . . . . . . . . . . . . . . . . . . . . . . . . . . . . . . . . . . . . . . . . . . . . . . . . . . . . . . . . . . . . . . . . . . . . . . . . 5
3.3. Asthma, COPD . . . . . . . . . . . . . . . . . . . . . . . . . . . . . . . . . . . . . . . . . . . . . . . . . . . . . . . . . . . . . . . . . . . . . . . . . . . . . . . . . . . . . . . . . . . . . . . . 5
3.4. Hypertension, CHF/CAD . . . . . . . . . . . . . . . . . . . . . . . . . . . . . . . . . . . . . . . . . . . . . . . . . . . . . . . . . . . . . . . . . . . . . . . . . . . . . . . . . . . . . . . . 6
3.5. Diabetes mellitus . . . . . . . . . . . . . . . . . . . . . . . . . . . . . . . . . . . . . . . . . . . . . . . . . . . . . . . . . . . . . . . . . . . . . . . . . . . . . . . . . . . . . . . . . . . . . 6
3.6. Multiple chronic conditions . . . . . . . . . . . . . . . . . . . . . . . . . . . . . . . . . . . . . . . . . . . . . . . . . . . . . . . . . . . . . . . . . . . . . . . . . . . . . . . . . . . . . 8
A R T I C L E I N F O
Article history:
Received 19 June 2013
Received in revised form 18 December 2013
Accepted 23 December 2013
Keywords:
Group visits
Chronic disease
Health education
Chronic disease self-management
A B S T R A C T
Objective: Review the effectiveness of group visits (appointments of multiple patients) on quality of life,
function, self-efficacy, utilization, and biophysical outcomes in randomized controlled trials of patients
with chronic conditions.
Methods: We searched MEDLINE1, Cochrane, CINAHL, and PsycINFO to January 2013 for English-
language trials of educational group visits led by non-prescribing facilitators (e.g., peer educators).
Results: We report on 80 arthritis/falls (n = 22), asthma/COPD (n = 10), CHF/hypertension (n = 12),
diabetes (n = 29), multiple conditions (n = 4), and pain (n = 4) studies. We found moderate evidence of
improved short-term self-efficacy in patients with arthritis (10 studies) and diabetes (10 studies). We
found no consistent evidence of improved quality of life; however a moderately strong body of evidence
suggests peer-led community-based programs might improve quality of life and utilization in patients
with multiple chronic conditions. Meta-analyses found short- (14 studies; mean change HbA1c = �0.27,
CI = �0.44, 0.11) and long-term (10 studies; mean change HbA1c = �0.23, CI = �0.44, �0.02) glycemic
improvement.
Conclusions: Group visits may improve self-efficacy and glycemic control. There was little consistent
evidence of improved quality of life, functional status, or utilization.
Practice implications: Group visits represent a reasonable alternative for educating patients with chronic
illness, though varied participation/retention suggests they should not be the sole alternative.
Published by Elsevier Ireland Ltd.
Contents lists available at ScienceDirect
Patient Education and Counseling
jo ur n al h o mep ag e: w ww .e lsev ier . co m / loc ate /p ated u co u
* Corresponding author at: Oregon Health & Science University, 3181 SW Sam Jackson Park Road, CB669, Portland, OR 97239-3098, USA. Tel.: +1 503 494 5889;
fax: +1 503 494 4981.
E-mail address: [email protected] (A.R. Quinones).
0738-3991/$ – see front matter . Published by Elsevier Ireland Ltd.
http://dx.doi.org/10.1016/j.pec.2013.12.021

A.R. Quinones et al. / Patient Education and Counseling 95 (2014) 3–294
3.7. Chronic pain . . . . . . . . . . . . . . . . . . . . . . . . . . . . . . . . . . . . . . . . . . . . . . . . . . . . . . . . . . . . . . . . . . . . . . . . . . . . . . . . . . . . . . . . . . . . . . . . . 8
3.8. Effects of patient characteristics . . . . . . . . . . . . . . . . . . . . . . . . . . . . . . . . . . . . . . . . . . . . . . . . . . . . . . . . . . . . . . . . . . . . . . . . . . . . . . . . . 8
3.9. Group visits compared to other active interventions . . . . . . . . . . . . . . . . . . . . . . . . . . . . . . . . . . . . . . . . . . . . . . . . . . . . . . . . . . . . . . . . . 8
4. Discussion and conclusion. . . . . . . . . . . . . . . . . . . . . . . . . . . . . . . . . . . . . . . . . . . . . . . . . . . . . . . . . . . . . . . . . . . . . . . . . . . . . . . . . . . . . . . . . . . . 8
4.1. Limitations . . . . . . . . . . . . . . . . . . . . . . . . . . . . . . . . . . . . . . . . . . . . . . . . . . . . . . . . . . . . . . . . . . . . . . . . . . . . . . . . . . . . . . . . . . . . . . . . . . 9
4.2. Future research . . . . . . . . . . . . . . . . . . . . . . . . . . . . . . . . . . . . . . . . . . . . . . . . . . . . . . . . . . . . . . . . . . . . . . . . . . . . . . . . . . . . . . . . . . . . . . . 9
4.3. Practice implications. . . . . . . . . . . . . . . . . . . . . . . . . . . . . . . . . . . . . . . . . . . . . . . . . . . . . . . . . . . . . . . . . . . . . . . . . . . . . . . . . . . . . . . . . . . 9
Acknowledgements . . . . . . . . . . . . . . . . . . . . . . . . . . . . . . . . . . . . . . . . . . . . . . . . . . . . . . . . . . . . . . . . . . . . . . . . . . . . . . . . . . . . . . . . . . . . . . . . 26
References . . . . . . . . . . . . . . . . . . . . . . . . . . . . . . . . . . . . . . . . . . . . . . . . . . . . . . . . . . . . . . . . . . . . . . . . . . . . . . . . . . . . . . . . . . . . . . . . . . . . . . . 27
1. Introduction
Health systems, payers, and providers are faced with thechallenges of preparing large numbers of patients to self-managethe day-to-day aspects of chronic illness care. As care deliveryrapidly evolves away from fee-for-service models and traditionalface-to-face physician encounters, group visits—appointmentswhere multiple patients are seen simultaneously—may offer analternative means to provide chronic disease education and self-management skills training to more patients, and with fewerresources. Education delivered to groups of patients by non-prescribing health professionals and facilitators has gainedtraction because of their potential to efficiently engage patientsin chronic illness self-management [1,2].
The Patient Protection and Affordable Care Act of 2010incentivizes the formation of health care innovations—such asthe Patient-Centered Medical Home—that build on a strongprimary care foundation to provide timely access, and acoordinated, regular source of care for patients [3]. Incorporatedinto these new care models, group visits may be a way to deliverhigh quality health education while prioritizing improved healthoutcomes and better patient care experiences. Although group visitinterventions have been used with greater frequency over the pastfew decades, there is little consensus as to whether, and for whom,group visits are an effective tool. Given differences in programstructure and content, the broad array of chronic conditions inwhich group visit interventions have been studied, and the lackclarity on effectiveness, we conducted a systematic review toexamine the effects of group visits on patient self-efficacy, qualityof life, health outcomes, and health care utilization in patients withchronic illness (Appendix 1). We also sought to examine whethereffects of group visit interventions depended on patient or programcharacteristics.
2. Methods
2.1. Data sources and search strategy
We conducted the original search February, 2012 and theupdated search January, 2013 of multiple databases (MEDLINE1
via PubMed1, Cochrane Register of Controlled trials, CINAHL(EBSCO), PsycINFO) using terms for non-prescribing practitionersand group visits, including but not limited to terms for groupeducation, group program(me), group session(s) (Appendix 2). Weobtained additional articles from reference lists of pertinentstudies and by consulting experts.
2.2. Eligibility criteria and abstraction methods
We included English-language randomized controlled trials ofeducational group visits led by non-prescribing facilitators forpatients with common chronic conditions: arthritis, history offalls, asthma, chronic obstructive pulmonary disease (COPD),hypertension, congestive heart failure (CHF)/coronary arterial
disease (CAD), diabetes mellitus, multiple co-occurring chronicconditions and chronic pain. We excluded group visit studies ifany portion of the intervention focused on individual-leveltreatment plans or prescription changes (i.e., shared medicalappointments), or focused exclusively on support groups or groupexercise classes. Existing Cochrane reviews of group exercisesummarize effectiveness of these interventions and represent asystematic evaluation of that literature [4,5]. In addition, a recentCochrane publication reviews exercise and medication manage-ment interventions designed to reduce fall incidence amongcommunity-living older adults [6]. We excluded diabetes studiespublished before 1998 because the overall approach to adultdiabetes care was qualitatively different after publication of theUK Prospective Diabetes Study, thereby rendering older studiesless applicable [7]. Reviewers trained in critical analysis ofliterature assessed whether abstracts met inclusion criteria anddual-reviewed full-text articles for inclusion and quality (Appen-dices 3 and 4).
2.3. Data extraction
One research team member abstracted each included study fordata on design, setting, population, findings, intervention struc-ture, comparator(s), participation, and attrition (Table 2). Wedefined content delivered as follows: (1) self-managementeducation: in addition to providing disease-specific informationto patients, these programs teach patients self-management skills,such as goal-setting and contracting, and build skills to reinterpretsymptoms. These interventions are often characterized bymotivational interviewing and cognitive behavioral therapytechniques; (2) didactic education: content is informational andformat is usually lecture-based (e.g., pathophysiology of disease);(3) experiential education: instruction based on demonstrations(e.g., cooking).
We found a breadth of measured and reported outcomecategories and variation in outcome metric validity, rendering afull synthesis of all outcomes infeasible and uninformative(Appendices 5 and 6). We chose, instead, to focus on distal healthoutcomes measuring quality of life and functional status becausethese are likely to be important to patients and could conceivablybe affected by group visit interventions. We included utilizationand medication adherence outcomes when reported, though weanticipated that fewer studies would be powered to examine theseoutcomes. We also examined intermediate outcome metrics,focusing specifically on biophysical markers such as HbA1c, and onself-efficacy/patient activation measures. Self-efficacy refers topersonal beliefs in one’s ability to self-manage illness. In thisreview, we used the term broadly to include patient activation,coping skills, or illness beliefs. We chose to examine this set ofoutcomes because there are validated tools [8,9], and these metricswere commonly reported. Furthermore, there is a link, bothconceptually and empirically, between the knowledge, skills, andattitude changes acquired during an educational intervention andintermediate health outcomes [10].

A.R. Quinones et al. / Patient Education and Counseling 95 (2014) 3–29 5
Two reviewers independently assessed the quality of each trialaccording to standard criteria [11]. Disagreements were recon-ciled by discussion, or if necessary, by a third team member.Individual studies were rated as ‘‘good,’’ ‘‘fair’’ or ‘‘poor’’(Appendix 4). We assessed overall quality of evidence using amethod developed by the Grading of Recommendations, Assess-ment, Development, and Evaluation (GRADE) Working Group[12], which considers the consistency, coherence, and applicabil-ity of a body of evidence, as well as the internal validity ofindividual studies.
2.4. Data synthesis
In compiling data tables (Tables 2–4), we prioritized well-validated scales. If studies report full scales as well as subscales, wereport full scales only. If studies did not report any outcome inthese categories, or report ad-hoc/non-validated measures, theirfindings were summarized narratively. We also present results onpatient characteristics that modify group visit effectiveness forstudies that report these analyses. Finally, we consider usual careas well as head-to-head comparators in trials with more than oneactive arm (Tables 2–4).
We conducted meta-analyses of the mean difference in HbA1cchange because we identified HbA1c as a clinically importantmarker for diabetes patients that is plausibly amenable to changein the short- (0–3 months) and medium-term (4–6 months). Weobtained a pooled estimate of relative risk using a random effectsmodel [13]. To determine whether the effects of group visits weremodified by intervention characteristics, we conducted sub-analyses according to study quality and intervention duration.Statistical heterogeneity was assessed by Cochran’s Q test and I2
statistic [14]. To examine publication bias, we used funnel plotsand Egger’s test to assess small study effects [15]. We alsoconducted multivariate meta-regression analyses to determinewhether duration, study quality, or publication year had anybearing on meta-analytic results. We followed PRISMA reportingguidelines for the meta-analyses of HbA1c. All analyses wereperformed using Stata 10.0.
3. Results
We included 84 publications of 80 studies focused on educationfor the management of prioritized chronic conditions (Fig. 1). Ingeneral, group visits were associated with short- and medium-term improvements in self-efficacy; however, fewer studiesexamined longer-term outcomes. There was little evidence thatinterventions improved quality of life, functional status, orutilization outcomes (Table 1).
3.1. Arthritis
Seventeen publications from the US, Europe, and Australiaevaluated the effectiveness of group visits that included self-management education (eleven studies), didactic education (eightstudies), and experiential education approaches (six studies) [16–32]. Studies varied widely in intervention structure, content,duration, and comparison group.
Seven of ten studies found group visit interventions improvedshort- and medium-term self-efficacy. Six of these studies foundbenefit for group visits delivering self-management education.Only one poor-quality study assessed outcomes beyond 12 months[32]. Despite the improvements seen in self-efficacy, only two ofeleven studies found improvements in quality of life relatedmeasures such as disability [28] and depression [18]. One US studyfound a self-management education intervention was associatedwith reduced physician visits [28], but this finding was not
confirmed in five other studies in Europe and Australia[17,18,20,21,27].
Eight studies compared two active interventions. Many of thesestudies compared interventions with more than one characteristicthat differed (i.e., different educational content and differentnumber of sessions), making it difficult to assess which interven-tion components are associated with observed effects. One studycompared self-management to didactic education in interventionswith the same number of sessions and found no difference inoutcomes between them [23]. Another study found that theinclusion of significant others along with patients in a self-management education intervention was associated with lowerself-efficacy than the intervention delivered to patients alone [30].Finally, one study found similar effects from a mail-deliveredindividualized self-management education program and an in-person group self-management education intervention [29].
Overall, there is a moderately strong body of evidence thatgroup self-management education interventions can improveshort- and medium-term self-efficacy in patients with arthritis,but they have little effect on quality of life or utilizationoutcomes.
3.2. History of falls
Four studies from the US, Canada, and Australia examineeffectiveness of educational group visits in patients with a historyof falls or at-risk for falling [33–36]. Two studies found groupdidactic education improved self-efficacy over the short-term [33],while another study which included a ‘‘booster’’ session at threemonths found improved long-term self-efficacy [34]. One studyfound improved timed-up-and-go physical performance [34],while another study found the intervention did not improvetimed-up-and-go when patients were simultaneously tasked withcognitive activities [36]. Only one of three studies found areduction in fall events [34], and no studies found improvedquality of life. Overall, didactic and experiential falls preventiontraining may improve patient self-efficacy and reduce the risk offalls, though the strength of this evidence is low because of thesmall number and inconsistencies among studies.
3.3. Asthma, COPD
Five studies conducted in the US or Australia examined theeffects of group visits compared with usual care in patients withasthma [37–41]. The group interventions involved didacticeducation in four studies [38–41] and self-management educationin one study [37]. Decreased utilization was observed in twostudies [37,40], and improvements in quality of life were noted intwo studies [37,38]. However, the studies were limited by selectionbias and other methodological issues.
Five studies of group visits in COPD patients were conducted ina variety of settings: Northern Ireland [42], the UK [43], theNetherlands [44], France [45], and a VA Medical Center in the US[46]. Three studies compared didactic education combined withexercise training to didactic education alone [43,44] or to usualcare [45]. Two other studies examined the effects of self-management education compared with didactic education [46],usual care [42], or individual support [42]. Better exercise capacitywas observed in the studies that combined exercise training withdidactic education, as compared with usual care [45] or withdidactic education alone [43,44].
Overall, a small body of fair-to-good quality evidence suggeststhat didactic and experiential group visits may be associated withsmall improvements. There is little methodologically soundevidence examining the impact of group visits in patients withasthma.

62 Citations i denti fie d fro m reference li sts of review articles, and manual search es for recent, unpublished or ongo ing stud ies
599 Pote ntial ly rele vant a rticle s i denti fie d for fur ther review
Total excluded articles = 51 5Non-Engli sh language = 17 No primar y data and not a n SR of primary stud ies = 56 Study po pulation not in s cope = 5 4 Does not meet interventio n criteria = 158 Not an RCT = 68 Outcome measures not in scope = 8 Full text not accessible = 29 Sha red medical a ppoint ment le d by a prescribing provider = 64 Use for cont extual purposes or referenc e mining = 39 Duplicate publication of same stu dy = 10 Pre-1998 DM study = 12
84 articles of 80 pri mar y studies of grou p visit s focu sing on e ducation for t he management of chronic conditions in adults
3,521 Citations i denti fie d for review of title and abstrac t
3,583 Potential ly relevant citations identified for further review
2,984 Citation s excluded due to lack of relevance in title or abst rac t
2,406 Citation s identified fro m electronic database sea rches after de duplication: 219 7 fro m M EDLI NE® via PubMed 78 fro m Coch rane library 44 fro m Ps ycINFO 87 fro m CINAH L
1,096 Citati ons derived fr om “shared medical appointment ” (SM A) lite rature search
Asthma/CO PD = 10
Chronic pain = 4
Hypertension/congestive heart failure = 12
Arthritis or history of falls = 21
Diabetes mellitus = 29
Multiple disease groups = 4
19 Studies used for SMA review, excluded
Fig. 1. Literature flow.
A.R. Quinones et al. / Patient Education and Counseling 95 (2014) 3–296
3.4. Hypertension, CHF/CAD
Our search identified three fair-quality studies of group visitsconducted in patients with heart failure in the Netherlands and theUS, published in four reports [47–50]. Seven studies examined theeffects of group visits on blood pressure in patients withhypertension [51–57]. The studies were conducted in a range ofinternational settings—Iran, the US, Thailand, Argentina, andItaly—and study quality varied widely. Three studies used self-management education techniques [52,55,56] and three studiesused didactic education [51–53,57] in comparison with usual care.One trial compared self-management education directly withdidactic education [54] Reductions in BP were noted in all threeself-management education studies [52,55,56] and in one didacticeducation study [51]. In the trial comparing self-managementeducation directly with didactic education, there were nosignificant reductions in BP found in either group at three months.However, significantly more self-management education patientshad controlled BP, defined as the proportion of patients with mean24-hour BP <140/90 mm Hg, compared with didactic education(70% vs. 44%, p = 0.04).
Overall, there were few studies of group visits in heartfailure patients, and their findings on self-efficacy, quality of
life, and biophysical measures were largely neutral. Groupself-management education interventions in patients withhypertension have reported improvements in BP control inshort-term and long-term studies, but the overall strength ofevidence is low.
3.5. Diabetes mellitus
We included 31 publications (29 studies) of group visits forpatients with diabetes [58–88] conduced in the US, Europe, Brazil,and Iran. We conducted meta-analyses of 17 studies comparing theeffects of group visits to usual care on HbA1c. Most of these trialswere conducted on large numbers of patients (Figs. 2 and 3). Loss tofollow-up was a concern when interpreting meta-analytic results.However, the majority of the 17 meta-analyzed trials (11 of 17)reported appropriate techniques to handle study attrition tominimize bias due to loss to follow-up (Appendix 4).
Overall, in 14 studies, group visits reduced HbA1c slightly moreover six months of follow-up than usual care, though there wassignificant heterogeneity which should temper confidence inthese results (mean change HbA1c = �0.27%; CI = �0.44, �0.11;I2 = 67.1%). At least part of the heterogeneity seemed to beassociated with study quality: the two good quality studies found

Overall (I-squared = 67 .1%, p = 0.00 0)
Stee d, 2005
Sharifira d, 201 2
Scain, 2009Lorig, 200 9
Khunti, 2012
Rygg, 2012
Group sessions <= 3 months
Lujan, 2007Miller, 20 02
Rosal, 2011
De Greef, 2011
Ande rson, 2005
Group sessions >3 monthsToobert, 20 11a
Brown, 20 02
Study
Sub total (I-squa red = 38.4%, p = 0.165 )
Sub total (I-squa red = 70.0%, p = 0.001 )
Phili s-Tsimika s, 20 11Poor
Poor
FairFair
Good
Fair
FairFair
Fair
Good
Poor
Fair
Poor
Quality
Poor
-0.27 (-0.44 , -0.11 )
-0.37 (-0.98, 0.24)
-0.32 (-0.51 , -0.13 )
-0.40 (-0.87, 0.07)0.06 (-0.18, 0.31 )
0.02 (-0.14, 0.18 )
-0.10 (-0.40, 0.20)
-0.75 (-1.20 , -0.30 )-0.50 (-0.78, -0.22 )
-0.53 (-0.92, -0.14 )
0.01 (-0.60, 0.62 )
0.21 (-0.31, 0.73 )
-0.40 (-0.83, 0.03)
-1.42 (-2.27, -0.57 )
Meandifference (95% CI)
-0.49 (-0.80 , -0.18 )
-0.20 (-0.38, -0.01 )
-0.10 (-0.72, 0.52)
-0.27 (-0.44 , -0.11 )
-0.37 (-0.98, 0.24)
-0.32 (-0.51 , -0.13 )
-0.40 (-0.87, 0.07)0.06 (-0.18, 0.31 )
0.02 (-0.14, 0.18 )
-0.10 (-0.40, 0.20)
-0.75 (-1.20 , -0.30 )-0.50 (-0.78, -0.22 )
-0.53 (-0.92, -0.14 )
0.01 (-0.60, 0.62 )
0.21 (-0.31, 0.73 )
-0.40 (-0.83, 0.03)
-1.42 (-2.27, -0.57 )
difference (95% CI)
-0.49 (-0.80 , -0.18 )
-0.20 (-0.38, -0.01 )
-0.10 (-0.72, 0.52)
0-2 -1.5 -1 -.5 0 .5 1
Favors treatmen t Favors control
(N=67)(N=824)(N=98)(N=150)(N=345 )(N=104)(N=146)(N=239)(N=97)
(N=280 )(N=252 )(N=256 )
(N=127 )(N=207 )
Fig. 2. Effect of group visits on HbA1c compared to usual care at �6 month follow-up, by duration of intervention.
A.R. Quinones et al. / Patient Education and Counseling 95 (2014) 3–29 7
no short-term improvements in HbA1c (mean changeHbA1c = 0.02; CI = �0.14, 0.17; I2 = 0.0%). Group visits lastingmore than three months had a greater effect on HbA1c improve-ment than those of shorter duration, but the quality of these longerduration intervention studies was also lower. We found
Overall ( I-squared = 56.9%, p = 0.013 )
Schilling er, 2009
Hornsten, 2008
Subt otal (I-squared = 53.8%, p = 0.043 )
Khunti, 201 2
Phili s-Tsim ika s, 201 1
Brown, 200 2
Subt otal (I-squared = 33.8%, p = 0.221 )
Rosal, 2011
Study
Group session s > 3 mon ths
Scain, 2009
Rygg, 2012
Group sessions <=3 month s
Toobe rt, 2011
Adolfsson , 200 7
Qualit y
Fair
Fair
Goo d
Poor
Poor
Fair
Fair
Fair
Fair
Fair
-2 -1.5 -1 -.5 Favors tr eatme nt
(N=82 4)
(N=10 4)(N=14 6)
(N= 101)
(N= 104)
(N= 339)(N= 252)
(N=280)(N= 256)
(N= 207)
Fig. 3. Effect of group visits compared to usual care on HbA1
similar effects on HbA1c at 7–12 months in the 10 studieswith longer-term follow-up. Funnel plot analyses showed noevidence of publication bias for 6 month outcomes (Egger biascoefficient = �1.62, CI = �3.73, 0.48), but some evidence ofpublication bias for 12 month outcomes (Egger bias
-0.23 (-0.44, -0.02 )
differen ce (95% CI )
0.20 (-0.25, 0.65)
-0.94 (-1.60 , -0.28 )
-0.33 (-0.63, -0.03 )
0.05 (-0.10, 0.20)
-0.60 (-1.34, 0. 14)
-0.79 (-1.40 , -0.18 )
-0.05 (-0.26, 0. 16)
-0.25 (-0.72, 0. 22)
Mean
-0.40 (-0.92, 0. 12)
-0.10 (-0.45, 0. 25)
0.00 (-0.48, 0.48)
-0.30 (-0.80, 0. 20)
-0.23 (-0.44, -0.02 )
differen ce (95% CI )
0.20 (-0.25, 0.65)
-0.94 (-1.60 , -0.28 )
-0.33 (-0.63, -0.03 )
0.05 (-0.10, 0.20)
-0.60 (-1.34, 0. 14)
-0.79 (-1.40 , -0.18 )
-0.05 (-0.26, 0. 16)
-0.2 5 (-0.72, 0. 22)
-0.40 (-0.92, 0. 12)
-0.10 (-0.45, 0. 25)
0.00 (-0.48, 0.48)
-0.30 (-0.80, 0. 20)
00 .5 1
Favors co ntrol
c at 7–12 month follow-up, by duration of intervention.

A.R. Quinones et al. / Patient Education and Counseling 95 (2014) 3–298
coefficient = �2.14, CI = �3.62, �0.66). Multivariate meta-regres-sion models showed that none of the covariates examined—duration, study quality, or publication year—were independentlyassociated with changes in HbA1c.
Five studies found improvements in self-efficacy, four of thesefinding positive effects beyond six months of follow-up. Perhapsnot surprisingly, the four studies focused on broader self-management rather than didactic education [66,69,76,80]. Despitefinding that some interventions may improve self-efficacy, therewas little evidence that group visits improved quality of life overthe short- or long-term. Few studies reported or were powered toevaluate utilization.
Eleven studies compared a group visits to one or more activeinterventions. Three of these studies found that interventionsfocused on self-management were associated with greaterimprovements in glycemic control than didactic approaches,though there were multiple other differences in the comparedinterventions, making it difficult to draw firm conclusions[63,68,87]. Two studies compared group to individual education.One fair-quality study found that an automated, telephone-based,self-management intervention performed similarly to an in-persongroup self-management intervention [80].
Overall, we found group visits in patients with diabetes mayhave modest effects on glycemic control over the short- and long-term, but the strength of evidence supporting this conclusion islow mostly because of inconsistencies across studies andmethodological weaknesses of the studies finding the mostpositive effects. Interventions focused on self-managementeducation were associated with improved self-efficacy and illnessbelief scores over the short- and long-term. However, there was noconsistent evidence that group visits improved quality of life.
3.6. Multiple chronic conditions
Four studies evaluated the Chronic Disease Self-ManagementProgram [89] in populations with multiple chronic conditions [90–93] in the US, China, and the Netherlands. Overall, the peer-led,community-based program was associated with medium-termimprovements in self-efficacy, health status, and utilization; andthese effects may persist long-term. These findings were based onmoderately strong evidence from two large US trials, but were notreplicated in other countries, and likely apply most to patientsengaged enough in care to agree to attend a multi-week course.
3.7. Chronic pain
Four studies evaluated group visits compared to usual care[94,95], educational reading materials [96], or individual treat-ment [97] in patients with chronic pain in the US and Europe.Though many findings were not statistically significant from thecomparison, some results favored group interventions. Overall, asmall body of literature suggests group-based self-managementeducation interventions may improve pain coping skills at leastover the short-term, though the strength of this evidence is lowbecause there were few studies and the methodological quality ofone of the studies finding benefit was poor.
3.8. Effects of patient characteristics
Relatively few studies examined how patient characteristicsmodified intervention effects. Overall, studies found little differencein group visit effectiveness according to patient demographic andsocioeconomic characteristics. However, among studies of arthritisand history of falls, two studies found that obese patients tended torespond to experiential (aerobic exercise) group visits more thanparticipants with lower BMI on self-reported disability [22] and falls
[34]. Among hypertension and heart failure studies, one study foundpatients with higher education and better cognitive status showedgreater short-term improvements in cardiac-specific quality of life[50]. One chronic pain study noted that group visit effectiveness wasmodified by agency-orientation, with high agency-oriented parti-cipants experiencing improvements in pain [98].
3.9. Group visits compared to other active interventions
Overall, in five studies, group visits focused on self-manage-ment were more effective than sessions limited to didacticeducation [25,54,68,71,99], however, in four of these five studies,the intervention arms differed considerably (e.g., having non-equivalent number of sessions), limiting the strength of thisconclusion. Studies that compared group to individual educationvisits found mixed results on a variety of outcomes, with noappreciable differences found in three studies [37,62,75], positiveeffects in four studies [35,63,87,97], and improvements forindividual relative to didactic education in one study [82]. Twostudies compared the effects of group self-management educationand mailed self-management programs, and found no differencesin self-efficacy, pain, and functional status outcomes [29,80].
4. Discussion and conclusion
We found 80 trials examining the effects of group visitinterventions across a variety of chronic illnesses. In general,many group visit interventions appear to be able to improve short-and medium-term patient self-efficacy (Table 1). There was littleconsistent, fair-to-good quality evidence that they improvedquality of life or utilization, though there was good evidence thatpeer-led, community-based self-management education programscould improve health status and utilization for patients withmultiple chronic conditions. Diabetes group visits were likelyassociated with small short-term improvements in glycemiccontrol—the longer-term effects are largely unknown since thevast majority of studies focused on short-term effects. Participa-tion rates varied widely across studies, but were often low (Tables3 and 4, Appendix 4). Findings from included studies are likelymost applicable to patients who are easy to contact, have time toparticipate, and have enough motivation to enroll in the program.
Chronic illness education is a highly complex endeavor withinterventions varying in their intended purpose, content, leader-ship, intensity, and format. Studies comparing two or more activeinterventions could help elucidate whether or not there are certainintervention factors associated with better outcomes. There werefew studies directly comparing didactic education approaches toself-management approaches, though, not surprisingly, moststudies finding improvements in self-efficacy focused on thelatter. Studies that compared group to individual approachesappear to have similar effects.
Learning and mastering chronic illness self-management is atime-consuming process. Theoretically, we might expect theduration of an intervention to be associated with its effectiveness,but we found it difficult to confirm this hypothesis. For example,we found greater improvement in glycemic control for interven-tions lasting longer than 3 months. However, the interventions oflonger duration were also of lower methodological quality.Unfortunately, we found few studies examining the effects of a‘‘booster’’ session.
It is unclear why the group visit literature has not found aconsistent effect on health, utilization, or quality of life outcomesdespite the logical inference that improved self-efficacy shouldlead to better disease control and outcomes. It is possible thatintervention or follow-up duration was inadequate. It is alsopossible that—in an era promoting clinical guidelines and quality

A.R. Quinones et al. / Patient Education and Counseling 95 (2014) 3–29 9
improvement—it is increasingly difficult to demonstrate incre-mental benefit because usual care has also improved. A recent trialof intensive diabetes treatment found few effects on healthoutcomes in part—as the authors speculate—because treatment inthe usual care group was quite good [100].
We found little cost-effectiveness data to guide decision-making of widespread investment in educational group visitmodalities. However, there is likely to be great variation in costsdepending on personnel, duration, and frequency considerations.Whether group visit expenditures are warranted may also dependon how highly proximate outcome measures—such as self-efficacy—are valued by patients and health systems.
On the other hand, peer-led, community-based self-manage-ment programs—such as the Chronic Disease Self-ManagementProgram—are low-cost and associated with improved self-efficacy, health status, and utilization. However, such programsdo not provide core skills and information patients might need tohelp self-manage illness (e.g., glucose self-monitoring). It is alsonot clear how much the community-based nature of theintervention matters. Offering the programs in communitycenters may make it easier for patients to participate on anongoing basis. It would be useful to use qualitative methods toshed more light on such issues.
Although we did not find evidence of direct harms associatedwith group visits, there are theoretic concerns, especially given thelack of robust evidence for long-term health outcomes. Forinstance, travel and participation time associated with groupvisits may preclude inclusion of patients with inflexible workschedules, and may be prohibitive for frail, older participants.
4.1. Limitations
In setting out to conduct this systematic review of group visitinterventions led by non-prescribing facilitators, a chief limitationis comparability of studies given vast heterogeneity and complex-ity of intervention content and outcomes examined. Althoughthere have been many published studies testing group visiteffectiveness, we found few with similar characteristics to beexplicitly compared. In addition, the sheer number of outcomesreported precluded reporting all outcomes. We pre-specifiedoutcomes that were commonly reported, clinically important, ormeasured self-efficacy since this was the broad intended effect ofthese interventions.
Table 1Summary of the evidence, by clinical area, outcome, and length of follow-up.
Condition Outcome Effecta GRADE
classificationb
Arthritis Self-efficacy
�6 months (+) Moderate
>6 months (+/�) Moderate
QOL/functional status
�6 months (�) Moderate
>6 months (�) Moderate
Physical performance
�6 months (0) –
>6 months (0) –
Utilization
�6 months (�) High
>6 months (�) High
Still, there may be important outcomes not captured in thisreview. Most notably, we did not consider knowledge improve-ment outcomes. Many studies reported various knowledge out-comes, but few were standardized, making any comparison acrossstudies difficult. Moreover, the clinical importance of short-termknowledge gains is debatable if they do not translate into gains inself-efficacy, health outcomes, or quality of life.
Additionally, we found good quality trials testing effectivenessof multicomponent interventions that included both, group andindividual elements. Unfortunately, these trials were not includedin our review because independent effects of group visits could notbe evaluated. Finally, we exclude non-English publications, thoughthe bias this exclusion may have introduced is likely to beminimized by searching multiple databases, bibliographies of keystudies, and communicating with experts.
4.2. Future research
Additional comparative studies evaluating alternatives foreducating patients are needed. Studies showing that mailed andphone-based self-management education programs were aseffective as in-person group visits are interesting and point toalternative educational modalities that may appeal to patientswith time or geographic constraints. Newer technologies such asmobile platforms and video-based interventions should also beevaluated as a means for delivering group education. The evidencebase would also benefit from a more standardized approach tooutcome reporting.
4.3. Practice implications
Group visits can improve short-term self-efficacy, but appear tohave little effect on quality of life and other health outcomes.Group visits may modestly reduce HbA1c in the short-term forpatients with diabetes. A peer-led, community-based self-man-agement program appears to improve health and utilizationoutcomes for patients with various chronic illnesses. Group visitsmay be as effective as individual visits and may represent areasonable alternative for educating patients with chronic illness,though varied and sometimes low participation and retentionsuggest they should not be the sole alternative.
Comment
Based on 10 studies, 7 of which were fair- to good-quality. Inconsistent
results among some studies limit the evidence base. Two large fair-
quality studies (n = 812; n = 544) have positive results; one good-quality
study (n = 34) and one fair-quality study (n = 218) have null findings.
Inconsistent results and infrequent reporting of long-term findings
among 5 studies.
Based on mainly fair-quality studies (7 of 10 studies). Variety of
instruments and subscales limit evidence base.
No significant findings in the 6 studies that examined long-term effects.
No evidence. Trials for group visits for patients with arthritis did not
report performance measures in the near- or long-term.
No significant effects on physician visits found in the near- or longer-
term in 6 studies.

Table 1 (Continued )
Condition Outcome Effecta GRADE
classificationb
Comment
History of falls Self-efficacy
�6 months (+) Low Based on only 1 small fair-quality trial (n = 83) with low participation.
>6 months (+) Moderate Based on 1 large good-quality trial (n = 310). Of note, this trial included a
booster session 3 months after intervention completion.
QOL/functional status
�6 months (�) Moderate Based on 1 small fair-quality trial (n = 83) with low participation.
>6 months (�) Moderate Based on 1 large good-quality trial (n = 310) that included a booster
session 3 months post-intervention.
Physical performance
�6 months (�) Moderate Based on 1 small fair-quality trial (n = 83) with low participation.
>6 months (+) Moderate Based on 1 large fair-quality trial (n = 454) with high participation and
low loss to follow-up.
Fall events
�6 months (�) Low Based on only 1 small poor-quality trial (n = 45) with unclear reporting
of findings.
>6 months (+/�) Moderate Based on 2 trials, one good-quality trial (n = 310) detailing positive
results and one fair-quality trial (n = 454) with null findings.
Asthma Self-efficacy
�6 months (�) Low Based on only 1 poor-quality trial (n = 125).
>6 months (0) – No evidence. Findings for self-efficacy not reported in the long-term.
QOL/functional status
�6 months (�) Low Based on only 1 poor-quality trial (n = 125).
>6 months (+) Low Based on only 1 large fair-quality trial (n = 323) with poor participation.
Physical performance
�6 months (0) – No evidence. Trials for patients with asthma did not report performance
outcomes.>6 months (0) –
Utilization
�6 months (+) Moderate Decreased ED visit findings based on 1 large fair-quality trial (n = 241)
with low participation.
>6 months (+/�) Moderate Limited by inconsistent results and poor participation. Based on 2 large
fair-quality studies (n = 323; n = 241) with low participation.
COPD Self-efficacy
�6 months (0) – No evidence. Trials on patients with COPD did not examine self-efficacy
scales.>6 months (0) –
QOL/functional status
�6 months (0) – No evidence.
>6 months (�) Moderate Based on 1 small good-quality trial (n = 45).
Physical performance
�6 months (�) Moderate Based on only 1 good-quality trial (n = 238) limited by poor
participation.
>6 months (+/�) Moderate Inconsistent findings from 2 good-quality trials of varying size (n = 238;
n = 45). The small trial reported improvements in walking distance
while the findings from the large trial were null.
Utilization
�6 months (0) – No evidence.
>6 months (�) Moderate Based on 1 small good-quality trial (n = 45).
Hypertension Self-efficacy
�6 months (0) – No evidence.
>6 months (0) –
QOL/functional status
�6 months (0) – No evidence.
>6 months (0) –
Biophysical
�6 months (+/�) Moderate Based on 4 trials of varying quality and size (n = 52; n = 96; n = 98;
n = 574). Inconsistent results, however improvements in blood pressure
found in the large good-quality trial (n = 574).
>6 months (+/�) Moderate Infrequent reporting of long-term effects. Based on 2 trials of varying
quality (poor, n = 292; good, n = 574). Good-quality trial found no long
term significant blood pressure changes.
Utilization
�6 months (0) – No evidence.
>6 months (0) –
CHF/CAD Self-efficacy
�6 months (�) Moderate Based on 2 large good- (n = 317) and fair-quality trials (n = 250). Null
findings in the near- and long-term, however both studies are limited
by poor participation and high loss to follow-up.
>6 months (�) Moderate
QOL/functional status
�6 months (�) Moderate Based on 1 large good-quality trial (n = 317) and one small fair quality
trial (n = 62) of Veterans. Limited by low study participation.
>6 months (�) Moderate Only 1 large good-quality trial (n = 317) examined quality of life
outcomes in the longer term.
Biophysical
�6 months (�) Moderate Only 1 large good-quality trial (n = 317) examined BMI in the near- and
longer-term, with no significant changes detected post intervention.>6 months (�) Moderate
A.R. Quinones et al. / Patient Education and Counseling 95 (2014) 3–2910

Table 1 (Continued )
Condition Outcome Effecta GRADE
classificationb
Comment
Diabetes mellitus Self-efficacy
�6 months (+) Moderate Based on 10 studies of varying quality reporting on self-efficacy. All
except one (fair-quality, n = 146) reported improvements in self-
efficacy, including a large good-quality trial (n = 824). Heterogeneity in
instruments reported limits evidence.
>6 months (+/�) Moderate Inconsistent findings reported in the long-term. Large good-quality trial
(n = 824) reports improvements continue into the longer-term.
QOL/functional status
�6 months (�) Moderate Based on 7 studies of varying quality reporting on a variety of
instruments.
>6 months (�) Moderate Based on 5 studies of varying quality reporting on a variety of
instruments.
Biophysical (HbA1c)
�6 months (+/�) Moderate 14 studies of varying quality reported small improvements in HbA1c in
the near-term. However, two good-quality studies (n = 67; n = 824)
found no near-term improvements in HbA1c.
>6 months (+/�) Moderate 10 studies of varying quality reported small improvements in HbA1c in
the longer-term. Again, one good-quality study (n = 824) reported no
benefit in glycemic control for the intervention group.
Utilization
�6 months (�) Moderate 3 trials of varying quality (poor-quality, n = 54; fair-quality, n = 345; fair
quality n = 146) found no significant change in clinician visits, ED visits,
or days hospitalized.
>6 months (�) Low Only 1 trial of fair-quality (n = 146) reported null findings on change in
clinician visits.
Multiple chronic
conditions
Self-efficacy
�6 months (+/�) Moderate Based on 4 large trials of mostly fair quality and one poor-quality trial
(n = 952; n = 551; n = 954; poor-quality n = 136). Findings limited by
inconsistent outcomes and variety of instruments reported.
>6 months (+) Moderate Based on only 1 large fair-quality trial (n = 551) reporting improvement
in self-efficacy sustaining into the longer-term.
QOL/functional status
�6 months (+) Moderate Based on 1 large fair-quality (n = 952) and 1 poor-quality trial (n = 136)
with inconsistent findings. The large fair-quality study reported
improvements.
>6 months (0) – No evidence. Longer-term outcomes not reported.
Utilization
�6 months (+/�) Moderate Based on 3 large fair-quality trials (n = 952; n = 551; n = 954). Null
findings for change in physician visits, and inconsistent findings for
hospital stays/days and ED visits.
>6 months (+/�) Moderate Based on 1 large fair-quality trial (n = 551) that found reduction in ED
visits, but no change for physician visits and hospital days.
Chronic pain Self-efficacy
�6 months (+/�) Low Based on 3 studies of fair- and good-quality (n = 45; n = 131; n = 156).
Limited evidence due to number of instruments reported and
inconsistent findings. Good-quality trial (n = 156) reported null
findings.
>6 months (0) – No evidence. Longer-term outcomes not reported.
QOL/functional status
�6 months (+/�) Moderate Based on 3 studies of varying quality (n = 45; n = 174; n = 156). Large trial
(n = 156) reported positive findings. Limited evidence stemming from
number of instruments reported.
>6 months (+) Low Based on only 1 poor-quality trial (n = 174) that reported improvement
in pain but did not report appropriate statistical test results (p-values).
Utilization
�6 months (+) Low Based on only 1 poor-quality trial (n = 174) that reported a reduction in
physician visits. The study did not report appropriate statistical test
results (p-values) in the longer-term.
>6 months (+) Low
Notes: GRADE = grades of recommendation, assessment, development, and evaluation; QOL = quality of life; CHF = congestive heart failure; CAD = coronary artery disease;
BMI = body mass index; ED = emergency department.a Effect: (+) benefit; (�) harm; (�) mixed findings/no effect; (0) no evidence.b GRADE classification: high = further research is very unlikely to change our confidence on the estimate of effect; moderate = further research is likely to have an important
impact on our confidence in the estimate of effect and may change the estimate; low = further research is very likely to have an important impact on our confidence in the
estimate of effect and is likely to change the estimate; very low = any estimate of effect is very uncertain.
A.R. Quinones et al. / Patient Education and Counseling 95 (2014) 3–29 11

Table 2Characteristics of group visit interventions focusing on education for the management of chronic disease.
Study Sample size
Setting
Program name,
if applicable
Demographics:
Mean age
% male
% minority Mean
disease duration
GV structure:
# Visits, frequency
Duration
Group size
GV content:
SME (self-
management)
DE (didactic)
EE (experiential)
GV leaders:
Number of leaders
Profession type
Comparator
Arthritis
Ackerman,
2012 [17]
N = 120
Australia
ASMP
65.1 yrs
40%
Race NR
Duration NR
6 weekly (2 h) sessions
1.5 months
4–21 patients
SME 2 leaders
Peer leader, health
professional
Usual care
(information book)
Barlow,
2000 [18]
N = 544
UK
ASMP
58.1 yrs
16%
4% nonwhite
11 yrs with arthritis
6 weekly (2 h) sessions
1.5 months
�10 patients
SME 2 leaders
Peer leaders
Usual care
Breedland,
2011 [19]
N = 34
Netherlands
FIT
48 yrs
29%
Race NR
9.7 yrs with RA
8 weekly (1 h)
education
16 semi-weekly (1.5 h)
exercise
2 months
Group size NR
DE, EE 5 team members
Psychologist, PT, OT,
dietitian, social worker
Usual care
Buszewicz,
2006 [20]
N = 812
UK
ASMP
68.6 yrs
37%
0.5% Caribbean black
Duration NR
6 weekly (2.5 h)
sessions
1.5 months
12–18 patients
SME, EE NR Usual care
(information book)
Ettinger,
1997 [22]
N = 439
US
FAST
69 yrs
30%
26% black
Duration NR
3 monthly (1.5 h)
sessions
18 biweekly and
monthly calls
18 months
10–15 patients
DE 2 leaders
Exercise leader, nurse
Group exercise arms:
GV2: 36 (1 h) aerobic
GV3: 36 (1 h) resistance
Class sizes 10–15
Freeman,
2002 [23]
N = 54
UK
51.4 yrs
15%
Race NR
4.5 months with RA
4 weekly (2 h) sessions
1 month
Group size NR
GV1: SME
GV2: DE
3 team members
Physiotherapist,
rheumatologist,
psychologist
GV2
Giraudet-Le
Quintrec,
2007 [24]
N = 208
France
54.8 yrs
14.1%
Race NR
13.1 yrs with RA
8 weekly (6 h) sessions
1 (4 h) booster after 6
months
2 months
8–10 patients
DE, EE 10 team members
Rheumatologist, rehab.
specialist, dietitian,
social assist., nurses,
PTs, and OTs
Usual care+:
Two information
leaflets written by
research team
Hammond,
1999 [16]
N = 35
UK
55.2 yrs
17%
Race NR
9.8 yrs with RA
4 weekly (2 h) sessions
Optional home visit 2
wks post
1 month
4–8 patients + spouses
invited
SME 1 leader
Rheumatology OT
Usual care
Hammond,
2008 [99]
N = 167
UK
LMAP
55.4 yrs
35%
Race NR
7.4 yrs with RA
GV1:
9 sessions (2.5 h) over 9
mo
12 months
6–10 patients
GV2:
5 (2 h) sessions
1.25 months
8–12 patients
GV1: SME, EE
GV2: DE, EE
3 leaders
Rheumatology OT,
community OT,
rheumatology PT
GV2
Hewlett,
2011 [25]
N = 127
UK
59.2 yrs
27%
Race NR
14 yrs with RA
GV1:
6 weekly (2 h) sessions
1 booster session (wk
14)
1.5 months
4–9 patients
GV2:
1 (1 h) session
Delivered by RA nurse
GV1: SME
GV2: DE
2 leaders
Clinical psychologist,
specialist OT
GV2
Kaplan,
1981 [26]
N = 34
US
48.2 yrs
0%
9% nonwhite
Duration NR
GV1:
1 (2.5 h) education
session
12 weekly (1–2 h)
counseling
4 months
GV2:
1 (2.5 h) education
session
Group size NR
GV1: DE,
counseling
GV2: DE
2 leaders
Patient counselor,
psychiatrist
GV2
Lorig,
1985 [27]
N = 286
US
ASMP
67.4 yrs
17%
3% nonwhite
Duration NR
6 sessions (2 h) over 4
months
4 months
15–20 patients + family
SME 2 leaders
Trained peer leaders
Usual care
A.R. Quinones et al. / Patient Education and Counseling 95 (2014) 3–2912

Table 2 (Continued )
Study Sample size
Setting
Program name,
if applicable
Demographics:
Mean age
% male
% minority Mean
disease duration
GV structure:
# Visits, frequency
Duration
Group size
GV content:
SME (self-
management)
DE (didactic)
EE (experiential)
GV leaders:
Number of leaders
Profession type
Comparator
Lorig,
1999 [28]
N = 331
US
ASMP
62.5 yrs
16%
100% Latino
Duration NR
6 sessions (2 h) over 6
weeks
1.5 months
10–15 patients and
family
SME Lay leaders Usual care
Lorig,
2004 [29]
N = 341
US
ASMP
65.2 yrs
25%
10% nonwhite
Duration NR
6 weekly (2 h) sessions
1.5 months
Group size NR
SME 2 leaders
Trained peer leaders
SMART group: mailed
individual self-
management program
Riemsma,
2003 [30]
N = 218
Netherlands
56.4 yrs
38%
Race NR
11.7 yrs with RA
5 weekly (2 h) sessions
3 (2 h) booster sessions
1.25 months
8 patients � spouses
GV1: SME, EE
(patients only)
GV2: SME, EE
(spouses included)
2 leaders
RA nurse, nurse
GV2, and
Usual care+: self-help
guide
Sevick,
2009 [31]
N = 316
US
ADAPT
69 yrs
28%
24% nonwhite
Duration NR
GV1:
3� month, months 1–4
Biweekly, months 5–6
Monthly, months 7–18
18 months
GV2:
GV1 structure +
3�/week grp exercise,
months 1–4
Group sizes NR
GV1: DE
GV2: DE, exercise
NR GV2, and
Healthy lifestyle group:
Monthly (1 h) DE GV,
months 1–3; monthly
phone contact, months
4–5; bimonthly phone
contact months 6–18
Taal,
1993 [32]
N = 75
Netherlands
49.6 yrs
20%
Race NR
4.3 yrs with RA
5 weekly (2 h) sessions
1.25 months
6–8 patients
SME, EE 2 leaders
RA nurse,
physiotherapist, or
social worker
Usual care+:
individual referral to
physiotherapist
History of falls
Arnold,
2010 [33]
N = 83
Canada
74.5 yrs
29%
Race NR
7.6 yrs with hip pain
GV1:
22 semiweekly (1.5 h)
sessions
2.75 months
GV2:
22 semiweekly (0.75 h)
sessions
2.75 months
Group sizes NR
GV1: DE, EE,
aquatic exercise
GV2: EE, aquatic
exercise
2 leaders
Aquatic fitness
instructor, PT
Usual care, and GV2
Clemson,
2004 [34]
N = 310
Australia
Stepping On
78.4 yrs
26%
Race NR
Duration NR
7 (2 h) sessions over 7
weeks
1 (1.5 h) booster (after
3mo)
1.75 months
12 patients
DE, EE OT with geriatrics
experience, team of
content experts for
educational areas
Usual care+:
�2 home social visits
from OT student
instructed not to
discuss falls or falls
prevention
Ryan,
1996 [35]
N = 45
US
78 yrs
0%
66% black
Duration NR
1 (1 h) session
1 day
7–8 women
DE 1 leader
Nurse
Individual visit, and
Usual care+: Health
promotion session with
no falls prevention info
Shumway-Cook,
2007 [36]
N = 454
US
75.6 yrs
23%
4% nonwhite
Duration NR
6 monthly (1 h)
sessions
6 months
Group size NR
DE, exercise 1 leader
Nurse
Usual care
(two CDC informational
brochures)
Asthma
Wilson,
1993 [37]
N = 323
US
NR 4 weekly sessions
1 month
6–8 patients
SME 1 leader
Nurse educator
3 comparators:
1) individual education
2) usual care with
workbook
3) usual care with no
supplemental
education
Abdulwadud,
1999 [38]
N = 125
Australia
Australian Asthma
Management
Program
Mean age 45.6
40% male
Race NR
Duration NR
3 weekly sessions
3 weeks
Up to 13 patients
DE 1 leader
Nurse educator
Usual care
Allen,
1995 [39]
N = 116
Australia
Mean age 40
46% male
Race NR
Duration NR
4 weekly sessions
4 weeks
10–12 patients
DE 2 leaders
Asthma educators
Usual care
Bolton,
1991 [40]
N = 241
US
Mean age 38
34% male
67% non-white
Duration NR
3 sessions
Duration NR
6–10 patients
DE 1 leader
Nurse educator
Usual care
A.R. Quinones et al. / Patient Education and Counseling 95 (2014) 3–29 13

Table 2 (Continued )
Study Sample size
Setting
Program name,
if applicable
Demographics:
Mean age
% male
% minority Mean
disease duration
GV structure:
# Visits, frequency
Duration
Group size
GV content:
SME (self-
management)
DE (didactic)
EE (experiential)
GV leaders:
Number of leaders
Profession type
Comparator
Snyder,
1987 [41]
N = 79
US
Wheezers
Anonymous
Mean age 28
45% male
Race NR
Duration NR
2 sessions, NOS
Duration NR
8–12 patients
DE 1 leader
Respiratory therapist
Usual care
COPD
Wilson,
2008 [42]
N = 91
Northern Ireland
Mean age 61
48% male
Race NR
Duration NR
Current smokers
5 weekly sessions
5 weeks total
N per session NR
SME 1 leader
Respiratory Nurse
Specialist
Usual care (n = 35),
Individual support
(n = 27)
Kunik,
2008 [46]
N = 238
US VAMC
Mean age 66
96% male
16% Black
3% Hispanic
8 weekly sessions
8 weeks
Up to 10 patients
SME: CBT 1 leader
Psychology intern or
post-doctoral fellow
with CBT experience
DE group education
Bestall,
2003 [43]
N = 66
UK
Mean age 69
51% male
Race NR
Duration NR
16 DE bi-weekly
sessions, 8 weeks total
(both groups), followed
by 10 EE monthly
sessions, 1 year total
(exercise group only)
N per session NR
DE + EE: exercise NR DE group education
Effing,
2011 [44]
N = 159
Netherlands
COPE-active
Mean age 63
58% male
Race NR
Duration NR
35% smokers
DE: 4 weekly sessions/1
month total; 5 patients
EE: 2–3 times/week, 11
months total; 2–3
patients
DE + EE: exercise 2 leaders
Respiratory nurse
Physiotherapist
DE group education
Ninot,
2011 [45]
N = 45
France
Mean age 63
84% male
Race NR
Duration NR
26% smokers
8 sessions, 2� week
4 weeks total
DE + EE: exercise 2 leaders
DE led by health
professional, EE led by
exercise trainer
Usual care
CHF/CAD
Smeulders,
2010 [49,50]
N = 317
Netherlands
CDSMP
Mean age 67 73% male
Race NR
Duration NR
6 weekly sessions
6 weeks total
6–12 patients
SME 2 leaders
Cardiac nurse specialist
CHF patient peer leader
Usual care
Chang,
2005 [48]
N = 62
US VAMC
Mean age 69
% male NR
17% non-white
Duration NR
15 weekly sessions
15 weeks total
Group size NR
DE Experts on medical,
pharmaceutical,
lifestyle, nutrition, and
psychosocial issues
Usual care
Moore,
2006 [47]
N = 250
US
CHANGE
Mean age 62
17% black
2% non-white, NOS
Duration NR
5 sessions: 3 weekly
followed by 2 monthly
3 months total
6–8 patients
SME 1 leader
Cardiac nurse
Usual care
Hypertension
Baghianimogha-
dam [57]
N = 150
Iran
Mean age 57.9
39% male
Race NR
Duration 6.77 yr
Frequency NR
2 months total
Group size NR
DE + EE 1 leader
Health education
researcher
Usual care
Nessman,
1980 [51]
N = 52
US VAMC
Mean age 55
10% black
16% Mexican-American
Duration NR
8 weekly sessions
8 weeks total
Group size NR
DE 2 leaders
Nurse, psychologist
Informational control
(audiotape)
Rujiwatthanakorn,
2011 [52]
N = 96
Thailand
Mean age 61
40% male
Race NR
Duration NR
3 sessions
8 weeks total
6–7 patients
Duration NR
SME 1 leader
Nurse
Usual care
Balcazar,
2009 [53]
N = 98
US
Mean age 53
21% male
100% Mexican-
American, 87% born in
Mexico
Duration NR
4 sessions at weeks 1, 2,
3, 8
8 weeks total
15–20 patients
DE 2 leaders
Promotoras (Mexican-
American community
health workers)
Informational control
Figar,
2006 [54]
N = 60
Argentina
PEM
Mean age 69
57% male
Duration NR
4 weekly sessions
4 weeks
10 patients
SME Physicians with
experience in HTN
education/
management
DE
Scala,
2008 [55]
N = 292
Italy
Mean age 62
42% male
Race NR
Duration NR
3 sessions
4 months total
4–5 patients
SME 1 leader
Moderator, tutor
assistants
Informational control
A.R. Quinones et al. / Patient Education and Counseling 95 (2014) 3–2914

Table 2 (Continued )
Study Sample size
Setting
Program name,
if applicable
Demographics:
Mean age
% male
% minority Mean
disease duration
GV structure:
# Visits, frequency
Duration
Group size
GV content:
SME (self-
management)
DE (didactic)
EE (experiential)
GV leaders:
Number of leaders
Profession type
Comparator
Svetkey,
2009 [56]
N = 574
US
Mean age 60.5
39% male
37% black
1% Hispanic
Duration NR
20 weekly sessions
6 months total
10–15 patients
SME 2 leaders
Behavioral
interventionist,
assistants (community
health advisors)
Usual care
Diabetes mellitus
Adolfsson,
2007 [58]
N = 101
Sweden
63.1 yrs
54%
Minority NR
6.6 yrs with DM
4 (2.5 h) sessions
1 booster (2.5 h) within
7 months
5–8 patients
DE 7 physicians and 12
diabetes specialist
nurses
Usual care
Anderson,
2005 [59]
N = 239
US
61 yrs
18%
96% minority
8.5 yrs with DM
6 weekly (2 h) sessions
1.5 months
Group size NR
SME Certified diabetes
educators
Usual care
Brown,
2002 [60]
N = 256
US
The Starr County
Border Health
Initiative
54 yrs
36%
Race NR
7.85 yrs with DM
12 weekly, 12
biweekly, 3 monthly
(2 h) sessions
12 months
Group size NR
DE, EE Bilingual Mexican
American nurses,
dietitians, local
community workers
Usual care
Brown,
2005 [61]
N = 216
US
The Starr County
Border Health
Initiative
49.6 yrs
40%
Race NR
5.1 yrs with DM
GV1:
3 weekly, 12 biweekly,
3 monthly (2 h)
sessions
12 months
Group size NR
GV2:
8 weekly (2 h) sessions
3 support @ 3, 6, and 12
months
8 patients
DE, EE Bilingual Mexican
American nurses,
dietitians, local
community workers
GV2
De Greef,
2011 [62]
N = 67
Belgium
67.4 yrs
70.1%
Minority NR
64.5% diagnosed <5 yr
3 (1.5 h) sessions every
3wks
3 months
Group size NR
SME Clinical psychologist Usual care;
individual visit arm:
3 (15 min) visits with
similar content to GV
Deakin,
2006a [63]
N = 314
UK
61.6 yrs
Gender NR
Race NR
6.7 yrs with DM
6 weekly (2 h) sessions
1.5 months
16 patients (mean)
SME 1 diabetes research
dietitian/educator
Usual care+:
diabetes education and
review with individual
appointments with a
dietitian (30 min),
practice nurse (15 min)
and physician (10 min)
Dejesus,
2009 [64]
N = 54
US
76% aged 60+
48%
Race NR
Duration NR
1 session
7 patients
DE Diabetes nurse
educator
Usual care
Hornsten,
2008 [65]
N = 104
Sweden
63 yrs
54%
Race NR
All diagnosed � 2yrs
10 (2 h) sessions over 9
months
9 months
5–8 patients
SME Diabetes nurses Usual care
Khunti,
2012 [66]
Davies,
2008 [67]
N = 824
UK
DESMOND
59.5 yrs
55% male
6% minority
Duration NR
1 (6 h) session
1 day or 2 half-days
Group size NR
SME Healthcare professional Usual care+:
(resources to provide
equivalent contact time
as intervention)
Kulzer,
2007a [68]
N = 193
Germany
Mean age 55.6
50.3% male
Race NR
Mean duration 6.6 yrs
GV1: 4 DE sessions
GV2: 12 SME sessions
GV3: 6 SME sessions + 6
IV
Duration NR
Group size 6–10
GV1: DE
GV2: SME
Health psychologist Self-management
education - 6 90 min
group lessons and 6
90 min individual
lessons
Lorig,
2009 [69]
N = 345
US
DSMP
66.55 yrs
35.7%
32.7% minority
Duration NR
6 weekly (2.5 h)
sessions
1.5 months
10–15 patients
SME Peer leaders Usual care
Lujan,
2007 [70]
N = 150
US
58 yrs
20%
100% Mexican origin
Duration NR
8 weekly (2 h) sessions
2 months
6 patients (English
class)
23 patients (Spanish
class)
DE 2 leaders
Promotoras, nurses,
dietitians, social
workers
Usual care
(2 pamphlets)
A.R. Quinones et al. / Patient Education and Counseling 95 (2014) 3–29 15

Table 2 (Continued )
Study Sample size
Setting
Program name,
if applicable
Demographics:
Mean age
% male
% minority Mean
disease duration
GV structure:
# Visits, frequency
Duration
Group size
GV content:
SME (self-
management)
DE (didactic)
EE (experiential)
GV leaders:
Number of leaders
Profession type
Comparator
Melkus,
2010a [71]
N = 109
UK
46 yrs
0%
100% minority
Duration NR
11 weekly (1–2 h)
sessions
3 months
Group size NR
SME Nurse practitioner Culturally neutral
group DE (10 weekly
sessions)
Miller,
2002 [72]
N = 98
US
72.5 yrs
47%
17% black
7.2 yrs
GV1:
10 weekly (1.5–2 h)
sessions
2.5 months
Group size NR
GV2:
Offered 6 (2 h) sessions
Group size NR
GV1: DE, EE
GV2: DE
Dietitian GV2 (participants were
mailed printed material
if they did not attend
the group session)
Philis-Tsimikas,
2011 [73]
N = 207
US
Project Dulce
50.7 years
29% male
Minority NR
Duration NR
8 weekly (2 h) sessions
8 monthly support
groups
10 months
Group size NR
DE Trained peer educator Usual care
Raji,
2002a [74]
N = 106
US
VAMC
Mean age 60 yrs
99% male
Race NR
Duration NR
4 daily sessions
4 sequential days
4–6 patients
DE Physician, nurse,
nutritionist,
pharmacist, exercise
physiologist, social
worker, and diabetes
educator
2 comparators: passive
education and no-
intervention
Rickheim,
2002a [75]
N = 170
US
Mean age 52.5
34% male
Race 7% non-white?
Duration 0.9 yrs
4 sessions (at 0, 2 wks,
3mo, 6 mo)
6 months total
DE A diabetes nurse
specialist (RN) and
diabetes nutrition
specialist (RD)
Individual education
sessions
Rosal,
2011 [76]
N = 252
US
Latinos en Control
83.7% aged 45+
23.4%
87.7% minority
31.3% diagnosed <5 yr
12 weekly + 8 monthly
First session (1 h)
individual Remaining
(2.5 h) group
11 months
Group size NR
SME, EE Nutritionist or health
educator and lay leader
or 3 supervised lay
leaders
Usual care
Rygg,
2012 [77]
N = 146
Norway
66 yrs
55%
0%
5 yrs with DM
3 biweekly (5 h)
sessions
1.25 months
8–10 patients
DE, EE Diabetes nurses; also
included physician,
physiotherapist,
nutritionist, and lay
person
Usual care
Sarkadi,
2004a [78]
N = 77
Sweden
Mean age 66
% male NR
Race NR
Duration 5.9 yrs
treatment; 2.6 yrs
control
12 monthly sessions
1 year total
Group size NR
DE Pharmacists trained to
be facilitators, and a
nurse specialist
Usual care
Scain,
2009 [79]
N = 104
Brazil
59 yrs
47%
9.4% black
10.5 yrs
4 weekly (2 h) sessions
1 months
8–10 patients
DE NR Usual care
Schillinger,
2009 [80]
N = 339
US
IDEALL
56.1 years
41% male
92.3% minority
Duration NR
9 monthly (1.5 h)
sessions
9 months
6–10 patients
SME 2 leaders
Physician and
language-concordant
health educator
Usual care;
automated telephone
self-management
support group (39
weekly, automated
calls over 9 months,
nurse phone follow-up)
Sharifirad,
2012 [81]
N = 97
Iran
BASNEF
67.05 yrs
35%
Minority NR
14 yrs with DM
4 (70 min) sessions
1 month
Group size NR
DE Physician, specialist of
endocrine disorder,
diabetes nurse, and
nutritionist.
Usual care
Sperl-Hillen,
2011a [82]
N = 623
US
IDEA
Mean age 61.8
50.6% male
22.1% Hispanic
5.5% Black
Duration 11.7 yrs
4 weekly sessions
4 weeks total
1–10 patients (mean 5)
DE Nurses and dietitians
trained to facilitate GE
sessions
3 individual education
sessions at 1-month
intervals
Steed,
2005 [83]
N = 127
UK
UCL-DSMP
59.8 yrs
71.2% male
51% minority
10.8 years
5 weekly (2.5 h)
sessions
1 booster (2.5 h) @ 3
months
1.25 months
Group size NR
SME Diabetes specialist
nurses and dietitians
Usual care
A.R. Quinones et al. / Patient Education and Counseling 95 (2014) 3–2916

Table 2 (Continued )
Study Sample size
Setting
Program name,
if applicable
Demographics:
Mean age
% male
% minority Mean
disease duration
GV structure:
# Visits, frequency
Duration
Group size
GV content:
SME (self-
management)
DE (didactic)
EE (experiential)
GV leaders:
Number of leaders
Profession type
Comparator
Surwit,
2002a [84]
N = 108
US
Mean age 57.4
58.3% male
8.3% Black
1% Asian
5 weekly sessions
5 weeks total
Group size NR
EE NR DE group visits
Toobert,
2011 [85]
N = 280
US
!
Viva Bien!
57.11 yrs
0%
100% minority
10.4 yrs with DM
2.5-day retreat + 36
weekly and biweekly
sessions
12 months
Group size NR
DE, EE Bilingual physician,
dietitian, exercise
instructor, bilingual
facilitator
Usual care
Weinger,
2011a [87]
N = 222
US
52.5 yrs
49.5%
10.3% minority
17.2 yrs with DM
5 (2 h) sessions over 6
wks
1.5 months
Group size NR
SME Certified diabetes
educator
Unlimited access to
individual DM nurse
and dietitian visits
Zapotoczky,
2001a [88]
N = 34
Austria
Mean age 62 yrs
36% male
12 monthly sessions
1 year total
18 patients
DE Clinical dietitian All subjects received 4-
wk group education.
Controls received usual
care with no further
group education.
Multiple chronic conditions
Lorig,
1999 [93]
N = 952a US CDSMP Mean age 65
35% male
9.7% non-white
Duration NR (heart
disease, lung disease,
arthritis, and stroke)
7 weekly sessions
7 weeks total
10–15 patients
SME 2 trained peer leaders Usual care
Lorig,
2003 [92]
N = 551
US
CDSMP (Spanish)
Mean age 57
21% male
Race NR
Duration NR
6 weekly sessions
6 weeks total
10–15 patients
SME 2 trained peer leaders Usual care
Fu, 2003 [91] N = 954
China
CDSMP
Mean age 64
29% male
Race NR
Duration NR
7 weekly sessions
7 weeks total
Group size NR
SME 2 trained peer
volunteer leaders
Usual care
Elzen,
2007 [90]
N = 136
Netherlands
CDSMP
Mean age 68
37% male
Race NR
Duration NR
6 weekly sessions
6 weeks
10–13 patients
SME 2 psychologists or 1
psychologist plus peer
leader
Usual care
Chronic pain
Ersek,
2003 [96]
N = 45
US
Age 81.9
Gender 13%
Race 84.71% Caucasian
Duration NR
7 weekly sessions
8 weeks
3–8 patients
SME 2 leaders
Doctoral-level health
providers
Receipt of an
educational booklet on
pain
Gustavsson,
2010 [97]
N = 156
Sweden
PASS
Age 45.7
Gender 11%
Race NR
Duration NR
7 weekly sessions
7 weeks + 1 booster at
week 20
Group size NR
SME, EE 1 leader
Physical therapists
Individual physical
therapy sessions
Haugli, 2000,
2003 [94,98]
N = 174
Norway
Age 43.08
Gender 2.27%
Race NR
Duration 9.89 years
12 every-other-week
sessions
9 months (including a
summer break)
6–10 patients
SME 2 leaders
Nurses, physicians
physiotherapists
Usual care
Vlaeyen,
1996 [95]
N = 131
Netherlands
Age 44
Gender 12%
Race NR
Duration 10.2 years
12 sessions
6 weeks
Maximum of 6 patients
GV1: SME, EE
GV2: DE, EE
Rehabilitation staff,
psychologist
Usual care
a Not included in meta-analysis.
A.R. Quinones et al. / Patient Education and Counseling 95 (2014) 3–29 17

Table 3Findings from studies comparing group visits to usual care.
Study
Sample size
Outcome (range
or units, as applicable)
Findings by time periodaUnless otherwise noted, results represent the difference in mean change from baseline (Treatment – Control,
95% CI), or the mean (SD) change from baseline comparing Treatment vs. Control.
GV duration
(months);
# sessions
% Participationb
/% Loss to
follow-upc
Study
quality
0–3 mo 4–6 mo 7–12 mo 13+ mo
ArthritisSelf-efficacy
Ackerman, 2012 [17]
N = 120
heiQ – Skill and technique
acquisition (range 1–6)
0.18 (–0.03 to 0.39) NR 0.07 (�0.18 to 0.32) NR 1.5/6 25/22 Poor
Barlow, 2000 [18]
N = 544
ASES (pain, 5–50 "= better) NR 2.65 (0.85 to 4.44) NR NR 1.5/6 NR/22 Fair
Breedland, 2011 [19]
N = 34
ASES (pain + other symptoms) Mean change (SD), T vs.
C: 0.42 (0.71) vs. 0.28
(0.85)
NR NR NR 2/24 NR/6 Good
ASES (function) Mean change (SD), T vs.
C: 0.29 (0.57) vs. 0.10
(0.38)
NR NR NR
Buszewicz, 2006 [20]
N = 812
ASES (pain) NR 1.63 (0.83 to 2.43) 0.98 (0.07 to 1.89) NR 1.5/6 30/24 Fair
Giraudet-Le Quintrec,
2007 [24]
N = 208
AHI (coping) NR NR �1.22 (5.55) vs. 0.22
(3.81), p = 0.0319
NR 2 (+ booster at 4)/9 18/9 Fair
Hammond, 1999 [16]
N = 35
ASES Median (IQR), T vs. C:
5.40 (3.63 to 6.70) vs.
5.50 (4.10 to 7.55)
NR NR NR 1/4 NR/31 Fair
Lorig, 1985 [27]
N = 286
Knowledge + self-management
scale (0–10)
NR 1.39 (2.00) vs. 0.10
(1.48) p<0.0001
NR NR 4/6 NA/16 Fair
Lorig, 1999 [28]
N = 331
ASES self-efficacy (0–10,
"= better)
NR 1.1 (2.2) vs.�0.04 (2.2),
p = 0.0001
NR NR 1.5/6 NR/17 Poor
Riemsma, 2003 [30]
N = 218
ASES (pain) 0.0 (0.7) vs. 0.1 (0.8),
p>0.1
0.3 (0.7) vs. 0.0 (0.8),
p>0.1
0.3 (0.7) vs. 0.1 (0.8),
p = 0.06
NR 1.25 + booster @ 3,
6, 9/8
26/17 Fair
ASES (function) 0.0 (0.5) vs. 0.0 (0.5),
p>0.1
0.0 (0.5) vs. 0.0 (0.6),
p>0.1
0.0 (0.7) vs. 0.0 (0.7),
p>0.1
NR
Taal, 1993 [32]
N = 75
ASES (pain) 0.43 vs. 0.11, p>0.05 0.40 vs. 0.24, p>0.05 NR 0.33 vs. 0.15, p>0.05 1.25/5 54/24 Poor
ASES (function) 0.17 vs. �0.13, p<0.05 0.07 vs. �0.02, p>0.05 NR 0.17 vs. �0.06, p<0.05
Quality of life/functional status
Ackerman, 2012 [17]
N = 120
AQoL (�0.04 to 1.0) �0.04 (�0.10 to 0.01) NR �0.02 (�0.09 to 0.05) NR 1.5/6 25/22 Fair
Barlow, 2000 [18]
N = 544
HADS (depression, 0–21
#= better)
NR �0.86 (99% CI �1.46 to
�0.26)
NR NR 1.5/6 NR/22 Fair
Breedland,
2011 [19]
N = 34
Dutch AIMS2 (physical) �0.68 (1.00) vs. �0.14
(0.49), p = 0.07
NR NR NR 2/24 NR/6 Good
Dutch AIMS2 (psychological) �0.34 (1.11) vs. 0.08
(1.37), p = 0.4
NR NR NR
Dutch AIMS2 (social) �0.48 (1.90) vs. �0.88
(2.03), p = 0.6
NR NR NR
Buszewicz,
2006 [20]
N = 812
SF-36 (physical) NR 0.22 (�1.50 to 1.94) 0.33 (�1.31 to 1.98) NR 1.5/6 30/24 Fair
Giraudet-Le Quintrec,
2007 [24]
N = 208
EMIR (physical) NR NR 0.06 (5.69) vs. 0.33
(5.06), p = 0.7211
NR 2 + booster @ 4/9 18/9 Fair
EMIR (symptomatic) NR NR �1.00 (3.34) vs. �0.02
(3.13), p = 0.0311
NR
EMIR (psychological) NR NR �0.87 (3.34) vs. �0.38
(3.60), p = 0.3174
NR
EMIR (social) NR NR �0.26 (2.24) vs. �0.21
(2.35), p = 0.8684
NR
EMIR (work) NR NR 0.14 (2.57) vs. �0.06
(2.62), p = 0.6453
NR
A.R
. Q
uin
on
es et
al.
/ P
atien
t E
du
catio
n a
nd
Co
un
seling
95
(20
14
) 3
–2
91
8

Hammond, 1999 [16]
N = 35
HAQ (function) Median (IQR), T vs. C:
1.44 (1.09 to 1.91) vs.
1.50 (0.78 to 1.81)
NR NR NR 1/4 NR/31 Fair
Lorig, 1985 [27]
N = 286
HAQ (disability 0–3) NR �0.06 (0.34) vs. �0.02
(0.24), p = 0.45
NR NR 4/6 NA/16 Fair
Lorig, 1999 [28]
N = 331
HAQ (disability 0–3 #= better) NR �0.10 (0.49) vs. 0.0
(0.41), p = 0.03
NR NR 1.5/6 NR/17 Poor
Patel, 2009 [21]
N = 812
QALYs �0.006 (�0.01 to
�0.00)
NR �0.01 (�0.03 to 0.01) NR 1.5/6 30/24 Fair
Riemsma, 2003 [30]
N = 218
Dutch AIMS2
(function)
�0.2 (0.7) vs.�0.1 (0.8),
p>0.1
0.0 (0.8) vs. �0.1 (0.9),
p>0.1
�0.1 (0.8) vs. 0.0 (1.1),
p>0.1
NR 1.25 + booster @ 3,
6, 9/8
26/17 Fair
Taal, 1993 [32] N = 75 Dutch AIMS
(physical activities 0–10)
0.08 vs. �0.56, p>0.05 �0.64 vs. �0.56,
p>0.05
NR �0.16 vs. �0.48,
p>0.05
1.25/5 54/24 Poor
Biophysical and performance measures
Breedland, 2011 [19]
N = 34
VO2 max (mL/kg/min) 3.82 (3.86) vs. �0.44
(2.21), p = 0.002
NR NR NR 2/24 NR/6 Good
Utilization
Ackerman, 2012 [17]
N = 120
MD visits 1 (0–10) vs. 1 (0–4),
p = 0.73
NR 1 (0–6) vs. 1 (0–10),
p = 0.40
NR 1.5/6 25/22 Fair
Barlow, 2000 [18]
N = 544
MD visits NR 0.20 (99% CI �0.30 to
0.70)
NR NR 1.5/6 NR/22 Fair
Lorig, 1985 [27]
N = 286
MD visits NR �0.46 (1.98) vs. �0.26
(3.07), p = 0.61
NR NR 4/6 NA/16 Fair
Lorig, 1999 [28]
N = 331
MD visits NR �0.06 (2.9) vs. �0.24
(1.7), p = 0.16
NR NR 1.5/6 NR/17 Poor
Patel, 2009 [21] Outpatient visits NR 0.17 (0.6) vs. 0.21 (0.6) 0.28 (0.7) vs. 0.26 (0.9) NR 1.5/6 30/24 Fair
History of fallsSelf-efficacy
Arnold, 2010 [33]
N = 83
ABC (falls efficacy) 5.8 (12.4) vs. 2.4 (10.7) NR NR NR 2.75/22 55/23 Fair
Clemson, 2004 [34]
N = 310
Mobility Efficacy Scale (MES) NR NR NR 4.28 (�8.40 to �0.54) 1.75 + booster @ 3/8 NA/15 Good
Quality of life/functional status
Arnold, 2010 [33]
N = 83
AIMS2 (BBSm) 1.0 (3.5) vs. 0.2 (2.3) NR NR NR 2.75/22 55/23 Fair
Clemson, 2004 [34]
N = 310
SF-36 (physical) NR NR NR 0.70 (�2.94 to 1.88) 1.75 + booster @ 3/8 NA/15 Good
Biophysical and performance measures
Arnold, 2010 [33]
N = 83
TUG (dual task) �2.3 (5.1) vs. 0.2 (4.3) NR NR NR 2.75/22 55/23 Fair
Clemson, 2004 [34]
N = 310
Fall events NR NR NR 0.69 (0.50 to 0.96) 1.75 + booster @ 3/8 NA/15 Good
Ryan, 1996 [35]
N = 45
Fall events Unclear NR NR NR 1 day/1 NR/NR Poor
Shumway-Cook, 2007
[36]
N = 454
Fall events (incidence rates per
person-year)
NR NR 1.33 (0.14) vs. 1.77
(0.28), p = 0.15
NR 6/6 88/5 Fair
TUG NR NR �0.7 (�1.2 to �0.2) NR
AsthmaSelf-efficacy
Abdulwadud, 1999 [38]
N = 125
Asthma Attitudes and Beliefs
Questionnaire
NR Change in % of patients
who would take action
before asthma
deteriorated �6 vs. 9
NR NR 0.7/3 71/38 Poor
Quality of life/functional status
Abdulwadud, 1999 [38]
N = 125
AQLQ (maximum score 10) NR �0.26 (�1.3 to 0.77) NR NR 0.7/3 71/38 Poor
A.R
. Q
uin
on
es et
al.
/ P
atien
t E
du
catio
n a
nd
Co
un
seling
95
(20
14
) 3
–2
9
19

Table 3 (Continued )
Study
Sample size
Outcome (range
or units, as applicable)
Findings by time periodaUnless otherwise noted, results represent the difference in mean change from baseline (Treatment – Control,
95% CI), or the mean (SD) change from baseline comparing Treatment vs. Control.
GV duration
(months);
# sessions
% Participationb
/% Loss to
follow-upc
Study
quality
0–3 mo 4–6 mo 7–12 mo 13+ mo
Wilson, 1993 [37]
N = 130
Asthma bother scale NR NR % of patients who were
less bothered after 1 yr
55 vs. 25 (p = 0.028)
NR 3–4/4 56/14 Fair
Utilization
Wilson, 1993 [37]
N = 130
Acute visits NR NR Mean (SE) change in
annualized rate 0.93
(0.42) vs. 0.93 (0.35)
(p = ns)
Mean (SE) change in
annualized rate 2.04
(0.33) vs. 1.01 (0.33)
(p<0.05)
1/4 56/14 Fair
Bolton, 1991 [40]
N = 241
ER visits NR Mean (SD) per 100
persons 68 (110) vs.
220 (530), p = 0.003
Mean (SD) per 100
persons 69 (130) vs. 98
(210), p = 0.42
NR NR/3 45/7 Fair
COPDQuality of life/functional status
Wilson, 2008 [42]
N = 91
Smoking cessation NR NR Complete or
intermittent (% of
patients) 10 vs. 6,
p = 0.7
NR 1.2/5 60/NR Fair
Ninot, 2011 [45]
N = 45
SGRQ NR NR median �7.6 (p<0.01)
vs. �4.7 (p = 0.33)
NR 1/8 NA/16 Good
Biophysical and performance measures
Ninot, 2011 [45]
N = 45
6MWD NR NR 30 (p<0.01) vs. 12.5
(p = 0.52)
NR 1/8 NA/16 Good
Utilization
Ninot, 2011 [45]
N = 45
Days in hospital for COPD
admission
NR NR 0.0 (p = 0.64) vs. 0.0
(p = 0.50)
NR 1/8 NA/16 Good
CHF/CADSelf-efficacy
Smeulders, 2010
[49,50] N = 317
GSES (16–80) Adjusted mixed effects,
mean difference (95%
CI) �1.32 (�3.05 to
0.42)
Adjusted mixed effects,
mean difference (95%
CI) �0.22 (�2.10 to
1.66)
Adjusted mixed effects,
mean difference (95%
CI) �1.59 (�3.59 to
0.40)
NR 1.5/6 44/16 Good
Cardiac self-efficacy: KCCQ (0–
36)
Adjusted mixed effects,
mean difference (95%
CI) 0.01 (�1.42 to 1.45)
Adjusted mixed effects,
mean difference (95%
CI) 1.13 (�0.48 to 2.73)
Adjusted mixed effects,
mean difference (95%
CI) �0.93 (�2.50 to
0.63)
NR
Cognitive Symptom
Management (0–25)
Adjusted mixed effects,
mean difference (95%
CI) �2.28 (�3.23 to
�1.32)
Adjusted mixed effects,
mean difference (95%
CI) �0.84 (�1.86 to
0.18)
Adjusted mixed effects,
mean difference (95%
CI) �0.73 (�1.89 to
0.43)
NR
Moore, 2006 [47]
N = 250
Index of Self-Regulation (range
not reported)
37.3 (5.3) v 37.5 (5.6) NR NR 36.8 (5.7) vs. 36.9 (5.5) 3/5 50/19 Fair
Quality of life/functional status
A.R
. Q
uin
on
es et
al.
/ P
atien
t E
du
catio
n a
nd
Co
un
seling
95
(20
14
) 3
–2
92
0
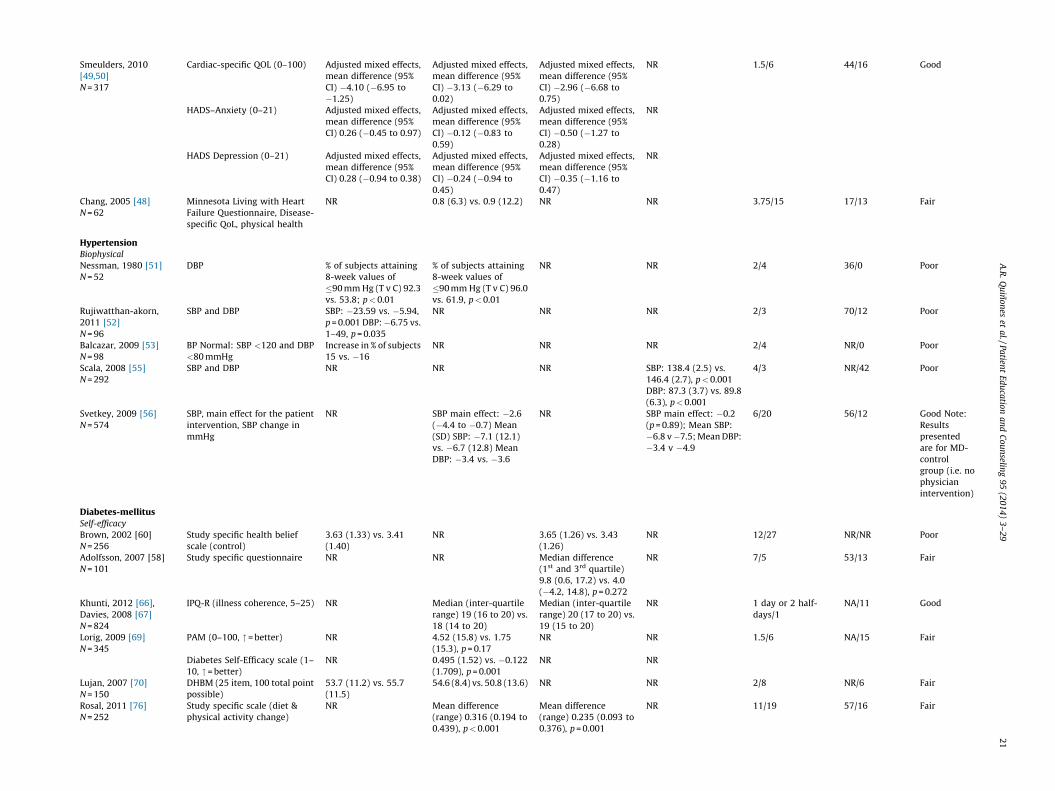
Smeulders, 2010
[49,50]
N = 317
Cardiac-specific QOL (0–100) Adjusted mixed effects,
mean difference (95%
CI) �4.10 (�6.95 to
�1.25)
Adjusted mixed effects,
mean difference (95%
CI) �3.13 (�6.29 to
0.02)
Adjusted mixed effects,
mean difference (95%
CI) �2.96 (�6.68 to
0.75)
NR 1.5/6 44/16 Good
HADS–Anxiety (0–21) Adjusted mixed effects,
mean difference (95%
CI) 0.26 (�0.45 to 0.97)
Adjusted mixed effects,
mean difference (95%
CI) �0.12 (�0.83 to
0.59)
Adjusted mixed effects,
mean difference (95%
CI) �0.50 (�1.27 to
0.28)
NR
HADS Depression (0–21) Adjusted mixed effects,
mean difference (95%
CI) 0.28 (�0.94 to 0.38)
Adjusted mixed effects,
mean difference (95%
CI) �0.24 (�0.94 to
0.45)
Adjusted mixed effects,
mean difference (95%
CI) �0.35 (�1.16 to
0.47)
NR
Chang, 2005 [48]
N = 62
Minnesota Living with Heart
Failure Questionnaire, Disease-
specific QoL, physical health
NR 0.8 (6.3) vs. 0.9 (12.2) NR NR 3.75/15 17/13 Fair
HypertensionBiophysical
Nessman, 1980 [51]
N = 52
DBP % of subjects attaining
8-week values of
�90 mm Hg (T v C) 92.3
vs. 53.8; p<0.01
% of subjects attaining
8-week values of
�90 mm Hg (T v C) 96.0
vs. 61.9, p<0.01
NR NR 2/4 36/0 Poor
Rujiwatthan-akorn,
2011 [52]
N = 96
SBP and DBP SBP: �23.59 vs. �5.94,
p = 0.001 DBP:�6.75 vs.
1–49, p = 0.035
NR NR NR 2/3 70/12 Poor
Balcazar, 2009 [53]
N = 98
BP Normal: SBP <120 and DBP
<80 mmHg
Increase in % of subjects
15 vs. �16
NR NR NR 2/4 NR/0 Poor
Scala, 2008 [55]
N = 292
SBP and DBP NR NR NR SBP: 138.4 (2.5) vs.
146.4 (2.7), p<0.001
DBP: 87.3 (3.7) vs. 89.8
(6.3), p<0.001
4/3 NR/42 Poor
Svetkey, 2009 [56]
N = 574
SBP, main effect for the patient
intervention, SBP change in
mmHg
NR SBP main effect: �2.6
(�4.4 to �0.7) Mean
(SD) SBP: �7.1 (12.1)
vs. �6.7 (12.8) Mean
DBP: �3.4 vs. �3.6
NR SBP main effect: �0.2
(p = 0.89); Mean SBP:
�6.8 v�7.5; Mean DBP:
�3.4 v �4.9
6/20 56/12 Good Note:
Results
presented
are for MD-
control
group (i.e. no
physician
intervention)
Diabetes-mellitusSelf-efficacy
Brown, 2002 [60]
N = 256
Study specific health belief
scale (control)
3.63 (1.33) vs. 3.41
(1.40)
NR 3.65 (1.26) vs. 3.43
(1.26)
NR 12/27 NR/NR Poor
Adolfsson, 2007 [58]
N = 101
Study specific questionnaire NR NR Median difference
(1st and 3rd quartile)
9.8 (0.6, 17.2) vs. 4.0
(�4.2, 14.8), p = 0.272
NR 7/5 53/13 Fair
Khunti, 2012 [66],
Davies, 2008 [67]
N = 824
IPQ-R (illness coherence, 5–25) NR Median (inter-quartile
range) 19 (16 to 20) vs.
18 (14 to 20)
Median (inter-quartile
range) 20 (17 to 20) vs.
19 (15 to 20)
NR 1 day or 2 half-
days/1
NA/11 Good
Lorig, 2009 [69]
N = 345
PAM (0–100, "= better) NR 4.52 (15.8) vs. 1.75
(15.3), p = 0.17
NR NR 1.5/6 NA/15 Fair
Diabetes Self-Efficacy scale (1–
10, "= better)
NR 0.495 (1.52) vs. �0.122
(1.709), p = 0.001
NR NR
Lujan, 2007 [70]
N = 150
DHBM (25 item, 100 total point
possible)
53.7 (11.2) vs. 55.7
(11.5)
54.6 (8.4) vs. 50.8 (13.6) NR NR 2/8 NR/6 Fair
Rosal, 2011 [76]
N = 252
Study specific scale (diet &
physical activity change)
NR Mean difference
(range) 0.316 (0.194 to
0.439), p<0.001
Mean difference
(range) 0.235 (0.093 to
0.376), p = 0.001
NR 11/19 57/16 Fair
A.R
. Q
uin
on
es et
al.
/ P
atien
t E
du
catio
n a
nd
Co
un
seling
95
(20
14
) 3
–2
9
21

Table 3 (Continued )
Study
Sample size
Outcome (range
or units, as applicable)
Findings by time periodaUnless otherwise noted, results represent the difference in mean change from baseline (Treatment – Control,
95% CI), or the mean (SD) change from baseline comparing Treatment vs. Control.
GV duration
(months);
# sessions
% Participationb
/% Loss to
follow-upc
Study
quality
0–3 mo 4–6 mo 7–12 mo 13+ mo
Rygg, 2012 [77]
N = 146
PAM NR 1.8 (�2.4 to 6.1) 0.6 (�3.4 to 4.6) NR 1.25/3 91/9 Fair
Schillinger, 2009 [80]
N = 339
Diabetes Quality Improvement
Program, self-efficacy measure
(0–100)
NR NR 5.5 (1.4 to 9.6) NR 9/9 73/10 Fair
Steed, 2005 [83]
N = 127
MDS (total) 72.78 (15.74) vs. 69.81
(16.24), p = ns
NR NR NR 1.25 + booster @ 3/6 51/16 Poor
Toobert, 2011 [85]
N = 280
Confidence in Overcoming
Challenges to Self Care
NR 3.5 (0.7) vs. 3.3 (0.8) 3.4 (0.7) vs. 3.3 (3.8) NR 12/37 61/22 Fair
Quality of life/functional status
Adolfsson, 2007 [58]
N = 101
Adapted WHO QOL NR NR Median difference (1st
and 3rd quartile) 2.5
(�3.9, 7.5) vs. 0.0 (�6.0,
7.5), p = 0.588
NR 7/5 53/13 Fair
Khunti, 2012 [66],
Davies, 2008 [67]
N = 824
HADS (0–21) NR Median (inter-quartile
range) 2 (1–4) vs. 2 (1–
5)
Median (inter-quartile
range) 2 (1–5) vs. 2 (1–
6)
NR 1 day or 2 half-
days/1
NA/11 Good
Lorig, 2009 [69]
N = 345
PHQ-9 (depression 0–27,
#= better)
NR �1.51 (4.33) vs. 0.541
(4.49), p<0.001
NR NR 1.5/6 NA/15 Fair
Rygg, 2012 [77]
N = 146
SF-36 (physical) NR 0.3 (�1.9 to 2.5) 0.6 (�1.6 to 2.8) NR 1.25/3 91/9 Fair
SF-36 (mental) NR �1.7 (�4.0 to 0.7) �2.1 (�4.5 to 0.4) NR
EQ-VAS NR 1.0 (�2.7 to 5.9) 2.4 (�2.5 to 7.2) NR
Schillinger, 2009 [80]
N = 339
SF-12 (physical) NR NR �0.1 (�6.9 to 6.7) NR 9/9 73/10 Fair
SF-12 (mental) NR NR �2.9 (�8.6 to 2.9) NR
Steed, 2005 [83]
N = 127
ADDQOL Authors report
significant differences
between groups at
follow up F(1,
97) = 9.33, p<0.01
NR NR NR 1.25+ booster @ 3/6 51/16 Poor
SF-36 No significant
differences between
groups, numeric values
not reported
NR NR NR
Toobert, 2011 [85]
N = 280
CDC Healthy Days (physical, #
of days not good)
NR 7.3 (9.8) vs. 7.5 (9.7) 6.1 (8.4) vs. 8.1 (9.2) NR 12/37 61/22 Fair
CDC Healthy Days (mental, # of
days not good)
NR 6.7 (9.5) vs. 7.4 (10.0) 7.3 (8.7) vs. 7.3 (9.5) NR
Biophysical and performance measures
Dejesus, 2009 [64]
N = 54
SBP NR 0.35 (15.04) vs. �5.17
(11.23), p = 0.41
NR NR 1 day/1 13/55 Poor
DBP NR 0.53 (8.94) vs. �1.5
(10.25), p = 0.46
Utilization
Dejesus, 2009 [64]
N = 54
RN and MD visits NR No significant
differences between
groups, numeric values
not reported
NR NR 1 day/1 13/55 Poor
A.R
. Q
uin
on
es et
al.
/ P
atien
t E
du
catio
n a
nd
Co
un
seling
95
(20
14
) 3
–2
92
2

Lorig, 2009 [69]
N = 345
MD visits NR 0.219 (3.88) vs. �0.106
(3.37), p = 0.462
NR NR 1.5/6 NA/15 Fair
ED visits NR �0.012 (0.742) vs.
0.113 (0.885), p = 0.273
NR NR
Days hospitalized NR 0.00 (4.31) vs. �0.143
(1.75), p = 0.152
NR NR
Rygg, 2012 [77]
N = 146
Clinician visits NR Difference n (%) �9
(�12%), p = 0.106
Difference n (%) 5 (7%),
p = 0.354
NR 1.25/3 91/9 Fair
2
Multiple chronic conditionsSelf-efficacy
Lorig 1999 [93]
N = 952
Cognitive symptom
management (0–5, "= better)
NR 0.38 (0.77) vs. 0.07
(0.73), p = 0.0001
NR NR 1.75/7 NR/17 Fair
Lorig, 2003 [92]
N = 551
4-item self-efficacy scale (1–10,
"= better)
NR 1.157 (3.08) vs. 0.719
(3.09), p = 0.0006
NR NR 1.5/6 NR/51 Fair
Fu, 2003 [91]
N = 954
4-item self-efficacy scale.
Managing disease (1–10
increase = improvement)
NR 0.22 (2.52) vs. �0.41
(2.87) p = 0.001
NR NR 1.75/7 NA/13 Fair
Cognitive symptom
management scale (0–5
increase = improvement)
NR 0.37 (0.95) vs. 0.04
(0.76), p = 0.005
NR NR
Elzen, 2007 [90]
N = 136
GSES-16 (Dutch; 5-point Likert
scale)
No significant
differences between
groups, numeric values
not reported t = 1.37,
p = 0.09
No significant
differences between
groups, numeric values
not reported t = 1.55,
p = 0.06
NR NR 1.5/6 26/10 Poor
Cognitive symptom scale
(Dutch; 6-point Likert scale)
No significant
differences between
groups, numeric values
not reported t =�1.42,
p = 0.08
No significant
differences between
groups, numeric values
not reported t =�1.09,
p = 0.14
NR NR
Quality of life
Lorig, 1999 [93]
N = 952
Self-rated health, (1–5,
#= better)
NR �0.09 (0.72) vs. 0.02
(0.69), p = 0.02
NR NR 1.75/7 NR/17 Fair
Disability (HAQ), (0–3,
#= better)
NR �0.02 (0.32) vs. 0.03
(0.36), p = 0.002
NR NR
Elzen, 2007 [90]
N = 136
RAND-36 Physical components
(0–100)
No significant
differences between
groups, numeric values
not reported t =�0.55,
p = 0.29
No significant
differences between
groups, numeric values
not reported t =�0.137,
p = 0.45
NR NR 1.5/6 26/10 Poor
RAND-36 Mental components
(0–100)
No significant
differences between
groups, numeric values
not reported t = 0.39,
p = 0.35
No significant
differences between
groups, numeric values
not reported t =�0.11,
p = 0.46
NR NR
Utilization
Lorig, 1999 [93]
N = 952
Physician and ER visits in past 6
months
NR �0.77 (5.6) vs. �0.54
(6.3), p = 0.11
NR NR 1.75/7 NR/17 Fair
Hospital stays in past 6 months NR �0.07 (0.69) vs. �0.05
(1.1), p = 0.047
NR NR
Lorig, 2003 [92]
N = 551
Physician visits in past 4
months
NR �0.475 (2.78) vs.
�0.034 (2.44), p = 0.057
NR NR 1.5/6 NR/51 Fair
ER visits in past 4 months NR �0.083 (0.622) vs.
0.101 (0.722), p = 0.005
NR NR
Hospital days in past 4 months NR �0.011 (0.836) vs.
�0.079 (3.54), p = 0.481
NR NR
A.R
. Q
uin
on
es et
al.
/ P
atien
t E
du
catio
n a
nd
Co
un
seling
95
(20
14
) 3
–2
9
23

Table 3 (Continued )
Study
Sample size
Outcome (range
or units, as applicable)
Findings by time periodaUnless otherwise noted, results represent the difference in mean change from baseline (Treatment – Control,
95% CI), or the mean (SD) change from baseline comparing Treatment vs. Control.
GV duration
(months);
# sessions
% Participationb
/% Loss to
follow-upc
Study
quality
0–3 mo 4–6 mo 7–12 mo 13+ mo
Fu, 2003 [91]
N = 954
Physician visits in past 6
months
NR �1.01 (9.41) vs. �0.84
(7.76), p = 0.72
NR NR 1.75/7 NA/13 Fair
ER visits in past 6 months NR �0.04 (0.96) vs. �0.03
(0.72), p = 0.44
NR NR
Hospital stays in past 6 months NR �0.06 (0.46) vs. 0.06
(0.92), p = 0.04
NR NR
Chronic painSelf-efficacy
Ersek, 2003 [96]
N = 45
Survey of Pain Attitudes,
control (range 0 to 4)
2.3 (0.6) vs. 2.3 (0.8),
p = ns
NR NR NR 2/7 NA/13 Fair
Vlaeyen, 1996 [95]
GV1 vs. UC N = 131
Pain coping 12.2 (2.7) vs.�1.0 (2.7),
p = 0.001
NR NR NR 1.5/12 NR/20 Fair
Pain control 1.6 (1.4) vs. 0.4 (1.4),
p = 0.003
NR NR NR
Quality of life
Ersek, 2003 [96]
N = 45
SF-36 (role physical) 28.4 (34.8) vs. 28.4
(35.6), p = ns
NR NR NR 2/7 NA/13 Fair
SF-36 (physical functioning) 38.4 (19.0) vs. 43.0
(23.7), p = ns
NR NR NR
Graded chronic pain scale–
activity interference
3.2 (2.9) vs. 3.6 (3.0),
p = ns
NR NR NR
Haugli, 2000 & Haugli,
2003 [94,98]
N = 174
VAS (pain) 45.9 (23.4) vs. 52.7
(21.5)
NR 44.0 (22.9) vs. 54.8
(24.3)
NR 9/12 NA/33 Poor
a Unless otherwise noted, results represent the difference in mean change from baseline (Treatment–Control, 95% CI), or the mean (SD) change from baseline comparing Treatment vs. Control.b Defined as percent eligible for enrollment among those invited to participate.c Defined as percent lost to follow up among those randomized.
A.R
. Q
uin
on
es et
al.
/ P
atien
t E
du
catio
n a
nd
Co
un
seling
95
(20
14
) 3
–2
92
4

Table 4Findings from studies comparing head-to-head interventions.
Study
(sample size)
Arm 1 Arm 2 % Participationa
/% Loss
to follow-upb
Study quality
(Good/Fair/
Poor)
Comment
Arthritis
Hewlett,
2011 [25]
GV1 (7 SME sessions) GV2 (1 DE session) 15/24 Good Beneficial effect of cognitive behavior therapy relative
to didactic-only single session GV assessed at 4.5
months
Ettinger, 1997
[22, p. 2258]
GV1 (3 DE sessions) GV2 aerobic exercise
(36 classes)
53/17 Fair Beneficial effect of either exercise group vs. education
group on pain, disability, and functional performance.
Dose response for patients who completed more
sessions of either exercise program.
GV1 (3 DE sessions) GV3 resistance exercise
(36 classes)
Freeman,
2002 [23]
GV1 (4 SME sessions) GV2 (4 DE sessions) 94/23 Fair Cognitive-behavioral education program did not
significantly improve pain or self-efficacy for patients
newly diagnosed with RA.
Hammond,
2008 [99]
GV1 (9 SME, EE
sessions)
GV2 (5 DE, EE sessions) 46/37 Fair GV1 was effective in improving short-term pain,
functional disability, self-efficacy, and reducing
physician visits compared to GV2. Longer-term benefits
for GV1 for pain, and maintained functional ability
compared to declines in GV2.
Kaplan, 1981 [26] GV1 (13 DE, group
counseling sessions)
GV2 (1 DE session) NR/35 Poor Combination of education and short-term group
counseling led to improved knowledge and self-esteem.
Lorig, 2004 [29] GV (6 SME sessions) Mailed individual
program
84/32 Good Both programs show moderate improvements in self-
efficacy, pain, and disability outcomes. Earlier
advantages of mailed program narrowed after 3 yrs. GV
program had decreased physician visits compared with
mailed program.
Riemsma,
2003 [30]
GV1 (8 SME, EE
sessions)
Patients only
GV2 (8 SME, EE
sessions)
Patients and significant
others
26/17 Fair Participation of significant others led to decreases in
self-efficacy for coping with other symptoms compared
to improvements in patients participating without their
partners.
History of falls
Arnold, 2010 [33] GV1 (22 DE, EE, aquatic
exercise classes)
GV2 (22 EE, aquatic
exercise classes)
55/23 Fair Combination of aquatic exercise and education resulted
in improvements in functional performance vs. aquatic
exercise alone.
Ryan, 1996 [35] GV (1 DE) Individual (1 DE) NR/NR Poor Small study. Control group experienced the most falls in
the post period.
Asthma
Wilson,
1993 [37]
GV (3 SME sessions) IV (3–5 weekly SME
sessions)
56/14 Fair No significant differences between GV and IV. GV and IV
were equally effective compared with UC. Reduced
bother and improved MDI technique observed with
both small group and individual education.
COPD
Bestall
2003 [43]
GV (16 DE + 26 EE
sessions: exercise)
GV (16 DE sessions) NR/16 Fair Compared with DE alone, pts in exercise group had
improved exercise capacity (shuttle walking distance)
that lasted 6 months. For QoL (CRQ, SGRQ) there were
mixed results at 6 months, and no differences between
groups at 1 year.
Effing
2011 [44]
GV (4 DE + up to 120 EE
sessions)
GV (4 DE sessions) 41/11 Fair COPE-active group experienced an improvement in
maximal exercise capacity compared to the steady
decline in the control group.
Kunik,
2008 [46]
GV (8 DE sessions) GV (8 SME sessions:
CBT)
19/55 Good CBT and COPD education groups were comparable and
significantly improved QoL, anxiety, depression, and
6MWD, with no significant differences between groups,
and improvement was maintained till the end of the
study (52 weeks).
Hypertension
Figar,
2006 [54]
N = 60
GV (4 SME sessions) GV (4 DE sessions) NR/17 Good More SME patients had controlled BP (defined as the
proportion of patients with mean 24-h BP <140/90 mm
Hg) compared with DE: 70% vs. 44%, p = 0.04. No
significant reductions in SBP or DBP in either group.
Diabetes mellitus
Deakin,
2006 [63]
GV (6 SME) Individual (3 DE) 20/32 Fair Significant improvements with group compared with
individual visits in glycemic control, total cholesterol
level, body weight, BMI and waist circumference,
reduced requirement for diabetes medication,
increased consumption of fruit and vegetables,
enjoyment of food, knowledge of diabetes, self-
empowerment, self-management skills and treatment
satisfaction.
De Greef,
2011 [62]
GV (3 SME) Individual (3 SME) 78/5 Good No improvement in biophysical health outcomes for
patients in the GV arm compared to individual visit
arm. Individual visit participants showed significant
improvements in waist circumference, FBG, HbA1c, and
total cholesterol compared to control arm.
A.R. Quinones et al. / Patient Education and Counseling 95 (2014) 3–29 25

Table 4 (Continued )
Study
(sample size)
Arm 1 Arm 2 % Participationa
/% Loss
to follow-upb
Study quality
(Good/Fair/
Poor)
Comment
Kulzer,
2007 [68]
GV1 (4 DE) GV2 (12 SME) GV3 (6
Group + 6 individual
SME)
50/6 Fair GV2 (SME) had significantly lower HbA1c at 15 months
compared with both GV1 (DE) and GV3
(group + individual SME). GV2 (SME) also had
significant improvements in BMI, anxiety, and exercise
relative to GV1 (DE).
Melkus,
2010 [71]
GV1 (11 culturally
relevant SME)
GV2 (10 culturally
neutral DE)
NA/11 Fair Both arms had significant, similar reductions in HbA1c
at 24 months. The culturally relevant SME group had
significantly lower levels of diabetes-related emotional
distress at 24 months compared with the culturally
neutral DE group.
Miller,
2002 [72]
GV1 (10 DE, EE) GV2 (6 DE, or mailed
materials)
NA/6 Fair Intense nutrition education GV improved glycemic
control
Rickheim,
2002 [75]
GV (4 DE) Individual (4 DE) NR/46 Poor Individual and group education resulted in similar
improvements at 6 months in HbA1c, weight, BMI,
health-related QOL, attitudes, and medication regimen.
Schillinger,
2009 [80]
GV (9 SME) ATSM: automated
telephone self-
management (39 SME
calls)
73/10 Fair No statistical differences between GV and ATSM arms in
self-efficacy, or quality of life (physical). Improvement
for ATSM relative to GV in quality of life (mental).
Sperl-Hillen,
2011 [82]
GV (4 DE) Individual (3 DE); Usual
care
82/2 Fair HbA1c deceased significantly more with individual DE
compared with group DE and usual care. Individual DE
significantly reduced distress (PAID) and increased self-
efficacy compared with group DE.
Surwit,
2002 [84]
GV1 (5 DE) GV2 (5 DE + EE) NA/24 Poor At 1-year follow-up, patients who received training in
stress management in addition to DE had a 0.5%
reduction in HbA1c relative to DE alone. No differences
between groups in anxiety (STAI) or psychological
distress (GHQ; PSS) measures.
Weinger,
2011 [87]
GV (5 SME) Individual DE
(unlimited access to
DM nurse and dietitian
visits)
89/3 Fair GV (SME) had significantly greater reduction in HbA1c
levels over 1 year compared with individual DE. No
differences in QOL, and self-efficacy measures.
Zapotoczky,
2001 [88]
GV1 (4 wk + 12 mo DE) GV2 (4 wk DE) 100/0 Poor All subjects received 4-wk group education. GV2
received usual care with no further group education.
Significant reductions in HbA1c and body weight over 1
year in GV1 (12-month continuation DE) compared
with GV2.
Chronic pain
Ersek,
2003 [96]
N = 45
GV (7 SME sessions) Educational booklet on
pain
NA/13 Fair There was a significant improvement in physical role
functioning and in pain intensity directly following
treatment, but not 3 months after treatment, though no
significant effect was noted for other primary outcome
variables including physical functioning, activity
interference, and depression.
Vlaeyen,
1996 [95]
N = 131*
specify
GV (12 SME, EE, DE
sessions)
GV (12 DE, EE sessions) NR/20 Fair Significant improvement of knowledge, pain coping,
pain control, and relaxation for both GV groups
compared to control at immediate follow-up; non-
significant differences between GV groups at 6 and 12-
month follow-up on all primary outcomes.
Gustavsson,
2010 [97]
N = 156
GV (8 session, SME, EE) Individual physical
therapy
84/20 Good GV was positively associated with most assessed
outcomes including pain coping, pain control,
catastrophizing, pain scores, and anxiety, though
effects on depression were non-significant.
Note: Only total scores are shown in the table. The Comments include additional summary statements that are based on subscale findings, but not numerically represented
because there were only subscale scores reported.a Defined as percent eligible for enrollment among those invited to participate.b Defined as percent lost to follow-up among those randomized.
A.R. Quinones et al. / Patient Education and Counseling 95 (2014) 3–2926
Acknowledgement
Contributors: A. Quinones planned the study, abstracted thedata, interpreted the findings, and drafted the manuscript. J.Richardson, M. Freeman, M. O’Neil, and D. Kansagara assisted withthe planning of the study, abstracting the data, and writing andreviewing the manuscript. R. Fu conducted the meta-analyses, andreviewed the manuscript. M. Motu’apuaka assisted with abstract-ing data, and revising the manuscript. All authors declare noconflicts of interest involved in the research presented in themanuscript. The corresponding author (AQ) declares she had fullaccess to all the data in the study and takes responsibility for the
integrity of the data and the accuracy of the data analysis. Wethank Rose Relevo for library assistance.
Funders: The research reported here was supported by theDepartment of Veterans Affairs, Veterans Health Administration,Health Services Research and Development Service Evidence-based Synthesis Program (ESP) project #05-225. Dr. Quinones is aHealth Science Specialist at the Portland VA Medical Center. Dr.Quinones is also supported by American Diabetes AssociationGrant 7-13-CD-08. The views expressed in this article are those ofthe authors and do not necessarily represent the views of theDepartment of Veterans Affairs nor the American DiabetesAssociation.

A.R. Quinones et al. / Patient Education and Counseling 95 (2014) 3–29 27
Prior presentations: The full-length report prepared for VAnominating stakeholders is available on the VA website: http://vaww.hsrd.research.va.gov/publications/esp/group-visits.cfm. Aposter presentation to the Northwest regional meeting of theSociety for General Internal Medicine was made in February, 2013in Portland, Oregon. A Cyber Seminar presentation for VA HealthServices Research & Development Service on April 1, 2013 isarchived online: http://www.hsrd.research.va.gov/for_research-ers/cyber_seminars/archives/video_archive.cfm?SessionID=676#.UYlNRLWG0qQ.
Appendix A. Supplementary data
Supplementary data associated with this article can be found, inthe online version, at http://dx.doi.org/10.1016/j.pec.2013.12.021.
References
[1] Nutting PA, Miller WL, Crabtree BF, Jaen CR, Stewart EE, Stange KC. Initiallessons from the first national demonstration project on practice transfor-mation to a patient-centered medical home. Ann Fam Med 2009;7:254–60.
[2] Rittenhouse DR, Shortell SM. The patient-centered medical home: will itstand the test of health reform? J Amer Med Assoc 2009;301:2038–40.
[3] Abrams M, Nuzum R, Mika S, Lawlor G. Realizing health reform’s potential—how the affordable care act will stregthen primary care and benefit patients,providers, and payers. Commonw Fund 2011;1466:1–27.
[4] Han A, Judd M, Welch V, Wu T, Tugwell P, Wells GA. Tai chi for treatingrheumatoid arthritis. CDS Rev 2010;CD004849.
[5] Ashworth NL, Chad KE, Harrison EL, Reeder BA, Marshall SC. Home versuscenter based physical activity programs in older adults. CDS Rev2009;CD004017.
[6] Gillespie LD, Robertson MC, Gillespie WJ, Sherrington C, Gates S, Clemson LM,et al. Interventions for preventing falls in older people living in the commu-nity. CDS Rev 2012;9:CD007146.
[7] Anonymous. Effect of intensive blood-glucose control with metformin oncomplications in overweight patients with type 2 diabetes (UKPDS 34). UKProspective Diabetes Study (UKPDS) Group. Lancet 1998;352:854–65.
[8] Lorig K, Stewart A, Ritter P, Gonzalez V, Laurent D, Lynch J. Outcome measuresfor health education and other health care interventions. Thousand Oaks, CA:Sage Publications; 1996. p. 24–5, 41–5.
[9] Hibbard JH, Stockard J, Mahoney ER, Tusler M. Development of the patientactivation measure (PAM): conceptualizing and measuring activation inpatients and consumers. Health Serv Res 2004;39(August (4 Part I)):1005–26.
[10] Greene J, Hibbard JH. Why does patient activation matter? An examination ofthe relationships between patient activation and health-related outcomes. JGen Intern Med 2012;27:520–6.
[11] Harris RP, Helfand M, Woolf SH, Lohr KN, Mulrow CD, Teutsch SM, et al.Current methods of the US preventive services task force: a review of theprocess. Am J Prev Med 2001;30(3 Suppl.):21–35.
[12] Guyatt G, Oxman AD, Akl EA, Kunz R, Vist G, Brozek J, et al. GRADE guidelines:1. Introduction-GRADE evidence profiles and summary of findings tables. JClin Epidemiol 2011;64:383–94.
[13] DerSimonian R, Laird N. Meta-analysis in clinical trials. Control Clin Trials1986;7:177–88.
[14] Higgins JPT, Altman DG. Chapter 8: assessing risk of bias in included studies.In: Higgins JPT, Green S, editors. Cochrane handbook for systematic reviewsof interventions 2008; Version 5.0.1. Chichester, West Sussex, England: TheCochrane Collaboration and John Wiley & Sons Ltd; 2008 . Available from:www.cochrane-handbook.org.
[15] Egger M, Davey Smith G, Schneider M, Minder C. Bias in meta-analysisdetected by a simple, graphical test. Brit Med J 1997;315:629–34.
[16] Hammond A, Lincoln N, Sutcliffe L. A crossover trial evaluating an education-al-behavioural joint protection programme for people with rheumatoidarthritis. Patient Educ Couns 1999;37:19–32.
[17] Ackerman IN, Buchbinder R, Osborne RH. Challenges in evaluating an arthritisself-management program for people with hip and knee osteoarthritis inreal-world clinical settings. J Rheumatol 2012;39:1–9.
[18] Barlow JH, Turner AP, Wright CC. A randomized controlled study of thearthritis self-management programme in the UK. Health Educ Res2000;15:665–80.
[19] Breedland I, van Scheppingen C, Leijsma M, Verheij-Jansen NP, van Weert E.Effects of a group-based exercise and educational program on physicalperformance and disease self-management in rheumatoid arthritis: a ran-domized controlled study. Phys Ther 2011;91:879–93.
[20] Buszewicz M, Rait G, Griffin M, Nazareth I, Patel A, Atkinson A, et al. Selfmanagement of arthritis in primary care: randomised controlled trial. BritMed J 2006;333:879 [Clinical research ed.].
[21] Patel A, Buszewicz M, Beecham J, Griffin M, Rait G, Nazareth I, et al. Economicevaluation of arthritis self management in primary care. Brit Med J2009;339:b3532.
[22] Ettinger Jr WH, Burns R, Messier SP, Applegate W, Rejeski WJ, Morgan T, et al.A randomized trial comparing aerobic exercise and resistance exercise with ahealth education program in older adults with knee osteoarthritis. TheFitness Arthritis and Seniors Trial (FAST). J Amer Med Assoc 1997;277:25–31.
[23] Freeman K, Hammond A, Lincoln NB. Use of cognitive-behavioural arthritiseducation programmes in newly diagnosed rheumatoid arthritis. Clin Rehabil2002;16:828–36.
[24] Giraudet-Le Quintrec J, Mayoux-Benhamou A, Ravaud P, Champion K, DernisE, Zerkak D, et al. Effect of a collective educational program for patients withrheumatoid arthritis: a prospective 12-month randomized controlled trial. JRheumatol 2007;34:1684–91.
[25] Hewlett S, Ambler N, Almeida C, Cliss A, Hammond A, Kitchen K, et al. Self-management of fatigue in rheumatoid arthritis: a randomised controlled trialof group cognitive-behavioural therapy. Ann Rheum Dis 2011;70:1060–7.
[26] Kaplan S, Kozin F. A controlled study of group counseling in rheumatoidarthritis. J Rheumatol 1981;8:91–9.
[27] Lorig K, Lubeck D, Kraines RG, Seleznick M, Holman HR. Outcomes of self-helpeducation for patients with arthritis. Arthritis Rheum 1985;28:680–5.
[28] Lorig K, Gonzalez VM, Ritter P. Community-based Spanish language arthritiseducation program: a randomized trial. Med Care 1999;37:957–63.
[29] Lorig KR, Ritter PL, Laurent DD, Fries JF. Long-term randomized controlledtrials of tailored-print and small-group arthritis self-management interven-tions. Med Care 2004;42:346–54.
[30] Riemsma RP, Taal E, Rasker JJ. Group education for patients with rheumatoidarthritis and their partners. Arthritis Rheum 2003;49:556–66.
[31] Sevick MA, Miller GD, Loeser RF, Williamson JD, Messier SP. Cost-effective-ness of exercise and diet in overweight and obese adults with knee osteoar-thritis. Med Sci Sports Exerc 2009;41:1167–74.
[32] Taal E, Riemsma RP, Brus HL, Seydel ER, Rasker JJ, Wiegman O. Groupeducation for patients with rheumatoid arthritis. Patient Educ Couns1993;20:177–87.
[33] Arnold CM, Faulkner RA. The effect of aquatic exercise and education onlowering fall risk in older adults with hip osteoarthritis. J Aging Phys Act2010;18:245–60.
[34] Clemson L, Cumming RG, Kendig H, Swann M, Heard R, Taylor K. Theeffectiveness of a community-based program for reducing the incidence offalls in the elderly: a randomized trial. J Am Geriatr Soc 2004;52:1487–94.
[35] Ryan JW, Spellbring AM. Implementing strategies to decrease risk of falls inolder women. J Gerontol Nurs 1996;22:25–31.
[36] Shumway-Cook A, Silver HF, LeMier M, York S, Cummings P, Koepsell TD.Effectiveness of a community-based multifactorial intervention on falls andfall risk factors in community-living older adults: a randomized, controlledtrial. J Gerontol A Biol Sci Med Sci 2007;62:1420–7.
[37] Wilson SR, Scamagas P, German DF, Hughes GW, Lulla S, Coss S, et al. Acontrolled trial of two forms of self-management education for adults withasthma. Am J Med 1993;94:564–76.
[38] Abdulwadud O, Abramson M, Forbes A, James A, Walters EH. Evaluation of arandomised controlled trial of adult asthma education in a hospital setting.Thorax 1999;54:493–500.
[39] Allen RM, Jones MP, Oldenburg B. Randomised trial of an asthma self-management programme for adults. Thorax 1995;50:731–8.
[40] Bolton MB, Tilley BC, Kuder J, Reeves T, Schultz LR. The cost and effectivenessof an education program for adults who have asthma. J Gen Intern Med1991;6:401–7.
[41] Snyder SE, Winder JA, Creer TJ. Development and evaluation of an adultasthma self-management program: Wheezers Anonymous. J Asthma1987;24:153–8.
[42] Wilson JS, Fitzsimons D, Bradbury I, Stuart Elborn J. Does additional supportby nurses enhance the effect of a brief smoking cessation intervention inpeople with moderate to severe chronic obstructive pulmonary disease? Arandomised controlled trial. Int J Nurs Stud 2008;45:508–17.
[43] Bestall JC, Paul EA, Garrod R, Garnham R, Jones RW, Wedzicha AJ. Longitudinaltrends in exercise capacity and health status after pulmonary rehabilitationin patients with COPD. Respir Med 2003;97:173–80.
[44] Effing T, Zielhuis G, Kerstjens H, van der Valk P, van der Palen J. Communitybased physiotherapeutic exercise in COPD self-management: a randomisedcontrolled trial. Respir Med 2011;105:418–26.
[45] Ninot G, Moullec G, Picot MC, Jaussent A, Hayot M, Desplan M, et al. Cost-saving effect of supervised exercise associated to COPD self-managementeducation program. Respir Med 2011;105:377–85.
[46] Kunik ME, Veazey C, Cully JA, Souchek J, Graham DP, Hopko D, et al. COPDeducation and cognitive behavioral therapy group treatment for clinicallysignificant symptoms of depression and anxiety in COPD patients: a random-ized controlled trial. Psychol Med 2008;38:385–96.
[47] Moore SM, Charvat JM, Gordon NH, Pashkow F, Ribisl P, Roberts BL, et al.Effects of a change intervention to increase exercise maintenance followingcardiac events. Ann Behav Med 2006;31:53–62.
[48] Chang BH, Hendricks A, Zhao Y, Rothendler JA, LoCastro JS, Slawsky MT. Arelaxation response randomized trial on patients with chronic heart failure. JCardpulm Rehabil 2005;25:149–57.
[49] Smeulders ES, van Haastregt JC, Ambergen T, Uszko-Lencer NH, Janssen-Boyne JJ, Gorgels AP, et al. Nurse-led self-management group programme for

A.R. Quinones et al. / Patient Education and Counseling 95 (2014) 3–2928
patients with congestive heart failure: randomized controlled trial. J AdvNurs 2010;66:1487–99.
[50] Smeulders ES, van Haastregt JC, Ambergen T, Stoffers HE, Janssen-Boyne JJ,Uszko-Lencer NH, et al. Heart failure patients with a lower educational leveland better cognitive status benefit most from a self-management groupprogramme. Patient Educ Couns 2010;81:214–21.
[51] Nessman DG, Carnahan JE, Nugent CA. Increasing compliance.Patient-operated hypertension groups. Arch Intern Med 1980;140:1427–30.
[52] Rujiwatthanakorn D, Panpakdee O, Malathum P, Tanomsup S. Effectiveness ofa self-management program for Thais with essential hypertension. PacificRim Int J Nurs Res 2011;15:97–109.
[53] Balcazar HG, Byrd TL, Ortiz M, Tondapu SR, Chavez M. A randomizedcommunity intervention to improve hypertension control among MexicanAmericans: using the promotoras de salud community outreach model. JHealth Care Poor Underserved 2009;20:1079–94.
[54] Figar S, Galarza C, Petrlik E, Hornstein L, Rodriguez Loria G, Waisman G, et al.Effect of education on blood pressure control in elderly persons: a random-ized controlled trial. Am J Hypertens 2006;19:737–43.
[55] Scala D, D’Avino M, Cozzolino S, Mancini A, Andria B, Caruso G, et al.Promotion of behavioural change in people with hypertension: an interven-tion study. Pharm World Sci 2008;30:834–9.
[56] Svetkey LP, Pollak KI, Yancy Jr WS, Dolor RJ, Batch BC, Samsa G, et al.Hypertension improvement project: randomized trial of quality improve-ment for physicians and lifestyle modification for patients. Hypertension2009;54:1226–33.
[57] Baghianimoghadam MH, Rahaee Z, Morowatisharifabad MA, Sharifirad G,Andishmand A, Azadbakht L. Effects of education on self-monitoring of bloodpressure based on BASNEF model in hypertensive patients. J Res Med Sci2010;15:70–7.
[58] Adolfsson ET, Walker-Engstrom ML, Smide B, Wikblad K. Patient education intype 2 diabetes: a randomized controlled 1-year follow-up study. DiabetesRes Clin Pract 2007;76:341–50.
[59] Anderson RM, Funnell MM, Nwankwo R, Gillard ML, Oh M, Fitzgerald JT.Evaluating a problem-based empowerment program for African Americanswith diabetes: results of a randomized controlled trial. Ethn Dis 2005;15:671–8.
[60] Brown SA, Garcia AA, Kouzekanani K, Hanis CL. Culturally competent diabetesself-management education for Mexican Americans: the Starr County borderhealth initiative. Diabetes Care 2002;25:259–68.
[61] Brown SA, Blozis SA, Kouzekanani K, Garcia AA, Winchell M, Hanis CL.Dosage effects of diabetes self-management education for Mexican Amer-icans: the Starr County Border Health Initiative. Diabetes Care 2005;28:527–32.
[62] De Greef K, Deforche B, Tudor-Locke C, De Bourdeaudhuij I. Increasingphysical activity in Belgian type 2 diabetes patients: a three-arm randomizedcontrolled trial. Int J Behav Med 2011;18:188–98.
[63] Deakin TA, Cade JE, Williams R, Greenwood DC. Structured patient education:the diabetes X-PERT Programme makes a difference. Diabet Med2006;23:944–54.
[64] Dejesus RS, Chaudhry R, Leutink DJ, Hinton MA, Cha SS, Stroebel RJ. Effects ofefforts to intensify management on blood pressure control among patientswith type 2 diabetes mellitus and hypertension: a pilot study. Vasc HealthRisk Manag 2009;5:705–11.
[65] Hornsten A, Stenlund H, Lundman B, Sandstrom H. Improvements in HbA1cremain after 5 years – a follow up of an educational intervention focusing onpatients’ personal understandings of type 2 diabetes. Diabetes Res Clin Pract2008;81:50–5.
[66] Khunti K, Gray LJ, Skinner T, Carey ME, Realf KHD, et al. Effectiveness of adiabetes education and self management programme (DESMOND) for peoplewith newly diagnosed type 2 diabetes mellitus: three year follow-up of acluster randomised controlled trial in primary care. Brit Med J2012;344:e2333.
[67] Davies MJ, Heller S, Skinner TC, Campbell MJ, Carey ME, Cradock S, et al.Effectiveness of the diabetes education and self management for ongoing andnewly diagnosed (DESMOND) programme for people with newly diagnosedtype 2 diabetes: cluster randomised controlled trial. Brit Med J2008;336:491–5.
[68] Kulzer B, Hermanns N, Reinecker H, Haak T. Effects of self-managementtraining in Type 2 diabetes: a randomized, prospective trial. Diabet Med2007;24:415–23.
[69] Lorig K, Ritter PL, Villa FJ, Armas J. Community-based peer-led diabetesself-management: a randomized trial. Diabetes Educ 2009;35:641–51.
[70] Lujan J, Ostwald SK, Ortiz M. Promotora diabetes intervention for MexicanAmericans. Diabetes Educ 2007;33:660–70.
[71] D’Eramo Melkus G, Chyun D, Vorderstrasse A, Newlin K, Jefferson V,Langerman S. The effect of a diabetes education, coping skills training,and care intervention on physiological and psychosocial outcomes in blackwomen with type 2 diabetes. Biol Res Nurs 2010;12:7–19.
[72] Miller CK, Edwards L, Kissling G, Sanville L. Nutrition education improvesmetabolic outcomes among older adults with diabetes mellitus: results froma randomized controlled trial. Prev Med 2002;34:252–9.
[73] Philis-Tsimikas A, Fortmann A, Lleva-Ocana L, Walker C, Gallo LC. Peer-leddiabetes education programs in high-risk Mexican Americans improve gly-cemic control compared with standard approaches: a Project Dulce promo-tora randomized trial. Diabetes Care 2011;34:1926–31.
[74] Raji A, Gomes H, Beard JO, MacDonald P, Conlin PR. A randomized trialcomparing intensive and passive education in patients with diabetes melli-tus. Arch Intern Med 2002;162:1301–4.
[75] Rickheim PL, Weaver TW, Flader JL, Kendall DM. Assessment of group versusindividual diabetes education: a randomized study. Diabetes Care2002;25:269–74.
[76] Rosal MC, Ockene IS, Restrepo A, White MJ, Borg A, Olendzki B, et al.Randomized trial of a literacy-sensitive, culturally tailored diabetes self-management intervention for low-income latinos: latinos en control. Diabe-tes Care 2011;34:838–44.
[77] Rygg LO, Rise MB, Gronning K, Steinsbekk A. Efficacy of ongoing group baseddiabetes self-management education for patients with type 2 diabetes mel-litus. A randomised controlled trial. Patient Educ Couns 2012;86:98–105.
[78] Sarkadi A, Rosenqvist U. Experience-based group education in Type 2 diabe-tes: a randomised controlled trial. Patient Educ Couns 2004;53:291–8.
[79] Scain SF, Friedman R, Gross JL. A structured educational program improvesmetabolic control in patients with type 2 diabetes: a randomized controlledtrial. Diabetes Educ 2009;35:603–11.
[80] Schillinger D, Handley M, Wang F, Hammer H. Effects of self-managementsupport on structure, process, and outcomes among vulnerable patients withdiabetes: a three-arm practical clinical trial. Diabetes Care 2009;32:559–66.
[81] Sharifirad G, Najimi A, Hassanzadeh A, Azadbakht L. Does nutrition educationimprove the risk factors of cardiovascular diseases among elderly with type 2diabetes? A randomized controlled trial based on an educational model. JDiabetes 2013;5:157–62.
[82] Sperl-Hillen J, Beaton S, Fernandes O, Von Worley A, Vazquez-Benitez G,Parker E, et al. Comparative effectiveness of patient education methods fortype 2 diabetes: a randomized controlled trial. Arch Intern Med2011;171:2001–10.
[83] Steed L, Lankester J, Barnard M, Earle K, Hurel S, Newman S. Evaluation of theUCL diabetes self-management programme (UCL-DSMP): a randomized con-trolled trial. J Health Psychol 2005;10:261–76.
[84] Surwit RS, van Tilburg MA, Zucker N, McCaskill CC, Parekh P, Feinglos MN,et al. Stress management improves long-term glycemic control in type 2diabetes. Diabetes Care 2002;25:30–4.
[85] Toobert DJ, Strycker LA, Barrera Jr M, Osuna D, King DK, Glasgow RE. Out-comes from a multiple risk factor diabetes self-management trial for Latinas:
!
Viva Bien! Ann Behav Med 2011;41:310–23.[86] Toobert DJ, Strycker LA, King DK, Barrera Jr M, Osuna D, Glasgow RE. Long-
term outcomes from a multiple-risk-factor diabetes trial for Latinas:
!
VivaBien! Transl Behav Med 2011;1:416–26.
[87] Weinger K, Beverly EA, Lee Y, Sitnokov L, Ganda OP, Caballero AE. The effect ofa structured behavioral intervention on poorly controlled diabetes: a ran-domized controlled trial. Arch Intern Med 2011;171:1990–9.
[88] Zapotoczky H, Semlitsch B, Herzog G, Bahadori B, Siebenhofer A, Pieber TR,et al. A controlled study of weight reduction in type 2 diabetics treated by tworeinforcers. Int J Behav Med 2001;8:42–9.
[89] Stanford School of Medicine. Chronic Disease Self-Management Program;2012, http://patienteducation.stanford.edu/programs/cdsmp.html [accessed20.09.12].
[90] Elzen H, Slaets JP, Snijders TA, Steverink N. Evaluation of the chronic diseaseself-management program (CDSMP) among chronically ill older people in theNetherlands. Soc Sci Med 2007;64:1832–41.
[91] Fu D, Fu H, McGowan P, Shen YE, Zhu L, Yang H, et al. Implementation andquantitative evaluation of chronic disease self-management programme inShanghai, China: randomized controlled trial. Bull World Health Organ2003;81:174–82.
[92] Lorig KR, Ritter PL, Gonzalez VM. Hispanic chronic disease self-management:a randomized community-based outcome trial. Nurs Res 2003;52:361–9.
[93] Lorig KR, Sobel DS, Stewart AL, Brown Jr BW, Bandura AP, Ritter PP, et al.Evidence suggesting that a chronic disease self-management program canimprove health status while reducing hospitalization: a randomized trial.Med Care 1999;37:5–14.
[94] Haugli L, Steen E, Laerum E, Nygard R, Finset A. Psychological distress andemployment status. Effects of a group learning programme for patients withchronic musculoskeletal pain. Psychol Health Med 2003;8:135–48.
[95] Vlaeyen JW, Teeken-Gruben NJ, Goossens ME, Rutten-van Molken MP,Pelt RA, van Eek H, et al. Cognitive-educational treatment of fibromyalgia:a randomized clinical trial. I. Clinical effects. J Rheumatol 1996;23:1237–45.
[96] Ersek M, Turner JA, McCurry SM, Gibbons L, Kraybill BM. Efficacy of a self-management group intervention for elderly persons with chronic pain. Clin JPain 2003;19:156–67.
[97] Gustavsson C, Denison E, von Koch L. Self-management of persistent neckpain: a randomized controlled trial of a multi-component group interventionin primary health care. Eur J Pain 2010;14:e1–1.
[98] Haugli L, Steen E, Laerum E, Finset A, Nygaard R. Agency orientation andchronic musculoskeletal pain: effects of a group learning program based onthe personal construct theory. Clin J Pain 2000;16:281–9.
[99] Hammond A, Bryan J, Hardy A. Effects of a modular behavioural arthritiseducation programme: a pragmatic parallel-group randomized controlledtrial. Rheumatology 2008;47:1712–8.
[100] Griffin SJ, Borch-Johnsen K, Davies MJ, Khunti K, Rutten GE, Sandbaek A, et al.Effect of early intensive multifactorial therapy on 5-year cardiovascularoutcomes in individuals with type 2 diabetes detected by screening (ADDI-TION-Europe): a cluster-randomised trial. Lancet 2011;378:156–67.

A.R. Quinones et al. / Patient Education and Counseling 95 (2014) 3–29 29
[101] Kritikos V, Armour CL, Bosnic-Anticevich SZ. Interactive small-group asthmaeducation in the community pharmacy setting: a pilot study. J Asthma2007;44:57–64.
[102] Donesky-Cuenco D, Nguyen HQ, Paul S, Carrieri-Kohlman V. Yoga therapydecreases dyspnea-related distress and improves functional performance inpeople with chronic obstructive pulmonary disease: a pilot study. J AlternComplement Med 2009;15:225–34.
[103] Smeulders ES, van Haastregt JC, Ambergen T, Janssen-Boyne JJ, van Eijk JT,Kempen GI. The impact of a self-management group programme on healthbehaviour and healthcare utilization among congestive heart failure patients.Eur J Heart Fail 2009;11:609–16.
[104] Andryukhin A, Frolova E, Vaes B, Degryse J. The impact of a nurse-led careprogramme on events and physical and psychosocial parameters in patients
with heart failure with preserved ejection fraction: a randomized clinicaltrial in primary care in Russia. Eur J Gen Pract 2010;16:205–14.
[105] Burke V, Mansour J, Beilin LJ, Mori TA. Long-term follow-up of participants ina health promotion program for treated hypertensives (ADAPT). Nutr MetabCardiovasc Dis 2008;18:198–206.
[106] Pierce JP, Watson DS, Knights S, Gliddon T, Williams S, Watson R. A controlledtrial of health education in the physician’s office. Prev Med 1984;13:185–94.
[107] Arnold CM. Fall risk in older adults with hip osteoarthritis: decreasing riskthrough education and aquatic exercise. Canada: University of Saskatche-wan; 2008.