educational data mining: discovery with models
DESCRIPTION
Educational Data Mining: Discovery with Models. Ryan S.J.d. Baker PSLC/HCII Carnegie Mellon University Ken Koedinger CMU Director of PSLC Professor of Human-Computer Interaction & Psychology Carnegie Mellon University. In this segment…. - PowerPoint PPT PresentationTRANSCRIPT
Educational Data Mining:Discovery with Models
Ryan S.J.d. BakerPSLC/HCII
Carnegie Mellon University
Ken Koedinger CMU Director of PSLC
Professor of Human-Computer Interaction & Psychology
Carnegie Mellon University
In this segment…
We will discuss Discovery with Models in (some) detail

Last time…
We gave a very simple example of Discovery with Models using Bayesian Knowledge Tracing

Uses of Knowledge Tracing
Can be interpreted to learn about skills
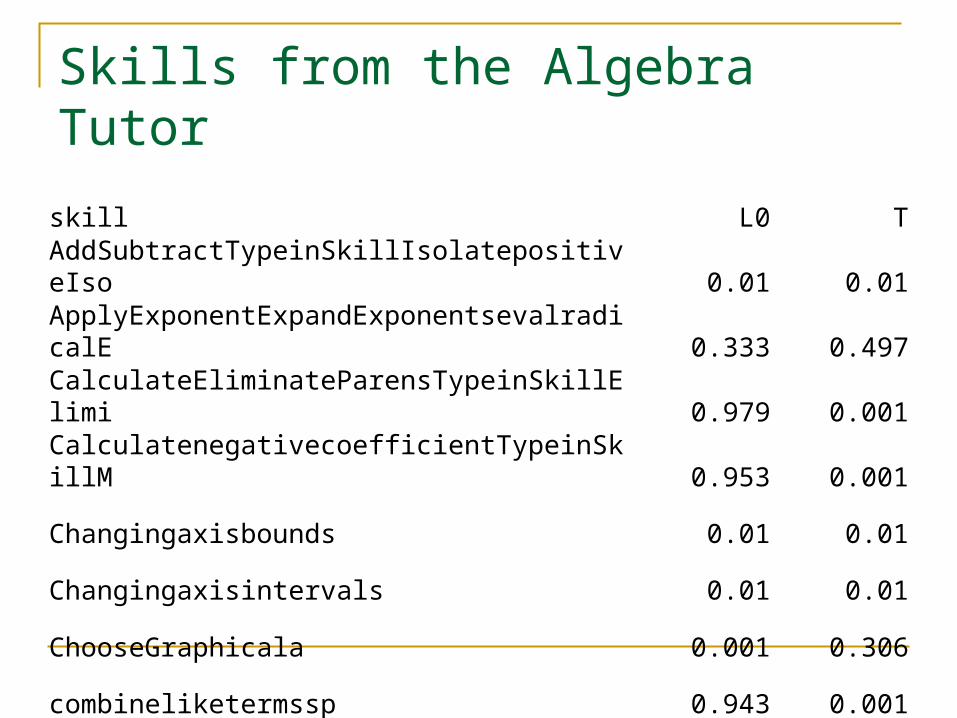
Skills from the Algebra Tutor
skill L0 T
AddSubtractTypeinSkillIsolatepositiveIso 0.01 0.01
ApplyExponentExpandExponentsevalradicalE 0.333 0.497
CalculateEliminateParensTypeinSkillElimi 0.979 0.001
CalculatenegativecoefficientTypeinSkillM 0.953 0.001
Changingaxisbounds 0.01 0.01
Changingaxisintervals 0.01 0.01
ChooseGraphicala 0.001 0.306
combineliketermssp 0.943 0.001

Which skills could probably be removed from the tutor?
skill L0 T
AddSubtractTypeinSkillIsolatepositiveIso 0.01 0.01
ApplyExponentExpandExponentsevalradicalE 0.333 0.497
CalculateEliminateParensTypeinSkillElimi 0.979 0.001
CalculatenegativecoefficientTypeinSkillM 0.953 0.001
Changingaxisbounds 0.01 0.01
Changingaxisintervals 0.01 0.01
ChooseGraphicala 0.001 0.306
combineliketermssp 0.943 0.001

Which skills could use better instruction?
skill L0 T
AddSubtractTypeinSkillIsolatepositiveIso 0.01 0.01
ApplyExponentExpandExponentsevalradicalE 0.333 0.497
CalculateEliminateParensTypeinSkillElimi 0.979 0.001
CalculatenegativecoefficientTypeinSkillM 0.953 0.001
Changingaxisbounds 0.01 0.01
Changingaxisintervals 0.01 0.01
ChooseGraphicala 0.001 0.306
combineliketermssp 0.943 0.001
Why do Discovery with Models?
We have a model of some construct of interest or importance Knowledge Meta-Cognition Motivation Affect Collaborative Behavior
Helping Acts, Insults Etc.

Why do Discovery with Models? We can now use that model to
Find outliers of interest by finding out where the model makes extreme predictions
Inspect the model to learn what factors are involved in predicting the construct
Find out the construct’s relationship to other constructs of interest, by studying its correlations/associations/causal relationships with data/models on the other constructs
Study the construct across contexts or students, by applying the model within data from those contexts or students
And more…

Finding Outliers of Interest
Finding outliers of interest by finding out where the model makes extreme predictions As in the example from Bayesian Knowledge
Tracing As in Ken’s example yesterday of finding upward
spikes in learning curves

Model Inspection
By looking at the features in the Gaming Detector, Baker, Corbett, & Koedinger (2004, in press) were able to see that
Students who game the system and have poor learning game the system on steps they don’t know
Students who game the system and have good learning game the system on steps they already know

Model Inspection: A tip
The simpler the model, the easier this is to do
Decision Trees and Linear/Step Regression: Easy.

Model Inspection: A tip
The simpler the model, the easier this is to do
Decision Trees and Linear/Step Regression: Easy.
Neural Networks and Support Vector Machines: Fuhgeddaboudit!
Correlations to Other Constructs

Take Model of a Construct
And see whether it co-occurs with other constructs of interest

Example
Detector of gaming the system (in fashion associated with poorer learning) correlated with questionnaire items assessing various motivations and attitudes(Baker et al, 2008)
Example
Detector of gaming the system (in fashion associated with poorer learning) correlated with questionnaire items assessing various motivations and attitudes(Baker et al, 2008)
Surprise: Nothing correlated very well(correlations between gaming and some attitudes statistically significant, but very weak – r < 0.2)

Example
More on this in a minute…

Studying a Construct Across Contexts Often, but not always, involves:

Model Transfer

Model Transfer
Richard said that prediction assumes that the
Sample where the predictions are made
Is “the same as”
The sample where the prediction model was made
Not entirely true

Model Transfer
It’s more that prediction assumes the differences “aren’t important”
So how do we know that’s the case?

Model Transfer
You can use a classifier in contexts beyond where it was trained, with proper validation
This can be really nice you may only have to train on data from 100 students and 4
lessons and then you can use your classifier in cases where there is data
from 1000 students and 35 lessons
Especially nice if you have some unlabeled data set with nice properties Additional data such as questionnaire data
(cf. Baker, 2007; Baker, Walonoski, Heffernan, Roll, Corbett, & Koedinger, 2008)

Validate the Transfer
You should make sure your model is valid in the new context(cf. Roll et al, 2005; Baker et al, 2006)
Depending on the type of model, and what features go into it, your model may or may not be valid for data taken From a different system In a different context of use With a different population

Validate the Transfer
For example
Will an off-task detector trained in schools work in dorm rooms?

Validate the Transfer
For example
Will a gaming detector trained in a tutor where {gaming=systematic guessing, hint abuse}
Work in a tutor where{gaming=point cartels}

Validate the Transfer
However
Will a gaming detector trained in a tutor unit where {gaming=systematic guessing, hint abuse}
Work in a different tutor unit where {gaming=systematic guessing, hint abuse}?

Maybe…
Baker, Corbett, Koedinger, & Roll (2006) We tested whether A gaming detector trained in a tutor unit where
{gaming=systematic guessing, hint abuse}
Would work in a different tutor unit where {gaming=systematic guessing, hint abuse}

Scheme
Train on data from three lessons, test on a fourth lesson
For all possible combinations of 4 lessons (4 combinations)
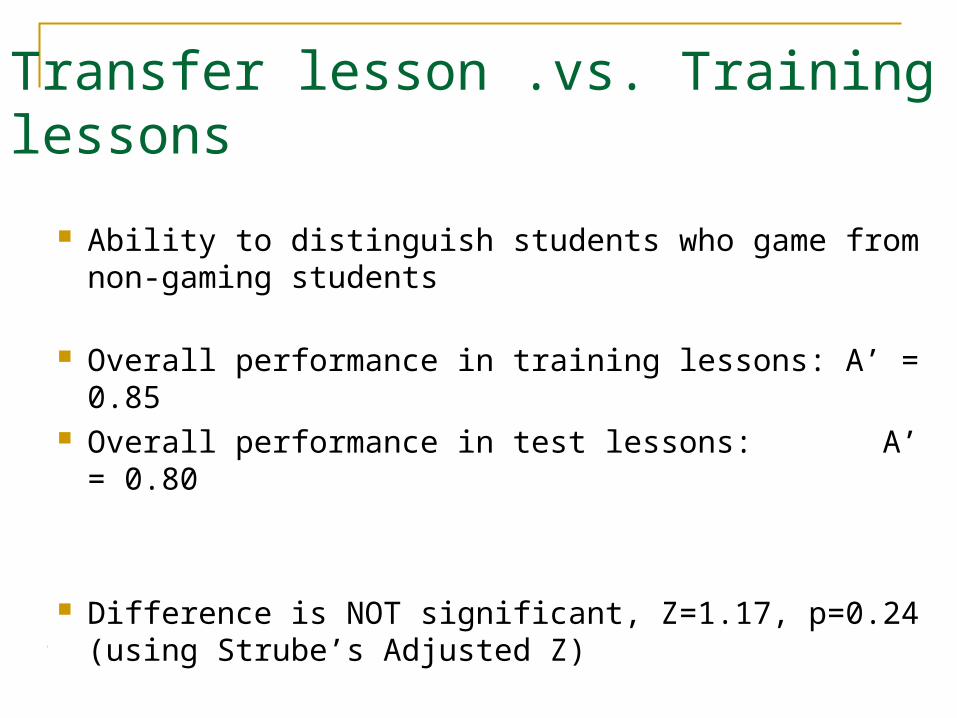
Transfer lesson .vs. Training lessons
Ability to distinguish students who game from non-gaming students
Overall performance in training lessons: A’ = 0.85 Overall performance in test lessons: A’ = 0.80
Difference is NOT significant, Z=1.17, p=0.24 (using Strube’s Adjusted Z)
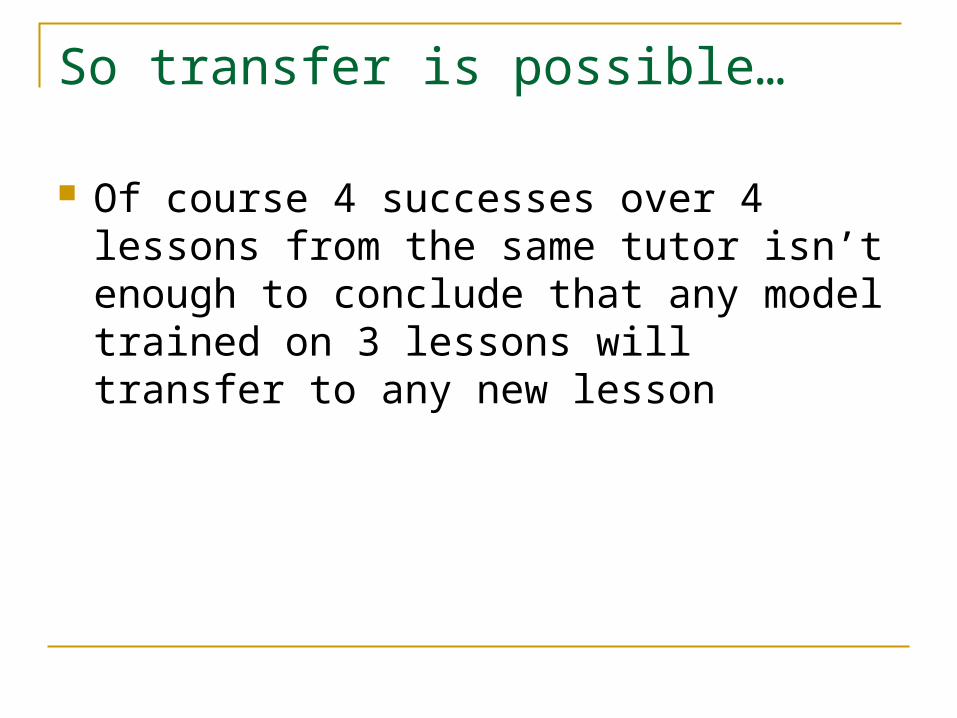
So transfer is possible…
Of course 4 successes over 4 lessons from the same tutor isn’t enough to conclude that any model trained on 3 lessons will transfer to any new lesson

What we can say is…

If…
If we posit that these four cases are “successful transfer”, and assume they were randomly sampled from lessons in the middle school tutor…

Maximum Likelihood Estimation
How likely is it that models transfer to four lessons?(result in Baker, Corbett, & Koedinger, 2006)
0%
20%
40%
60%
80%
100%
0% 10% 20% 30% 40% 50% 60% 70% 80% 90% 100%
Percent of lessons models would transfer to
Pro
bab
ility
of
dat
a

Studying a Construct Across Contexts Using this detector
(Baker, 2007)
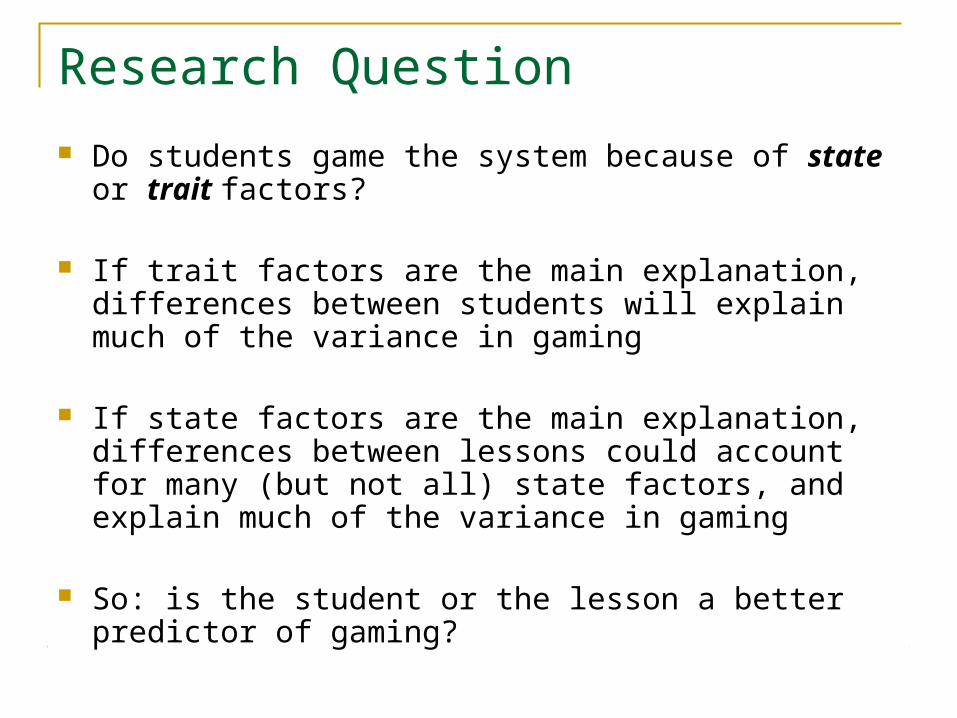
Research Question
Do students game the system because of state or trait factors?
If trait factors are the main explanation, differences between students will explain much of the variance in gaming
If state factors are the main explanation, differences between lessons could account for many (but not all) state factors, and explain much of the variance in gaming
So: is the student or the lesson a better predictor of gaming?

Application of Detector
After validating its transfer
We applied the gaming detector across 35 lessons, used by 240 students, from a single Cognitive Tutor
Giving us, for each student in each lesson, a gaming frequency
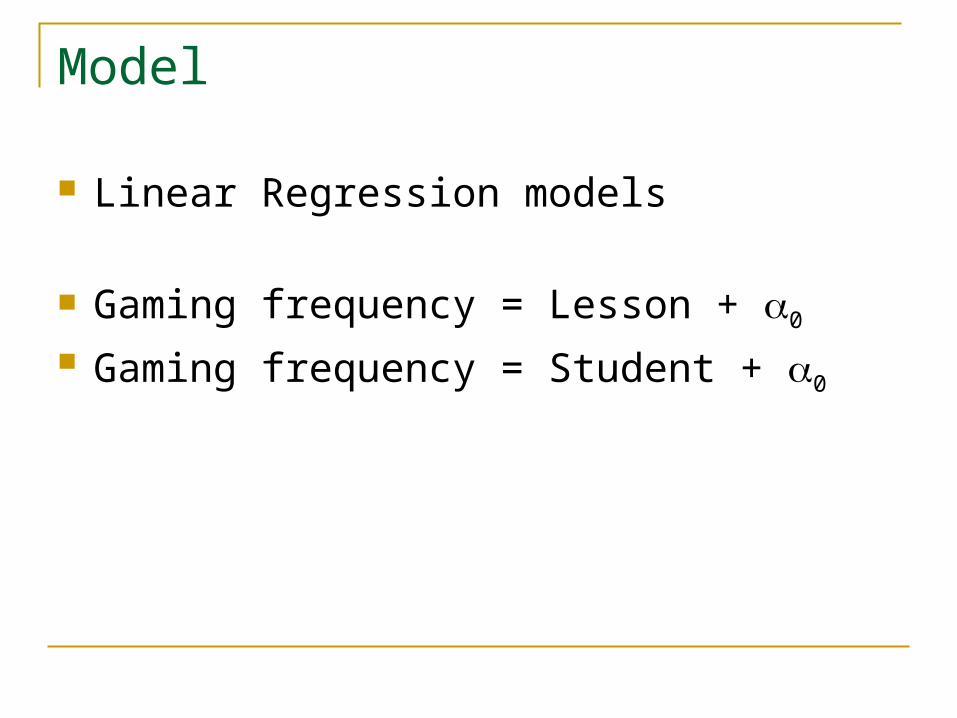
Model
Linear Regression models
Gaming frequency = Lesson + 0
Gaming frequency = Student + 0
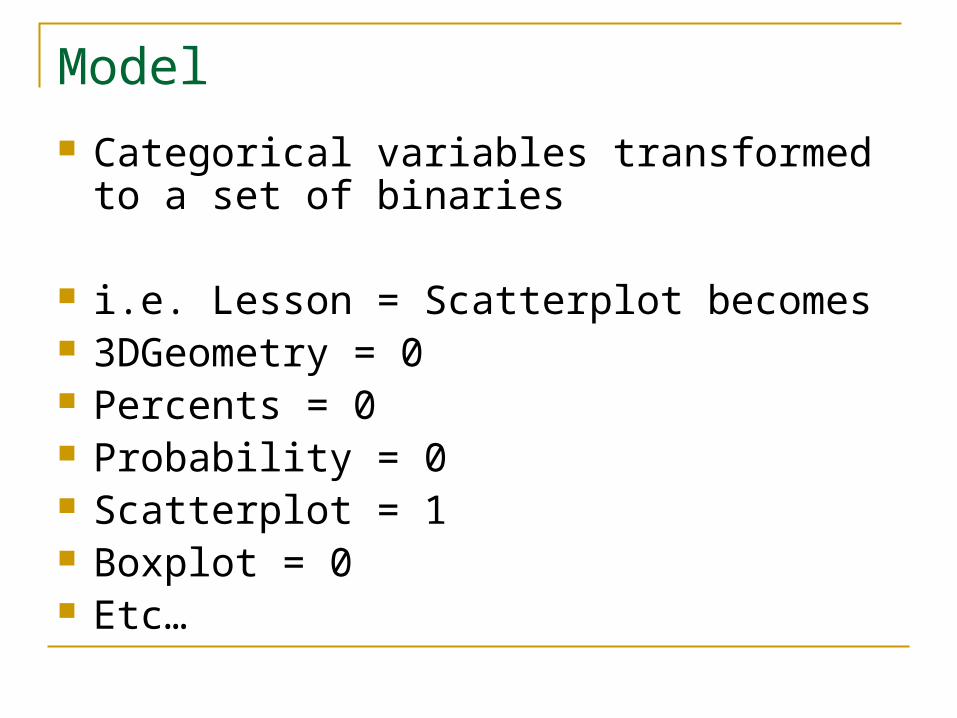
Model Categorical variables transformed to a set of
binaries
i.e. Lesson = Scatterplot becomes 3DGeometry = 0 Percents = 0 Probability = 0 Scatterplot = 1 Boxplot = 0 Etc…

Metrics

r2
The correlation, squared The proportion of variability in the data set
that is accounted for by a statistical model

r2
The correlation, squared The proportion of variability in the data set
that is accounted for by a statistical model
r2
However, a limitation
The more variables you have, the more variance you should be expected to predict, just by chance

r2
We should expect 240 students To predict gaming better than 35 lessons
Just by overfitting

So what can we do?

Our good friend BiC
Bayesian Information Criterion(Raftery, 1995)
Makes trade-off between goodness of fit and flexibility of fit (number of parameters)

Predictors

The Lesson
Gaming frequency = Lesson + 0
35 parameters
r2 = 0.55 BiC’ = -2370
Model is significantly better than chance would predict given model size & data set size
The Student
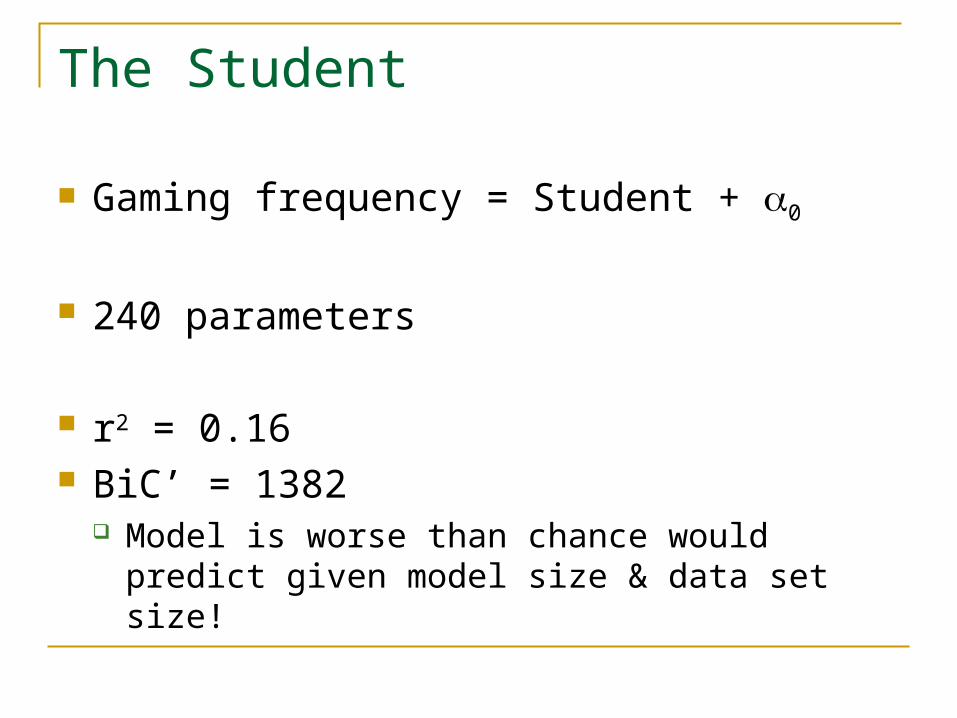
Gaming frequency = Student + 0
240 parameters
r2 = 0.16 BiC’ = 1382
Model is worse than chance would predict given model size & data set size!

Standard deviation bars, not standard error bars

In this talk…
Discovery with Models to Find outliers of interest by finding out where the
model makes extreme predictions Inspect the model to learn what factors are
involved in predicting the construct Find out the construct’s relationship to other
constructs of interest, by studying its correlations/associations/causal relationships with data/models on the other constructs
Study the construct across contexts or students, by applying the model within data from those contexts or students
Necessarily…
Only a few examples given in this talk

An area of increasing importance within EDM…
In the last 3 days we have discussed
(or at least mentioned)5 broad areas of EDM
Prediction Clustering Relationship Mining Discovery with Models Distillation of Data for Human Judgment

Now it’s your turn
To use these techniques to answer important questions about learners and learning
To improve these techniques, moving forward

To learn more
Baker, R.S.J.d. (under review) Data Mining in Education. Under review for inclusion in the International Encyclopedia of Education Available upon request
Baker, R.S.J.d., Barnes, T., Beck, J.E. (2008) Proceedings of the First International Conference on Educational Data Mining
Romero, C., Ventura, S. (2007) Educational Data Mining: A Survey from 1995 to 2005. Expert Systems with Applications, 33 (1), 135-146.

END
values a b c d e f g h i j k
0.1 0.31703 0.184794 0.292674 0.968429 0.599052 0.258772 0.288868 0.479694 0.845986 0.312878 0.325583
0.2 0.587882 0.818468 0.66771 0.286849 0.571331 0.878487 0.368984 0.156295 0.529126 0.009659 0.827527
0.3 0.069229 0.614344 0.016678 0.625279 0.07258 0.60644 0.376906 0.546482 0.780456 0.85199 0.99095
0.4 0.134072 0.761594 0.45686 0.075598 0.902216 0.349661 0.41452 0.377848 0.271817 0.808268 0.152187
0.5 0.773527 0.568502 0.212827 0.296644 0.606759 0.763751 0.337572 0.658086 0.527355 0.248425 0.306963
0.6 0.382031 0.954357 0.46915 0.793141 0.422994 0.00778 0.132219 0.218946 0.26634 0.204495 0.428783
0.7 0.499437 0.317859 0.56981 0.97822 0.926654 0.549637 0.241934 0.293575 0.910287 0.498185 0.803212
0.8 0.452056 0.133885 0.554752 0.771215 0.77231 0.867048 0.398835 0.310958 0.779538 0.75974 0.127566
0.9 0.013696 0.055595 0.887505 0.253549 0.529121 0.301857 0.846878 0.989624 0.480956 0.442541 0.614105
1 0.504806 0.462066 0.596407 0.986423 0.535024 0.475623 0.450906 0.07588 0.036826 0.995523 0.827306
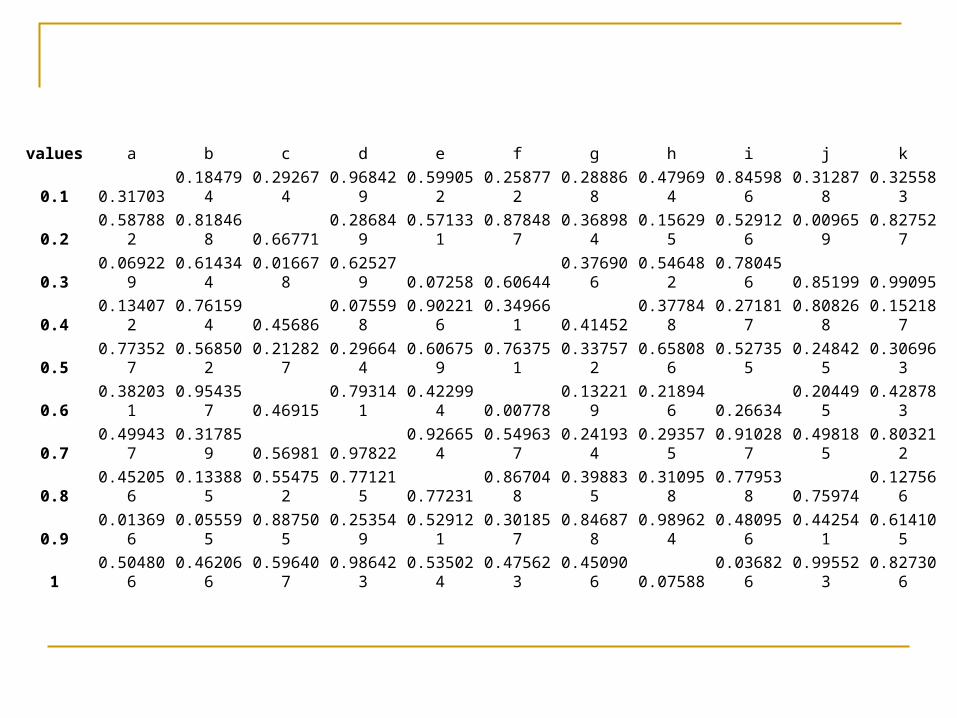
Real data Random numbers

num vars r2
1 0.0002 0.1443 0.3704 0.4115 0.4216 0.4227 0.6128 0.7039 1
10 1

r2
Nine variables of random junk successfully got an r2 of 1 on ten data points
And that’s what we call overfitting