education in england: progress and goals -...
TRANSCRIPT

January 2016
Education in England: progress and goals
Natalie Perera, Mike Treadaway and Rebecca Johnes
isbn: 978-1-909274-31-0
Published January 2016 CentreForum
This work is licensed under a Creative Commons Attribution-NonCommercial-ShareAlike 4.0 International License. For more information visit creativecommons.org
About the authors
Natalie Perera is the Executive Director and Head of Research at CentreForum. Her background includes twelve years at the Department for Education, leading on policies including school funding and early years. She is also a Director of a small Multi-Academy Trust.
Mike Treadaway is Director of Research for the Fischer Family Trust (FFT). As a leading national figure in the area of educational research, he is best known for his innovative work in developing data to support target setting and evaluation in schools and local authorities throughout England and Wales. As well as continuing to develop FFT data and undertake research, Mike is also a regular national speaker and trainer, providing advice and support on how data can be most effectively used to challenge, motivate and understand pupil progress.
Rebecca Johnes is a Research Officer at CentreForum, specialising in education. Rebecca has taught in schools both in England and Japan.
CentreForum is an independent think tank that develops evidence-based research to influence both national debate and policy making.
Education Datalab brings together a group of expert researchers who all believe in improving education policy by analysing large education datasets. Many of these are administrative databases held by Government, such as the National Pupil Database and School Workforce Census; others are large surveys like the Programme for International Student Assessment (PISA) and Labour Force Survey.

3
Contents
Introduction: David Laws 4
Overview 6
1: Method 7
2: Attainment by the end of secondary school 10
3: Attainment by the end of primary school 15
4: Attainment by the end of Early Years 20
5: Closing the Gap between the most disadvantaged and the rest
25
Conclusion 29
Appendix 1: Calculating projections for attainment at Key Stage 4
30
Appendix 2: Comparing FSP and EYFSP data
35
Appendix 3: Attainment and progress gaps according to the FFT Gap Index
36

4
IntroductionDavid Laws, Executive Chairman, CentreForum
I am very grateful to Natalie Perera, Mike Treadaway and Rebecca Johnes for the excellent work which they have done in preparing this report.
Much time is spent debating educational outcomes and policies in England, but too little time is spent considering what we are trying to achieve and how far away we are from achieving success against our aspirations.
Education is about more than attainment in examinations, but attainment is one of the most important measures of how our education system is performing.
CentreForum intends to publish an Annual Report assessing the progress being made in raising attainment and closing the large gaps between the outcomes for children from disadvantaged backgrounds and their peers.
To complete this work effectively, we need robust benchmarks of performance and the ability to assess attainment and performance gaps reliably over time. This is not an easy task. But we believe that the measures jointly agreed between CentreForum and Education DataLab help us to do this job well.
To judge how close we are to the world-class standards to which we would want to aspire, we also need to ask what good performance looks like, and we have sought to achieve this in this report. Of course, this involves complex issues of both comparison and judgement. For setting these goals, CentreForum alone is responsible. Over the next year, we will consult on the proposed goals contained within this Report to ensure that they are appropriate, achievable, rational and consistent with England reaching a truly world-class standard. We plan to carry out our own study, based on the very latest PISA data, to ensure that our world-class benchmarks are set at appropriate levels. It is worth highlighting, however, that we assume that it will take a decade or more to reach our key goals – by this time it is highly likely that international performance will also have improved.
We accept the need to refine all our measures over time, as new information becomes available and as the qualifications and accountability systems change. But we are trying to create robust and rational measures that will allow us to track changes over time.
We would welcome your views about the metrics and goals which we are using in this report, and we will consider all responses which we receive before we publish our first Annual Report in March 2016 and particularly before next year’s Annual Report.
From the work which we have undertaken so far, a number of points can usefully be made:
: At present, in England, only around 56 per cent of children in state-funded schools achieve the modest benchmark of five GCSEs at Grades A* - C,1 including English and Maths, and only around 57 per cent achieve a Level 4b or above in all of Reading, Writing and Maths at age 11 – the benchmark level for subsequent GCSE success at age 16.2
: There are still large gaps in attainment between children from disadvantaged backgrounds and the rest – and these gaps rise over a child’s time in the education system.
: The gaps have, however, fallen over time – with the Key Stage 2 gap in particular having fallen by around 30 per cent since 2006. The gap at Key Stage 4 has declined by a much smaller amount.
: Over the next few years, a new, tougher, benchmark of success at Key Stage 4 will be introduced – with success being defined by a ‘world-class’ standard of a Grade 5 in the new, reformed, GCSEs. Grade 5 is between the current Grade C and Grade B. Schools will also be measured
1 ‘ProvisionalGCSEandequivalentresultsinEngland,2014to2015’,DepartmentforEducation,15October2015.2 ThisfigureisbasedonKeyStage2resultsfrom2015andusesestimatescalculatedbytheFFTinordertoaccountforthefactthatWritingisteacher
assessedaccordingtowholelevels(notsub-levels).

5
against a new collection of ‘Attainment 8’ subjects, rather than against five GCSEs only. When Grade 5 becomes the new ‘benchmark’, we expect the proportion of pupils achieving a ‘good pass’ in English and Maths to drop (if the 2015 cohort were assessed against the new 2017 Grade 5 measure, the percentage of pupils who would have achieved a pass in English and Maths would have dropped by around 23 percentage points from 58 to 35 per cent) and by 2020 we expect only around half of pupils to achieve an average Grade 5 in their Attainment 8 measure.
: At age 16, we think most pupils can and should achieve an average of a Grade 5 in their Attainment 8 subjects and this will be the new benchmark of national success. We have set a proposed goal that across England at least 75 per cent of children should eventually achieve this level, against the FFT’s estimate of 35 per cent that achieved or exceeded the equivalent threshold in 2014.3 At schools such as King Solomon Academy, over 80 per cent of children are achieving these outcomes today.
: We believe that the vast majority of pupils should have mastered basic skills in Maths and English before leaving primary school. By 2025, we think that a sensible goal should be for 85 per cent of children to achieve the equivalent of a 4b or above in all three of Reading, Writing and Maths – compared with just 57 per cent today. Today only 572 schools are achieving this level of success.4
: At present, the gaps between disadvantaged children and their peers widen over their time in education. This isn’t good enough. Our proposed goal is that we should eliminate the progress gap at all education stages. This means that the Key Stage 2 overall attainment gap would fall from 9.0 months in 2015 to 4.1 months in 2025 and the Key Stage 4 overall attainment gap would fall from 19.9 months in 2015 to 4.1 months in 2030.
These would be bold ambitions. We want to initiate an informed debate over whether these are the right goals for our country.
3 SeeChapter2andAppendix1.4 ThisfigureisbasedonKeyStage2resultsfrom2015andusesestimatescalculatedbytheFFTinordertoaccountforthefactthatWritingisteacher
assessedaccordingtowholelevels(notsub-levels).

6
Overview
In early spring 2016, CentreForum will publish its first Annual Report on the State of Education in England. By analysing performance data spanning the last ten years, including the final 2015 GCSE data published later this month, we will provide an in-depth and comprehensive analysis of how well the education system is serving pupils in England.
We will look at whether certain groups of children are being left behind, whether the gap between rich and poor is closing, and whether schools are adding real value to the progress of students. We will also looks at geographical variations across the country, as well as comparing the performance of different types of schools, including local authority maintained schools, sponsored academies, converter academies and free schools.
This publication describes how we intend to measure performance of the education system for children and young people from the Early Years to GCSE. Recognising the significant changes that will affect both curriculum and assessment, it is also intended to initiate debate about what a world-class system should look like, about what success might be in terms of attainment and gaps, and about the progress which needs to be made in order to reach these standards. Alongside a series of goals that we propose in order to move England towards a world-class education system, this report includes projections for outcomes at different educational stages if current trajectories continue. Given the current and forthcoming assessment changes throughout the education system, the goals and projections contained within this report are necessarily provisional: we welcome the views of others working in this area and will continue to review our measures and goals over the coming months. The latest PISA assessments will also help us to model what now looks like the most up-to-date world-class standard. We plan to publish a report on a ‘World-Class Standard’ before our 2017 Annual Report.
Later in 2016, we will review performance and goals for the Post-16 and Higher Education systems.
This paper begins by explaining the overarching methodology which will be used in the Annual Report to assess the effectiveness of England’s education system, how this will account for the current and forthcoming changes to assessment and curricula at different educational stages, and how and why it differs from other methods. It goes on to outline measures to assess performance at Key Stage 4, at Key Stage 2 and at the end of the Early Years Foundation Stage. Beginning by considering what would constitute world-class results in terms of attainment at Key Stage 4, the paper sets a goal for GCSE attainment by 2030 and goes on to consider what standards must be achieved by 2025 at Key Stage 2 and by 2020 in the Early Years in order to maximise the likelihood of meeting the 2030 Key Stage 4 goal. The final chapter examines gaps in attainment and progress between disadvantaged pupils and their peers at each educational phase, and identifies goals in order to reduce these gaps.
CentreForum is very grateful for the work of Education Datalab, particularly Mike Treadaway, in supporting this report. We underline that responsibility for the proposed goals rests with CentreForum.

7
The following sections describe how CentreForum will assess the effectiveness of the education system at different points (Early Years, Key Stage 2 and Key Stage 4). We will do this by measuring i) the overall attainment of pupils and ii) the gap between the most disadvantaged and the rest.
Overall attainment
In measuring overall attainment, we have used the following indicators:
i. The percentage of pupils achieving a specific threshold (for example, a ‘good’ level of development in the Early Years or a Level 4b+ in Reading, Writing and Maths at Key Stage 2). This gives an assessment of how well the system is enabling children in England to achieve expected levels; and
ii. The percentage of pupils achieving a particular points score or average grade. This is often more meaningful than simply using a threshold, as we can credit pupils for performance beyond a given level.
Tracking overall attainment across time is complicated by changes to curricula, assessments and grading scales. The introduction of the Early Years Foundation Stage Profile in 2012, the new Key Stage 2 tests and scaled scores being introduced in May 2016, and the overhaul of GCSE examinations which is being phased in between 2015 and 2020, all render inter-temporal comparisons highly complex. Each section below discusses key changes to assessment, and explains how CentreForum’s Annual Reports intend to account for these in order to enable trends over time to be identified accurately, based on current knowledge of recent and forthcoming reforms. The methodology will be reviewed each year to ensure that it continues to allow for changes to assessment at each level.
Measuring the gap
While we could use the indicators above to measure the gap between the most disadvantaged and the rest, the changes to assessment over the coming years mean that tracking the trend of the gap will become increasingly difficult and unreliable. Some existing key gap measures which use thresholds can also be misleading as the gaps will automatically appear to close if there is a general rise in attainment. The Fischer Family Trust and Education DataLab have instead developed a different method for measuring the gap that is much more resilient to future changes in policy and assessment (the FFT Gap Index).
Rather than looking at the absolute gap (for example, the percentage of disadvantaged pupils achieving a Level 4b+ compared to non-disadvantaged pupils), we will look at the relative gap in attainment by considering the position of disadvantaged pupils within the national distribution each year. This approach is similar to that recently adopted by the Department for Education, which ranks pupils and then generates an assessment of the gap based on the average difference in ranks between disadvantaged pupils and the rest.5 However, while this is a logical approach to assess the gap at a national level (which was the Department for Education’s intention in undertaking its new work), assessing the gap at local authority, chain and school level requires a slightly different method.
The FFT Gap Index uses scaled scores, whereby each year pupil performance at the various assessment stages is scaled so that the national mean is 100. The gap at each assessment stage is the difference between the average for disadvantaged pupils compared to the average for non-disadvantaged pupils.
This method only works for assessments that are points-based because it requires a scaling of the total points achieved. We will therefore consider the gap in terms of:
5 ‘Measuringdisadvantagedpupils’attainmentgaps’,DepartmentforEducation,December2014
1: Method

8
: Total points achieved in the Early Years Foundation Stage Profile;
: Average level achieved in Reading, Writing and Mathematics at Key Stage 2; and
: Average point score across Attainment 8 subjects at Key Stage 4.
Looking solely at the gap in attainment does not, however, give us the full picture. It is also important to consider whether the gap between disadvantaged pupils and the rest is affected by a difference in progress between disadvantaged and other pupils that changes within a Key Stage, or whether it is attributable to gaps in prior attainment which already exist at the beginning of a given Key Stage. To do this, we consider the gaps in pupils’ progress scores. This enables us to make an assessment of:
: How wide the gap is when pupils start a particular Key Stage; and
: The extent to which the gap narrows or widens during a particular Key Stage.
The progress score is calculated by looking at each pupil’s attainment and comparing it with pupils who have the same prior attainment at the start of the Key Stage. The difference between the two is the progress score. Our tables show the difference between the average progress scores for disadvantaged and non-disadvantaged pupils.
By using scaled scores, the FFT Gap Index enables comparison of gaps in attainment and progress across time within each Key Stage. It therefore accounts for changes to assessment and curricula which would otherwise render such comparisons problematic.
Comparing gaps in attainment and progress scores across Key Stages is more difficult and is not what the FFT Gap Index is primarily intended to do. However, it is possible to convert the gaps in the FFT Gap Index into months of development in order to analyse trends across different educational phases.6
Projecting future gaps
Using the FFT Gap Index, we can calculate what would happen if past trends were to continue at the same rate to 2025 or 2030. These calculations use, in most cases, a simple linear projection. The intention is not to suggest that these projections provide a forecast of high accuracy: trends can and do change, and therefore these projections will need to be reviewed in the light of trends which emerge in future years. The aim of these projections, however, is to highlight how much additional intervention may be required in order to reach a world-class standard.
We explain at each stage how we have used these projections to help inform our goals for each Key Stage. But our goals are determined by looking at what a world-class standard might constitute and not by simply looking at where existing trends would lead us.
Definitions and caveats
For the purposes of CentreForum’s Annual Report, we have defined ‘disadvantaged’ pupils as those eligible for the Pupil Premium at the time of the relevant assessment.7 A strong accountability system has been built around the Pupil Premium, and the Annual Report will consider whether this accountability system, and the significant investment it underpins, is having the desired effect. We recognise, however, that there are other groups of vulnerable children whose attainment needs similar scrutiny and challenge: for example, those from ‘working poor backgrounds’, summer-born children and those living in isolated or coastal communities. CentreForum will be publishing a series
6 PleaseseeChapter5andAppendix3forfurtherdiscussionofthedifficultiesincomparinggapsinattainmentandprogressscoresacrossdifferentKeyStages,andforanexplanationofthecalculationusedtoconvertgapsrepresentedbytheFFTGapIndexintogapsinmonthsofdevelopment.
7 InthisanalysisFFTdefine‘PupilPremium’aspupilswhohavebeenFSMatanypointinthelast6years(FSM6).ThisisslightlydifferenttotheDe-partmentforEducationdefinition,whichincludespupilsinpubliccare.TheDepartmentforEducationdefinitionhasalsochangedslightlyovertime.Differencesaresmallanddonotimpactupontheconclusions.

9
of reports throughout 2016 which will look at groups such as these, examining the extent to which the system is supporting the achievement of such pupils’ potential.

10
Measure 2030 Proposed Goal
2030 Projection according to current trends
Percentage of pupils achieving 50+ points across Attainment 8 subjects.
75 per cent 60 per cent
Current Key Stage 4 context
The current benchmark for success at Key Stage 4 is the attainment of at least five GCSE qualifications at Grade C or above, including both English and Maths. The most recent provisional results show that 56 per cent of pupils in state-funded schools achieved this measure in 2015.8
Not only are nearly half of pupils not achieving what is currently considered the minimum standard of attainment at age 16 in England, but this benchmark is below the average performance of the OECD’s top-performing education systems.
Changes to Key Stage 4
The Government has announced substantial reforms to Key Stage 4 assessments and curricula, which are intended to raise the quality of education offered at this level and the systems of accountability against which this is assessed. The main changes which will be introduced over the next four years include:
: Reformed GCSEs: New GCSE qualifications which are intended to offer more challenging curricula are being phased in from 2015, with the first reformed GCSE examinations taking place in 2017. Results for these new GCSEs will be reported according to a scale of 1 to 9, with 9 being the top grade.
: Higher benchmark of attainment: According to the new scale of 1 to 9, the threshold for a pass will be Grade 5 or above. Ofqual have stated that the new Grade 5 will cover the top third of marks currently awarded a Grade C and the bottom third of marks for the current Grade B. This is therefore a higher benchmark than under the current system, where a Grade C is considered to be a good pass.9
: New accountability system: From 2016, schools will be judged according to a new accountability system which will include two new headline measures: Attainment 8 and Progress 8. Attainment 8 will measure a pupil’s achievement across eight subjects that fulfil certain requirements and include English and Maths. Progress 8 is a type of progress measure that will capture the progress made by a pupil in the same eight subjects between the end of Key Stage 2 and the end of Key Stage 4.
: Transferring between points systems for Attainment 8: For reformed GCSEs, Attainment 8 will be calculated using scores from the 1 to 9 scale which will be used to report results for these qualifications. However, reformed GCSEs are being introduced in waves between 2015 and 2017 and old GCSEs are being phased out gradually. 2020 will therefore be the first year that all results will be reported according to the new 1 to 9 scale. In the meantime, Attainment 8 will be calculated according to different scales. In 2016, a 1 to 8 scale will be used, with a Grade G counting for 1 point and each incremental grade being awarded an additional point up to 8, which will be the equivalent of an A*. Between 2017 and 2019, legacy GCSEs will
8 ‘ProvisionalGCSEandequivalentresultsinEngland,2014to2015’,DepartmentforEducation,15October2015.9 ‘Yourqualification,Ourregulation’,Ofqual,2015.
2: Attainment by the end of secondary school

11
continue to be graded alphabetically, with eight possible grades available; these alphabetical grades will then be mapped on to a 1 to 8.5 scale, whilst results from the new GCSEs issued in these years will be reported according to the new 1 to 9 scale.
Impact of Key Stage 4 reforms
The transition between different points scales in the calculation of Attainment 8 between 2016 and 2020 complicates measurement of attainment at Key Stage 4 across years. Both the interim points scale for legacy GCSEs (2017 onwards) and the fully reformed scale assign a lower score to outcomes which are between the current Grade F and Grade B than does the 2016 scale.10 This means that schools in which most GCSE exam results in 2016 range between B and F could achieve exactly the same results in 2017, 2018 and 2019 but experience a reduction in their Attainment 8 scores. Consequently, the overall impact of these changes will be a fall in the national average of GCSE grades and Attainment 8 scores.
Furthermore, raising the threshold for a good pass to Grade 5 in reformed GCSEs will result in fewer pupils reaching the standard required for a good pass. It has been estimated that in 2015, only 35 per cent of pupils would have achieved a Grade 5 or above in both English and Maths had GCSEs been graded according to the reformed 1 to 9 scale, as opposed to 58 per cent who achieved a Grade C or above in both subjects.11 This means that the proportion of pupils achieving a good pass in both English and Maths falls by around 23 percentage points when the new, higher threshold is applied to the 2015 Key Stage 4 results.
A new measure for success at Key Stage 4
CentreForum proposes combining the new Attainment 8 measure with the new pass threshold of Grade 5 in order to produce a new measure for effectiveness at Key Stage 4: the achievement of 50 or more points across Attainment 8 subjects. Under the reformed system, a pupil will need to achieve a minimum of 50 points in order to attain at least an average Grade 5 in their Attainment 8 subjects.12 Analysis of the 2009 PISA Study of educational attainment in OECD and partner countries shows that average performance at Key Stage 4 in England in 2010 was equivalent to the attainment of seven Grade Cs and one Grade B at GCSE. It suggests, moreover, that to bring average performance in England onto a par with that of top-performing countries such as Finland and Canada, a pupil whose best eight grades at GCSE were all at Grade C would need to convert most of these results to Grade B.13 As the new Grade 5 will be positioned between the current Grade C and Grade B, a benchmark representing an average attainment of Grade 5 across eight subjects constitutes, in our view, a world-class standard.
Projections for performance at Key Stage 4 according to current trendsThe FFT has calculated forecasts for the percentage of pupils achieving 50+ points in Attainment 8 for each year between 2016 and 2030. The method used to calculate these estimates takes into account the transition between different points systems as new GCSEs are introduced and legacy GCSEs are phased out, and also considers the impact of trends in entry patterns for GCSE examina-tions; it is detailed in full in Appendix 1.
The estimated percentage of pupils attaining 50+ points in Attainment 8 in future years is shown below.
10 PleaseseeAppendix1foramoredetailedexplanationoftheimpactofthetransitionbetweendifferentpointscalesforAttainment8.11 DThomsonandAMcCulloch,‘Howmanypupilswillachievegrade5inEnglishandmaths?’,EducationDatalabblog,4December2015:http://www.
educationdatalab.org.uk/Blog/December-2015/How-many-pupils-will-achieve-grade-5-in-Englis-(1).aspx#.VoqC9vmLQdV,accessed4January2016.12 AnAttainment8scorebetween50and67couldstillincludeascorebelowGrade5inatleastoneoftheeightsubjects,but50istheminimumscore
whichcouldbeachievedwhilstreachingtheGrade5thresholdinalleightsubjects.13 ‘PISA2009Study:Howbigisthegap?’,DepartmentforEducation,October2011.

12
Table 1: Projection of percentage of pupils attaining 50 points or more in Attainment 8
Year Projected percentage of pupils attaining 50+ points in Attainment 8
2016 46%
2020 50%
2025 55%
2030 60%
As explained above, the reforms to GCSEs will lead to a substantial drop in the percentage of pupils achieving the benchmark standard at Key Stage 4. By 2025, the percentage of pupils achieving the proposed new benchmark (55 per cent) will still be slightly lower than the percentage of pupils who attained the old national standard in 2015 (56 per cent). It is therefore imperative that the Government clearly communicates the forthcoming changes to parents, pupils, teachers and commentators to ensure that future outcomes are interpreted accurately at a national, school and pupil level.
One important caveat to these projections is the role played by Ofqual’s comparable outcomes approach. Intended to ensure that any given grade is equivalent from one year to another, the implementation of this process has been criticised even under the unreformed GCSE system for depressing results at Key Stage 4 and preventing pupils from being awarded higher grades than would have been the case in previous years. However a new benchmark test will help inform Ofqual’s judgements in the future. It is important that the comparable outcomes approach does not suppress real improvement in performance.
Current top-performing schools at Key Stage 4
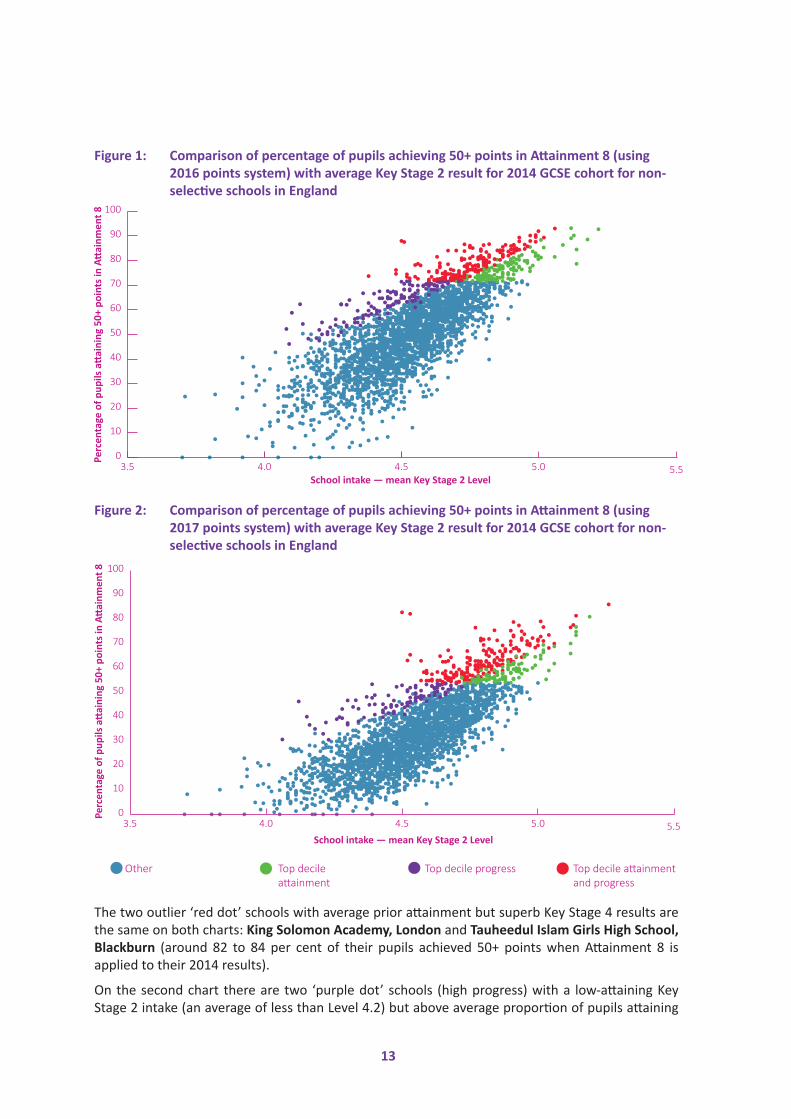
Alongside national averages, it is important to consider how well some of the best non-selective schools in the country are already performing. This has been done by comparing attainment at GCSE with prior attainment at Key Stage 2 for all non-selective state schools in England (excluding special schools). In each of the two graphs below, the proportion of a school’s 2014 GCSE cohort that achieved above the 50+ points benchmark in Attainment 8 is plotted against the cohort’s average Key Stage 2 result. As Attainment 8 was not in operation in 2014, the first graph applies the 2016 Attainment 8 points system to the 2014 Key Stage 4 data and the second graph uses the 2017 Attainment 8 points system for the same 2014 Key Stage 4 data.
The red dots represent schools in the top decile for both attainment and progress; the purple dots represent those for which progress only falls into the top decile; the green dots represent those for which attainment only falls in the top decile; and the blue dots represent schools which have neither high attainment nor progress scores. We are particularly interested in the red dots, as these represent schools which score highly for both attainment and progress.
13
Figure 1: Comparison of percentage of pupils achieving 50+ points in Attainment 8 (using 2016 points system) with average Key Stage 2 result for 2014 GCSE cohort for non-selective schools in England
3.5 4.0 4.5 5.00
10
20
30
40
50
60
70
80
90
100
3.5 4.0 4.5 5.0
0.00.10.20.30.40.5
0.9
3.5 4.0 4.5 5.0
0.00.10.20.30.40.5
0.9
3.5 4.0 4.5 5.0
0.00.10.20.30.40.5
0.9
5.5
Perc
enta
ge o
f pup
ils a
ttai
ning
50+
poi
nts i
n Att
ainm
ent 8
School intake — mean Key Stage 2 Level
Figure 2: Comparison of percentage of pupils achieving 50+ points in Attainment 8 (using 2017 points system) with average Key Stage 2 result for 2014 GCSE cohort for non-selective schools in England
3.5 4.0 4.5 5.00
10
20
30
40
50
60
70
80
90
100
3.5 4.0 4.5
5.03.5 4.0 4.5
5.03.5 4.0 4.5
5.5
Perc
enta
ge o
f pup
ils a
ttai
ning
50+
poi
nts i
n Att
ainm
ent 8
School intake — mean Key Stage 2 Level
5.5
% o
f pup
ils w
ith 5
0+ p
oint
s
School intake — mean KS2 Level
Other Top decile progress Top decile attainment and progress
Top decile attainment
The two outlier ‘red dot’ schools with average prior attainment but superb Key Stage 4 results are the same on both charts: King Solomon Academy, London and Tauheedul Islam Girls High School, Blackburn (around 82 to 84 per cent of their pupils achieved 50+ points when Attainment 8 is applied to their 2014 results).
On the second chart there are two ‘purple dot’ schools (high progress) with a low-attaining Key Stage 2 intake (an average of less than Level 4.2) but above average proportion of pupils attaining
14
50+ points across Attainment 8. These two schools also have the highest 50+ scores for schools with an average Key Stage 2 intake of lower than Level 4.2 on the first chart; they are St Thomas More Catholic School, London and Ark St Alban’s Academy, Birmingham.
Taken together, this analysis tells us that even schools which have a relatively low-performing Key Stage 2 intake can still achieve higher than average scores in Attainment 8.
Setting a goal for 2030
Our proposed goal is that 75 per cent of pupils should achieve 50+ points across Attainment 8 by 2030.
This goal has been set according to an evaluation of the following factors:
: International evidence for a ‘world-class’ benchmark: As explained earlier in this chapter, the achievement of 50 points in Attainment 8 is roughly equivalent to a world-class standard. Tracking the proportion of pupils who meet or exceed this threshold therefore enables analysis of performance against a world-class benchmark. Our analysis of PISA data suggests that, at present, few countries come close to having 75 per cent of their students reaching this world-class standard – but our goal is set for 2030 and we expect there to be a significant improvement in world performance by this date. We judge that by 2030 this will represent a world class standard, but we will look carefully at this in the light of new international data.
: Current attainment at top-performing non-selective secondary schools: The school-level analysis above demonstrates that at some of the best non-selective schools, over 80 per cent of children are already achieving above the 50-point threshold at GCSE, even where there is low prior attainment on entry to secondary school.
: Forecast of proportion of pupils achieving 50+ points by 2030 according to current trends: As outlined above, we predict that if current trajectories continue at the same rate, 60 per cent of pupils will achieve 50+ points at GCSE by 2030. CentreForum believes that aspirations can and should be set higher than this in order to bring England’s education system on a par with the world’s best.
: CentreForum’s aspirations for improved attainment at Key Stage 2 by 2025: Chapter 3 of this report sets a goal for 85 per cent of children to achieve the equivalent of a Level 4b or above in each of Reading, Writing and Maths by 2025. Improved attainment at Key Stage 2 by 2025 would provide a stronger basis for higher attainment at Key Stage 4 by 2030.
We recognise that achieving this goal would require significant improvement over the next fifteen years and that even by present world-class standards, it is ambitious. But we know that some schools with high proportions of deprived pupils are already exceeding this and it seems reasonable to set a goal that, over the next fifteen years, many other schools should be capable of achieving with similar levels of success. Nevertheless, we are keen to hear views about whether this proposed goal is achievable by 2030.
15
Measure 2025 Proposed Goal
2025 Projection according to current trends
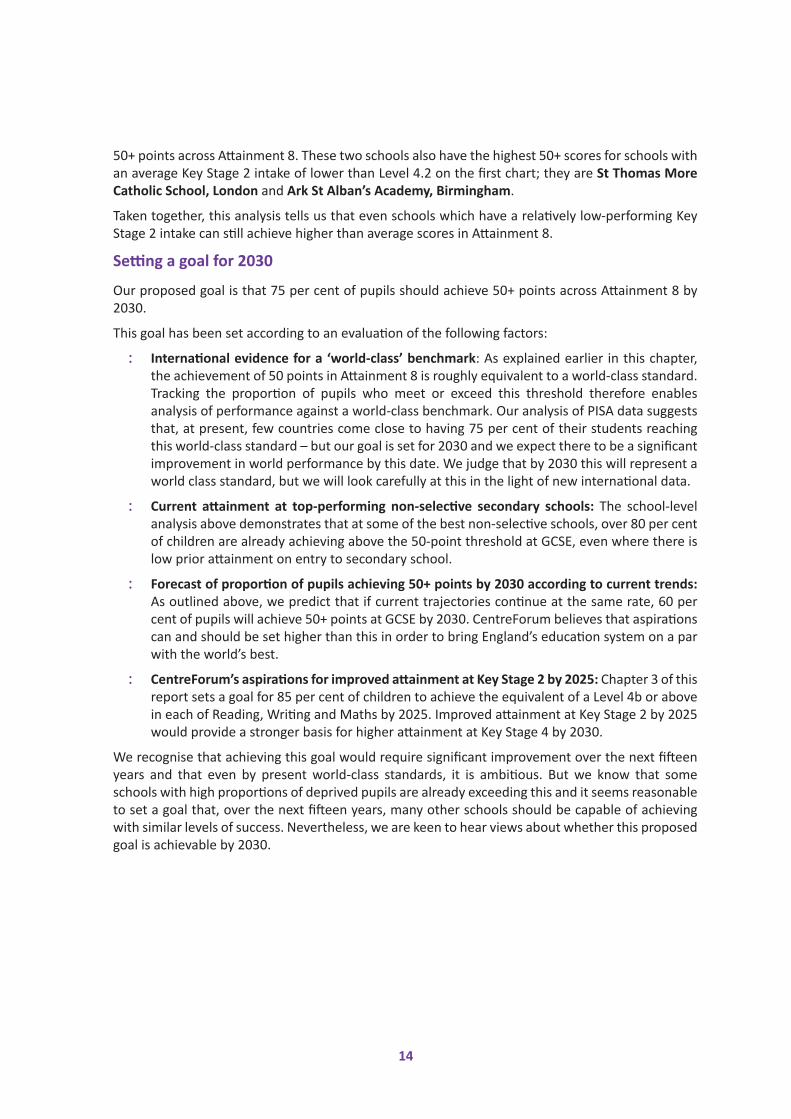
Percentage of children attaining the new equivalent to Level 4b+ in each of Reading, Writing and Maths.
85 per cent 74 per cent
Current Key Stage 2 context
For Key Stage 2 tests taken in summer 2015, the headline (pupil-level) performance measure was the attainment of Level 4c or above in each of Reading, Writing and Maths. In 2015, 80 per cent of pupils reached or exceeded this threshold.14
Changes to Key Stage 2
Primary schools are currently in the midst of a number of changes being introduced at Key Stage 2:
: New national curriculum: A new national curriculum has been taught in all local authority maintained schools and some academies since September 2014. From May 2016, new Key Stage 2 tests will be taken at age 11, which are intended to be more demanding. Results from these tests will be reported according to scaled scores and levels will be discontinued.
: Higher benchmark: A scaled score of 100 in the new tests will be equivalent to the new national standard. The Department for Education will set this new national standard on the basis of analysis of the 2016 test results. However, it has already been announced that the new national standard at Key Stage 2 will be broadly comparable to the current Level 4b.
Impact of Key Stage 2 reforms
The Department for Education has indicated that 69 per cent of children in 2015 achieved Level 4b+ at Key Stage 2, but in fact this refers to the proportion of children who attained a Level 4b or above in both Reading and Maths, plus a Level 4c or above in Writing. Writing is treated differently because, since 2011-12, it has been teacher-assessed and marked according to whole levels only and not according to sub-levels. The Department for Education’s figure of 69 per cent is therefore higher than the actual proportion of children achieving a Level 4b or above in all three skill areas.
We have estimated the number of pupils who achieve a Level 4b in Writing by considering their prior attainment in Key Stage 1 and using this to make an assumption about the sub-level they would most likely attain at Key Stage 2. This analysis suggests that, of the proportion of pupils who achieved a Level 4 in Writing, approximately 22 per cent achieved a Level 4a, 45 per cent achieved a Level 4b, and 33 per cent achieved a Level 4c. This tallies with the Department for Education statement that around the top two-thirds of pupils who achieve a Level 4 in writing do so at Level 4b or higher.15
This is an important finding because when we then look at the overall percentage of pupils attaining a Level 4b+ in Reading, Writing and Maths, the FFT analysis concludes that only 57 per cent of pupils achieved this benchmark in 2015, rather than the 69 per cent cited in the Department for Education statistical release.16
14 ‘Nationalcurriculumassessmentsatkeystage2inEngland,2015(revised)’,DepartmentforEducation,10December2015.15 Nationalcurriculumassessmentsatkeystage2:2015(revised)’,DepartmentforEducation,10December2015:https://www.gov.uk/government/
statistics/national-curriculum-assessments-at-key-stage-2-2015-revised,accessed5January2015.16 ‘Nationalcurriculumassessmentsatkeystage2:2015(revised)’,DepartmentforEducation,10December2015:https://www.gov.uk/government/
statistics/national-curriculum-assessments-at-key-stage-2-2015-revised,accessed5January2015.
3: Attainment by the end of Primary School

16
A new measure for effectiveness at Key Stage 2
There is growing consensus among many experts who we consulted during the writing of this document that setting a goal at Level 4c for primary pupils is not sufficiently robust to ensure success at Key Stage 4. Indeed, some high performing state schools such as King Solomon Academy set their standards as high as a Level 5c. Further analysis indicates that the chances of achieving a Grade C or higher at GCSE increases significantly if a child achieves a Level 4b across Reading, Writing and Maths at primary, compared to a Level 4c.
Our own analysis (of 2014 performance data) suggests that around 62 per cent of pupils who achieve a Level 4c or higher in Reading, Writing and Maths will then go on to achieve 50 points or more under the new GCSE assessment arrangements. This compares with around 74 per cent of pupils who achieve a Level 4b or higher in Reading Writing and Maths. For those who achieve a Level 4a or higher in each of those subjects, the chances of achieving 50+ points at Key Stage 4 increases to 84 per cent.
If a pupil scores a Level 4b (and no higher) across all three subjects, our analysis suggests that he or she has a 27 percent chance of achieving 50+ points at Key Stage 4. This increases to around 40 per cent for those who secure a Level 4a (and no higher). Our provisional view is that a world-class standard for primary must be set higher than a Level 4c but that Level 4a may constitute an unrealistic goal, even if it does provide a more solid basis for transition to secondary school. We have therefore provisionally set our measure for Key Stage 2 as the percentage of children achieving the equivalent of Level 4b or higher in Reading, Writing and Maths at Key Stage 2, but we are keen to hear views as to whether this is appropriate or whether the bar should be set higher, at a Level 4a. The introduction of scaled scores may well make it possible for a measure to be set according to a standard between the current Level 4b and Level 4a, as the scaled scores will be more finely grained than the current sub-levels. Before our 2017 Anual Report, we will also consider the 2016 results, which will be the first under the new primary assessment arrangements.
Projections for performance at Key Stage 2 according to current trends
As the new Department for Education national standard will be roughly equivalent to the attainment of a Level 4b+ in each of Reading, Writing and Maths, it is possible to estimate the proportion of pupils reaching this threshold in future years via a linear projection based on the proportion of pupils achieving this standard in recent years (using estimates of the proportion of pupils attaining a Level 4b in Writing).

17
Figure 3: Projected proportions of pupils attaining Level 4b+ in Reading, Writing and Maths at Key Stage 2, according to current trends
30
40
50
60
70
80
20252020201520102006Perc
enta
ge o
f pup
ils a
ttai
ning
Lev
el 4
b+ in
Rea
ding
, W
riting
and
Mat
hs a
t Key
Sta
ge 2
Should the rate of increase be consistent with that over the past ten years, then in 2025 74 per cent of pupils will attain the equivalent of a Level 4b or higher in each of Reading, Writing and Maths. This must however be treated with caution as we cannot assume that the same progress will be made in future years.
Current top-performing schools at Key Stage 2
For each state primary school in England, the graph below plots the average proportion of the school’s Key Stage 2 cohort attaining Level 4b+ in Reading and Maths plus Level 4+ in Writing in 2013, 2014 and 2015, against the average prior attainment for these cohorts at Key Stage 1.17
As in Chapter 2 of this report, the red dots represent schools in the top decile for both attainment and progress; the yellow dots represent those for which progress only falls into the top decile; the brown dots represent those for which attainment only falls in the top decile; and the blue dots represent schools which have neither high attainment nor high progress scores.
17 Level4+hasbeenusedforWriting,asestimatingtheproportionofpupilsattainingLevel4b+inWritingisproblematicattheschoollevelduetothesmallcohortsize.Specialschoolsandschoolswithfewerthan10pupilshavebeenexcludedfromtheanalysis.Theanalysisisbasedonathree-yearaggregateasthisprovidesgreateraccuracyduetothesmallercohortsizestypicallyfoundattheprimarylevel.

18
Figure 4: Comparison of percentage of pupils achieving a Level 4b+ in Reading and Maths plus a Level 4+ in Writing at Key Stage 2 with average Key Stage 1 result for 2013, 2014 and 2015 Key Stage 2 cohorts for schools in England
1.5 1.7 1.9 2.1 2.3 2.5 2.7 2.9 3.1 3.31.5 1.7 1.9 2.1 2.3 2.5 2.7 2.9 3.1 3.31.5 1.7 1.9 2.1 2.3 2.5 2.7 2.9 3.1 3.3
1.5 1.7 1.9 2.1 2.3 2.5 2.7 2.9 3.1 3.30
10
20
30
40
50
60
70
80
90
100
Perc
enta
ge o
f pup
ils a
chie
ving
Lev
el 4
b+ in
Rea
ding
and
Mat
hs
plus
Lev
el 4
+ in
Writi
ng a
t Key
Sta
ge 2
Prior attainment — average Key Stage 1 fine grade
5.5
% o
f pup
ils w
ith 5
0+ p
oint
s
School intake — mean KS2 Level
Other Top decile progress Top decile attainment and progress
Top decile attainment
As this graph demonstrates, there are already some schools in which over 90 per cent of pupils achieve Level 4b+ in Reading and Maths plus a Level 4+ in Writing at Key Stage 2, despite fairly low prior attainment at Key Stage 1 (around 2.4). There are also a number of schools which have very low attainment at Key Stage 1 (around 2.1) which nevertheless achieve above the national average proportion of pupils attaining Level 4b+ in Reading and Maths plus Level 4+ in Writing at Key Stage 2, which over these three years was 68.4 per cent.
In addition, in 2015, 572 schools had Key Stage 2 cohorts in which 85 per cent or more of pupils achieved a Level 4b+ in Reading, Writing and Maths.
Setting a proposed goal for 2025
Our proposed goal is that 85 per cent of pupils should achieve the equivalent of a Level 4b or above in each of Reading, Writing and Maths by 2025.
This goal has been set according to an evaluation of the following factors:
: Evidence that Level 4b+ is a suitable basis for subsequent success at GCSE: As set out above, there is growing evidence and consensus that Level 4c is too low an expected standard at Key Stage 2. Pupils who attain Level 4b+ in Reading, Writing and Maths are more likley to achieve 50+ points in Attainment 8 at Key Stage 4. However, we are keen to take views on whether even the equivalent of Level 4b+ is sufficiently high as a measure of attainment at Key Stage 2.
19
: Current attainment at top-performing non-selective primary schools: Even with relatively low prior attainment at Key Stage 1, the graph above shows that many schools get 85 per cent or more of their pupils up to at least a Level 4b.
: Forecast of proportion of pupils achieving equivalent of Level 4b+ by 2025 according to current trends: The calculations set out above suggest that, if current trends continue, 74 per cent of pupils will achieve a Level 4b+ in each of Reading, Writing and Maths in 2025. CentreForum believes that, given the importance of attainment of this standard in raising a pupil’s chances of going on to achieve 50+ in Attainment 8, the goal should be set higher, not least because if we are aiming for 75 per cent of pupils to achieve 50+ points at Key Stage 4, then we need around 85 per cent of primary pupils to achieve this given the current forecast of transition from Key Stage 2 to Key Stage 4 results.
: CentreForum’s aspirations for improved attainment in Early Years by 2020: Chapter 4 of this document outlines a goal for 90 per cent of children to achieve a ‘good’ level of development in the Early Years by 2020. Higher prior attainment in the Early Years would provide a stronger basis for greater achievement at the end of Key Stage 2.

20
Measure 2020 Proposed Goal
2019 Projection according to current trends
Percentage of children achieving a ‘good’ level of development.
90 per cent 94 per cent
Current Early Years context
The headline performance measure for the Early Years in 2015 was the percentage of children achieving a ‘good’ level of development in the Early Years Foundation Stage Profile. A child is considered to have achieved a good level of development if they meet or exceed the expected level in five of the EYFSP’s seven areas of learning when assessed at age 5 (Communication and Language; Physical Development; Personal, Social and Emotional Development; Literacy; and Mathematics). In 2015, 66 per cent of children achieved a good level of development.18
The EYFSP was introduced in 2012-13, replacing the Foundation Stage Profile. This change in assessment renders comparisons before and after the introduction of the EYFSP complex. The FFT has therefore produced a means of converting EYFSP scores into a total FSP score and have used this to establish a points threshold which is roughly equivalent to the attainment of a good level of development for the pre-2013 data. A full explanation of the calculations used can be found in Appendix 2.
The graph below outlines how the proportion of children achieving a good level of development has changed since 2007. For years prior to 2013, the FFT calculation for good development is used. Data from 2013 onwards shows published Department for Education data.
Figure 5: Percentage of pupils achieving a good level of development at age 5
30
35
40
45
50
55
60
65
70
2015201320102007
Perc
enta
ge o
f pup
ils a
chie
ving
goo
d le
vel o
f de
velo
pmen
t at t
he e
nd o
f Ear
ly Y
ears
18 ‘EarlyyearsfoundationstageprofileresultsinEngland,2015’,DepartmentforEducation,13October2015.
4: Attainment by the end of the Early Years

21
The steep increase in the percentage of children achieving a good level of development since 2012 is likely to be caused by a combination of two factors. Firstly, the EYFSP is less finely-grained than the FSP,19 meaning that as children achieve a higher point score, the proportion of children increases faster (relative to the progression on the FSP). Secondly, there was already a steady increase in the proportion of children achieving a good level of development even before the introduction of the EYFSP and so some of the post-2012 increase can be attributed to this trend.
A measure for effectiveness in the Early Years
Examining the relationship between attainment in the Early Years and at Key Stage 2 suggests that the good level of development threshold in the Early Years provides a suitable measure for effectiveness at this level.
As FSP data is available from 2007, there are now three years of Key Stage 2 data to which it can be linked (FSP data from 2007, 2008 and 2009, linked with Key Stage 2 data from the same cohorts in 2013, 2014 and 2015). The graphs below examine the relationship between attainment in the FSP and attainment at Key Stage 2 for these three cohorts. The first compares total FSP score with average level at Key Stage 2 across Reading, Writing and Maths. The second shows the percentage of pupils who achieved Level 4b or above in each of Reading. Writing and Maths at Key Stage 2, for each FSP score.20
Figure 6: Comparison of FSP total points score with average Key Stage 2 fine grade score
2.0
3.0
4.0
5.0
6.0
2015
2014
2013
1201101009080706050403020
Fine
gra
de sc
ore
in R
eadi
ng, W
riting
an
d M
aths
at K
ey S
tage
2
FSP total points score
19 ThetotalnumberofpointsachildcouldscoreundertheFSPwas117,asopposedto51undertheEYFSP.20 ThisdefinitionofLevel4b+inReading,WritingandMathsisbasedonthecalculationsoutlinedinChapter3toaccountforthefactthatWritingis
teacherassessedbywholelevels(notsub-levels)atKeyStage2.

22
Figure 7: Comparison of FSP total point score with proportion of pupils attaining Level 4b+ in Reading, Writing and Maths at Key Stage 2
0
20
40
60
80
100
2015
2014
2013
1201101009080706050403020
Perc
enta
ge o
f pup
ils a
chei
vein
g Le
vel 4
b+
in R
eadi
ng, W
riting
and
Mat
hs a
t Key
Sta
ge 2
FSP total points score
Both graphs show a consistent relationship over the three years with Key Stage 2 outcomes, for a given FSP total, increasing from 2013 to 2014 and again, although less so, from 2014 to 2015. This demonstrates that the good development bar is a useful measure of success, as the large majority of children who achieve this level go on to attain Level 4b+ in Reading, Writing and Maths at Key Stage 2 and are significantly more likely to do so than those who do not reach a good level of development by the end of the Early Years, as shown below.21
Figure 8: Proportion of pupils achieving Level 4b+ in Reading, Writing and Maths at Key Stage 2, based on attainment in the Early Years
0
10
20
30
40
50
60
70
80 At or above ‘good’ development levelin the Early Years
Below ‘good’ development levelin the Early Years
201520142013
Perc
enta
ge o
f pup
ils a
chei
ving
Lev
el 4
b+
in R
eadi
ng, W
riting
and
Mat
hs a
t Key
Sta
ge 2
21 ThisdefinitionofLevel4b+inReading,WritingandMathsisbasedonthecalculationsoutlinedinChapter3toaccountforthefactthatWritingisteacherassessedbywholelevels(notsub-levels)atKeyStage2.
23
CentreForum’s Annual Report, therefore, will use the percentage of children attaining good development by the end of the Early Years as a measure of effectiveness at this level in the education system.
Projections for performance in Early Years Foundation Stage Profile according to current trends
From September 2016, the Early Years Foundation Stage Profile will no longer be compulsory and schools can instead use the Reception Baseline Assessment. While the Reception Baseline Assessment will also be voluntary, any school that chooses not to use it will not have a progress measure from 2023 (and will therefore be assessed solely on the attainment of their Year 6 pupils). It is difficult to predict how schools will respond to these changes, whether and how many will continue to use the EYFSP, and whether the Department for Education will continue to collect EYFSP attainment data.
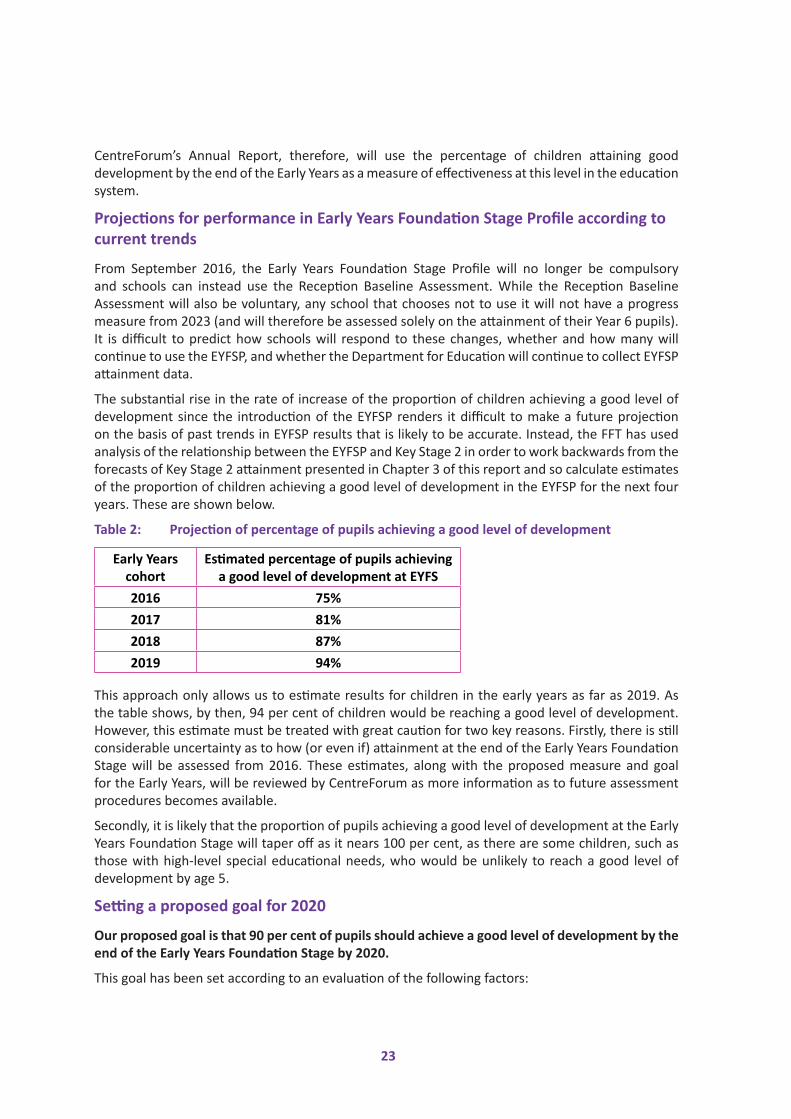
The substantial rise in the rate of increase of the proportion of children achieving a good level of development since the introduction of the EYFSP renders it difficult to make a future projection on the basis of past trends in EYFSP results that is likely to be accurate. Instead, the FFT has used analysis of the relationship between the EYFSP and Key Stage 2 in order to work backwards from the forecasts of Key Stage 2 attainment presented in Chapter 3 of this report and so calculate estimates of the proportion of children achieving a good level of development in the EYFSP for the next four years. These are shown below.
Table 2: Projection of percentage of pupils achieving a good level of development
Early Years cohort
Estimated percentage of pupils achieving a good level of development at EYFS
2016 75%2017 81%2018 87%2019 94%
This approach only allows us to estimate results for children in the early years as far as 2019. As the table shows, by then, 94 per cent of children would be reaching a good level of development. However, this estimate must be treated with great caution for two key reasons. Firstly, there is still considerable uncertainty as to how (or even if) attainment at the end of the Early Years Foundation Stage will be assessed from 2016. These estimates, along with the proposed measure and goal for the Early Years, will be reviewed by CentreForum as more information as to future assessment procedures becomes available.
Secondly, it is likely that the proportion of pupils achieving a good level of development at the Early Years Foundation Stage will taper off as it nears 100 per cent, as there are some children, such as those with high-level special educational needs, who would be unlikely to reach a good level of development by age 5.
Setting a proposed goal for 2020
Our proposed goal is that 90 per cent of pupils should achieve a good level of development by the end of the Early Years Foundation Stage by 2020.
This goal has been set according to an evaluation of the following factors:

24
: Evidence that a ‘good’ level of development by the end of the Early Years is a suitable basis for subsequent attainment of Level 4b+ at Key Stage 2: Attainment of a good level of development in the Early Years provides a child with a solid basis for progression to a Level 4b+ in Reading, Writing and Maths by the end of Key Stage 2. In 2015, 77 per cent of children who had achieved a good level of development in the Early Years went on to attain Level 4b+ in Reading, Writing and Maths at Key Stage 2, as opposed to only 44 per cent who had not reached the good threshold at age 5.
: Forecast of proportion of pupils achieving good level of development by 2019 according to current trends: As explained above, current trajectories suggest that 94 per cent of pupils will achieve a good level of development in the EYFS by 2019. However, it is very likely that the proportion achieving a good level of development will in fact taper off as it nears 100 per cent. For this reason, CentreForum believes that a more realistic goal is the attainment of a good level of development at age 5 by 90 per cent of children by 2020.

25
Measures Proposed GoalsGap between advantaged and disadvantaged pupils in prog-ress made between ages 5 and 16, measured according to months of development.
0 months by 2030
Gap between advantaged and disadvantaged pupils in overall attainment by the end of Key Stage 2, measured according to months of development.
4.1 months by 2025
Gap between advantaged and disadvantaged pupils in overall attainment by the end of Key Stage 4, measured according to months of development.
4.1 months by 2030
Current context for gaps in attainment and progress
As set out in Chapter 1, we have used the FFT Gap Index to measure both the attainment gap and the progress score gap between the most disadvantaged pupils and their peers. The primary aim of the FFT Gap Index is to enable gaps in attainment and progress to be measured over time within each Key Stage. However, as detailed later in this chapter and in Appendix 3, it is possible to track gaps in attainment and progress from one Key Stage to another by converting the FFT Gap Index into months of development.
The tables below provide the attainment gap at each educational stage in recent years and indicate that the overall attainment gap has narrowed at all levels but much more so for the Early Years, Key Stage 1 and Key Stage 2 than at Key Stage 4.22 Alongside this, the overall trajectory at each Key Stage has been a narrowing of the progress gap, although it is worth noting that the progress gap at Key Stage 4 appears to have increased in the last two years.
Early Years Foundation Stage Profile: Overall attainment gap according to FFT Gap Index
The table below shows a steady closing of the gap since 2007. As this is the first stage in which children are assessed, there is no progress measure for the early years.
Table 3: Overall attainment gap in Early Years Foundation Stage Profile according to FFT Gap Index scaled scores
YearOverall attainment gap (FFT Gap Index – scaled scores)
2007 8.52008 8.22009 8.12010 7.92011 7.62012 7.72013 7.32014 7.32015 7.2
22 MoredetailedstatisticaltablescontainingdataongapsinoverallattainmentandprogressareavailableinAppendix3,alongsideanexplanationastohowtheFFTGapIndexscaledscorescanbeconvertedintomonthsofdevelopment.
5: Closing the gap between the most disadvantaged and the rest

26
Key Stage 1: Overall attainment gap and progress gap according to FFT Gap IndexWhile the table below shows a steady closing of the overall gap, the progress gap has shown little movement since 2009 and even the small improvement since then appears to have been almost eradicated in 2015, although this may be due at least in part to earlier changes in assessment at age 5.23
Table 4: Overall attainment and progress gaps at Key Stage 1 according to FFT Gap Index scaled scores
Year Overall attainment gap (FFT Gap Index – scaled scores)
Progress gap (FFT Gap Index – scaled scores)
Percentage of overall attainment gap due to the progress gap
2009 8.8 2.7 30%
2010 8.5 2.6 31%
2011 8.3 2.5 30%
2012 7.9 2.2 28%
2013 7.8 2.2 28%
2014 7.5 2.0 26%
2015 7.1 2.5 35%
Key Stage 2: Overall attainment gap and progress gap according to FFT Gap Index
Key Stage 2 shows the most promising trend in reducing the overall gap in attainment. However, the last few years reveal negligible movement in the progress gap.
Table 5: Overall attainment and progress gaps at Key Stage 2 according to FFT Gap Index scaled scores
Year Overall attainment gap (FFT Gap Index – scaled scores)
Progress gap (FFT Gap Index – scaled scores)
Percentage of overall attainment gap due to the progress gap
2006 9.6 1.9 19%2007 9.1 1.5 17%2008 8.6 1.4 16%2009 8.3 1.3 16%2010 8.0 1.1 13%2011 8.1 1.1 13%2012 7.5 0.9 12%2013 7.4 0.8 11%2014 7.2 0.9 13%2015 6.7 0.9 13%
23 TheprogressgapatKeyStage1in2015appearstobeoutoflinewiththetrendinpreviousyears.Thismaybeduetoearlierchangesinassessmentatage5,withtheEYFSPintroducedtoreplacetheFSPin2012-13.The2015KeyStage1cohortwasthefirsttobeassessedundertheEYFSPatage5.OnceKeyStage1dataisavailableforasecondcohortwhichhasalsocompletedtheEYFSP(the2016KeyStage1cohort)itwillbepossibletoassesstheextenttowhichthischangeinassessmentatage5isinfluencingtrendsintheKeyStage1progressgap.

27
Key Stage 4: Overall attainment gap and progress gap according to FFT Gap Index24
At Key Stage 4, the attainment gap has fallen modestly since 2011 but the progress gap has in fact widened, potentially undermining the efforts that have been made in the primary phase.
Table 6: Overall attainment and progress gaps at Key Stage 4 according to FFT Gap Index scaled scores
Year Overall attainment gap (FFT Gap Index – scaled scores)
Progress gap (FFT Gap Index – scaled scores)
Percentage of overall attainment gap due to the progress gap
2011 11.0 3.9 35%
2012 10.5 3.7 35%
2013 10.2 3.6 35%
2014 10.1 3.7 36%
2015 10.2 4.0 39%
Converting FFT Gap Index into months
In order to allow for accurate comparison of trends across Key Stages, the FFT Gap Index scaled scores can be converted into months of development. As shown in the table below, this analysis demonstrates that the overall attainment gap widens at each stage in the education system, but at a much faster rate between Key Stage 2 and Key Stage 4 than at earlier stages.
Table 7: Overall attainment gap at different Key Stages in scaled scores and months of development
Stage 2015 Overall attainment gap (FFT Gap Index – scaled scores)
2015 Overall attainment gap (FFT Gap Index – months)
Early Years Foundation Stage 7.2 4.5
Key Stage 1 7.1 6.2
Key Stage 2 6.7 9.0
Key Stage 4 10.2 19.9
Indeed, when the progress gap is analysed across Key Stages, it becomes clear that it is much larger between Key Stage 2 and Key Stage 4 than it is at either Key Stage in primary school. The table below shows the progress gap in months for each Key Stage transition. For each transition, we used the 2015 data for the higher Key Stage and the data for the same cohort for the previous Key Stage (so, for example, the data used to calculate the progress gap between Key Stage 2 and Key Stage 4 was the 2010 Key Stage 2 data and the 2015 Key Stage 4 data).
24 ThetableforKeyStage4showsoverallattainmentandprogressgapsinaveragescore(pointspersubjectentry)acrossAttainment8from2010-11onwards.TheAttainment8scoresusedtocalculatethesegapswasobtainedbyusingthe1-8Attainment8scalewhichwillbeinoperationin2016.

28
Table 8: Progress gap in months at different Key Stages
Transition Progress gap (FFT Gap Index – months)
Early Years Foundation Stage to Key Stage 1 2.1
Key Stage 1 to Key Stage 2 1.2
Key Stage 2 to Key Stage 4 7.8
Setting a proposed goal
As a first step, CentreForum’s proposed goal is for the progress gap to be eliminated at each stage in the education system. Beyond this, we might also want to see the gap in prior attainment evident on entry to school reduced, both by narrowing the gap by the end of the Early Years Foundation Stage and by continuing to reduce it thereafter. However, our proposed interim target is for the progress gap to be removed at each stage, so that for the Key Stage 4 cohort of 2030, there will have been no progress gap between the ages of 5 and 16 (EYFSP to Key Stage 4). This means that the overall attainment gap at Key Stage 4 should be the same as the attainment gap in the EYFSP.
The 2030 Key Stage 4 cohort will complete the Early Years Foundation Stage in 2019; if current trajectories continue at the same rate, then the overall attainment gap at age 5 in 2019 will be 4.1 months. CentreForum’s proposed goal, therefore, is for the overall attainment gap to be 4.1 months at Key Stage 4 by 2030.
In order to achieve this goal, the progress gap at Key Stage 4 must be eliminated by 2030; the progress gap at Key Stage 2 must be removed by 2025; and the progress gap at Key Stage 1 must be zero by 2021. This allows more time for the progress gap to be closed at Key Stage 4, where it is largest, than it does at primary school.
In summary, our proposed goal is:
: For Key Stage 2 to narrow the gap to 4.1 months by 2025. This would take it from 6.7 FFT points in 2015 to 3.0 points in 2025.
: For Key Stage 4 to narrow the gap to 4.1 months by 2030. This would take it from 10.2 FFT points to 2.1 points in 2030.
For Key Stage 4, this means the gap would narrow by around two-thirds of a GCSE grade in each subject on average by 2030. At present the gap at Key Stage 4 is equivalent to around one grade per subject on average.
This is highly ambitious given that the Key Stage 4 gap has been particularly stubborn to shift and that this goal would take us beyond what some of the most equitable OECD countries are currently achieving. However, there has been significant investment in disadvantaged pupils over the last decade or so and we believe that, with this investment, should come greater expectations and ambition for this group of pupils. In addition, we would expect gaps in attainment and progress of disadvantaged and non-disadvantaged pupils to fall in other education systems over the next twenty years. We are keen to hear views on this.

29
We believe that the analysis contained within this report provides a sophisticated and robust assessment of trends in attainment and gaps over recent years, which is not subject to distortion by thresholds and other effects. We have also used our analysis to assess what world-class standards might look like for the English education system.
We look forward to hearing the views of all interested parties on these possible goals. As the new GCSEs are phased in over the next few years, and with a higher benchmark pass of Grade 5, it will be obvious that a large percentage of children in England, not least from disadvantaged families, are still failing to secure a good level of achievement. This highlights the need for more policy attention to measures which might raise attainment and close the gap between disadvantaged pupils and their peers.
Please send your thoughts or reflections on this document to: [email protected]
Conclusion

30
The graph below shows how the 2016 points system used to calculate Attainment 8 for legacy GCSEs compares with the 2017 points system for legacy GCSEs.
Figure 9: Comparison of 2016 and 2017 points systems for legacy GCSEs
0
1
2
3
4
5
6
7
8
9
2017 points
2016 points
A*ABCDEFGU
1.0 1.5
2.0
3.0
4.0
5.5
7.0
8.5
Fort
hcom
ing
num
eric
al g
rade
s
Current alphabetical grades
As the chart illustrates, each grade between F and B will earn fewer points for Attainment 8 in 2017 than will be the case in 2016, whilst an A* will be worth more (Grades G and A will be worth the same number of points in both years). A school in which most GCSE exam results in 2016 range between B and F could achieve exactly the same results in 2017 but experience a fall in its Attainment 8 score, whilst a school in which most GCSE exam results are at A and A* could likewise attain the same results in both years but enjoy an increase in its Attainment 8 score. Although the top-performing schools are likely to benefit from the change in points, the overall impact of the change at a national level is likely to be a fall in Attainment 8 scores.
In devising a calculation that can reliably compare data for 2016 and beyond with that for earlier years, the FFT have taken into account the various changes to GCSE examinations described in Chapter 2 of this publication, as well as the information provided by Ofqual as to the likely pupil outcomes for reformed GCSEs:
: Roughly the same proportion of pupils will achieve a Grade 4 and above as currently attain a Grade C and above;
: Approximately the same proportion of pupils will gain a Grade 7 and above as currently achieve a Grade A or higher;
: The bottom of Grade 1 will be equivalent to the bottom of the current Grade G;
: Grade 5 will span roughly the top third of students who currently achieve a Grade C and the bottom third of pupils currently gaining a Grade B.25
Based on this guidance and on further calculations by the FFT, it is likely that the proportions of pupils attaining each grade will be roughly similar to those outlined in the matrix below.
25 ‘Yourqualification,Ourregulation’,Ofqual,2015.
Appendix 1: Calculating projections for attainment at Key Stage 4

31
Figure 10: Likely proportions of pupils achieving each grade under reformed GCSEs
0 1 2 3 4 5 6 7 8 9 Score0 U 100% 0.01 G 0% 100% 1.02 F 50% 50% 1.53 E 0% 100% 2.04 D 0% 100% 3.05 C 67% 33% 4.36 B 33% 67% 5.77 A 0% 70% 30% 7.38 A* 35% 65% 8.7
It is important to note that the matrix above is based upon a number of assumptions and that actual outcomes in reformed GCSEs may differ. It may also be the case that there is variation between different subjects. Nevertheless we feel that this matrix provides the best possible basis for calculation given what we now know.
The FFT have used this matrix and have estimated equivalent point scores for exams taken between 2005-06 and 2014-15 (based on prior attainment at Key Stage 2) to assess the impact of the changes to Key Stage 4 assessment.
Each pupil’s average GCSE grade (based on their best eight subjects) is then calculated using four methods:
A. 2016 scale (A* = 8 points; G = 1 point)
B. 2017 scale (A* = 8.5 points; G = 1 point)
C. 2017 1-9 scale with grades assigned in proportion from matrix
D. 2017 1-9 sale using points for A*-G from the matrix
The chart below shows the outcomes of each of these methods.
Figure 11: Comparison of forthcoming points systems at GCSE
0
1
2
3
4
5
6
7
8
9
D : 1-9 Scale (Method 2)
C : 1-9 Scale (Method 1)
B : 2017 Legacy GCSE Scale
A*ABCDEFGU
A : 2016 points scale
Fort
hcom
ing
num
eric
al g
rade
s
Current alphabetical grades

32
The chart shows that, from 2017 onwards (lines B, C and D) there is greater reward at the top of the scale but less at the lower end of the scale, compared with the pre-2016 system. Given that reformed GCSEs are phased in over the period from 2017 to 2019 we should expect the average grade to be somewhere between B and C/D in 2017 (when only English and mathematics are on the 1-9 scale) to 2020 (when all GCSEs should be on the 1-9 scale).
In 2017, when we know the outcomes of the first reformed GCSEs in English and Maths, we will be able to assess the accuracy of our approach and, if necessary, amend and re-calculate.
The FFT has estimated average Attainment 8 scores and the percentage attaining 50+ points under each of the four methods described above (A-D). They do so in two ways.
1. Undertaking a calculation of Attainment 8 (based on 2014 data) using points scores for methods A and B and looking at the percentage of pupils with 50 or more points.
2. Looking at the percentage of pupils with an average GCSE grade of 5.0 or higher using methods A, B, C and D.
This is shown in the chart below.
Figure 12: Comparison of GCSE attainment under forthcoming points systems
0
10
20
30
40
50
60
2D2C2B1B2A1A
54% 55%
37% 36%
42%39%
Perc
enta
ge o
f pup
ils
Method
Methods 1A / 2A and 1B / 2B give similar outcomes; this suggests that Method 2 (which uses average GCSE grade) can be used to provide an estimate of the percentage of pupils likely to attain 50+ points in Attainment 8.
We can, therefore, use Method 2 to generate projections of the ‘50+ equivalent’ from calculated mean GCSE grade for years where Attainment 8 data is not available i.e. prior to 2012.

33
Figure 13: Percentage of pupils attaining 50+ points in Attainment 8 based on estimated mean GCSE grade
25
30
35
40
20142012201020082006
Perc
enta
ge o
f pup
ils a
ttai
ning
50+
po
ints
in A
ttai
nmen
t 8
This chart illustrates an additional issue that affects how we project future trends. Average GCSE grades show a slow but steady increase over a long period (including years prior to those shown on this chart). From 2007-08 onwards the annual rate of increase was higher, partly as a consequence of the impact of multiple entry in English and Maths. The impact of first entry rules can be seen clearly in the drop in average grade in 2013.
Given the scale of the impact of the first entry rule, it would be inappropriate to use trends based on this data to project forward. We have therefore ignored data for the period 2007 to 2012 when making projections.
Prior to 2007 average GCSE grade and increased by just over 1% per year. If Key Stage 4 outcomes continue to increase in line with previous trends (and ignoring years where multiple entry had a significant impact) then we would project, for 2020, outcomes of:
: 52 per cent using Method 2C
: 48 per cent using Method 2D
We ruled out using Method 2B as it is based on legacy GCSEs using the 2017 points scale and so is not appropriate in projecting beyond 2020. This means that the 2025 estimate for attainment of 50+ points in Attainment 8 is around 50 per cent.
However, we also know that another factor that will influence outcomes in Attainment 8 at Key Stage 4 will be changes in entry patterns (as schools and pupils respond to the Attainment 8 standards). This means that there are likely to be increases in the number of pupils taking subjects which count in Attainment 8.
The FFT modelled how this might affect future results by making the following assumptions:
: Entry for the Ebacc slot continues to increase in line with trends over the last four years;

34
: Pupils attain grades in these additional subjects consistent with the grades they currently attain in Ebacc subjects.
These calculations suggest that the projections for attainment of 50+ points in Attainment 8 would increase by around 2 percentage points.
This then gives us the following projections for 2025:
Table 9: Projections of percentage of pupils achieving 50+ points in Attainment 8
Year Percentage of pupils achieving 50+ points in Attainment 8
2021 51%2022 52%2023 53%2024 54%2025 55%
There are other considerations. Over the period from 2017 to 2019 Ofqual will apply a comparable outcomes approach. From 2021 onwards the national reference tests will inform standard setting at Key Stage 4. It is impossible to model the outcome of these changes.

35
The Early Years Foundation Stage Profile was introduced in 2012-13, replacing the Foundation Stage Profile (FSP). The two assessment systems use different scales and scores; the transition to the EYFSP therefore means that earlier data cannot be compared directly with data from 2012-13 onwards. However, the FFT have developed an approach which does allow for meaningful comparison by converting EYFSP scores into a total FSP score. When these converted total FSP scores are plotted against those who achieved a ‘good’ level of development according to the FSP measure, we find that pupils with a total point score of 92 are significantly more likely to have also met the good level of development bar (over 90 per cent do so). This is shown for each of the years 2012, 2013 and 2014 in the graph below.
Figure 14: Percentage of pupils achieving good level of development for each EYFSP score (converted to FSP total)
0
20
40
60
80
100
2014
2013
2012
1201008050
EYFSP total (converted to FSP scale)
Perc
enta
ge o
f pup
ils a
ttai
ning
go
od le
vel o
f dev
elop
men
t
Applying the 92-point benchmark to the post-2012 EYFSP results (converted to FSP scores), there is a close correlation with the proportion who achieved a good level of development: the FFT measure finds that there is generally 1 per cent more children above the threshold than the Department for Education published data).
Appendix 2: Comparing FSP and EYFSP data
36
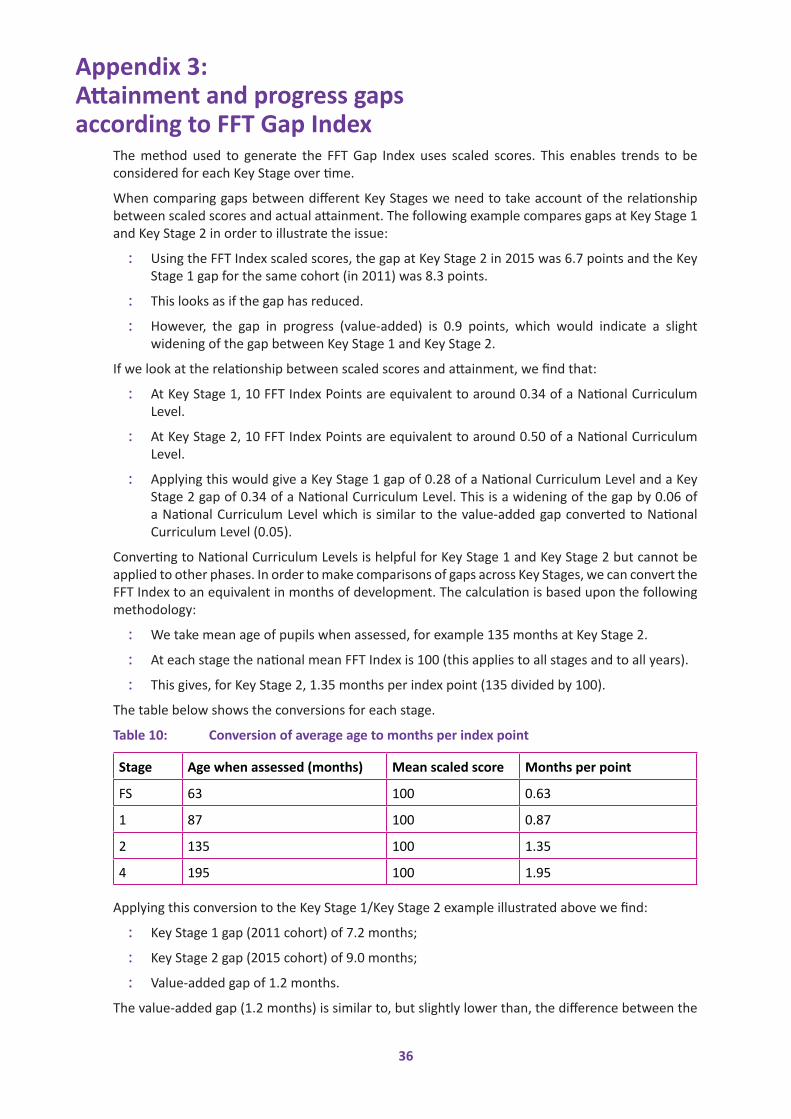
The method used to generate the FFT Gap Index uses scaled scores. This enables trends to be considered for each Key Stage over time.
When comparing gaps between different Key Stages we need to take account of the relationship between scaled scores and actual attainment. The following example compares gaps at Key Stage 1 and Key Stage 2 in order to illustrate the issue:
: Using the FFT Index scaled scores, the gap at Key Stage 2 in 2015 was 6.7 points and the Key Stage 1 gap for the same cohort (in 2011) was 8.3 points.
: This looks as if the gap has reduced.
: However, the gap in progress (value-added) is 0.9 points, which would indicate a slight widening of the gap between Key Stage 1 and Key Stage 2.
If we look at the relationship between scaled scores and attainment, we find that:
: At Key Stage 1, 10 FFT Index Points are equivalent to around 0.34 of a National Curriculum Level.
: At Key Stage 2, 10 FFT Index Points are equivalent to around 0.50 of a National Curriculum Level.
: Applying this would give a Key Stage 1 gap of 0.28 of a National Curriculum Level and a Key Stage 2 gap of 0.34 of a National Curriculum Level. This is a widening of the gap by 0.06 of a National Curriculum Level which is similar to the value-added gap converted to National Curriculum Level (0.05).
Converting to National Curriculum Levels is helpful for Key Stage 1 and Key Stage 2 but cannot be applied to other phases. In order to make comparisons of gaps across Key Stages, we can convert the FFT Index to an equivalent in months of development. The calculation is based upon the following methodology:
: We take mean age of pupils when assessed, for example 135 months at Key Stage 2.
: At each stage the national mean FFT Index is 100 (this applies to all stages and to all years).
: This gives, for Key Stage 2, 1.35 months per index point (135 divided by 100).
The table below shows the conversions for each stage.
Table 10: Conversion of average age to months per index point
Stage Age when assessed (months) Mean scaled score Months per point
FS 63 100 0.63
1 87 100 0.87
2 135 100 1.35
4 195 100 1.95
Applying this conversion to the Key Stage 1/Key Stage 2 example illustrated above we find:
: Key Stage 1 gap (2011 cohort) of 7.2 months;
: Key Stage 2 gap (2015 cohort) of 9.0 months;
: Value-added gap of 1.2 months.
The value-added gap (1.2 months) is similar to, but slightly lower than, the difference between the
Appendix 3: Attainment and progress gaps according to FFT Gap Index

37
Key Stage 1 and Key Stage 2 gaps (1.8 months). This is likely to be caused by a number of factors including:
: The Pupil Premium cohort changes over time – there are around 6 per cent of pupils who eligible for Pupil Premium at Key Stage 2 but not at Key Stage 1.
: The underlying distribution of attainment scores varies between stages. This could be addressed (to some extent) by normalising the underlying data but this would be complex and would cause other issues such as the attainment interval between each index point varying across the range of scores.
Conversion to months provides, therefore, a simple methodology which enables gaps to be compared across Key Stages and, in particular, the changes in the gap as each cohort moves through each stage.
The tables below show the gaps between disadvantaged and non-disadvantaged pupils in overall attainment and in progress for recent years in the Early Years Foundation Stage Profile and at Key Stage 1, Key Stage 2 and Key Stage 4. For each educational stage, the first table shows the gaps according to the FFT Gap Index scaled scores and the second table represents these gaps according to months of development.
Early Years Foundation Stage Profile26
Tables 11 and 12: Overall attainment gap in Early Years Foundation Stage Profile according to FFT Gap Index scaled scores and converted to months of development27
Overall attainment gap
(FFT Gap Index – scaled scores)Year Not PP PP Gap2007 101.8 93.3 8.52008 101.7 93.5 8.22009 101.8 93.6 8.12010 101.8 93.9 7.92011 101.8 94.2 7.62012 101.8 94.1 7.72013 101.7 94.4 7.32014 101.6 94.3 7.32015 101.4 94.2 7.2
26 Priortotheacademicyear2012-13,assessmentwasdoneaccordingtotheFoundationStageProfile,ratherthantheEarlyYearsFoundationStageProfile.
27 PleasenotethatinthesetablesPPstandsforPupilPremium.
Overall attainment gap
(FFT Gap Index – months)Year Not PP PP Gap2007 64.1 58.8 5.42008 64.1 58.9 5.22009 64.1 59.0 5.12010 64.1 59.2 5.02011 64.1 59.3 4.82012 64.1 59.3 4.92013 64.1 59.5 4.62014 64.0 59.4 4.62015 63.9 59.3 4.5

38
Key Stage 128
Table 13: Overall attainment and progress gaps at Key Stage 1 according to FFT Gap Index scaled scores
Overall attainment gap (FFT Gap Index – scaled scores)
Progress gap (FFT Gap Index – scaled scores)
Percentage of overall attainment gap due
to progress
Year Not PP PP Gap Not PP PP Gap 2009 102.4 93.6 8.8 100.6 98 2.7 30%2010 102.4 93.9 8.5 100.6 98 2.6 31%2011 102.4 94.1 8.3 100.6 98.2 2.5 30%2012 102.4 94.5 7.9 100.6 98.4 2.2 28%2013 102.4 94.7 7.8 100.6 98.4 2.2 28%2014 102.4 94.8 7.5 100.5 98.5 2.0 26%2015 102.2 95.1 7.1 100.6 98.2 2.5 35%
Table 14: Overall attainment and progress gaps at Key Stage 1 according to FFT Gap Index converted to months of development
Overall attainment gap (FFT Gap Index - months)
Progress gap (FFT Gap Index - months)
Percentage of overall attainment gap due
to progress
Year Not PP PP Gap Not PP PP Gap 2009 89.1 81.4 7.7 87.5 85.3 2.3 30%2010 89.1 81.7 7.4 87.5 85.3 2.3 31%2011 89.1 81.9 7.2 87.5 85.4 2.1 30%2012 89.1 82.2 6.9 87.5 85.6 1.9 28%2013 89.1 82.4 6.8 87.5 85.6 1.9 28%2014 89.1 82.5 6.5 87.4 85.7 1.7 26%2015 88.9 82.7 6.2 87.5 85.4 2.1 35%
28 TheprogressgapatKeyStage1in2015appearstobeoutoflinewiththetrendinpreviousyears.Thismaybeduetoearlierchangesinassessmentatage5,withtheEYFSPintroducedtoreplacetheFSPin2012-13.The2015KeyStage1cohortwasthefirsttobeassessedundertheEYFSPatage5.OnceKeyStage1dataisavailableforasecondcohortwhichhasalsocompletedtheEYFSP(the2016KeyStage1cohort)itwillbepossibletoassesstheextenttowhichthischangeinassessmentatage5isinfluencingtrendsintheKeyStage1progressgap.

39
Key Stage 2
Table 15: Overall attainment and progress gaps at Key Stage 2 according to FFT Gap Index scaled scores
Overall attainment gap (FFT Gap Index – scaled scores)
Progress gap (FFT Gap Index – scaled scores)
Percentage of over-all attainment gap
due to progress
Year Not PP PP Gap Not PP PP Gap 2006 102.9 93.3 9.6 100.5 98.6 1.9 19%2007 102.9 93.8 9.1 100.4 98.9 1.5 17%2008 102.8 94.2 8.6 100.4 99 1.4 16%2009 102.7 94.4 8.3 100.4 99 1.3 16%2010 102.7 94.8 8.0 100.3 99.2 1.1 13%2011 102.7 94.6 8.1 100.3 99.2 1.1 13%2012 102.7 95.3 7.5 100.3 99.4 0.9 12%2013 102.8 95.5 7.4 100.3 99.4 0.8 11%2014 102.9 95.7 7.2 100.3 99.3 0.9 13%2015 102.8 96 6.7 100.3 99.4 0.9 13%
Table 16: Overall attainment and progress gaps at Key Stage 2 according to FFT Gap Index converted to months of development
Overall attainment gap (FFT Gap Index - months)
Progress gap (FFT Gap Index - months)
Percentage of over-all attainment gap
due to progress
Year Not PP PP Gap Not PP PP Gap 2006 138.9 126.0 13.0 135.7 133.1 2.5 19%2007 138.9 126.6 12.3 135.5 133.5 2.1 17%2008 138.8 127.2 11.6 135.5 133.7 1.9 16%2009 138.6 127.4 11.2 135.5 133.7 1.8 16%2010 138.6 128.0 10.8 135.4 133.9 1.4 13%2011 138.6 127.7 10.9 135.4 133.9 1.4 13%2012 138.6 128.7 10.1 135.4 134.2 1.2 12%2013 138.8 128.9 10.0 135.4 134.2 1.1 11%2014 138.9 129.2 9.7 135.4 134.1 1.3 13%2015 138.8 129.6 9.0 135.4 134.2 1.2 13%

40
Key Stage 4
The tables below show overall attainment and progress gaps in average score (points per subject entry) across Attainment 8 from 2010-11 onwards. The Attainment 8 scores used to calculate these gaps were obtained by using the 1-8 Attainment 8 scale which will be in operation in 2016.
Table 17: Overall attainment and progress gaps at Key Stage 4 according to FFT Gap Index scaled scores
Overall attainment gap (FFT Gap Index – scaled Scores)
Progress gap (FFT Gap Index – scaled scores)
Percentage of overall attainment gap due
to progress
Year Not PP PP Gap Not PP PP Gap 2011 102.6 91.6 11.0 100.9 97.1 3.9 35%2012 102.6 92.1 10.5 100.9 97.2 3.7 35%2013 102.7 92.5 10.2 100.9 97.4 3.6 35%2014 102.6 92.5 10.1 101 97.3 3.7 36%2015 102.7 92.5 10.2 101.1 97.1 4.0 39%
Table 18: Overall attainment and progress gaps at Key Stage 4 according to FFT Gap Index converted to months of development
Overall attainment gap (FFT Gap Index - months)
Progress gap (FFT Gap Index - months)
Percentage of overall attainment gap due
to progress
Year Not PP PP Gap Not PP PP Gap 2011 200.1 178.6 21.5 196.8 189.3 7.5 35%2012 200.1 179.6 20.5 196.8 189.5 7.1 35%2013 200.3 180.4 19.9 196.8 189.9 6.9 35%2014 200.1 180.4 19.7 197.0 189.7 7.2 36%2015 200.3 180.4 19.9 197.1 189.3 7.8 39%