education funding report - new · pdf filereason for this education funding report ......
TRANSCRIPT

‐1-
EducationFundingReport
February 23, 2012
Submitted by
Christopher D. Cerf
Acting Commissioner

‐2-
Table of Contents
Reason for This Education Funding Report ................................................................................ 4
Introduction ................................................................................................................................ 5
PART I: NEW JERSEY'S PERSISTENT ACHIEVEMENT GAP .......................................... 10
A. New Jersey's Successes Are Overshadowed by a Large and Persistent Gap between High-
and Low-Performing Schools ................................................................................................ 10
B. New Jersey's Public Schools Are among the Best Funded in the Nation ......................... 12
C. Despite New Jersey's Sustained Financial Investment in its Public Schools, New Jersey's
Economically Disadvantaged Students Continue to Underperform ...................................... 19
D. High Levels of Funding Are not Sufficient for High Performance .................................. 23
PART II: ESSENTIAL POLICY REFORMS .......................................................................... 28
A. Introduction ...................................................................................................................... 28
B. Organizational Changes .................................................................................................... 29
C. The Work .......................................................................................................................... 32
1. Educator Effectiveness ................................................................................................... 33
2. Teachers Must Have the Tools to Succeed ..................................................................... 38
3. Rich Data Reports as a Basis for Powerful Interventions in Failing Schools ................ 41
4. Aggressive, Comprehensive Interventions in Persistently Failing Schools ................... 45
D. Conclusion ........................................................................................................................ 48
PART III: FUNDING REFORMS ........................................................................................... 50
A. A Brief Primer on the SFRA ............................................................................................ 51
B. Proposed Changes to the SFRA Funding Formula ........................................................... 55
1. Returning to the Weights Originally Established by the Professional
Judgment Panels ................................................................................................................... 56
2. Reducing Adjustment Aid for Districts at or Above "Adequacy" ................................... 57
3. Moving from a Single Count Day to Average Daily Attendance .................................... 58
4. Developing an Alternative to Participation in the Free and Reduced Price Lunch
Program ................................................................................................................................. 60

‐3-
5. Conclusion ...................................................................................................................... 61
C. Innovation Fund ................................................................................................................ 61
1. Size of the Innovation Fund …………………………………………………………….62
2. Eligibility and Requests for Funding ……………………………………………….......62
3. Complement Identified Departmental Priorities .............................................................. 63
4. Developing, Validation, or Scale-Up .............................................................................. 63
5. Key Stakeholder Collaboration and Resource Commitment ........................................... 64
6. Evaluation and Dissemination ......................................................................................... 64
PART IV: CONCLUSION ....................................................................................................... 65
APPENDIX ............................................................................................................................... 67
A. Base Per-Pupil Amount .................................................................................................... 67
B. Preschool Per-Pupil Amount............................................................................................. 69
C. Weights for Grade Level, County Vocational School Districts, At-Risk Pupils, Bilingual
Pupils, and Combination Pupils............................................................................................. 70
1. Grade Level Weight ......................................................................................................... 70
2. County Vocational School District Weight ..................................................................... 71
3. At-Risk Weight ................................................................................................................ 71
4. Bilingual Weight.............................................................................................................. 72
5. At-Risk and Bilingual Weight (Combination Students) .................................................. 72
D. Cost Coefficients for Security Aid and Transportation Aid ............................................. 73
1. Security Aid ..................................................................................................................... 73
2. Transportation Aid ........................................................................................................... 73
E. State Average Classification Rate for General Education Services Pupils and for Speech-
Only Pupils ............................................................................................................................ 74
F. The Excess Cost for General Special Education Services Pupils and for Speech-Only
Pupils ..................................................................................................................................... 75
G. Extraordinary Special Education Aid Thresholds ............................................................ 75
ATTACHMENT A ................................................................................................................... 77
ATTACHMENT B .................................................................................................................... 78

‐4-
REASON FOR THIS EDUCATION FUNDING REPORT
To inform his Fiscal Year 2013 Budget Address, the Governor directed the
Commissioner of Education to review New Jersey’s school funding formula and recommend
ways to improve it. The result is this Education Funding Report, which seeks to both make the
distribution of State education dollars more equitable and use those dollars smarter, namely to
incent meaningful reforms at the district- and school-level.
But in drafting this Report, the Department of Education quickly realized that a focus on
education funding alone was too narrow. Indeed, to focus on funding alone was to fall into the
same trap that has ensnared New Jersey’s courts, the Legislature, and past governors for far too
long – that education funding can and should be considered in isolation from essential policy
reforms. In the pages that follow, the Commissioner advances a simple but powerful idea: if
New Jersey is ever to conquer its shameful and persistent achievement gap, then education
funding must be considered alongside essential policy reforms or, in the preferred language of
this Report, the “how much” and the “how well” must be considered in tandem.
The Department, of course, is acutely aware of the existence of school and non-school
factors that influence the success of a child’s life trajectory. Hence, the reforms proposed,
inclusive of those already underway through the creation of the State’s Regional Achievement
Centers, attempt to cover a range of topics from community and parental engagement to teacher
training and professional development. Some of what is proposed in this Education Funding
Report will meet with little controversy, some much, but all of the reforms are necessary. The
Department of Education encourages the Governor and the Legislature to act upon each of the
reforms; the Department stands ready to assist.i

‐5-
INTRODUCTION
Some forty years ago, at the time of Robinson v. Cahill, New Jersey’s public education
system was afflicted by two glaring inequities: (1) public schools relied heavily – indeed, almost
exclusively – on local property taxes for funding, with the result that property-rich districts
dramatically outspent property-poor districts on a per-pupil basis; and (2) economically
advantaged students dramatically out-achieved their less affluent peers. It was simply assumed
that the latter was a direct consequence of the former. So, economically disadvantaged districts
sought redress from the courts, first in the form of Robinson v. Cahill and later in the more
familiar guise of Abbott v. Burke. Theirs was a logical argument: close the spending gap and the
achievement gap will follow. Their argument won in the courts, but not in the classroom.
In 1973, at the time of the Robinson decision, the average per-pupil expenditure in the
former-Abbott districts was nearly $7,000 (measured in 2010 dollars).ii By 2010, the average
per-pupil expenditure in those districts had nearly tripled to $18,850, or $3,200 more than the
State average (excluding the former-Abbotts) and $3,100 more than the State’s wealthiest
districts. But despite “adequate” (some might argue, more than adequate) funding, the
achievement gap between economically advantaged and disadvantaged students persists and, in
some instances, has widened. For example, in 2011, 76% of economically advantaged third
through eighth grade students scored proficient on the Language Arts Literacy portion of the
New Jersey Assessment of Skills and Knowledge; only 45% of economically disadvantaged third
through eighth grade students scored the same. More troublingly, the Language Arts Literacy
gap in proficiency rates has increased by 5 percentage points since 2005, from 26% to 31%.

‐6-
The story is not much better on the mathematics portion of the New Jersey Assessment of Skills
and Knowledge. Since 2005, the gap between economically advantaged and disadvantaged
students has remained relatively constant at 24% to 25%.iii
0
20
40
60
80
100
2005 2006 2007 2008 2009 2010 2011
% P
rofi
cien
t an
d A
bov
e, N
J A
SK
LAL Proficiency Gap between Economically Advantaged and
Disadvantaged Students Has Widened
Advantaged
Disadvantaged
3126
0
20
40
60
80
100
2005 2006 2007 2008 2009 2010 2011
% P
rofi
cien
t an
d A
bov
e, N
J A
SK
Mathematics Proficiency Gap between Economically Advantaged and
Disadvantaged Students Has Remained Constant
Advantaged
Disadvantaged
2425
‐7-
Likewise, on the 2011 administration of the National Assessment of Educational Progress, New
Jersey ranked 50th out of 51 states (including Washington, D.C.) in the size of the achievement
gap between high- and low-income students in eighth grade reading.
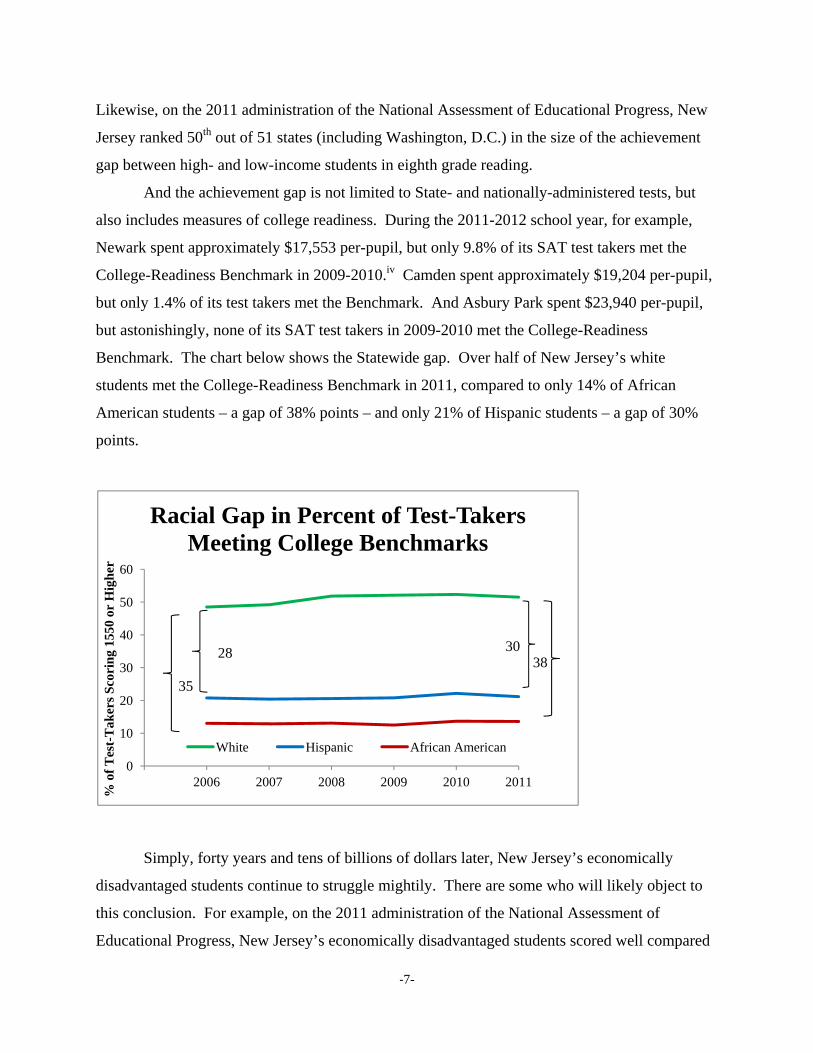
And the achievement gap is not limited to State- and nationally-administered tests, but
also includes measures of college readiness. During the 2011-2012 school year, for example,
Newark spent approximately $17,553 per-pupil, but only 9.8% of its SAT test takers met the
College-Readiness Benchmark in 2009-2010.iv Camden spent approximately $19,204 per-pupil,
but only 1.4% of its test takers met the Benchmark. And Asbury Park spent $23,940 per-pupil,
but astonishingly, none of its SAT test takers in 2009-2010 met the College-Readiness
Benchmark. The chart below shows the Statewide gap. Over half of New Jersey’s white
students met the College-Readiness Benchmark in 2011, compared to only 14% of African
American students – a gap of 38% points – and only 21% of Hispanic students – a gap of 30%
points.
Simply, forty years and tens of billions of dollars later, New Jersey’s economically
disadvantaged students continue to struggle mightily. There are some who will likely object to
this conclusion. For example, on the 2011 administration of the National Assessment of
Educational Progress, New Jersey’s economically disadvantaged students scored well compared
0
10
20
30
40
50
60
2006 2007 2008 2009 2010 2011
% o
f T
est-
Tak
ers
Sco
rin
g 15
50 o
r H
igh
er
Racial Gap in Percent of Test-Takers Meeting College Benchmarks
White Hispanic African American
35
2838
30
‐8-
to their peers in other states – ranking 14th nationally among economically disadvantaged
students in fourth and eighth grade reading, for example. But measuring New Jersey’s poor
students against poor students in other states is not the appropriate benchmark. New Jersey’s
disadvantaged students can and should be achieving at the same levels as their economically
advantaged peers. That was the original intent of Abbott, and that is what the Department, as this
Education Funding Report explains, believes we can achieve.
In writing this Report, the Department began with a single question: Why has New
Jersey’s achievement gap proven so resistant to the combination of Robinson, Abbott, and tens of
billions of dollars? The Department quickly found the answer: New Jersey courts, the
Legislature, and past Governors only got it half-right. They took an inarguable proposition –
namely, that a school must have sufficient dollars to succeed – and twisted it into the wrong-
headed notion that dollars alone equal success. In ignoring the issue of how money is spent, the
courts, Legislature, and past Governors ignored a proposition equally basic – how well education
dollars are spent matters. Through this Education Funding Report, the Department attempts to
unite the how well with the how much.
Though a report with “education” and “funding” in its title is, perhaps, destined for
controversy, there is much in this Education Funding Report that should win widespread, if not
universal, support. First, just as the Robinson and Abbott courts before it, the Report affirms that
the New Jersey Department of Education’s highest priority is closing the achievement gap so that
all students are prepared for college and career. As both the Governor and the Commissioner
have repeatedly stated, birth circumstances must not be allowed to determine educational destiny
in New Jersey. But until more than a combined 11.2% of students in Newark, Camden, and
Asbury Park graduate from high school meeting the College-Readiness Benchmark, zip code
will continue to do just that.
Second, the Report embraces the central holding of Robinson and Abbott that a school
must have sufficient dollars to succeed. It also accepts that urban districts, typically with smaller
local tax bases and higher concentrations of at-risk and Limited English Proficient students, must
receive more State aid than their suburban counterparts, generally with larger local tax bases and
fewer high-needs students.
Where the Report breaks with the past, however, is in its insistence that how well
education dollars are spent is equally important as how many education dollars are spent. Rather
‐9-
than focusing on dollars alone, the Report pairs funding with essential policy reforms designed
to, among other things, improve teacher talent, use data more effectively to identify and design
differentiated interventions for failing schools and students, and aggressively deploy
Departmental resources to drastically improve persistently underperforming schools. If this
proposition – that funding and policy reforms are intertwined and that every education dollar
must be spent efficiently and effectively and with the singular purpose of closing the
achievement gap – proves controversial, then the Department of Education welcomes the
controversy.
The Report is divided into three parts. Part I provides detailed, historical funding and
student achievement data to show that while Robinson and Abbott were successful in bridging
the spending gap, they failed to close the achievement gap. Part II provides a description of
essential policy reforms that must be enacted if education dollars are to be spent effectively and
the achievement gap closed. It is the “how well.” Part III proposes changes to the School
Funding Reform Act funding formula and full funding of that revised formula over five years. It
is the “how much.” As well, Part III recommends creation of a new pot of State education aid –
an Innovation Fund – to be used both to reward successful districts and schools and fund district-
and school-initiated reforms designed to close the achievement gap.

‐10-
PART I – NEW JERSEY’S PERSISTENT ACHIEVEMENT GAP
A. NEW JERSEY’S SUCCESSES ARE OVERSHADOWED BY A LARGE AND PERSISTENT GAP
BETWEEN HIGH- AND LOW-PERFORMING SCHOOLS.
New Jersey consistently ranks among the nation’s highest spenders on public elementary
and secondary education. According to the National Center for Education Statistics, New Jersey
ranked 3rd among states in school expenditures per student in 2008, spending more than 60%
above the U.S. average. This followed decades of growth in spending per student, which more
than doubled in inflation-adjusted terms since 1973. Only a portion of this differential can be
explained by New Jersey’s relatively high wages and cost of living: even when adjusting for
regional cost differences, the State’s ranking is largely unchanged.v
The State also boasts some of the highest average test scores in the nation. As measured
by the National Assessment of Educational Progress (NAEP), commonly known as the “Nation’s
Report Card,” New Jersey ranked 2nd in fourth and eighth grade reading, 3rd in eighth grade
mathematics, and 4th in fourth grade mathematics in 2011. On the 2007 writing assessment, New
Jersey’s eighth graders scored higher than those in any other state, and since 2003, New Jersey
has seen its NAEP performance in reading and mathematics improve at a rate faster than the
national average.
Yet despite its many successes, New Jersey is far from ensuring that all of its students
receive a high-quality education. On the 2011 NAEP, for example, the State ranked 50th out of
51 states (including Washington D.C.) in the achievement gap between high- and low-income
students in eighth grade reading. In 2010, only 36% of fourth graders in the State’s most
disadvantaged districts tested at the “proficient” level or better on the State reading assessment,
23 percentage points below the State average and 45 points behind the State’s most advantaged
school districts. While the fraction of New Jersey’s economically disadvantaged students who
score at the “basic” level or higher on the NAEP is higher than the U.S. average and improving,
it is clear that far too many of our children are performing below a level required to meet life’s
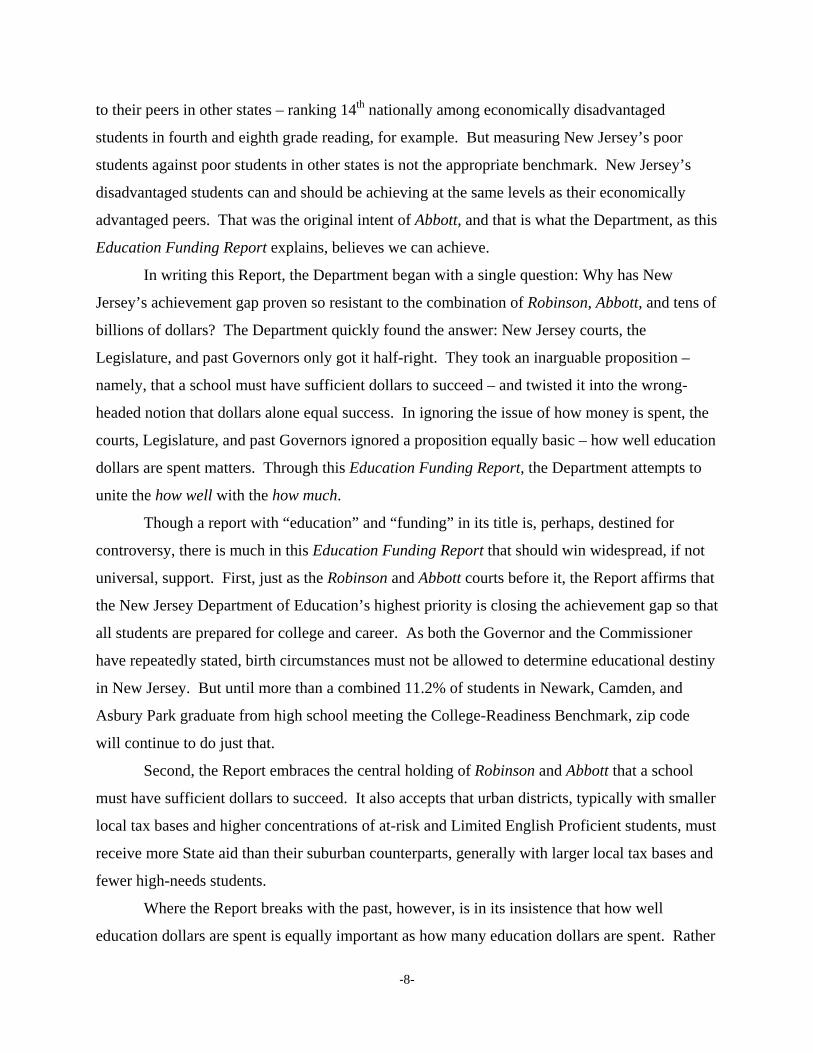
challenges and opportunities. See Figure 1.1.
‐11-
Figure 1.1: Percent of Fourth and Eighth Graders Scoring “Basic” or above in Reading
and Mathematics
Grade 4
Grade 8
These statistics are unsettling in light of New Jersey’s sustained targeting of financial
resources to low-wealth, high-needs school districts. Since 1991, per-pupil spending rose an
average of 2.8% per year in the 31 former-Abbott districts, as compared to 1.8% Statewide. By
2010, the former-Abbotts were spending an average of $18,850 per student, or $3,200 more than
‐12-
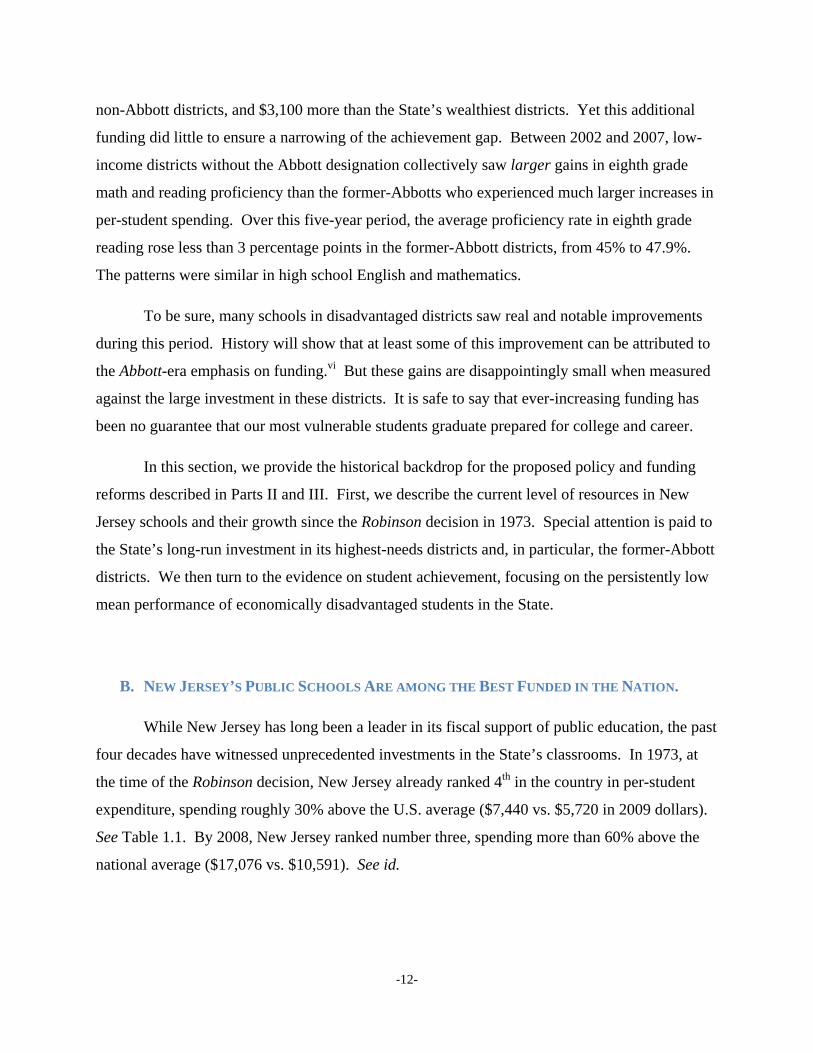
non-Abbott districts, and $3,100 more than the State’s wealthiest districts. Yet this additional
funding did little to ensure a narrowing of the achievement gap. Between 2002 and 2007, low-
income districts without the Abbott designation collectively saw larger gains in eighth grade
math and reading proficiency than the former-Abbotts who experienced much larger increases in
per-student spending. Over this five-year period, the average proficiency rate in eighth grade
reading rose less than 3 percentage points in the former-Abbott districts, from 45% to 47.9%.
The patterns were similar in high school English and mathematics.
To be sure, many schools in disadvantaged districts saw real and notable improvements
during this period. History will show that at least some of this improvement can be attributed to
the Abbott-era emphasis on funding.vi But these gains are disappointingly small when measured
against the large investment in these districts. It is safe to say that ever-increasing funding has
been no guarantee that our most vulnerable students graduate prepared for college and career.
In this section, we provide the historical backdrop for the proposed policy and funding
reforms described in Parts II and III. First, we describe the current level of resources in New
Jersey schools and their growth since the Robinson decision in 1973. Special attention is paid to
the State’s long-run investment in its highest-needs districts and, in particular, the former-Abbott
districts. We then turn to the evidence on student achievement, focusing on the persistently low
mean performance of economically disadvantaged students in the State.
B. NEW JERSEY’S PUBLIC SCHOOLS ARE AMONG THE BEST FUNDED IN THE NATION.
While New Jersey has long been a leader in its fiscal support of public education, the past
four decades have witnessed unprecedented investments in the State’s classrooms. In 1973, at
the time of the Robinson decision, New Jersey already ranked 4th in the country in per-student
expenditure, spending roughly 30% above the U.S. average ($7,440 vs. $5,720 in 2009 dollars).
See Table 1.1. By 2008, New Jersey ranked number three, spending more than 60% above the
national average ($17,076 vs. $10,591). See id.
‐13-
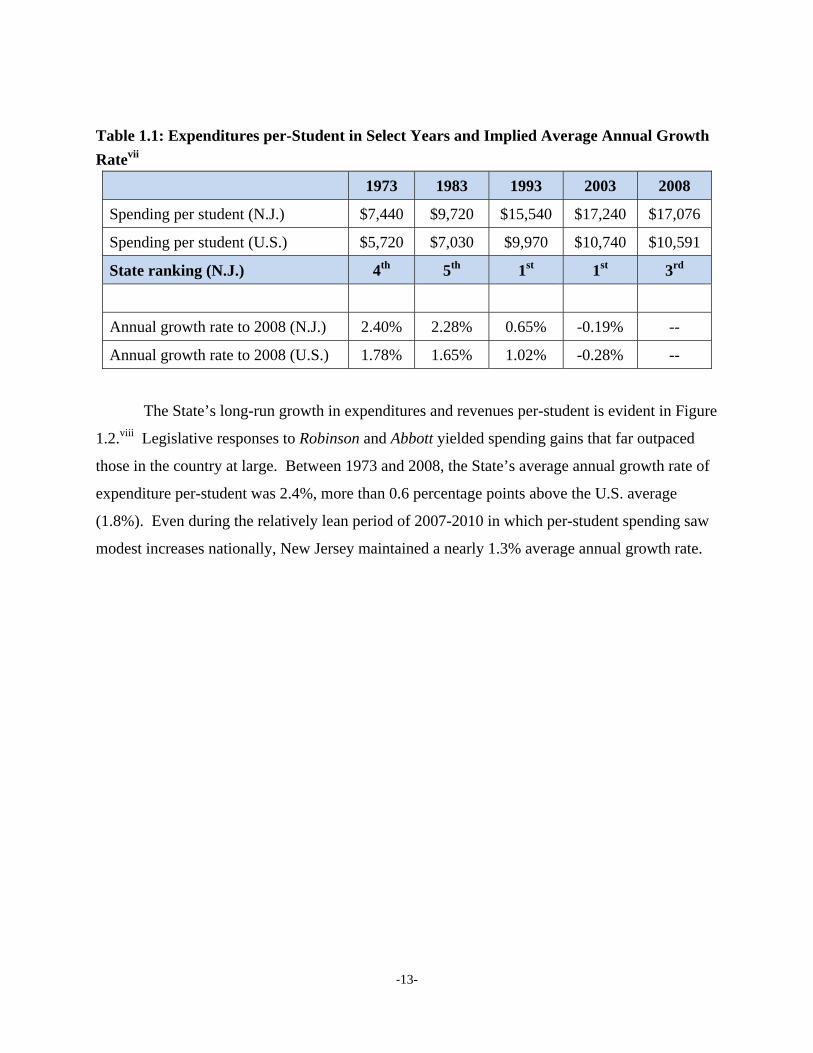
Table 1.1: Expenditures per-Student in Select Years and Implied Average Annual Growth
Ratevii
1973 1983 1993 2003 2008
Spending per student (N.J.) $7,440 $9,720 $15,540 $17,240 $17,076
Spending per student (U.S.) $5,720 $7,030 $9,970 $10,740 $10,591
State ranking (N.J.) 4th 5th 1st 1st 3rd
Annual growth rate to 2008 (N.J.) 2.40% 2.28% 0.65% -0.19% --
Annual growth rate to 2008 (U.S.) 1.78% 1.65% 1.02% -0.28% --
The State’s long-run growth in expenditures and revenues per-student is evident in Figure
1.2.viii Legislative responses to Robinson and Abbott yielded spending gains that far outpaced
those in the country at large. Between 1973 and 2008, the State’s average annual growth rate of
expenditure per-student was 2.4%, more than 0.6 percentage points above the U.S. average
(1.8%). Even during the relatively lean period of 2007-2010 in which per-student spending saw
modest increases nationally, New Jersey maintained a nearly 1.3% average annual growth rate.

‐14-
Figure 1.2: Expenditures and Revenues per-Student, N.J. and U.S., 1970-2007ix
Of course, taken alone, dollars can obscure differences in real resources, and New
Jersey’s high wages and cost of living drive up the minimum salaries required to hire quality
teachers. But the State also fares well when looking at its student-teacher ratio, a “real” measure
of resource intensity. Although not the same as average class size, this measure captures the
State’s overall commitment of human resources to its classrooms. As shown in Figure 1.3, in
2008-2009, New Jersey had the fourth smallest student-teacher ratio in the U.S. (12.0),
substantially lower than the ratio observed nationally (15.3). Since 1970, the student-teacher
ratio has fallen about 9.2 students in New Jersey, or 43%, a decline greater than that seen
nationwide. See Table 1.2.
NJ
US
Robinson Abbott (I) Abbott (III and V)50
0010
000
1500
020
000
expe
nditu
res
or r
even
ues
per
pupi
l ($2
009)
1970 1975 1980 1985 1990 1995 2000 2005
current expenditures per pupil (NJ) local, federal, and state revenues per pupil (NJ)
current expenditures per pupil (US)

‐15-
Figure 1.3: Students per FTE Teacher by State, 2008-09x
Table 1.2: Students per Teacher in Select Yearsxi
1970 1979 1989 1999 2008
Students per teacher (N.J.) 21.2 16.7 13.5 13.4 12.0
Students per teacher (U.S.) 23.5 19.1 17.2 16.1 15.3
State ranking (N.J.) 16th 10th 3rd 5th 4th
State averages mask the even more substantial investment that has occurred in the State’s
poorest districts. Since Robinson, New Jersey’s aid formulas have aggressively targeted
financial resources to its low-wealth, high-needs school districts and, in particular, the 31 former-
Abbott districts. Consequently, spending has risen much faster in the State’s neediest districts
than in the State as a whole. Figure 1.4 shows the growth in expenditures per-pupil from 1989 to
2012 in the former-Abbott districts and for eight groups of districts or DFGs, a State designation
of district wealth ranging from the poorest (“A”) to wealthiest (“J”) districts (the last two years in
this figure are budgeted amounts).xii Since 1991, spending has risen an average of 2.8% per year
in the former-Abbott districts, as compared to 1.8% Statewide. See Table 1.3. By 2010, the
former-Abbott districts were spending an average of $18,850 per-student, or $3,200 more than
non-Abbott districts and $3,100 more than the State’s wealthiest districts (DFG “J”). Today, 5 of
the 20 highest-spending districts in New Jersey with an enrollment of 500 or more are former-
03
69
1215
1821
24Pu
pils
per
teac
her
Ver
mon
tN
orth
Dak
ota
Con
nect
icut
New
Jer
sey
Mai
neW
yom
ing
New
Yor
kN
ew H
amps
hire
Rho
de I
slan
dA
rkan
sas
Dis
tric
t of
Col
umbi
aK
ansa
sM
isso
uri
Iow
aN
orth
Car
olin
aM
assa
chus
etts
Sout
h D
akot
aP
enns
ylva
nia
Okl
ahom
aG
eorg
iaW
est V
irgin
iaF
lorid
aM
aryl
and
Sout
h C
arol
ina
Neb
rask
aN
ew M
exic
oT
exas
Wis
cons
inM
issi
ssip
piM
onta
naT
enne
ssee
Del
awar
eU
nite
d St
ates
Ken
tuck
yA
laba
ma
Illin
ois
Min
neso
taH
awai
iO
hio
Ala
ska
Lou
isia
naIn
dian
aC
olor
ado
Virg
inia
Mic
higa
nId
aho
Was
hing
ton
Ore
gon
Nev
ada
Ariz
ona
Cal
iforn
iaU
tah

‐16-
Abbott districts, and two former-Abbott districts are represented among the five highest-
spending districts in the country: Asbury Park (2nd) and Hoboken (5th).xiii In fiscal year 2013, an
estimated $4.4 billion of a total of $7.7 billion (56.3%) in State aid will go to the 31 former-
Abbott districts (which represent just over 5% of New Jersey’s nearly 600 districts).
Figure 1.4: Real Expenditures per-Pupil in N.J. School Districts by District Factor Group
Table 1.3: Real Expenditures per-Pupil by District Factor Group and former-Abbott
Designation and Implied Annual Growth Ratexiv
Spending per-pupil 1991 2000 2010 Average Annual
Growth Rate
All N.J. districts $11,612 $12,854 $16,328 1.81%
Former-Abbott districts $11,054 $14,595 $18,847 2.85%
DFG A $10,978 $14,613 $18,834 2.88%
DFG B $10,992 $12,897 $17,016 2.33%
DFG CD $10,704 $11,782 $15,219 1.87%
Bud
gete
d
1000
012
000
1400
016
000
1800
0E
xpen
ditu
res
per
pupi
l ($2
009)
1992 1994 1996 1998 2000 2002 2004 2006 2008 2010 2012Y e a r
A B CD DE FG
GH I J Abbott

‐17-
DFG DE $11,300 $11,960 $14,911 1.47%
DFG I $12,710 $12,569 $15,699 1.12%
DFG J $13,420 $13,112 $15,562 0.78%
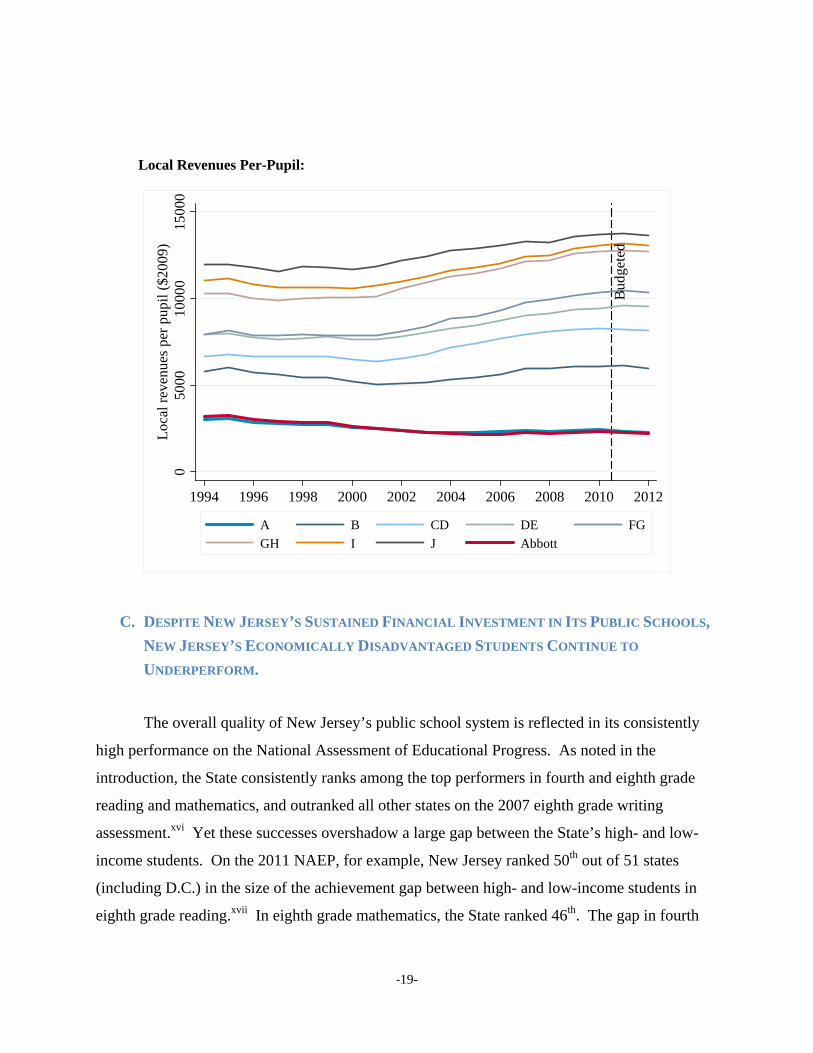
Finally, virtually all of the expenditure growth in the State’s low-income and former-
Abbott districts has been driven by State aid, as opposed to local revenues. Figure 1.5 shows the
change in real State and local revenues per-pupil by DFG and for the former-Abbott districts
between 1994 and 2012 (the last two years in this figure are budgeted amounts). In DFG “A”
and former-Abbott districts, State revenues per-pupil rose 21.4% and 24.9% respectively during
this period (or 46.4% and 49.5% to 2009; State aid declined after 2009). This compares with
14.7% for non-Abbott districts and 11.8% for middle-income “DE” districts (33.6% and 31.4%
to 2009, respectively). The local contribution per student actually declined in inflation-adjusted
dollars in the former-Abbott districts, from $3,170 in 1994 to $2,297 in 2010. In contrast, non-
Abbott districts raised 24.2% more locally per student in 2010 than in 1994.

‐18-
Figure 1.5: State and Local Revenues per-Pupil in N.J. School Districts by District Factor
Group, 1994-2012xv
State Revenues Per-Pupil:
* For FY2012, the budgeted amounts do not fully reflect the more than $700 million in
additional revenue (compared to FY2011) appropriated for school aid, after many districts
had prepared their budgets.
Bud
gete
d
050
0010
000
1500
0S
tate
rev
enue
s pe
r pu
pil (
$200
9)
1994 1996 1998 2000 2002 2004 2006 2008 2010 2012Y e a r
A B CD DE FG
GH I J Abbott
‐19-
Local Revenues Per-Pupil:
C. DESPITE NEW JERSEY’S SUSTAINED FINANCIAL INVESTMENT IN ITS PUBLIC SCHOOLS,
NEW JERSEY’S ECONOMICALLY DISADVANTAGED STUDENTS CONTINUE TO
UNDERPERFORM.
The overall quality of New Jersey’s public school system is reflected in its consistently
high performance on the National Assessment of Educational Progress. As noted in the
introduction, the State consistently ranks among the top performers in fourth and eighth grade
reading and mathematics, and outranked all other states on the 2007 eighth grade writing
assessment.xvi Yet these successes overshadow a large gap between the State’s high- and low-
income students. On the 2011 NAEP, for example, New Jersey ranked 50th out of 51 states
(including D.C.) in the size of the achievement gap between high- and low-income students in
eighth grade reading.xvii In eighth grade mathematics, the State ranked 46th. The gap in fourth
Bud
gete
d
050
0010
000
1500
0L
ocal
rev
enue
s pe
r pu
pil (
$200
9)
1994 1996 1998 2000 2002 2004 2006 2008 2010 2012Y e a r
A B CD DE FG
GH I J Abbott
‐20-
grade reading and mathematics was not much smaller, where the State ranked 22nd and 41st,
respectively.
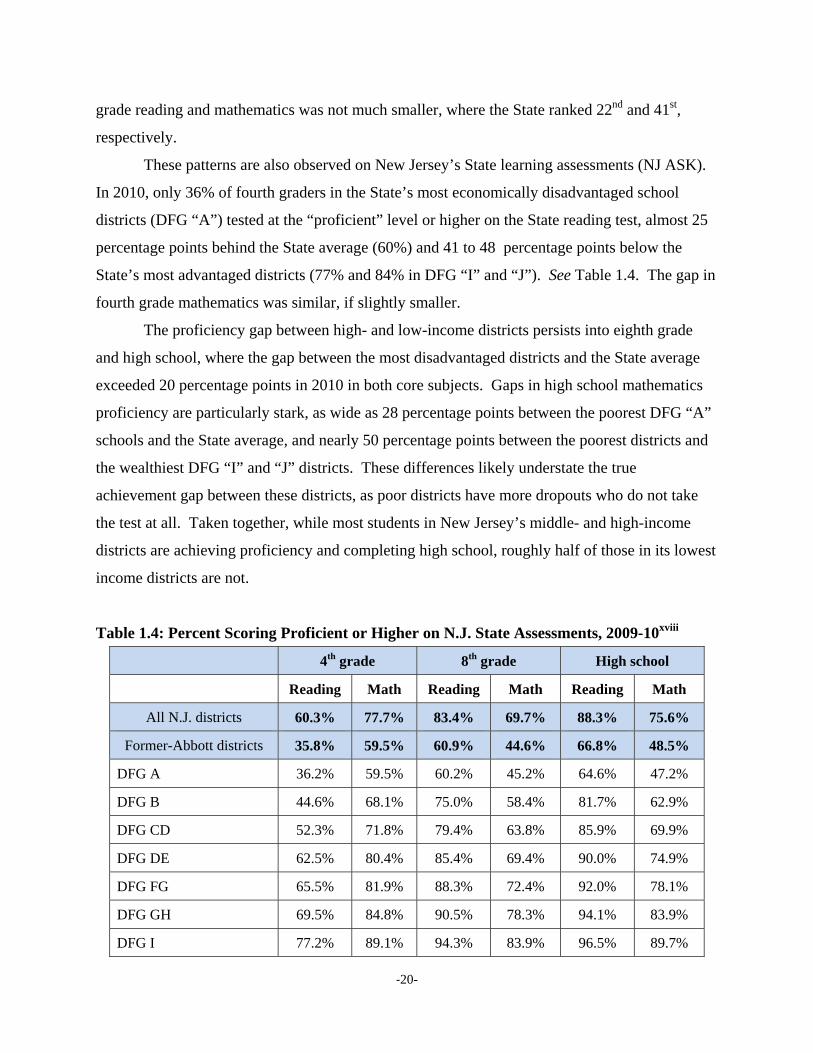
These patterns are also observed on New Jersey’s State learning assessments (NJ ASK).
In 2010, only 36% of fourth graders in the State’s most economically disadvantaged school
districts (DFG “A”) tested at the “proficient” level or higher on the State reading test, almost 25
percentage points behind the State average (60%) and 41 to 48 percentage points below the
State’s most advantaged districts (77% and 84% in DFG “I” and “J”). See Table 1.4. The gap in
fourth grade mathematics was similar, if slightly smaller.
The proficiency gap between high- and low-income districts persists into eighth grade
and high school, where the gap between the most disadvantaged districts and the State average
exceeded 20 percentage points in 2010 in both core subjects. Gaps in high school mathematics
proficiency are particularly stark, as wide as 28 percentage points between the poorest DFG “A”
schools and the State average, and nearly 50 percentage points between the poorest districts and
the wealthiest DFG “I” and “J” districts. These differences likely understate the true
achievement gap between these districts, as poor districts have more dropouts who do not take
the test at all. Taken together, while most students in New Jersey’s middle- and high-income
districts are achieving proficiency and completing high school, roughly half of those in its lowest
income districts are not.
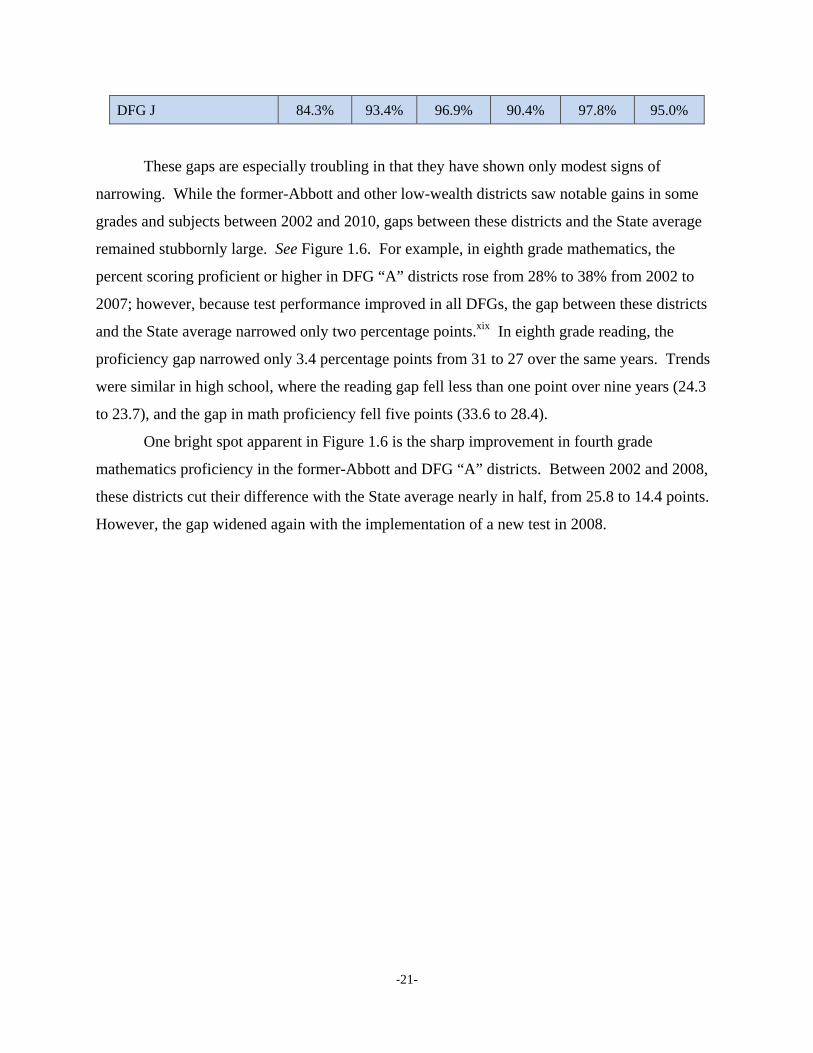
Table 1.4: Percent Scoring Proficient or Higher on N.J. State Assessments, 2009-10xviii
4th grade 8th grade High school
Reading Math Reading Math Reading Math
All N.J. districts 60.3% 77.7% 83.4% 69.7% 88.3% 75.6%
Former-Abbott districts 35.8% 59.5% 60.9% 44.6% 66.8% 48.5%
DFG A 36.2% 59.5% 60.2% 45.2% 64.6% 47.2%
DFG B 44.6% 68.1% 75.0% 58.4% 81.7% 62.9%
DFG CD 52.3% 71.8% 79.4% 63.8% 85.9% 69.9%
DFG DE 62.5% 80.4% 85.4% 69.4% 90.0% 74.9%
DFG FG 65.5% 81.9% 88.3% 72.4% 92.0% 78.1%
DFG GH 69.5% 84.8% 90.5% 78.3% 94.1% 83.9%
DFG I 77.2% 89.1% 94.3% 83.9% 96.5% 89.7%
‐21-
DFG J 84.3% 93.4% 96.9% 90.4% 97.8% 95.0%
These gaps are especially troubling in that they have shown only modest signs of
narrowing. While the former-Abbott and other low-wealth districts saw notable gains in some
grades and subjects between 2002 and 2010, gaps between these districts and the State average
remained stubbornly large. See Figure 1.6. For example, in eighth grade mathematics, the
percent scoring proficient or higher in DFG “A” districts rose from 28% to 38% from 2002 to
2007; however, because test performance improved in all DFGs, the gap between these districts
and the State average narrowed only two percentage points.xix In eighth grade reading, the
proficiency gap narrowed only 3.4 percentage points from 31 to 27 over the same years. Trends
were similar in high school, where the reading gap fell less than one point over nine years (24.3
to 23.7), and the gap in math proficiency fell five points (33.6 to 28.4).
One bright spot apparent in Figure 1.6 is the sharp improvement in fourth grade
mathematics proficiency in the former-Abbott and DFG “A” districts. Between 2002 and 2008,
these districts cut their difference with the State average nearly in half, from 25.8 to 14.4 points.
However, the gap widened again with the implementation of a new test in 2008.

‐22-
Figure 1.6: Trends in Reading and Mathematics Proficiency by DFG Group, 2002-2010xx
Grade 4 Reading:
Grade 4 Mathematics:
Grade 8 Reading:
High School Reading:
Grade 8 Mathematics:
High School Mathematics:

‐23-
D. HIGH LEVELS OF FUNDING ARE NOT SUFFICIENT FOR HIGH PERFORMANCE.
While gains made in New Jersey’s most disadvantaged schools cannot be discounted, the
above analysis underscores the following point: taken alone, funding parity between the former-
Abbott districts and the State’s wealthiest districts – the goal of the Robinson and Abbott lawsuits
– is insufficient to ensure that all students receive a high-quality education and are prepared for
college and career. This is apparent when measuring districts’ achievement gains over time
against their growth in per-student spending.
Figure 1.7 uses a scatter diagram to show this relationship for the State’s DFG low-
income “A” and “B” school districts. Each point is a school district, with the former-Abbott
districts represented by circles and other non-Abbott economically disadvantaged districts
represented by triangles. The vertical axis shows the growth over time in the percentage of
students testing at proficient or higher, while the horizontal axis is the change in real expenditure
per-student. Though these districts differ along other dimensions than just their income level and
spending growth, as a group, they represent the State’s most economically disadvantaged
districts.
Figure 1.7 demonstrates that the relationship between per-pupil spending growth and
proficiency gains is weak in New Jersey. For comparable levels of expenditure growth – take
most any point along the horizontal axis – there is wide variation in achievement gains on the
vertical axis. On the whole, there appears to be little to no relationship between spending gains
and achievement growth among these low-income districts. In fact, in some instances, districts
with the largest percent increases in per-student spending made the slowest progress.
To highlight a few examples from these figures, consider districts that saw their
expenditure per-student rise 15 to 25% between 2002 and 2007. Some of these districts – such
as Vineland City and Middle Township – raised their proficiency rate in eighth grade
mathematics by 17 or more percentage points. Others, such as Orange City and Trenton, saw
strong gains of 14-15 percentage points, while still others saw gains of less than 10 points.
Plainfield, Paterson, and Newark experienced gains of 5 to 8 percentage points, below the State
average for eighth grade mathematics. Spending in Camden rose 17% over this period, but its
proficiency rate declined by 1 point. At the high school level, some of the former-Abbott
districts with large increases in per-pupil spending also saw large gains in mathematics

‐24-
proficiency (e.g., Newark, Elizabeth, and Union City). Others such as Camden, Paterson,
Linden, and Asbury Park saw no change or a decline in their proficiency rate.
It is easy to identify districts in these figures that saw substantial gains in reading and
mathematics proficiency with more modest gains in spending. For example, some large and
midsized districts without the Abbott designation (such as Kearny, Linden, Middle Township,
and Roselle) saw gains in eighth grade mathematics that far surpassed those of the higher
spending former-Abbott districts. In high school English, districts making the largest gains in
proficiency tended to be those with slower growth in per-pupil expenditure.
Figure 1.7: Relationship between Proficiency Gains and per-Pupil Expenditure Growth,
DFG “A” and “B” Districts

‐25-
Grade 8 Reading, 2002 - 2007:
Grade 8 Mathematics, 2002 – 2007:
Newark
Jersey CityPaterson
ElizabethUnion City
-40
-20
020
40C
hang
e in
per
cent
pro
fici
ent o
r hi
gher
-10 0 10 20 30 40 50 60 70Percent change in expenditures per pupil
Abbott A Abbott B NonAbbott A NonAbbott B
NewarkJersey CityPaterson
Elizabeth
Camden
-20
020
40C
hang
e in
per
cent
pro
fici
ent o
r hi
gher
-10 0 10 20 30 40 50 60 70Percent change in expenditures per pupil
Abbott A Abbott B NonAbbott A NonAbbott B

‐26-
High school English 2002 – 2010:
High school Mathematics 2002 – 2010:
Newark
Jersey City
Paterson
Elizabeth
Union City
-10
010
2030
Cha
nge
in p
rofi
cien
cy r
ate
0 10 20 30 40 50
Percent change in expenditures per pupil
Abbott A Abbott B NonAbbott A NonAbbott B
Newark
Jersey City
Paterson
Elizabeth
Union City
Camden
-20
-10
010
2030
Cha
nge
in p
rofi
cien
cy r
ate
0 10 20 30 40 50Percent change in expenditures per pupil
Abbott A Abbott B NonAbbott A NonAbbott B
‐27-
While the above analysis is not sufficient to say whether new spending has had a positive
impact on student achievement, it makes clear that financial resources are not the only – and
perhaps not even the most important – driver of achievement. On the one hand, we observe
economically disadvantaged districts that perform at a level higher than that of their counterparts,
but at a substantially lower cost per-student. On the other hand, some of the highest-spending
districts made almost no progress closing the achievement gap with the rest of the State. After
decades of evidence, it is clear that money alone is not the solution to the persistent and
unacceptably low performance in our State’s neediest districts. In addition to assuring our
districts and schools have sufficient resources, we must ensure those resources are put to good
use. We must discover what works from our most successful districts, and what does not from
those that fail. A coherent strategy for the education of our State’s children requires both
sufficient resources and sound educational policy.

‐28-
PART II – ESSENTIAL POLICY REFORMS
A. INTRODUCTION
As reflected in the figures, charts, and graphs in Part I, the legacy of Robinson and Abbott
is disappointing. While we may take some measure of comfort that urban and suburban
education spending has been equalized, we must be clear: equalization is a means, not an end.
That is, equalization is only as valuable as the student achievement results it begets.
Unfortunately, the State’s achievement gap remains, and our most disadvantaged students
continue to lag far behind. As importantly, the courts’ intensive focus on money distracted
policymakers and the public from a simple, albeit essential point: how much you spend cannot
be considered in isolation from the context in which it is spent and how targeted that spending is
on reforms that actually make a difference in student learning.
To give one example, investing millions in reducing class size or adding teacher aides
while ignoring State law that requires districts to preserve the jobs of demonstrably ineffective
teachers and dismiss superior ones will not yield a different result for students. The research
could not be clearer that great teachers are more important to learning outcomes than class size.
To go one step further, we would have done more to preserve the true purposes of Abbott –
reducing the achievement gap – by enjoining laws that actually inhibit student achievement than
by merely demanding higher and higher spending.
Before the nation had access to mountains of research showing that school spending and
student achievement are not well correlated, it was widely assumed that increasing the former
would automatically lead to growth in the latter.xxi The logic, though impossible to support
empirically, is at least straightforward: high-performing districts are generally affluent; low-
performing districts are often impoverished; lift spending in low-income districts, and they will
begin performing like high-income districts.
This faulty logic burrowed its way into the minds of advocates and eventually the courts
during the Robinson and Abbott arguments. The courts were likely further persuaded to focus on
money for another, more pragmatic reason: increasing spending is an easy and more or less
administrable solution that falls within courts’ competence to enforce. With insufficient district
budgets defined as the problem and more spending defined as the remedy, the courts could
declare, “mission accomplished” by the simple act of increasing funding.
‐29-
In contrast, addressing via policy and practice the longstanding, systemic dysfunctions of
failing districts and schools is a far harder task – a task that the elected branches are better
positioned to design and implement. To be sure, reasonable funding levels are a necessary
condition for success. As Part I demonstrates, by any objective measure, New Jersey has long
since passed that threshold. Changing the way that money is spent, however, is by far the most
important means of actually changing the behavior of schools and school systems. If we are to
have a meaningful and lasting influence on student learning, we must engage in the challenging
work of setting new policy priorities, changing laws and regulations, altering classroom practices
and district contracts, raising expectations, and much more. If we want to ensure that all students
succeed, we need to start pursuing a slate of bold reforms and stop chasing the promised, but
mythical, funding formula that will solve our educational woes.
What follows is a discussion of several reforms needed to finally close our achievement
gap and help ensure that all students graduate from high school prepared for college and career.
The proposed changes in policies and practices are not intended to be all-inclusive. Rather they
are offered to illustrate a basic point: if we are to close the shameful achievement gap in this
State – that is, if we are actually to fulfill the true purpose of the Abbott litigation – there are
critical steps that we can take now to achieve that end. Unless we think about funding levels as
merely one element of a comprehensive reform strategy, we will continue to fail our most
disadvantaged children.
B. ORGANIZATIONAL CHANGES
No amount of money will achieve the core objectives of the Abbott litigation if the
State’s resources, focus, and organizational capacities are not aligned with the goal of
accomplishing those same ends. That work begins at the Department of Education itself, which
has redefined its mission as ensuring that all children, regardless of life circumstances, graduate
from high school ready for college and career. To achieve that goal, the Department has
transformed the way it is organized, how it works with struggling schools, how it engages with
districts, and much more.
‐30-
Specifically the Department has restructured around four levers of reform – levers that
the Department believes are essential to substantial and lasting improvement, especially for our
poorest performing schools and students. They include:
Academics: Ensuring all schools adhere to challenging content standards,
administer rigorous assessments specifically tied to college and career readiness,
and have access to high-quality curricula and instructional supports;
Performance: Overseeing a unified academic accountability system that
accurately measures school and district performance and triggers high-impact,
tailored interventions and supports at the student, class, school, and district levels;
Talent: Ensuring that all New Jersey educators are effective by improving
policies and practices related to recruitment, preparation, evaluation,
compensation, development, retention, and recognition; and
Innovation: Identifying, recruiting, incubating, and supporting diverse, high-
quality delivery systems for K-12 education, especially in our persistently lowest-
performing school communities.
Each building block has its own division, and each division is led by an experienced executive
with expert staff.
The Department has also completely changed how it supports struggling schools. For too
long, the Department’s “school improvement” work was uncoordinated at best and incoherent at
worst. Though many good people were doing good work, the Department’s goals were
undefined, progress was not measured, too many schools continued in a state of
underperformance, and the Department’s various projects and initiatives seemed completely
untethered from one another.
To solve these problems, the Department is building a new system of seven field-based
Regional Achievement Centers (RACs), which are charged with driving improvement in New
Jersey’s lowest-performing schools. These offices will be led by master educators who will be
held accountable for student achievement gains in their regions. They will be staffed by over
one hundred professionals, whose efforts will be coordinated and aligned around a single
objective: elevating the academic performance of our lowest-performing schools and students.
The Department is also changing what it means to be a State department of education.
The Department is de-emphasizing its traditional role as a compliance monitor and transitioning

‐31-
into a performance-based organization and high-quality service provider. Through a survey of
the State’s district superintendents, the Department learned that those on the ground saw too little
value coming from the Department’s central office when it comes to what matters most:
improving student learning. The Department was adept at sending directives and requiring
reports, but did far too little to actually help educators advance academic achievement.
This philosophical shift can be seen in practice in numerous ways. For example, the four
new reform divisions were designed not around federal programs, State funding streams, or
hoary practices, but around the activities and services most likely to help improve student
learning. Similarly, the new RACs will not be a wagging finger; they will be a helping hand.
Instead of being charged with a wide array of compliance and monitoring functions, the RACs
will focus exclusively on helping schools improve.
The Department has also adopted a new way to engage with schools and districts. Rather
than a scattershot approach of limited, piecemeal programs aimed across the entire State, the
Department will focus its scarce resources on those schools in a perpetual state of
underperformance and those with the most troubling achievement gaps. This change in focus is
reflected in New Jersey’s waiver from the federal No Child Left Behind Act. Now, rather than
identifying more than 1,000 schools a year as needing improvement and crafting interventions in
each, the State will have a fairer and more nuanced approach to assessing schools and a more
tailored set of interventions for those truly in need. It is also prepared to employ its full array of
powers to require transformational interventions (such as changes in staff or leadership) and even
close or replace failing schools that continue to elude efforts to transform them.
Undergirding this reprioritization is a critically important shift in the State’s philosophy.
For nearly 20 years, New Jersey has sought to improve low-performing schools primarily by
working through districts. The State has taken over several districts, embedded State monitors in
others, and created complex systems for assessing district capacity. In too many instances, these
tactics alone have not transformed our most persistently under-achieving schools. We believe
that though district-level interventions have value, the unit of change must be the school. As
such, most of our new activities associated with our most troubled schools will be directed at the
level of the school. That is, instead of investing more resources toward school boards and central
bureaucracies, we will focus on teachers and principals and the students they serve. Along these
lines, the Department will also spend more time recognizing and learning from our highest-

‐32-
performing schools, including finding ways to give them greater autonomy as they continue to
excel.
In total, then, the Department has sought to build an environment in which reform and
improvement can thrive. We have set the highest expectations for students, reorganized the
Department so the most important work can be undertaken, fundamentally altered our posture
toward districts, and changed our approach to intervening in the most persistently
underperforming schools. It is in this context that our priorities should be viewed.
C. THE WORK
For decades now, in the minds of New Jersey’s public and policymakers, “Abbott” and
“funding” have gone hand-in-hand. While dollars certainly dominated these decisions, it is
essential to remember that money itself is not the ultimate goal. The courts were not invited into
education policymaking because funding, in and of itself, is a public good. In fact, the heart of
the matter, the true core of this issue, is not even district improvement, per se. The genesis and
continuation of these cases is rooted in the fate of low-income boys and girls. They were not
getting a quality education, and therefore they were not getting a fair shake in life.
It is far more than semantics to draw a distinction between money, districts, and students
because the starting point of this conversation will determine the path forward. That the courts
quickly settled and have remained fixed on money is unquestionable. But if we remain focused
on the ultimate goal – closing the State’s achievement gap – money need not be our only, or even
our primary focus.
That is, our guiding question should not just be, “How much money is needed?” although
there is no doubt that we must fund our schools at appropriately high levels. The right question
instead is, “What integrated strategies of funding reforms, substantive interventions, and legal
changes must be accomplished to improve the life chances of students in our most persistently
underperforming schools?” At their core, these policies, practices, and changes in the legal
environment in which schools operate must directly impact what decades of research and
educators across New Jersey already know matters most in school reform – improving the
quality of teaching and learning in our classrooms. These reforms have four interrelated
components:

‐33-
Develop policies that enable districts to recruit, prepare, evaluate, compensate, develop,
retain and recognize outstanding educators, and eliminate legal and contractual
restrictions that impede schools from assuring a highly effective teacher in every
classroom;
Provide educators with the tools they need to be successful by setting high standards for
what students should know and be able to do, developing model curriculum to support
educators as they teach those standards, and providing real time feedback through
formative assessments so teachers can modify their work and differentiate instruction in
real time;
Provide rich data reports to identify how well schools are meeting their mission of
improving student outcomes, to identify specific areas for improvement, and to trigger
differentiated interventions at the State level such as mandated curriculum and human
capital practices; and
Intervene in schools that do not create an environment conducive to high-quality teaching
and learning by providing support through Regional Achievement Centers, requiring
targeted turnaround strategies, and aggressively using existing authority to close or
replace schools with new management and teachers if they do not improve within two
academic cycles.
1. EDUCATOR EFFECTIVENESS
No in-school factor is more important to closing the achievement gap than the
effectiveness of the men and women teaching in our classrooms and leading our schools. To
ensure the success of all of New Jersey’s students, we must attract and retain the nation’s best
educators through an array of activities associated with recruitment, preparation, certification,
evaluation, development, and more.
A substantial body of research now demonstrates the impact that high-quality educators
can have, not only on the current achievement of students, but also on their futures. One study
found that a highly effective teacher can move students ahead by a year and a half during a single
school year, while an ineffective teacher only generates a half-year of learning gains.xxii Great
teachers can dramatically improve the educational outcomes of students from even the most

‐34-
disadvantaged backgrounds. Having a highly effective teacher for three to five years can erase
the deficits that the typical disadvantaged student brings to school.xxiii Evidence from the Harlem
Children’s Zone provides a similar demonstration of the power of schools to close the black-
white achievement gap existing in New York.xxiv
Students with effective teachers learn substantially more than students with weaker
teachers, and those learning gains have positive long-term implications for students’ life
success.xxv Early elementary school teachers greatly affect students’ learning paths, and the
impact persists such that years later, when these students enter the labor market, they earn higher
wages. A recent study estimates that students earn 3.5 percent more per year, if they had an
above-average (75th percentile) teacher in kindergarten than if they had had a below-average
(25th percentile) teacher.xxvi Put another way, the study estimates that a standout kindergarten
teacher is worth approximately $320,000 a year – the present value of the additional money that
a full class of students can expect to earn over their careers. Douglas Staiger, a Dartmouth
economist who studies education said of the study, “The worry has been that education didn’t
translate into earnings . . . but this is telling us that it does.”xxvii
If New Jersey is to close the achievement gap – the core purpose of Abbott – the State
must do everything in its power to attract and support the best teachers. It must also responsibly
evaluate them as a basis for targeted professional development and removal. To refuse to do so,
while intoning soaring clichés about “putting children first,” is more than just dishonest. It is a
formula for indiscriminate spending that cannot possibly yield the return we need and that our
disadvantaged students deserve.
In any profession, whether doctors, engineers, architects or lawyers, there is a natural
variation among levels of effectiveness. Not surprisingly, research could not be clearer that the
same is true for the teaching profession. Yet across the nation and in our State, evaluation
systems treat teachers like widgets, acting as though they are essentially interchangeable.xxviii
Virtually all are rated “satisfactory” and virtually none, once tenured, are at professional risk on
the basis of competence. A system that does not properly differentiate teachers’ levels of
effectiveness fails to recognize those excelling in the classroom, fails to identify those in the
greatest need of support, fails to direct the best teachers to the most struggling students, fails to
inform our most important personnel policies like tenure and compensation, and so much more.
That kind of system fails not only students but educators as well.
‐35-
A successful evaluation system assesses teachers regularly, uses student performance and
educator practice as components, clearly differentiates between varying levels of performance,
and informs everything from tenure and reduction in force decisions to compensation and
professional development.xxix Unfortunately, as U.S. Secretary of Education Arne Duncan
recently observed, “teacher evaluation today is largely broken and dysfunctional. No one can
say who the great teachers are, how teachers in the middle can improve, or which teachers should
be dismissed if they fail to improve, even after receiving help and support.”xxx
If implemented in a thoughtful and sophisticated way, the benefits of a strong evaluation
system are legion. For example, by using available technology, the results from teacher
observations can be collected and stored electronically, providing real-time feedback to teachers
and their administrators. Systems can automatically analyze these findings and integrate them
with student performance results and other data. This information can then serve as the
foundation for professional development offerings. Each educator’s strengths and weaknesses
can be identified, and he or she can be matched with the training or mentoring needed. If a
teacher’s students regularly struggle with reading comprehension, his department chair can team
him with a colleague strong in this area or target additional resources to support him. If a
teacher’s English language learners are falling behind, her principal can engage an experienced
coach. In these ways and many more, a high-quality evaluation system can quickly help improve
our teaching corps and therefore the achievement levels of New Jersey’s students.
A fair and effective evaluation system also enables us to assess and then improve our
recruitment and preparation strategies. The State can identify which institutions of higher
education produce the most effective teachers, including which programs are contributing the
teachers most successful in our highest need communities. We can then seek to learn from these
programs and expand them. We can also identify those with disappointing results and intervene
accordingly.
Effective evaluations also enable the State to use its authority over certification and
licensing in more targeted ways. By setting a high bar for entry into the profession, the State can
ensure that only the most promising individuals have the opportunity to teach and lead schools.
By setting an even higher bar for continuation, the State can ensure that only successful
educators stay in the profession. The right sets of rules will take into account input
considerations, such as an educator’s training, as well as her results, namely her ability to
‐36-
improve student achievement. This work of carefully regulating the teaching and leading
professions can have a profoundly positive influence on New Jersey’s schools.
The goal of assuring an effective educator in every classroom does not end with creating
a fair, learning-centered, and rigorous evaluation system. If New Jersey is to achieve the
ultimate goal of Abbott – equal educational outcomes for all – several significant policy barriers
must also be removed. Again, it is simply not reasonable or ultimately effective to continue to
invest in our disadvantaged schools at these extraordinary levels while disregarding the
embarrassing reality that New Jersey has actually codified practices that inhibit our collective
ability to ensure that every student has a top-flight teacher in front of his/her class. If the
ultimate goal is to graduate all children from high school ready for college and career, a rational
observer must fairly ask why the urgent demands for additional funds are not accompanied by an
equally strong insistence that we reform laws that demonstrably prevent us from meeting that
goal.
The State’s antiquated tenure law is one of the biggest obstacles. It gives teachers, after
only three years of service, virtual job security until retirement. Shockingly, a teacher can earn
tenure without proof that his students are learning, and a teacher can retain tenure despite
evidence that his students are not learning. It should come as no surprise that a number of New
Jersey superintendents have been openly and harshly critical of this law.
To be sure, a teacher’s tenure can be revoked, but the process is so byzantine, so time-
consuming, and so expensive that it is seldom pursued by districts. Every hour a superintendent
spends building a case to remove a tenured teacher is one less hour she can spend improving
student results. Perth Amboy’s superintendent put it bluntly:
Because of the current tenure process – one that can take as long as three years and cost
more than $100,000 in legal fees to remove a [single] teacher – I must engage in a rarely
successful process to remove these individuals. No district should have to bear that
burden. And most, as a result, do not challenge tenure. Even if we make our case
thoroughly and successfully, and a judge agrees to let me dismiss a teacher, he or she can
still appeal to the [C]ommissioner of Education, the state Board of Education, the
Superior Court of New Jersey and, potentially, the state Supreme Court.xxxi

‐37-
The numbers bear this out. Over the last ten years, districts have initiated only 404 tenure
proceedings, of which a mere 33 were pursued for reasons of incompetency or inefficiency. Of
those, only 21 resulted in the teacher’s tenure being revoked. There are approximately 94,218
tenured teachers in New Jersey. That means that over the past ten years, .00022% of tenured
teachers have been removed for incompetency or inefficiency. Whatever the number of teachers
in our highest-needs schools who are not up to the job of adequately serving their students – and
we should assume that it is low – it is certainly higher than .00022%. So long as we lack the
political will to address this issue, no amount of resources is likely to bring about the
improvements that these children deserve.
To be sure, providing schools with adequate funds to hire and retain sufficient qualified
instructional staff is critical. But to do so while turning a blind eye to structural barriers that
undermine the goal of consistent excellence in our classrooms severely compromises the
likelihood that these funds will yield the return on investment Abbott set out to achieve.
The infamous “last in, first out” rule provides another example of a law that directly
impedes the fundamental objective of maximizing learning for disadvantaged children. When a
district conducts a reduction in force, it must, by law, ignore considerations of teacher
effectiveness or quality to focus exclusively on years of service. A teacher with the fewest years
in the system is the first to be dismissed even if it is universally agreed that she is the superior
educator.
The consequences of this policy are stupefying. If we are serious about closing the
achievement gap – not just paying lip service to an abstract idea or throwing money at it
indiscriminately – how can we possibly justify dismissing a highly effective teacher simply
because she is junior to another teacher who is, nevertheless, among the district’s lowest-
performing? This is obviously an affront to children and families. It is also an affront to the
teaching profession, strongly signaling to the world that, in this line of work, we do not prize
those who excel at their craft.
Two other onerous practices also frustrate our efforts to improve teaching in New Jersey.
District collective bargaining agreements almost invariably require that teacher compensation be
based on years of experience and education credentials – two factors research tells us bear little
relationship to effectiveness (none in the case of credentials; and virtually none after the first five
years of experience).xxxii Accordingly, we cannot pay more to a highly effective teacher. We
‐38-
cannot pay more to a great teacher who chooses to work in a troubled school. We cannot pay
more to a great teacher who teaches in a high-need or “shortage” area, such as science or bi-
lingual special education. Again, if closing the achievement gap were truly our goal, how do we
justify the continuation of policies that inhibit its accomplishment? One must ask whether we
have pursued funding strategies as a balm to salve our consciences rather than address head on
the difficult policy and legal decisions that so clearly would help our children succeed.
In a similar vein, most collective bargaining agreements and district policies effectively
require “forced placements,” whereby a school board or superintendent places teachers in a
school against the wishes of that school’s leader, and often of the teacher himself. Teachers
usually have tenure in systems, not individual buildings. If no principal wants to hire a particular
teacher, the district must nonetheless pay his or her salary. The district’s only fiscally rational
response to these irrational rules is to place the teacher in a building whether or not it is a good
fit. This practice inhibits the ability of school leaders to build and maintain high-quality faculties
and develop a culture conducive to excellence. In every field, executives need the ability to
build teams with shared sets of values and aspirations. It is no different – and it may be even
more important – in education. How can we possibly hold school leaders accountable for student
achievement if they have no say in selecting their teachers? How is that in the best interest of
disadvantaged children?
There is no denying that the most important building block for educational improvement
is ensuring that the State’s corps of teachers and leaders is effective. Achieving that goal
requires action on many fronts – evaluation, recruitment, preparation, credentialing, tenure,
compensation, retention, placement, etc. While funding is of course an important part of the
equation, the policies and practices that provide the operational context in which those funds are
spent are easily as important, if not more so. If we are to fulfill the goal of a quality education
for all, we must turn our attention from what is easiest to administer to what matters most.
2. TEACHERS MUST HAVE THE TOOLS TO SUCCEED
To succeed, effective educators need access to appropriate instructional supports. Some
such tools do indeed cost money, as does the professional development teachers need to learn to
use them effectively. Such expenditures, however, will have little impact in advancing student

‐39-
learning in the absence of several critical conditions for success. Most importantly, teaching and
learning must be organized around a shared understanding about what students should know and
be able to do at critical life milestones in order to be on track to graduate from high school ready
for college and career.
While New Jersey has long endorsed such a “standards-based” approach, a significant –
some would argue, revolutionary – new development in those standards holds out great promise
for a steep increase in academic attainment, especially for our most disadvantaged students. The
newly-adopted Common Core State Standards, now endorsed by New Jersey and 45 other states,
provide clear and rigorous standards for learning at each grade level. Described as “fewer,
clearer, and higher” than their predecessors, they focus far more heavily on critical-thinking,
analytic and writing skills. But what makes them “revolutionary” is that they are structured as
sequential learning progressions that, when mastered, prepare a student for graduation and
beyond.
With a particular focus on supporting our most persistently failing schools, the State is
engaged in a comprehensive implementation initiative to assure that the Common Core standards
become what they are designed to be: the cornerstone of the classroom. By the fall of 2012, the
State will have developed and made available a number of instructional supports, most notably a
model curriculum with standards-aligned learning objectives and assessments. A Statewide
professional development campaign is already well underway, and top educators from across the
State are collaborating in the design and execution of instructional materials aligned with the
Common Core. Perhaps most significantly for this Report, our Regional Achievement Centers
are specifically charged with working with the State’s lowest performing schools to support
effective implementation of the new Common Core based curriculum.
While we must be clear about what is expected, and we must have instruction and
materials anchored to these expectations, we must also measure whether what was taught was
actually learned. New Jersey is on the governing board of a multi-state consortium, supported
with over $150 million in federal funds, that is developing “high stakes” tests aligned to the
Common Core to replace our existing testing regime. Such “summative” tests and the
accountability systems they inform are critically important. Because results come long after
students have moved to the next grade, however, they are unable to help teachers help students
along the way.
‐40-
That is why we are also targeting existing funds to assure that teachers in Title I schools
have a constant flow of “real time” information on student learning – data that is collected,
analyzed, and shared in a way that enables continuous improvement. The State will use its
newly won Race to the Top funds to help schools access such “formative” assessments and
instructional options needed to understand student progress throughout the school year – not just
at the end of the year when its often too late.
Aligned with this effort, the State is working with principals, teachers, superintendents
and other practitioners to develop systems that enable educators to use student-level data to
inform and differentiate instruction. This is a particular focus in failing schools. Whether
supported by “data coaches” or organized “professional learning communities,” effective schools
have a framework that connects standards, curriculum and formative assessment data to
instruction.
In addition to student-level data for informing and differentiating classroom instruction,
the Department is producing a variety of student reports focused on growth and college- and
career-readiness measures. For example, student-level, year-over-year growth scores in
language arts and mathematics, grades 4-8, will be available so schools and districts can analyze
student progress. The Department will also define, measure, and provide analysis to each school
so students who are at risk of not graduating from high school ready for college and career can
be identified early in their academic careers. Finally, to help schools and districts understand
whether their high school graduates are graduating college- and career-ready, the Department
will begin collecting course and grade-level information in the fall of 2012 to develop reports
that allow schools to measure their success for preparing students for post-secondary education,
including degrees earned in addition to college enrollment and attendance.
In short, providing teachers with curricular tools linked to high academic standards and
with student-level information to use them effectively is essential to the task of turning around
failing schools. To create conditions conducive to success, the Department is ensuring that such
schools embrace the new Common Core standards and their associated learning progressions.
Similarly, we are working with schools to deploy formative assessments and create instructional
infrastructure to ensure more effective interventions for struggling students.

‐41-
3. RICH DATA REPORTS AS A BASIS FOR POWERFUL INTERVENTIONS IN FAILING
SCHOOLS
As described in greater detail in New Jersey’s successful application for a waiver from
the federal No Child Left Behind act, the Department has adopted new and more effective school
accountability metrics as a predicate for aggressive interventions in schools that are showing
persistently poor results for disadvantaged children. New Jersey cannot identify failing schools
and meaningfully target resources to them without data: specifically, data on graduation rates,
results of State- and nationally administered examinations, and trends in college readiness
metrics to name a few. More generally, accurate and timely data help policymakers,
superintendents, principals, and others to keep track of how funding is spent, its impact on
student achievement, and, therefore, progress on closing the achievement gap. Data-driven
evaluation of educational strategies helps direct resources to the most effective uses and avoids
expenditures that are not yielding their desired returns. In short, New Jersey’s most challenged
schools will not improve unless there is a serious and regular evaluation effort that is built into
decision-making from the beginning.
A robust, Statewide data infrastructure provides researchers and policymakers with
macro-longitudinal information on students as they progress through school and allows for the
evaluation of educational initiatives, such as charter schools. The best of these systems, now in
place among leading states, includes a unique student identifier that allows decision-makers to
link student records across schools, districts, and higher education institutions; they also allow
decision-makers to link students to information about teachers and principals.
New Jersey’s statewide data warehouse – New Jersey Standards Measurement and
Resource for Teaching (NJ SMART) – is moving aggressively to become a critical tool for
driving change. NJ SMART will soon have the capacity to collect student-level transcript data,
including courses taken and grades earned. This important collection will also establish the link
between teacher and student, so that student outcomes can be tracked back to districts, schools
and classrooms. And to a far greater extent than ever before, the State will make available to the
public critical, readily comprehensible data on the performance of schools and districts. From
new measures of student progress to sophisticated “peer school” comparisons, the State will
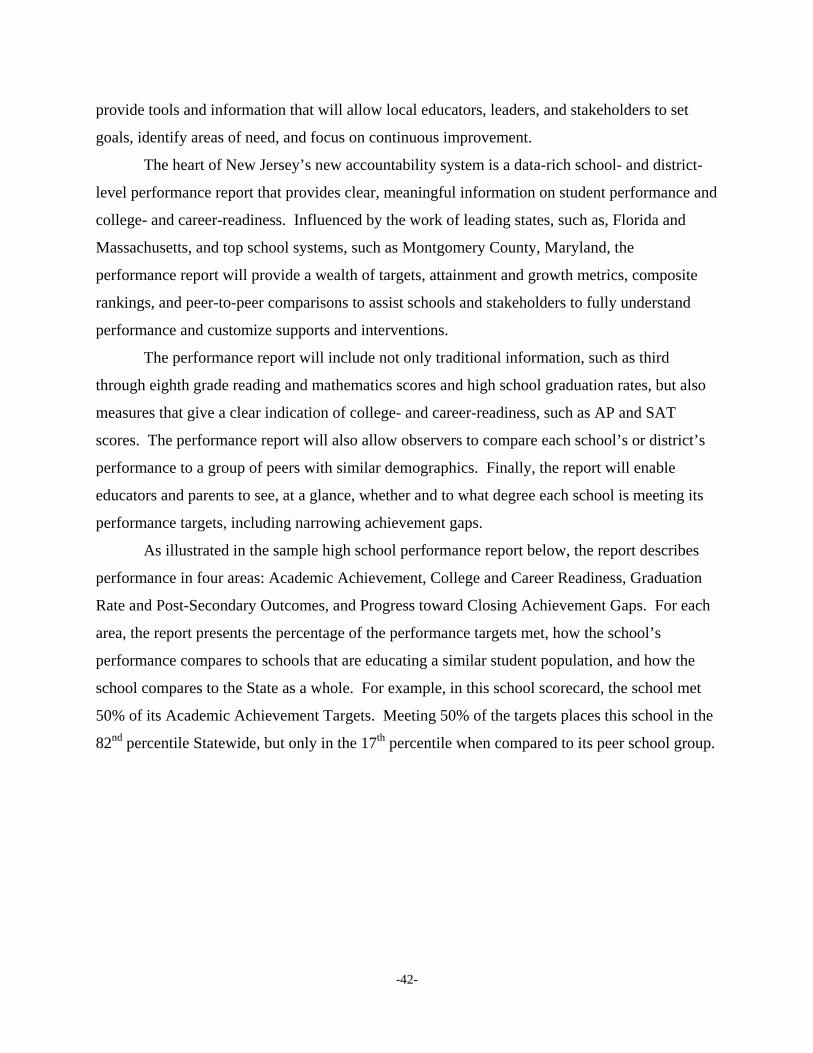
‐42-
provide tools and information that will allow local educators, leaders, and stakeholders to set
goals, identify areas of need, and focus on continuous improvement.
The heart of New Jersey’s new accountability system is a data-rich school- and district-
level performance report that provides clear, meaningful information on student performance and
college- and career-readiness. Influenced by the work of leading states, such as, Florida and
Massachusetts, and top school systems, such as Montgomery County, Maryland, the
performance report will provide a wealth of targets, attainment and growth metrics, composite
rankings, and peer-to-peer comparisons to assist schools and stakeholders to fully understand
performance and customize supports and interventions.
The performance report will include not only traditional information, such as third
through eighth grade reading and mathematics scores and high school graduation rates, but also
measures that give a clear indication of college- and career-readiness, such as AP and SAT
scores. The performance report will also allow observers to compare each school’s or district’s
performance to a group of peers with similar demographics. Finally, the report will enable
educators and parents to see, at a glance, whether and to what degree each school is meeting its
performance targets, including narrowing achievement gaps.
As illustrated in the sample high school performance report below, the report describes
performance in four areas: Academic Achievement, College and Career Readiness, Graduation
Rate and Post-Secondary Outcomes, and Progress toward Closing Achievement Gaps. For each
area, the report presents the percentage of the performance targets met, how the school’s
performance compares to schools that are educating a similar student population, and how the
school compares to the State as a whole. For example, in this school scorecard, the school met
50% of its Academic Achievement Targets. Meeting 50% of the targets places this school in the
82nd percentile Statewide, but only in the 17th percentile when compared to its peer school group.

‐43-
To facilitate targeted and comprehensive State interventions, the performance report also
provides each school’s formal designation (Priority, Focus, etc.) in accordance with the State’s
new, federally-endorsed accountability system. In this example, this school has been labeled as a
Focus School because it has among the largest within-school achievement gaps in the State.
As shown in the next table demonstrating results for Language Arts Literacy, the school’s
overall and subgroup performance targets will be displayed as part of the Academic
Achievement subsection of the performance report. For each subgroup in each school, in both
Language Arts Literacy and mathematics, the report shows: the current pass rate, the target that
the school was required to meet, and whether the target was met or exceeded, was not met, or
was within the range of the standard error of the measurements.
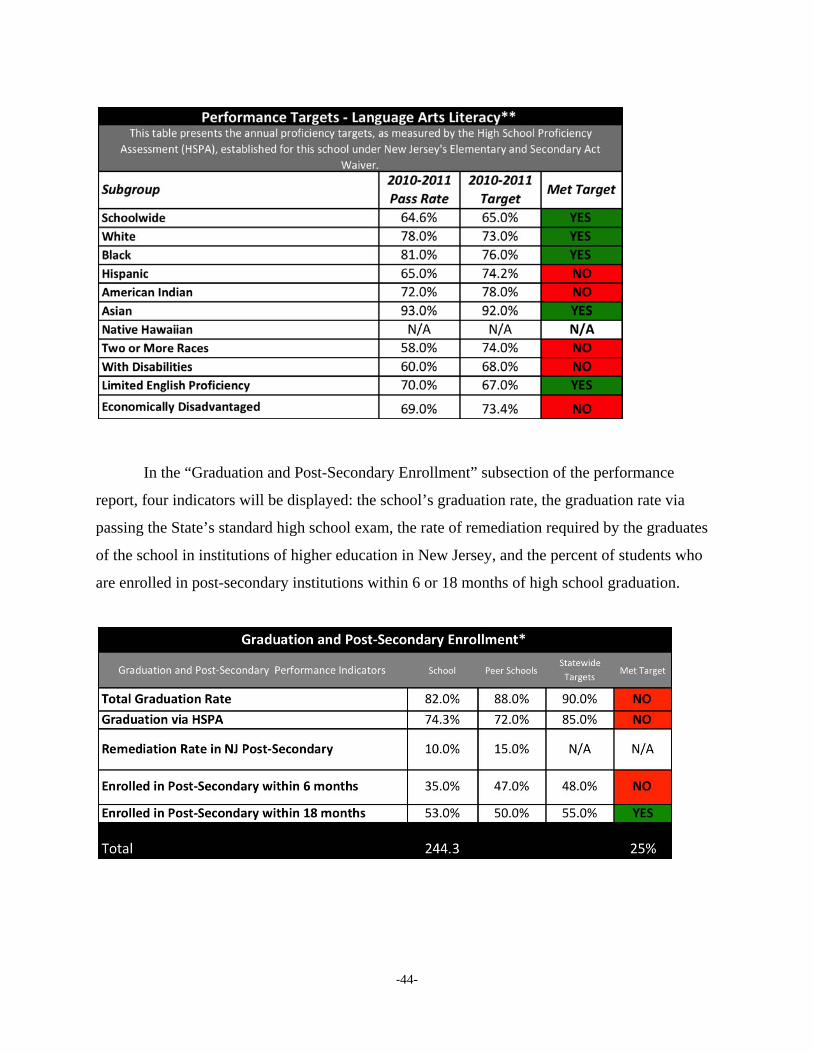
‐44-
In the “Graduation and Post-Secondary Enrollment” subsection of the performance
report, four indicators will be displayed: the school’s graduation rate, the graduation rate via
passing the State’s standard high school exam, the rate of remediation required by the graduates
of the school in institutions of higher education in New Jersey, and the percent of students who
are enrolled in post-secondary institutions within 6 or 18 months of high school graduation.

‐45-
Finally, and central to Abbott’s core objective, the report will include “Closing within
School Gaps” indicators. For high schools, the gap will be measured between the scale score
points earned by the student at the 25th percentile and the student’s score at the 75th percentile.
4. AGGRESSIVE, COMPREHENSIVE INTERVENTIONS IN PERSISTENTLY FAILING
SCHOOLS
The Department is confident that the path outlined to this point will lead to substantial
improvement in our most underperforming schools. If we have effective educators, arm them
with rigorous standards and helpful resources, and facilitate their continuous improvement
through data-rich information, then we have set ourselves up for success. The Department is
now organized around ensuring that these conditions for success are established in those schools
that have defied prior efforts at improvement – many of which have been the principal focus of
the Abbott litigation. When our best efforts have failed, however, and we still have boys and
girls assigned to persistently failing schools, the State must have both a sense of urgency and a
quiver full of arrows.
As outlined in our successful No Child Left Behind waiver application, the first course of
action is a series of State-level, school-focused interventions. It begins with an improved system
for identifying the schools truly in need of support. Under NCLB, inflexible rules lumped
SchoolPeer
Schools
Statewide
Targets
Met
Target
55 60 35 NO
60 55 40 NO
Total 210 33%
*The table above displays the difference in scale score points between
the student at the 25th percentile and the student at the 75th percentile
(the interquartile range) in each content area of the New Jersey High
School Proficiency Assessment (HSPA).
Bottom 25th Percentile v. 75th
Percentile HSPA LAL Scale Score
Bottom 25th Percentile v. 75th
Percentile HSPA Math Scale Score
Closing Within School Gaps*
Closing Within School Gaps Indicators

‐46-
together all targeted schools in a catchall category of “schools in need of improvement.”
Whether it was a school with virtually all of its students performing well below proficiency or a
generally successful school with one struggling subgroup, the school was publicly labeled as
troubled.
Moreover, federal law required the same set of supports and interventions for all schools,
regardless of their true needs, as long as they were in the same year of improvement status. All
schools missing Adequate Yearly Progress for two years were treated the same, and all schools
missing for five years were treated the same. NCLB was all but blind to the fact that there could
be enormous differences among these vast classes of schools. A school could have drastically
different levels and types of needs than another that happened to fall in the same category.
The law also labeled entirely too many schools as requiring intervention. Though we
should have high expectations for all schools and demand continuous improvement, when more
than half of the State’s schools are identified, there is a troubling disconnect between policy and
facts on the ground. Furthermore, no state department of education has the capacity to develop
and implement meaningful improvement strategies in more than 1,000 schools each year.
New Jersey’s new accountability system corrects these flaws by differentiating schools
based on their needs, targeting supports accordingly, and limiting the number of schools facing
the most stringent interventions. The State’s most persistently underperforming schools, those
with long track records of very low achievement and showing no indication of growth, are
designated as Priority Schools. Those in which certain subgroups are struggling mightily or
large achievement gaps between subgroups exist are labeled as Focus Schools.xxxiii
After being identified by the State’s accountability systems, each Priority and Focus
School will undergo an intensive “Quality School Review” (QSR). A team of highly-skilled and
experienced educators will conduct an on-site study of the school, including classroom visits,
interviews with teachers and administrators, reviews of data, and more, to glean the school’s
strengths and weaknesses. The team will then develop a detailed action plan for the school,
which will include a wide array of services and supports provided by the State and tailored to the
school’s specific needs.
The QSR team will conduct its needs analyses and generate improvement plans guided
by key “turnaround principles,” research-based interventions to improve a school’s academic
‐47-
health. These principles include school culture, leadership, curriculum, instruction, use of time,
use of data, staffing practices, and family engagement.
Assessing schools, developing improvement plans, and delivering supports will all fall to
the State’s new Regional Achievement Centers. These new field offices, described above, will
have expertise in these turnaround principles and extensive track records of improving
underperforming schools. After the completion of the QSR and the development of an
intervention plan, the staff will work closely with school and district personnel to ensure that the
necessary actions are taken. For example, the team will make sure that the school is following a
rigorous, standards-aligned curriculum; they will require that the principal be a high-quality
instructional leader; and they will help the school develop the capacity to collect and analyze
student performance data.
It is our expectation that this process will lead to fruitful collaboration between the State,
districts, and schools. The Department is committed to bringing about significant change in
these schools, however, no matter the obstacles faced. Should instances arise where the State-
mandated course of action is thwarted, the Commissioner will use his broad statutory and
regulatory authority, for example his power to direct or withhold funds, to ensure that the
prescribed activities are successfully implemented.
We are confident that this new process for identifying and intervening in a limited
number of truly troubled schools will be successful – that it will substantially improve
performance in Priority and Focus Schools. Our ultimate concern is the educational fate of
disadvantaged students, however. If we are to turn around the State’s lowest-performing schools
– a goal that simply has not been achieved via Abbott or by any other means over the years – we
must adopt a sense of urgency, a no holds barred approach that is indifferent to political concerns
or objections. When a district proves itself unable to turn around the fortunes of a persistently
failing school, despite the State’s support and direction through the RACs, our question becomes,
“what do we do for those boys and girls right now?”
Our answer must be aggressive and may entail an end to our general deference to district
and local officials. One option is, in effect, to restrict the authority of the district to operate the
school. Although the district may retain the deed to the building, the school would be managed
by another entity or leadership team. The new management team would gain authority over the
school’s staffing, budget, governance, and more. The recent passage of the Urban Hope Act
‐48-
provides a similar avenue, whereby a district partners with another entity to run a struggling
school.
Another option along the “replacement” continuum is the State’s power to close failing
schools and open new ones. The Department’s authority to charter new, independent schools
gives the State a powerful tool. By recruiting high-quality school operators, directing them to
high-need areas, and enabling them to develop new programs absent restrictive district rules and
collective bargaining agreements, the State can strategically replace low-performing seats with
high-performing ones.
A final set of options includes making other existing alternatives available to the students
assigned to failing schools. The State’s inter-district choice program can play an important role
here. Through this program, the State can help direct students in troubled schools to higher
performing schools in neighboring districts. Nonpublic schools could also become options; the
Administration strongly supports the Opportunity Scholarship Act, a tuition tax credit program
that would help low-income students in failing district schools transfer to higher performing
private schools.
Whether the State directly intervenes in a school, changes its management, or makes
other options available to needy students, the underlying principle is the same: no school has the
right to fail students in perpetuity. The State has limited patience and will take bold action to
ensure that all students, regardless of zip code or birth circumstances, have access to an
education that will prepare them for success.
D. CONCLUSION
Each of the initiatives detailed in this section is critical to the future success of our most
persistently struggling schools. Again, this list of interventions and supports is not meant to be
exhaustive. For example, one could easily have added such initiatives as: (1) ending the practice
of promoting children to fourth grade even if they still cannot read; (2) a migration to increased
amounts of technology-delivered instruction keyed to the individual needs of each child; or (3)
community-based strategies to support students in overcoming their out-of-school challenges.
Rather, the list is meant to be illustrative, offered to make a point: our collective focus on money
as the defining characteristic of effective reform has yielded meager results. We will not succeed

‐49-
unless we couple that focus with an integrated set of actions to be undertaken by lawmakers,
State and district officials, and educators. If we are to have any chance of delivering on the
promise of public education – ensuring that all students regardless of background have the
opportunity for a lifetime of success – we must acknowledge that funding alone is not the
solution, that it is not only “how much” we spend but “how well” we spend it that matters.

‐50-
PART III – FUNDING REFORMS
Having addressed the “how well,” it is time to consider the “how much.” Since the 2008-
2009 school year, State aid has been allocated to school districts through a formula, the School
Funding Reform Act (SFRA) formula. There is much that recommends the SFRA. For example,
it is overall generous, providing billions of education dollars to districts and recognizing public
education as a priority in New Jersey. But, of course, the SFRA funding formula is far from
problem free.
First, in certain areas, it is generous without justification and in one – Adjustment Aid –
the formula is actually generous in contravention of itself. That is, a number of school districts
receive more State aid (in the form of Adjustment Aid) than the formula requires – and more
even than the formula-defined level of “adequacy.” The formula also provides districts with the
wrong incentives, allocating State aid without concern for innovation or even success, and
discouraging districts from focusing on and improving attendance rates. And these formula-
based problems have created an implementation problem: the State has been “off formula” since
the 2009-2010 school year. The confluence of a too generous funding formula and a weak
economy forced the State to vary from the SFRA for several years.xxxiv
The recommendations below are designed to correct these problems, while preserving the
overall generosity of the SFRA funding formula. Specifically, the Department recommends
reducing certain weights used in the formula to the levels actually recommended by the
Professional Judgment Panels (PJP), eliminating Adjustment Aid in part, and measuring district
enrollment using average daily attendance rather than the current single count day. Importantly,
the Department also recommends full funding of this “new” funding formula over the course of
five years. A five-year phase-in has several benefits. It will allow the Treasury to appropriately
budget for the increased State aid over several years, provide districts receiving less State aid
with sufficient time to adjust to their new aid numbers, and, perhaps most importantly, ensure
that the State actually funds the formula.
In addition to full funding of the SFRA as amended, the Department recommends
creation of a new pot of education dollars – an Innovation Fund. The Innovation Fund would be
used both to fund district- and school-initiated reforms and innovations and reward the State’s
highest-performing districts and schools.
‐51-
Taken together, these proposed reforms: demonstrate a renewed State commitment to
funding education; place all school districts on a path to adequacy; restore the State to the sound
policy of “funding the child” (thus allowing fairer funding for high-growth districts); reward
innovation and success through the new Innovation Fund; provide districts with much needed
transparency and predictability in budgeting through the State’s commitment to fully fund the
formula; incent districts to focus on and improve attendance rates; and, when combined with the
reforms described in Part II, begin to close the achievement gap.
A. A BRIEF PRIMER ON THE SFRA
To understand the recommended changes to the SFRA funding formula, some
background on the SFRA itself is necessary.
The SFRA was built using the Professional Judgment Panel (PJP) approach.xxxv At its
most basic, the PJP approach uses panels of experts to identify the resources needed (and, later,
the costs of those resources) to reach certain predetermined performance standards. In New
Jersey, those performance standards were the State’s Core Curriculum Content Standards
(CCCS). Accordingly, the question governing New Jersey’s PJP process was: what resources
are needed to meet the CCCS? In answering that question, the PJPs were counseled not to
design their “dream school,” but were also instructed “not to be overly constrained by concerns
about cost.”xxxvi
The New Jersey PJP process used three rounds of expert panels. The first panel consisted
of seven Department employees. The second included participants nominated by various
stakeholder groups, including panelists from the Education Law Center, the New Jersey
Education Association, and the New Jersey School Boards Association. The final panel
contained eight members – five superintendents, a school board member, a school business
administrator, and a professor from Kean University. Importantly, later panels were unrestricted
in their ability to alter the work product of earlier panels, whether by addition or subtraction.
Ultimately, the process yielded a set of resources necessary to achieve the CCCS in a model
elementary school, middle school, and high school.
Thereafter, costs were assigned to those resources using actual cost data from the 2005-
2006 school year maintained by the Department, and were inflated to estimate the costs for the

‐52-
2008-2009 school year. So, for example, the PJPs determined that in a model elementary school
of 400 students, 22 classroom teachers were needed. The Department multiplied the mean
estimated teacher salary/benefits package in 2009 (approximately $75,822) by 22 to determine
the total classroom salary costs. Likewise, the PJPs listed certain supplies and materials needed
by the students in the model elementary school. The Department determined that those supplies
and materials cost roughly $353 per student, or just over $141,000 across the model elementary
school.
At the end of the cost-assignment process, for each model school, there was a total
budget. Those budgets, in turn, were divided by the estimated school size (400 for the
elementary school, 600 for the middle school, and 1,640 for the high school) to arrive at the cost
per-pupil for an “average” elementary, middle, and high school student, where “average” was
defined as a student who was not at-risk, LEP, or in need of special education services. The cost
to educate an “average” elementary school student at the level contemplated by the CCCS was
$9,649; $10,035 for an “average” middle school student (or 4% above the cost of educating an
“average” elementary school student); and $11,289 for an “average” high school student (or 17%
above the cost of educating an “average” elementary school student).
In addition to determining the resources needed to educate “average” students at the level
contemplated by the CCCS, the PJPs also opined on the additional resources necessary to
educate at-risk, LEP, and special education students to the CCCS. They identified, among other
things, additional teachers, instructional aides, and enhanced security as required for such
students. Those additional resources were also “costed out,” and, based on those costs, weights
were assigned to at-risk and LEP students – those weights representing the costs beyond the
“average” costs per-pupil needed to educate those students to the CCCS.
Following the PJP process, the Department retained a series of experts to review the
recommendations and to assist in drafting the SFRA. Public hearings were held by the
Department and by a special legislative committee. This complex and lengthy review process
led to major changes to the PJPs’ work that would substantially increase the costs of the original
proposal. The end result was a series of costs, weights, and coefficients that form the heart of the
SFRA funding formula.
Table 3.1: SFRA Funding Formula Costs, Weights, and Coefficients

‐53-
Student Type SFRA Input SFRA Input in
Actual Dollars
“Average” elementary school
student
$9,649 --
“Average” middle school
student
$10,035 --
“Average” high school student $11,289 --
Special education census
amount
$10,898 (additional) --
Speech-only special education
student
$1,082 (additional) --
At-risk student
47%-57% (plus base grade
amount)
$14,184-$15,149 (elementary)
$14,751-$15,755 (middle)
$16,595-$17,724 (high)
LEP student
50% (plus base grade amount) $14,474 (elementary)
$15,052 (middle)
$16,934 (high)
Combination at-risk/LEP
student
59.5%-69.5% (plus base grade
amount)
$15,390-$16,355 (elementary)
$16,006-$17,009 (middle)
$18,006-$19,135 (high)
While the costs for an “average” elementary, middle, and high school student are self-
evident from Table 3.1, the other categories require some explanation. First, to prevent districts
from over-classifying their students as special education, the SFRA funding formula assumes
that 14.69% of every school district’s student population is special education, and an additional
1.897% of every district’s population is speech-only special education. These rates were
determined by finding the average classification rates for all districts Statewide. The $10,898
figure is the additional cost to educate a special education student to the CCCS beyond the cost
of educating an “average” student to the CCCS. The PJPs estimated an additional $1,082 for
students needing speech services alone.
Under the SFRA, an at-risk student is one enrolled in the federally-administered Free and
Reduced Price Lunch Program. Where a school district has a low concentration of at-risk
students, the cost of educating an at-risk student to the CCCS is 47% more than his “average”
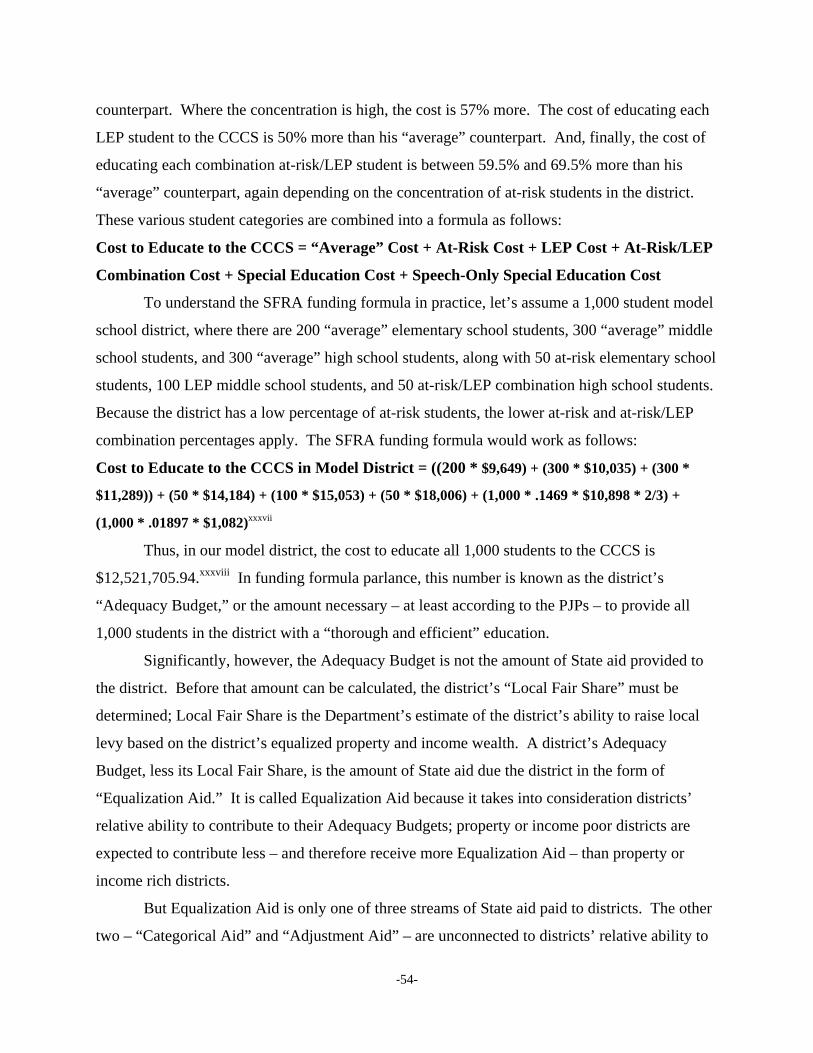
‐54-
counterpart. Where the concentration is high, the cost is 57% more. The cost of educating each
LEP student to the CCCS is 50% more than his “average” counterpart. And, finally, the cost of
educating each combination at-risk/LEP student is between 59.5% and 69.5% more than his
“average” counterpart, again depending on the concentration of at-risk students in the district.
These various student categories are combined into a formula as follows:
Cost to Educate to the CCCS = “Average” Cost + At-Risk Cost + LEP Cost + At-Risk/LEP
Combination Cost + Special Education Cost + Speech-Only Special Education Cost
To understand the SFRA funding formula in practice, let’s assume a 1,000 student model
school district, where there are 200 “average” elementary school students, 300 “average” middle
school students, and 300 “average” high school students, along with 50 at-risk elementary school
students, 100 LEP middle school students, and 50 at-risk/LEP combination high school students.
Because the district has a low percentage of at-risk students, the lower at-risk and at-risk/LEP
combination percentages apply. The SFRA funding formula would work as follows:
Cost to Educate to the CCCS in Model District = ((200 * $9,649) + (300 * $10,035) + (300 *
$11,289)) + (50 * $14,184) + (100 * $15,053) + (50 * $18,006) + (1,000 * .1469 * $10,898 * 2/3) +
(1,000 * .01897 * $1,082)xxxvii
Thus, in our model district, the cost to educate all 1,000 students to the CCCS is
$12,521,705.94.xxxviii In funding formula parlance, this number is known as the district’s
“Adequacy Budget,” or the amount necessary – at least according to the PJPs – to provide all
1,000 students in the district with a “thorough and efficient” education.
Significantly, however, the Adequacy Budget is not the amount of State aid provided to
the district. Before that amount can be calculated, the district’s “Local Fair Share” must be
determined; Local Fair Share is the Department’s estimate of the district’s ability to raise local
levy based on the district’s equalized property and income wealth. A district’s Adequacy
Budget, less its Local Fair Share, is the amount of State aid due the district in the form of
“Equalization Aid.” It is called Equalization Aid because it takes into consideration districts’
relative ability to contribute to their Adequacy Budgets; property or income poor districts are
expected to contribute less – and therefore receive more Equalization Aid – than property or
income rich districts.
But Equalization Aid is only one of three streams of State aid paid to districts. The other
two – “Categorical Aid” and “Adjustment Aid” – are unconnected to districts’ relative ability to

‐55-
pay. Categorical Aid is provided to districts for various education expenses, including: (1) one-
third of the costs for special education (the Adequacy Budget only includes two-thirds of special
education costs); (2) security aid; (3) preschool aid; (4) extraordinary aid for special education;
and (5) transportation aid. Extraordinary aid is a reimbursement for a portion of districts’ actual
costs incurred for students with extraordinary special education needs. For each of the other
categories, the amount of State aid is calculated by multiplying the cost per-pupil for the aid
category by the number of students in the district eligible for the aid category. Adjustment Aid,
on the other hand, is completely unmoored from district size or even student needs.
Under the SFRA funding formula, where the sum of a district’s Equalization Aid and
Categorical Aid is less than the district’s 2007-2008 spending (the school year prior to
implementation of the SFRA), plus two percent, the district is provided with Adjustment Aid
covering the difference. This is a critical point and worth restating: under the SFRA funding
formula, no school district can receive less State aid than 102% of its 2007-2008 spending, even
where the SFRA itself declares that less State aid would be “adequate” to provide a “thorough
and efficient” education for the district’s students.
B. PROPOSED CHANGES TO THE SFRA FUNDING FORMULA
With this background, it is clear that the SFRA funding formula has much to recommend
it: the formula was developed over a number of years, and provides generous, overall funding to
school districts. But, as with most things, there is room for improvement.
First, from PJPs to enactment by the Legislature, several of the funding formula’s
weights were adjusted upward from where the PJPs originally set them. Adjustment Aid also
crept in, not because there was an educational need for it, but rather to ensure that no district lost
State aid in the transition from old funding formula to new. Third, the SFRA funding formula
funds districts based on their enrollment on a single day, October 15, and, thereby, fails to
account for mid-year enrollment changes, underfunding some districts, while overfunding others.
Finally, the formula’s reliance on participation in the Free and Reduced Price Lunch Program as
a proxy for measuring a district’s at-risk population is flawed and should be reconsidered.

‐56-
1. RETURNING TO THE WEIGHTS ORIGINALLY ESTABLISHED BY THE PROFESSIONAL
JUDGMENT PANELSxxxix
As noted above, the PJP process involved a number of education experts and
stakeholders, and from beginning to end, extended over several years. The final product was a
number of costs, weights, and coefficients required to educate – at least according to the PJPs –
both “average” and at-risk, LEP, and at-risk/LEP combination students to the CCCS. But
importantly, the PJP-determined weights were not the weights that made their way into the
SFRA funding formula as enacted by the Legislature. Rather, the funding formula enacted by
the Legislature includes weights higher than those determined by the PJPs.
Table 3.2: PJP Weights vs. Actual SFRA Weights
PJP Weights Actual SFRA Weights
At-Risk Students 42%-46% 47%-57%
LEP Students 47% 50%
Combination At-
Risk/LEP Students
52.5%-56.5% 59.5%-69.5%
Unsatisfied with the reasons for the inflation of the PJP-determined weights upward, the
Department recommends that the at-risk, LEP, and combination at-risk/LEP weights in the
SFRA funding formula be adjusted downward to where they were originally set by the PJPs. In
doing so, New Jersey will both remain true to the original intent of the PJPs and continue to be
one of the most generous state funders of at-risk, LEP, and at-risk/LEP combination students in
the country.
Table 3.3: New Jersey Funding of At-risk, LEP, and At-Risk/LEP combination Students as
Compared to Other Statesxl
At-Risk LEP
New Jersey (as amended) 42%-46% 47%
Maine 20% 30%-60%
Vermont 25% 20%
Texas 25% 10%

‐57-
2. REDUCING ADJUSTMENT AID FOR DISTRICTS AT OR ABOVE “ADEQUACY”
Adjustment Aid was a political add-on to the PJP process. It served no purpose other
than to hold all districts harmless in the transition from the old funding formula to the SFRA. It
is a symbol of the old Trenton; a paean to the longstanding tradition of refusing to make hard
choices even when hard choices are in order and failing to make hard choices will cost taxpayers
greatly.
The PJPs spent years deciding on the resources necessary to educate New Jersey’s
students to the CCCS, costing out those resources, and finally deriving the appropriate costs,
weights, and coefficients to be used in the SFRA funding formula. When the formula was run,
and the sum of Equalization Aid and Categorical Aid due a district was less than what it received
from the State under the previous funding formula, the Legislature was presented with a choice:
it could uphold and remain true to the work of the expert PJPs or it could succumb to political
expediency. It chose the latter.
Today, the result is that a number of districts already funded at their Adequacy Budgets –
the level, according to the PJPs, at which a district has sufficient funds to provide its students
with a “thorough and efficient” education – receive huge windfalls from the State in the form of
Adjustment Aid.
Table 3.4: Examples of Districts above Their Adequacy Budgets Receiving Adjustment Aid
FY13 Spending
Amount Over
Adequacy
FY13
Adjustment Aid
with No Change
Adjustment Aid
Fully Phased-In
(Projected FY17)
Camden City 50,979,158 62,692,792 37,203,213
East Orange 26,328,061 44,748,412 31,584,381
Atlantic City 23,431,847 13,093,816 1,377,892
Asbury Park 22,581,329 26,993,617 15,702,952
Vernon Twp. 19,714,964 10,960,741 1,103,259
The Department recognizes that eliminating Adjustment Aid altogether, which equaled
nearly $571 million in FY12, would be a shock to districts that have come to rely on the
‐58-
additional revenue stream. Instead, for all districts at or above their Adequacy Budgets, the
Department recommends reducing Adjustment Aid by 50% of the amount the district is over
adequacy, and to phase in that reduction, like all funding formula changes recommended in this
Report, over five years.
So, by FY17, after giving districts five years to adjust to this new reality, the State will
have taken a strong step in correcting a gross inequality and undoing a political giveaway of the
past. Districts that were used to receiving these add-on dollars will no doubt cry foul, but even
with the reduction in Adjustment Aid, they will still have more money to educate their students
than called for by their respective Adequacy Budgets, i.e., be over-funded from the perspective
of the PJPs.
3. MOVING FROM A SINGLE COUNT DAY TO AVERAGE DAILY ATTENDANCE
The SFRA funding formula determines district enrollment based on single count day,
October 15. The single count day policy breeds a number of perversities and inequities,
including: both under-funding and over-funding of districts when mid-year enrollment changes
are not considered, and a lack of concern for encouraging attendance because districts receive
funding based on their October 15th enrollment, regardless of attendance rates before or after that
date. It is this last statement that is the most troubling.
Although New Jersey funds based on a single count day, it does collect more complete
attendance data at the end of every school year. That data reveals that the former-Abbott
districts and the low-wealth DFG A districts have considerably lower daily attendance rates than
their wealthier peers.

‐59-
Figure 3.1: Average Daily Attendance by District Factor Group, 2009-10
If New Jersey is to close its persistent achievement gap, it must find a way to encourage
districts – especially low-performing districts – to increase attendance. Research, not to mention
commonsense, demonstrates that attendance matters. The National Center for Children in
Poverty, for example, found that chronic absenteeism in kindergarten is a significant cause of
low academic performance in elementary school.xli In middle school, the more a student is
absent, the more likely he is to drop-out of high school.xlii And, in high school, poor attendance
is one of the strongest predictors of drop-out rates.xliii
Moreover, no matter how successful the Department is in improving teacher quality
through the reforms highlighted in Part II of this Report, none of it will matter if students are not
daily in their seats. If John F. Kennedy High School in Paterson, for example, increased its
attendance rate by just one percentage point, its students would benefit from 20,000 hours of
additional instructional time per year. Statewide, among large high schools, a one percentage
point increase in attendance would result in nearly 4.2 million hours of additional instructional
time per year.xliv
By moving away from a single count day, and instead funding based on average daily
attendance, the State will encourage districts to focus on attendance, develop novel ways to
increase it – from swipe cards to track attendance to automatic text messages, e-mails, and
92.9% 94.1% 94.7% 95.0% 95.3% 95.6% 95.2% 95.7%
78.3%
55.1%
38.8%
23.6%
16.5%12.5%
5.2%2.0%
0.0%
10.0%
20.0%
30.0%
40.0%
50.0%
60.0%
70.0%
80.0%
90.0%
100.0%
A B CD DE FG GH I J
Attendan
ce Rate (%)
Average At‐Risk % (District Factor Group)
Attendance Rate % (2009‐10)
Disadvantaged %
‐60-
voicemails when a student is truant – and, thereby, win back much needed instructional time for
our State’s at-risk students. Accordingly, the Department recommends that the SFRA funding
formula fund based on average daily attendance rather than a single count day. Of course, the
Department recognizes that 100% daily attendance is an impossibility given illnesses, vacations,
and emergencies, and therefore encourages the Legislature to adopt 96% as the equivalent of
100% attendance for funding purposes. A 96% attendance rate represents the 75th percentile of
district attendance rates in the State, which the Department believes is an aggressive but
achievable target for all districts.
4. DEVELOPING AN ALTERNATIVE TO PARTICIPATION IN THE FREE AND REDUCED
PRICE LUNCH PROGRAM
Recently, the Office of the State Auditor released a report estimating that as many as 37%
of the participants in the federally-administered Free and Reduced Price Lunch Program are
fraudulently enrolled in the program.xlv An even more recent Star-Ledger article seemed to
confirm the fact when it reported that the President of the Elizabeth Board of Education, along
with the spouses of two Elizabeth school officials, were arrested for misstating their incomes to
qualify for the Program.xlvi Such a high error rate in a program so consequential for education
funding gives the Department considerable pause.
As discussed above, the SFRA funding formula uses participation in the Free and
Reduced Price Lunch Program as a proxy for measuring New Jersey’s at-risk student population.
And each at at-risk student/Program participant is funded at between 147%-157% (or 142%-
146% if the Department’s proposed weight changes are adopted) of his “average” counterpart,
and for combination at-risk/LEP students, at between 160%-170% (or 153%-157% if the
Department’s proposed weight changes are adopted) of their “average” counterparts. In short,
the State distributes huge sums of education dollars based on a Program that appears, given the
Auditor’s report and anecdotal evidence, readily susceptible to fraud or error.
While the Department is not prepared to recommend an alternative way to measure New
Jersey’s at-risk student population, it does recommend that the Governor convene a task force to
explore the issue, including: (1) whether a poor student should be presumed to be educationally
at-risk, or whether there is a more precise way to define at-risk students; (2) if a poor student

‐61-
should be presumed to be educationally at-risk, is there a truer (and less error prone) measure of
poverty than participation in the Free and Reduced Price Lunch Program; and (3) if a poor
student should not be presumed to be educationally at-risk, how can at-risk students be more
precisely defined?
5. CONCLUSION
Taken together, the above-described changes to the SFRA funding formula will result in
a formula truer to the original intent of the PJPs, a formula designed to value – and, more
importantly, cause districts to value – attendance, and a formula funded at historic levels each
successive year.
C. INNOVATION FUND
If the recommendations of this Funding Report are adopted by the Legislature, the State
will provide roughly one-third of the total State budget to school districts in FY13. Those dollars
will flow based, almost exclusively, on district enrollment (ideally average daily attendance)
unconcerned with success, innovation, or reform. If a district is failing its students, but failing
more students than it did the previous year, it will receive more State aid. Likewise, two districts
of the same size, one reform-minded and forward-thinking, and the other wedded to the status
quo, will receive the same amount of State aid. The result is an education system where success
goes unrecognized, innovation unrewarded, and New Jersey’s near 600 school districts serve as
mere implementers of State-directed policies rather than incubators of innovation and partners in
reform. This system must be changed, and creation of a modest “Innovation Fund” would do
much to work that change.
While straightforward in concept, an Innovation Fund would be anything but in practice.
For the first time in New Jersey’s history, State education aid would be merit-based. The
Innovation Fund would be used in two ways. First, a portion would be used to provide financial
awards to the highest-performing districts and schools as determined by the Department of
Education. For example, awards might be given to the elementary school that achieved the
biggest one year increase in third grade literacy for disadvantaged students, the district with the
‐62-
largest improvement in its attendance rate, or the high school with the biggest jump in its
graduation rate.
The remaining portion of the Innovation Fund would be application-based, accessible to
districts and schools that have identified problem areas – e.g., low graduation rates, poor-
performing LEP students, or low scores in fourth grade mathematics – and designed reforms to
target those problems. The Department would fund the best reforms and monitor their
implementation and impact, ultimately identifying and bringing to scale Statewide the most
efficacious. New Jersey would quickly become a laboratory of reform, where the Department of
Education, as well as all 600 school districts, had a common purpose: identifying reforms that
work. Additional recommendations for the workings of the Innovation Fund are detailed below.
1. SIZE OF THE INNOVATION FUND
The Department recommends an Innovation Fund of $50 million, a portion of which will
be used to recognize and reward the most successful districts and schools and a portion of which
will be application-based. No monies from the Innovation Fund would be disbursed in FY13.
Instead, in the case of the award-based portion of the Fund, the Department would establish
award categories in school year 2012-2013, and recognize the winners in the fall of 2013.
Likewise, for the application-based portion, districts and schools would submit their
applications in school year 2012-2013, with grants awarded in the summer of 2013. This would
allow the Department sufficient time to thoroughly review all applications and proposals and
fund the most meritorious. The remainder of this section concerns the application-based portion
of the Innovation Fund.
2. ELIGIBILITY AND REQUESTS FOR FUNDING
In order to qualify for a grant from the Innovation Fund, an applicant would have to,
among other requirements: use data to identify a high-priority need consonant with Departmental
priorities; propose a reform targeted to meet that need; provide research, data, or other
information that supports the efficacy of the proposed reform; demonstrate collaboration among

‐63-
stakeholders, including teachers and parents; identify any matching funds; and work with the
Department of Education to rigorously evaluate the impact of the proposed reform.
3. COMPLEMENT IDENTIFIED DEPARTMENTAL PRIORITIES
This Funding Report has made the Department of Education’s priorities clear – collecting
and better using data, improving teacher and principal quality, turning around low-performing
schools, incenting attendance, and, of course, closing the achievement gap. Any application to
the Innovation Fund would have to demonstrate how the applicant’s identified need and
proposed reform is aligned with one or more of those priorities, and applications unaligned
should be immediately rejected. Simply, if New Jersey is to realize the Department’s priorities,
then all components of the educational system – individual teachers, principals, schools,
superintendents, districts, and the Department itself – must understand those priorities, value
them, and work in concert to achieve them.
4. DEVELOPING, VALIDATION, OR SCALE-UP
The Department recommends establishing three differential funding categories for
Innovation Fund applications: developing, validation, and scale-up. The “developing” category
would be for those applications proposing reforms that, while promising, have limited empirical
or other support. Grant amounts would be appropriately capped. The “validation” category
would be for proposed reforms supported by a body of empirical evidence or that have been
successfully employed inside or outside of New Jersey, but on a limited scale. Grant amounts
would again be capped, although at levels higher than the developing category. Finally, the
“scale-up” category would be for reforms with a demonstrated record of success across multiple
districts or schools. The scale-up category would be limited to district applicants looking to
implement a reform district-wide. Grant amounts would be uncapped.

‐64-
5. KEY STAKEHOLDER COLLABORATION AND RESOURCE COMMITMENT
Critical to any reform effort is ensuring that key stakeholders – parents, teachers,
principals, and community partners, among others – are aware of the reform and given both time
and opportunity to provide input on its design and implementation. Accordingly, Innovation
Fund applicants should demonstrate how key stakeholders were given meaningful opportunities
to provide input on the application, and how they will support the implementation of any
proposed reform.
6. EVALUATION AND DISSEMINATION
The Department of Education is committed to evaluating all reforms funded through the
Innovation Fund. Only through rigorous evaluation can the Department and applicants
determine what worked and what did not, bringing the former to scale and never again funding
the latter. Each Innovation Fund applicant must commit to partnering with the Department to
develop a research methodology that not only evaluates the overall effectiveness of the funded
reform, but also allows for mid-implementation review and adjustment if needed.
Once all Innovation Fund reforms have been evaluated, the Department will aggregate
the evaluations into a single report and distribute the report to the public, school leaders, and
districts across the State. The report will be used to both inform future Innovation Fund
applications, as well as practices and policies across all of New Jersey’s school districts.

‐65-
PART IV – CONCLUSION
For decades, New Jersey has waged the right battle, but done so with the wrong tools.
Closing the achievement gap and ensuring that all students – be they economically advantaged or
disadvantaged, urban or suburban, white or black – are prepared for college and career is the
single highest calling of any state department of education. And, indeed, the New Jersey
Department of Education has reaffirmed that calling in this Education Funding Report. But the
Department declines to reaffirm the failed mantra of administrations, legislatures, and courts past
that “more money will cure all that ails us.” Part I of this Report debunks that notion. Despite
per-pupil spending that has outpaced New Jersey’s wealthiest districts and is among the very
highest in the country, many of the former-Abbott districts remain mired in mediocrity, unable to
convert dollars into classroom success.
This should be unsurprising. Pumping more money into our worst-performing districts
has provided us with moral cover, persuading us that we have met our obligation to the students
in those districts while allowing us to under serve them. More money has permitted past
governors and legislatures to avoid the politically difficult reforms – like implementation of an
educator evaluation system, tenure reform, and ending the pernicious “last in, first out” policy –
so critical to turning around our lowest-performing schools. And more money has likewise
allowed the Department of Education to be satisfied with a role as district compliance-monitor
rather than district partner, collaborator, and, where necessary, instigator of seismic reform.
Part II highlighted the changes already made in and to the Department, the changes soon
to come in the form of the Regional Achievement Centers, and the several school-based and
system-wide reforms that are necessary conditions for closing the State’s devastating
achievement gap. Those changes will ensure that the Department and the RACs confront the
hard issues – and even close schools where necessary – rather than papering over them. We urge
the Legislature to do the same, beginning with swift passage of tenure reform.
In focusing on essential substantive reforms, however, the Department also reaffirms the
State’s longstanding commitment to funding its schools and students generously. The reforms in
Part III would increase the total amount of State aid provided to districts over FY12, result in

‐66-
record high levels of education funding each successive fiscal year, and finally accomplish what
no Governor has yet been able to do – put us on a clear and defined path to fully fund the SFRA.
We end where we began. New Jersey will close its achievement gap only if it combines
the “how much” with the “how well.” This Education Funding Report provides a blueprint for
doing so. The Department of Education stands ready to work with the Governor and Legislature
to see that it is implemented.

‐67-
APPENDIX
In addition to the changes to the SFRA funding formula’s costs, weights, and coefficients
described in Part III, the Department recommends the following additional changes.
A. BASE PER-PUPIL AMOUNT
The “base” per-pupil amount is determined through results of the Professional Judgment
Panels (PJPs) convened during the creation of the SFRA and subsequent advisory panels. All of
the additional weights (grade level, at-risk, and Limited English Proficient) apply to the base
amount. Using the resources and staffing levels from the original model, cost updates were
applied to find the revised base per-pupil amount. Among these cost updates are average
salaries, benefits, and the application of the consumer price index (CPI)xlvii to the non-personnel
costs in the model.
In updating salaries, data comes from two sources, depending on the type of employee
specified. For positions that are included in the certificated staff data collection, the Department
derived the average (mean) salary using actual reported salaries for staff employed during the
2010-11 school year – the most recent data available. The salaries for non-certificated positions
were found using the State Occupational Employment and Wage Estimates for New Jersey from
the Bureau of Labor Statistics (BLS). The Department used the May 2010 data collection from
the BLS, the most recent data available. Average salaries for all personnel were adjusted using
the CPI to project FY13 levels. The resultant salaries, by personnel type, can be found in
Attachment B.
Health benefits were calculated using the average cost of the State health benefits
programs, accounting for cost and use by coverage level, for the 2011 year (the most recent
available). After CPI adjustment, the calculated cost of health benefits for FY13 is $14,502 for
each personnel. Using data from the Office of Management and Budget (OMB), the costs of
other benefits were calculated. The Department applied a workers’ compensation rate of 7.57%
for maintenance staff and a rate of 1.4% of salary for all other personnel. For non-certificated
personnel, the Department applied a Public Employees’ Retirement System (PERS) rate of
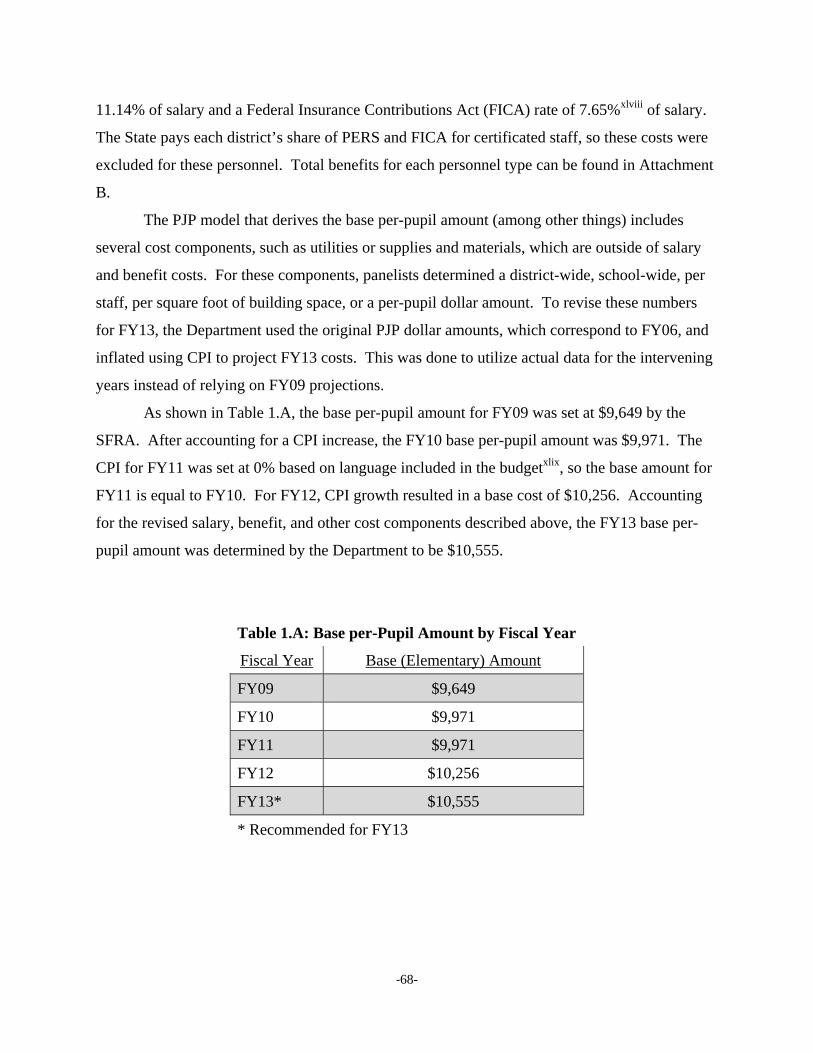
‐68-
11.14% of salary and a Federal Insurance Contributions Act (FICA) rate of 7.65%xlviii of salary.
The State pays each district’s share of PERS and FICA for certificated staff, so these costs were
excluded for these personnel. Total benefits for each personnel type can be found in Attachment
B.
The PJP model that derives the base per-pupil amount (among other things) includes
several cost components, such as utilities or supplies and materials, which are outside of salary
and benefit costs. For these components, panelists determined a district-wide, school-wide, per
staff, per square foot of building space, or a per-pupil dollar amount. To revise these numbers
for FY13, the Department used the original PJP dollar amounts, which correspond to FY06, and
inflated using CPI to project FY13 costs. This was done to utilize actual data for the intervening
years instead of relying on FY09 projections.
As shown in Table 1.A, the base per-pupil amount for FY09 was set at $9,649 by the
SFRA. After accounting for a CPI increase, the FY10 base per-pupil amount was $9,971. The
CPI for FY11 was set at 0% based on language included in the budgetxlix, so the base amount for
FY11 is equal to FY10. For FY12, CPI growth resulted in a base cost of $10,256. Accounting
for the revised salary, benefit, and other cost components described above, the FY13 base per-
pupil amount was determined by the Department to be $10,555.
Table 1.A: Base per-Pupil Amount by Fiscal Year
Fiscal Year Base (Elementary) Amount
FY09 $9,649
FY10 $9,971
FY11 $9,971
FY12 $10,256
FY13* $10,555
* Recommended for FY13
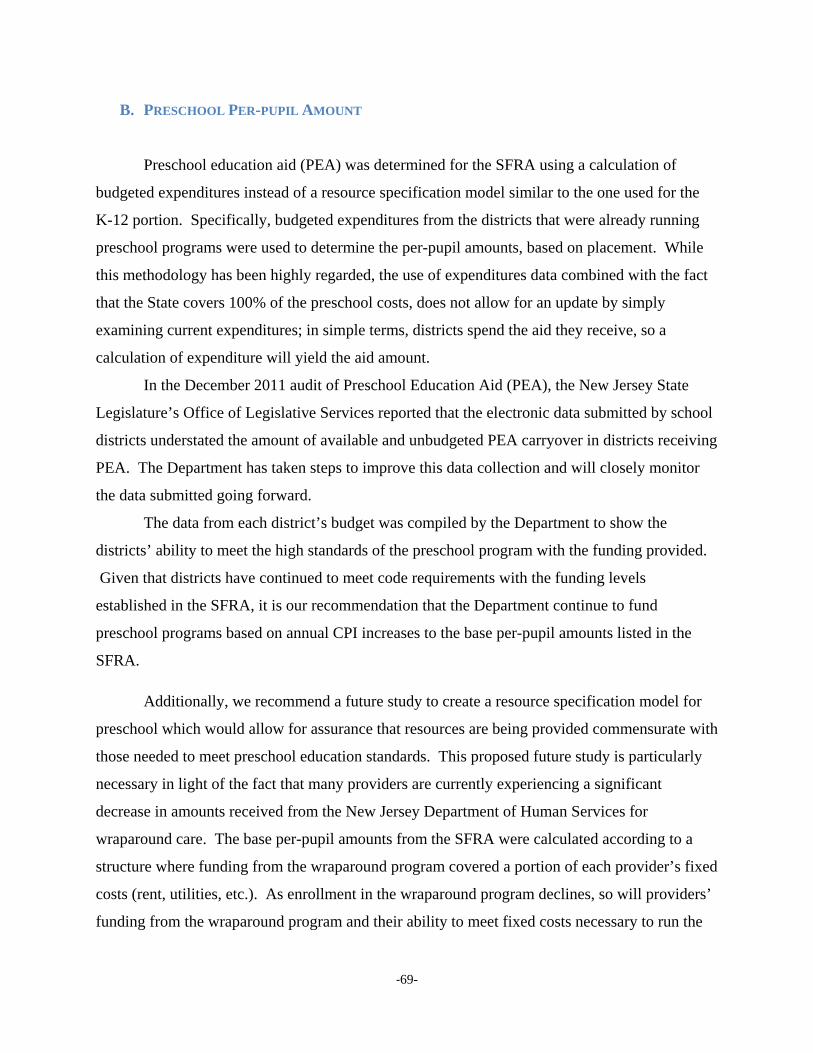
‐69-
B. PRESCHOOL PER-PUPIL AMOUNT
Preschool education aid (PEA) was determined for the SFRA using a calculation of
budgeted expenditures instead of a resource specification model similar to the one used for the
K-12 portion. Specifically, budgeted expenditures from the districts that were already running
preschool programs were used to determine the per-pupil amounts, based on placement. While
this methodology has been highly regarded, the use of expenditures data combined with the fact
that the State covers 100% of the preschool costs, does not allow for an update by simply
examining current expenditures; in simple terms, districts spend the aid they receive, so a
calculation of expenditure will yield the aid amount.
In the December 2011 audit of Preschool Education Aid (PEA), the New Jersey State
Legislature’s Office of Legislative Services reported that the electronic data submitted by school
districts understated the amount of available and unbudgeted PEA carryover in districts receiving
PEA. The Department has taken steps to improve this data collection and will closely monitor
the data submitted going forward.
The data from each district’s budget was compiled by the Department to show the
districts’ ability to meet the high standards of the preschool program with the funding provided.
Given that districts have continued to meet code requirements with the funding levels
established in the SFRA, it is our recommendation that the Department continue to fund
preschool programs based on annual CPI increases to the base per-pupil amounts listed in the
SFRA.
Additionally, we recommend a future study to create a resource specification model for
preschool which would allow for assurance that resources are being provided commensurate with
those needed to meet preschool education standards. This proposed future study is particularly
necessary in light of the fact that many providers are currently experiencing a significant
decrease in amounts received from the New Jersey Department of Human Services for
wraparound care. The base per-pupil amounts from the SFRA were calculated according to a
structure where funding from the wraparound program covered a portion of each provider’s fixed
costs (rent, utilities, etc.). As enrollment in the wraparound program declines, so will providers’
funding from the wraparound program and their ability to meet fixed costs necessary to run the
‐70-
Department preschool program. A resource specification study would allow modification of the
base per-pupil amounts to adequately cover fixed costs for the program.
Table 2.A: Preschool per-Pupil Amounts, by
Provider
In
District Private Provider Head Start
FY09 $11,506 $12,934 $7,146
FY10 $11,890 $13,366 $7,385
FY11 $11,890 $13,366 $7,385
FY12 $12,229 $13,747 $7,595
FY13* $12,460 $14,007 $7,739
* Recommended for FY13
C. WEIGHTS FOR GRADE LEVEL, COUNTY VOCATIONAL SCHOOL DISTRICTS, AT-RISK
PUPILS, BILINGUAL PUPILS, AND COMBINATION PUPILS
In the SFRA, weights are applied to students with various characteristics to account for
the additional resources and services necessary for students with greater needs. The weighted
enrollment, accounting for all such factors, is applied to the base cost (see Section A). The
SFRA applies additional weights to students in the following five categories: (1) grade level; (2)
county vocational school district; (3) at-risk students (free or reduced priced lunch); (4) bilingual
students; and (5) at-risk and bilingual students (referred to as combination students).
1. GRADE LEVEL WEIGHT
Updates to the cost components, as outlined in Section A, derive per-pupil costs for
students at the elementary, middle, and high school levels. Despite an increase in the elementary
base cost since the first year of SFRA (FY09), the costs for middle and high school increased
largely apace. The resultant weights do not change from the base (1.0) for elementary school
and a weight of 1.04 for middle school students. However, there is slight change to 1.16 for high

‐71-
school students. As defined in the SFRA, the elementary weight applies to students in
kindergartenl through grade 5, the middle school weight applies to students in grades 6-8, and the
high school weight applies to students in grades 9-12.
2. COUNTY VOCATIONAL SCHOOL DISTRICT WEIGHT
The SFRA defines a weight of 0.31 for a county vocational student that is applied in
addition to the high school weight. Using the latest audited expenditures data (from FY10) the
Department found the average cost premium of county vocational programs over high school to
be 26%. The change in the resulting weight of 0.26 for FY13 is largely due to improving the
precision of the comparison by using actual data instead of the estimates used in the creation of
SFRA.
3. AT-RISK WEIGHT
The PJPs identified costs required to provide programs and services to at risk students at
various concentration levels. That cost data only addressed programmatic needs at 20% and
40% concentration. Updating that data to reflect current costs and endorsing the same sliding
scale, those data yield at-risk weights of 0.42 for concentrations of 20% and below, and 0.46 for
concentrations 40% and above with a sliding scale for concentrations in between. We
recommend those weights in this Report. The existing record reflects no cost or programmatic
analysis at higher concentrations. Accordingly, we recommend that the State evaluate such costs
in successful school districts with very high concentrations of at-risk students to determine
whether a factual case can be made for increasing these weights. Similar to the results of the
grade weight, and based upon the data identified by the PJPs, the updated cost components yield
changes to the at-risk weights. The SFRA specifies at-risk weights, including a sliding scale
based on district level concentration of at-risk students, which are above those derived from the
PJP model. The updated cost components slightly influenced the PJP model weights, the
Department recommends utilizing the weights based upon the PJP model. Using the same
sliding scale, and accounting for updated cost parameters, the PJP model derives a weight of 0.42

‐72-
for up to 20% at-risk and a sliding scale up to an at-risk concentration of 60% at which point the
at-risk weight peaks at 0.46. The updated weights are reflected in Table 3.A below.
4. BILINGUAL WEIGHT
The SFRA specified a bilingual (also sometimes referred to as Limited English
Proficient, or LEP) weight of 0.50. Based on input from expert panels and others, the bilingual
weight used in SFRA was slightly higher than the weight derived from the PJPs. Updating the
cost components resulted in a change to the weight calculated in the PJP calculation to 0.47. The
Department recommends use of this revised weight of 0.47. The updated weight is reflected in
Table 3.A below.
5. AT-RISK AND BILINGUAL WEIGHT (COMBINATION STUDENTS)
As outlined above and utilizing the data from the PJP deliberative process, the updated
cost components influenced the weights associated with specific student characteristics. As
such, the Department recommends use of the revised weight for combination students equal to
0.1052 plus the district’s at-risk weight. The updated weight is reflected in Table 3.A below.
Table 3.A: At-risk, LEP, and Combination Weights
SFRA (FY09-FY12) FY13*
At-risk 20% 0.47 0.42
At-risk 40% 0.52 0.46
At-risk 60% 0.57 0.46
LEP 0.50 0.47
Combination 0.125 0.1052
* Recommended for FY13

‐73-
D. COST COEFFICIENTS FOR SECURITY AID AND TRANSPORTATION AID
1. SECURITY AID
The SFRA created a two component security aid calculation. The first component is a
per-pupil security amount that applies to all students in the district. In addition, the security aid
includes a component that applies to at-risk students only, with the per-pupil amount based on a
sliding scale that increases with the district’s at-risk concentration, capping at concentrations of
40% and above. For FY13, the Department has determined the per-pupil amount that applies to
all students to stay the same at $70. Additionally, the Department calculates that the at-risk per-
pupil cost drops to $402 for FY13 from $406 in FY09. Much of the decrease can be attributed to
slightly lower salaries for security personnel, a main driver of security costs.
2. TRANSPORTATION AID
Similar to security aid, the SFRA defines a two part transportation aid formula, which
includes a calculation for regular students and one for special education students. For each
regular and special education student, the SFRA describes a base per-pupil amount in addition to
a per-mile average distance to school amount. The SFRA also calls for the creation of an
incentive factor which only applies to the regular student portion of the calculation, and is
applied after the other calculations in the formula have been completed; it is a final adjustment.
For the years prior and including the 2011-2012 school year, the SFRA sets the incentive factor
multiplier (IF) equal to one (1), which makes no adjustment.
The transportation aid formula has not been extensively studied in New Jersey since the
issuance of a Deloitte & Touche Consulting Group report issued in 1995. In lieu of a more
comprehensive analysis, the Department is recommending the continued use of the SFRA cost
parameters, with the addition of a CPI increase. Table 4.A outlines these changes.

‐74-
Table 4.A: Transportation Aid
Components
SFRA
(FY09) FY10 FY11 FY12 FY13*
Regular per-Pupil Base
Amount $383.88 $396.70 $396.70 $408.01 $415.72
Regular Average per-Mile $10.50 $10.85 $10.85 $11.16 $11.37
Special per-Pupil Base
Amount $2,675.77 $2,765.14 $2,765.14 $2,843.94 $2,897.69
Special Average per-Mile $5.10 $5.27 $5.27 $5.42 $5.52
Incentive Factor 1.0 1.0 1.0 1.0 1.0
*Recommended for FY13
E. STATE AVERAGE CLASSIFICATION RATE FOR GENERAL SPECIAL EDUCATION
SERVICES PUPILS AND FOR SPEECH-ONLY PUPILS
The special education and speech-only components of the SFRA are census-based
formulas. These formulas use the Statewide average classification rates of general special
education students and speech-only students multiplied by the districts total resident enrollment,
then multiplied by the excess cost for the respective classification. For FY13, the Department
has determined, based on Application for State School Aid (ASSA) data, the Statewide average
classification rate of general special education services to be 14.7% (from 14.69%) and the
Statewide average classification rate of speech-only students to be 1.77% (from 1.897%).
F. THE EXCESS COST FOR GENERAL SPECIAL EDUCATION SERVICES PUPILS AND FOR
SPEECH-ONLY PUPILS
The excess cost for general special education is determined using actual expenditures for
special education students from the 2010 Audit Summary, the most recent data available.
Inclusive of all pertinent costs, such as district-wide and mainstreaming costs in addition to
special education specific costs, the Department determined the total average expenditure for

‐75-
special education students for FY13 to be $26,139. Backing out the weighted average base cost
of $11,213, yields a per-pupil excess cost for general special education services pupils of
$14,929 for FY13.
In contrast to the excess cost for general special education, the per-pupil calculation for
speech-only pupils is based upon the resources outlined by the PJP model for “mild”li
classification pupils. The updated cost components derive a per-pupil speech-only cost of
$1,187 for FY13.
Table 5.A: Special Education and Speech per-Pupil
Amounts
SFRA (FY09) FY10 FY11 FY12 FY13*
General Special Ed Amount $10,897.00 $11,262.00 $11,262.00 $11,583.00 $14,929.00
Speech-Only Amount $1,081.61 $1,118.00 $1,118.00 $1,150.00 $1,187.00
* Recommended for FY13
G. EXTRAORDINARY SPECIAL EDUCATION AID THRESHOLDS
Extraordinary special education aid provides assistance to districts for students with
needs that require educational services that incur a high cost to the district. In brief,
extraordinary aid provides districts with a portion of the costs for high needs students that exceed
a certain cost threshold.
The SFRA made two main changes to the extraordinary aid calculation. First, was the
inclusion of support services costs, in addition to direct instructional costs, to the total allowable
cost. The allowable cost is used to determine the amount in excess of the threshold to be
included in the aid calculation. Second, was to delineate students into three placement
categories, with different aid calculation parameters for each. The three placement categories are
an in-district public school program, a separate public school program for students with
disabilities, and a separate private school for students with disabilities. For in-district programs,
the SFRA calculates extraordinary aid as 90% of the allowable costs that exceed $40,000.
Students in separate public school placements are calculated including 75% of costs that exceed
‐76-
$40,000. Finally, for those students in private placements, the calculation includes 75% of costs
exceeding $55,000.
The Department looked at the number and cost of applications for extraordinary aid
received since the start of SFRA. In contrast to most State aid programs, extraordinary aid is run
as a reimbursement program; districts submit applications in a given year for costs incurred in
the prior year. For this reason, there are only three years, FY09 to FY11, that the changes of
SFRA (described above) have been implemented. This data suggests significant changes to the
thresholds are not necessary at this time. For each of these years, approximately 5% of special
education students have applied for extraordinary aid. This signifies that the current thresholds
capture students with costs at or above the top 5% of all special education students. Additionally
the average cost of these students has remained relatively consistent across these three years. For
these reasons, the Department is not recommending any changes to the extraordinary aid
thresholds that are described in the SFRA.

‐77-
ATTACHMENT A
Fiscal Year New Jersey Consumer Price Index
FY09 2.89%
FY10 3.34%
FY11 1.60%
FY12 1.23%
FY13 1.89%
* The New Jersey CPI is the combined New York
and Philadelphia Urban Consumers index (CPI-U),
as calculated by the New Jersey Department of
Treasury.

‐78-
ATTACHMENT B
Salaries ‐ School Level Personnel
Classroom Teachers 62,989 12,834 75,823 68,730 15,464 84,194
Other Teachers 62,989 12,834 75,823 68,730 15,464 84,194
Librarians 77,135 12,953 90,087 77,663 15,589 93,252
Technology Specialists 53,262 20,715 73,976 56,592 25,928 82,520
Counselors 78,563 12,965 91,527 77,726 15,590 93,316
Nurses 65,311 12,853 78,165 73,506 15,531 89,037
Psychologists 73,945 12,926 86,871 79,364 15,613 94,977
Social Workers 69,421 12,888 82,308 77,666 15,589 93,255
LDTC 79,107 12,969 92,076 86,225 15,709 101,934
Instructional Aides 24,921 16,240 41,160 26,720 19,897 46,617
Clerical/Data Entry 37,250 18,186 55,437 39,382 22,453 61,835
Principal ‐ Elementary 119,503 13,308 132,811 127,575 16,288 143,863
Asst. Principal ‐ Elementary 100,708 13,151 113,859 107,540 16,008 123,547
Principal ‐ Middle 121,426 13,325 134,751 131,921 16,349 148,270
Asst. Principal ‐ Middle 101,084 13,154 114,238 110,190 16,045 126,235
Principal ‐ High 132,316 13,416 145,732 140,685 16,472 157,157
Asst. Principal ‐ High 109,453 13,224 122,677 117,712 16,150 133,862
Substitutes 127 ‐ 127 123 ‐ 123
Security Guard 34,168 17,700 51,868 30,697 20,700 51,397
Reading Specialists 75,488 12,939 88,426 79,779 15,619 95,398
Speech Pathologists 71,853 12,908 84,761 78,064 15,595 93,659
Resource Teacher/In‐Class 62,989 12,834 75,823 68,730 15,464 84,194
Self Contained/Pull‐Out 62,989 12,834 75,823 68,730 15,464 84,194
Occupational Therapist 66,749 12,865 79,614 74,683 15,548 90,230
Physical Therapist 72,809 12,916 85,725 80,524 15,629 96,153
Media Aides 33,155 17,540 50,695 33,670 21,300 54,970
School Directors 107,373 13,207 120,579 117,350 16,145 133,495
Parent Liasion 26,048 16,418 42,466 26,388 19,830 46,218
Lunchroom Aide 7,732 7,373 15,106 8,591 8,986 17,577
Average
Salary
Average
Benefits
Total ‐ Salary
plus Benefits
FY2009 (Used for SFRA) FY13
Average
Salary
Average
Benefits
Total ‐ Salary
plus Benefits

‐79-
ATTACHMENT B (CONT.)
Salaries ‐ Districtwide Level Personnel
Superintendent (Has Asst Sup) 184,502 13,854 198,357 175,000 16,952 191,952
Assistant Superintendent 115,323 13,273 128,597 162,547 16,778 179,324
Assistants to the Superintendent 53,033 20,678 73,711 58,496 26,312 84,809
Business Administrator 113,609 13,259 126,868 127,435 16,286 143,721
Assistant Business Administrator 68,165 12,877 81,042 76,461 15,572 92,033
Purchasing Agent 67,323 22,935 90,258 72,523 29,144 101,667
Purchasing Clerk 39,832 18,594 58,426 41,646 22,910 64,556
Accountant 76,440 24,374 100,814 84,222 31,506 115,728
Facil ities Manager 108,505 13,216 121,721 116,671 16,135 132,806
Business Clerks 39,941 18,611 58,552 41,508 22,882 64,391
Clerical/Data Entry 37,250 18,186 55,437 39,382 22,453 61,835
Technician 53,262 20,715 73,976 56,592 25,928 82,520
Programmer 89,238 26,395 115,633 87,586 32,186 119,771
Director 122,287 13,332 135,618 131,355 16,341 147,696
Supervisors 108,505 13,216 121,721 116,671 16,135 132,806
Coordinators 88,733 13,050 101,783 88,670 15,743 104,413
Salaries ‐ Plant Maintenance & Operations Personnel
Head Custodians 44,287 19,297 63,584 47,876 27,122 74,998
Custodians 26,282 16,455 42,737 28,465 22,005 50,471
Maintenance 40,061 18,630 58,691 42,386 25,675 68,061
Grounds 28,515 16,807 45,322 28,836 22,103 50,939
Buildings/Grounds Supervisor 51,170 20,384 71,555 53,662 28,647 82,310
FY2009 (Used for SFRA) FY13
Average
Salary
Average
Benefits
Total ‐ Salary
plus Benefits
Average
Salary
Average
Benefits
Total ‐ Salary
plus Benefits
i The Department of Education would like to thank Professor Sean Corcoran of New York University, Professor Eric
Hanushek of Stanford University, Professor Susanna Loeb of Stanford University, and Professor Cecilia Rouse of
Princeton University for their contributions to this Education Funding Report. ii The 31 former-Abbott districts include: Asbury Park, Bridgeton, Burlington City, Camden, East Orange, Elizabeth,
Garfield, Gloucester City, Harrison, Hoboken, Irvington, Jersey City, Keansburg, Long Branch, Millville, Neptune
Township, New Brunswick, Newark, Orange, Passaic, Paterson, Pemberton Township, Perth Amboy, Phillipsburg,
Plainfield, Pleasantville, Salem, Trenton, Union City, Vineland, and West New York.
‐80-
iii Note that changes in assessments in grades 3 and 4 in 2008-09 and changes in assessments for grades 5, 6, 7, and 8
in 2007-08 mean that longitudinal comparisons in those grades cannot accurately be compared over time. As seen in
the two charts representing this data, these changes account for the slight overall dip in NJASK scores in these two
years as represented by the dotted line. iv The College-Readiness Benchmark is a combined score of 1550 across the Verbal, Math, and Writing sections of
the SAT (out of a total possible score of 2400). v New Jersey’s relatively high expenditure is in part a reflection of its high wages and cost of living. However, even
after adjusting for wage differences, New Jersey’s state ranking remains largely unchanged. See Taylor (2006) and
http://www.edsource.org/data-per-pupil-spend-compare-using-cwi.html. vi Disentangling the effects of school resources from those of other influences on achievement is a difficult task. At
least one study found a positive impact of court-ordered aid to former-Abbott districts on eleventh grade test scores
between 1994 and 2001 (Resch, 2008). This study relied on 23 comparison school districts that were similarly
disadvantaged, but not part of the original Abbott litigation. vii These figures were calculated using the Digest of Education Statistics from various years. “Year” refers to the fall
of the academic year. All dollar amounts are expressed in 2009 dollars. viii Expenditures are current operating expenditures, which excludes capital expenditures. Revenues are from local,
state, and federal sources, and finance both current and capital expenditures. ix These figures were calculated using the Digest of Education Statistics from various years. “Year” refers to the fall
of the academic year. All dollar amounts are expressed in 2009 dollars. x See Digest of Education Statistics (2010). xi See Digest of Education Statistics, various years. xii Most, although not all, of the former-Abbott districts are in DFG “A.” For comparative purposes, the per-pupil
amounts in this section rely on data consistently available across all the years displayed. As the recently released
Taxpayers’ Guide to Education Spending (TGES) relies in part on data available only in recent years, these figures
will differ from those reported in the TGES. xiii See F-33 Survey of Local Government Finances: School Systems, 2008-09, conducted by the U.S. Census
Bureau. Only districts with an enrollment of at least 500 were compared.
xiv New Jersey Department of Education data. Means are weighted averages over districts, using average daily
enrollment as weights. All dollar amounts are expressed in 2009 dollars.
xv New Jersey Department of Education data. Means are weighted averages over districts, using average daily
enrollment as weights. All dollar amounts are expressed in 2009 dollars.
xvi See NAEP state profiles (http://nces.ed.gov/nationsreportcard/states/). New Jersey’s fourth and eighth grade
scores in reading were 231 and 275, versus the U.S. averages of 220 and 264. New Jersey’s fourth and eighth grade
‐81-
scores in mathematics were 248 and 294, versus the U.S. averages of 240 and 284. The maximum possible scale
score for both reading and mathematics is 500.
xvii See NAEP data explorer (http://nationsreportcard.gov/data_tools.asp). In eighth grade reading, the test score gap
between students eligible for the National School Lunch Program and those not eligible was 28 points. The
comparable gap in eighth grade mathematics was 29 points. In fourth grade reading and mathematics, the gaps were
25 and 24 points respectively. xviii Means are weighted averages over districts, using the number of test-takers in the particular grade and subject
and weights. xix The eighth grade test changed in 2007-08, preventing any direct comparison with later years.
xx Proficiency rates are weighted averages of districts, using the number of test-takers in the particular grade and
subject and weights. Because the 4th and 8th grade tests changed in 2008-09 and 2007-08, respectively, proficiency
rates are not comparable in later years.
xxi See Jonathan Kozol (1991). Savage Inequalities: Children in America’s Schools (New York: Crown Publishers)
and National Commissioner on Excellence in Education (1993). A Nation at Risk: The Imperative for Educational
Reform. See also Hanushek, Eric A. (1997). “Assessing the Effects of School Resources on Student Performance:
An Update.” Educational Evaluation and Policy Analysis 19, no. 2 (Summer): 141-164 and Hanushek, Eric A.
(2003). “The Failure of Input-Based Schooling Policies.” Economic Journal 113, no. 485 (February): F64-F98. xxii Hanushek, Eric A. (1992). “The Trade-off between Child Quantity and Quality,” Journal of Political Economy
100, no. 1 (February): 84-117. xxiii See the discussion in Dick Startz (2010). Profit of Education (Santa Barbara, CA: Praeger). xxiv Dobbie, Will and Roland G. Fryer (2011). “Are High-Quality Schools Enough to Increase Achievement among
the Poor? Evidence from the Harlem Children’s Zone,” American Economic Journal: Applied Economics 3, no. 3
(July): 158-87. xxv See Hanushek, Eric (2011). “The Economic Value of Higher Teacher Quality,” Economics of Education Review
30: 466-479; Hanushek, Eric (2011). “Valuing Teachers,” Education Next 11(3). xxvi Chetty, Raj, John Friedman, Nathaniel Hilger, Emmanuel Saez, Diane Schanzenbach, and Danny Yagan
(forthcoming). “How Does Your Kindergarten Classroom Affect Your Earnings? Evidence from Project STAR,”
Quarterly Journal of Economics. xxvii See http://www.nytimes.com/2010/07/28/business/economy/28leonhardt.html. xxviii See http://www.nctq.org/stpy11/reports/stpy11_national_report.pdf and
http://widgeteffect.org/downloads/TheWidgetEffect.pdf. xxix See http://www.ed.gov/news/speeches/fighting-wrong-education-battles (U.S. Secretary of Education Arne
Duncan endorsed using test scores as one element of teacher evaluation system). xxx See http://edreform.blogspot.com/2012/02/arne-duncan-at-harvards-ed-school.html.

‐82-
xxxi “Perth Amboy Superintendent: Tenure Laws Keep Bad Apples in the Classroom,” The Star-Ledger, November
23, 2011. xxxii See Hanushek, Eric et al (1994). Making Schools Work: Improving Performance and Controlling Costs
(Washington, D.C., Brookings Institution Press); Hassel, Bryan (2002). Better Pay for Better Teaching
(Washington, D.C., Progressive Policy Institute); Frederick M. (2002). Revolution at the Margins (Washington,
D.C., Brookings University Press); and http://articles.latimes.com/2011/oct/02/opinion/la-oe-winters-teachers-pay-
20111002. xxxiii The State will also identify top performers as “Reward Schools” and will closely monitor all schools not falling
into one of these three categories. However, Priority and Focus Schools will receive the lion’s share of State
attention. xxxiv In the last Abbott v. Burke decision, the Supreme Court ordered that the former-Abbott districts alone be fully-
funded under the SFRA. xxxv For purposes of completing this Report, the Department accepts the work of the PJPs as a method of determining
the “how much.” It does not, however, attach talismanic significance to the PJP process or the results of that
process. Rather, the Department believes that the education dollars called for by the PJPs, when coupled with the
policy reforms enumerated in Part II, are more than sufficient to teach all of New Jersey’s students to the Common
Core Standards and begin to close the State’s persistent achievement gap. xxxvi Abbott v. Burke, 960 A.2d 360, 365 (N.J. 2008). xxxvii For special education students, only two-thirds of special education costs are funded through Equalization Aid.
The other one-third is funded through Categorical Aid. A fuller explanation is provided later in the section. xxxviii The SFRA funding formula applies a Geographic Cost Adjustment (GCA) to the Adequacy Budget to account
for differences in wage markets throughout the State by county. For simplicity, however, the GCA is not considered
in this example. xxxix Additional changes to the costs, weights, and coefficients of the SFRA funding formula are included in the
Appendix to this Education Funding Report. However, because the recommendations described in this section are
significant, the Department thought it important to highlight them both in the body proper of the Report, as well as
in the Appendix. xl The combination at-risk/LEP student weight was excluded from this table because New Jersey is the only state to
use this construct. xli Chang, H.N. and M. Romero (2008). “Present, Engaged, and Accounted for: The Critical Importance of
Addressing Chronic Absence in the Early Grades,” National Center for Children in Poverty (Mailman School of
Public Health. Columbia University); “Attendance in Early Elementary Grades: Association with Student
Characteristics, School Readiness and Third Grade Outcomes,” Applied Survey Research, May 2011. xlii Balfanz, Robert, Lisa Herzog and Douglas J. MacIver (2007). “Preventing Student Disengagement and Keeping
Students on the Graduation Path in Urban Middle-Grades Schools: Early Identification and Effective Interventions,”

‐83-
Educational Psychologist 42(4): 223–235; “Destination Graduation: Sixth Grade Early Warning Indicators for
Baltimore City Schools, Their Prevalence and Impact,” Baltimore Education Research Consortium (Baltimore,
Maryland). xliii Allensworth, E. M. and J.Q. Easton (2007). “What Matters for Staying On-track and Graduating in Chicago
Public High Schools: A Close Look at Course Grades, Failures, and Attendance in the Freshman Year,” Consortium
on Chicago School Research (University of Chicago). xliv This takes a 1% increase in each New Jersey regular high school’s attendance rate in 2009-10 converted to
additional students * minimum instructional days (180) * school’s instructional time. xlv New Jersey State Auditor. Department of Agriculture Report issued on June 27, 2011. xlvi Sherman, Ted. “School Lunch Investigation in Elizabeth Leads to 3 Arrests, Including School Board President,”
The Star-Ledger, September 20, 2011. xlvii The CPI applied for all calculations, except utilities, is the combined New York and Philadelphia Urban
Consumers index (CPI-U), as calculated by the New Jersey Department of Treasury. The rates applied for each
fiscal year are shown in Attachment A. Utilities costs are inflated by using the CPI-Energy, calculated using both
New York and Philadelphia in the same manner used for the CPI-U calculation, described above. The calculated
increase was 84.3% from FY04 through FY13. xlviii The FICA rate is 7.65% of salary up to $106,800, after which the marginal rate drops to 1.45%. None of the
non-certificated staff have salaries that exceed this threshold. xlix For FY11, the CPI was set in accordance with Section 2 of P.L. 1999, c.168 (C.52:27D-442). l For half-day kindergarten students, the SFRA applies a 0.5 weight to the base per-pupil amount. li The “mild” classification category as used during the PJP process was defined as speech only.