education, caste and occupational differentials in
TRANSCRIPT

Volume 11, Issue 1, pp. 037 - 057
Article Info:
Received: 20/09/2020; Accepted: 19/10/2020 Corresponding Authors: *[email protected], **[email protected]
https://doi.org/10.48088/ejg.k.sun.11.1.37.57
Education, caste and occupational differentials in fertility in India Kalyan Sundar SOM1* Ranu P. MISHRA1**
1 Dr. Harisingh Gour Central University, India
Keywords: Population fertility, Child survival ratio, MORTPAK CEBCS application, Fertility Determinants, India
Abstract This study analyses the impact of four prominent factors (education, caste, occupation and development) on fertility in India. The study has also analysed the spatial variations of TFR in India. This spatial analysis also helps in identifying the impact of fertility on Development in India. Present study estimates fertility from census that covers all the reproductive age-women, and it does not allow any chance of sample error; this method has also adopted by UNFPA. Logistic regression analysis used to understand the impact of education, caste and occupation on fertility. Co-relation matrix and regression analysis used to determine the relation between TFR, IMR and Development. In India, West Bengal (2.41) state has the least fertility rate while Jammu and Kashmir (4.70) has highest one. Southern states have lower fertility along with Eastern states while North-east and central states have recorded high fertility. Women who have passed above secondary school of education give a prominent impact on fertility reduction in comparison to illiterate, primary and middle school passed. Marginal workers have very high fertility compare to main workers due to their feeling of insecurity in earnings and they increase number of child counted as gross family income.
© Association of European Geographers
The publication of the European Journal of Geography (EJG) is based on the European Association of Geographers’ goal to make European Geography a worldwide reference and standard. Thus, the scope of the EJG is to publish original and innovative papers that will substantially improve, in a theoretical, conceptual or empirical way the quality of research, learning, teaching and applying geography, as well as in promoting the significance of geography as a discipline. Submissions are encouraged to have a European dimension. The European Journal of Geography is a peer-reviewed open access journal and is published quarterly.

European Journal of Geography vol.11(1), pp.037-057, 2020 © Association of European Geographers
European Journal of Geography - ISSN 1792-1341 © All rights reserved 38
1. INTRODUCTION
Fertility is one of the most important components of population changes, while other two are migration and death. Optimum total fertility rate (TFR) is one of the important targets which help various ways to achieve sustainable development goals (SDGs) in India and some other developing countries. Population pressure which is the outcome of fertility leads to ever more land parcels to below substantive size and contribution soil degradation and to decreases the rate of development that’s why study on fertility is required immediate attention (Lopez-Carr D. et al., 2017).
To estimate TFR, various methods already exist such as proximate determine model (Bongaart,1978; Bongaart and Potter,1983), and Brass P/F ratio, its advanced version used by the Hobrcraft et. al. (1982). In India, another method to estimate TFR is indirect measurement of fertility from census at district level has also used in some of the studies (Gulimoto and Rajan, 2013), they have estimated fertility from the birth-TFR ratio method. In India SRS (sample registration system) is not too strong that level because certain proportion of the population fails to register births (Gulimoto and Rajan, 2013). Owing to this, present study estimates fertility from census which covers all the reproductive age-women, and it does not allow chance of any sample error rather than birth-TFR ratio; this method has also adopted by UNFPA (Moultrie and Zaba, 2013).
This study analyses fertility differentials by education, caste, economic activity and spatial factors. Women’s higher educational attainment has tended to bear the lower number of child by the way of increasing age at marriage and high probability to engage in work. Although fertility falls when level of education rises among both men and women (Pradhan, 2015). Imai and Sato (2010) strengthen the view, the proposition of the negative association between education and fertility by reducing gender bias through the level of education of women and men together, in Indian context. Education or schooling is expected to contribute to the measures of female autonomy (Basu 2002). It is believed that educated women have more freedom in decision making on a range of domestic and extra domestic matters and also have greater reproductive autonomy then uneducated women (Basu, 1992; Morgan and Niraula, 1995; Vlassoff, 1996; Jejeebhoy, 1995; Sathar 1996).
Some experts have used the role of incompatibility hypothesis to justify the relation between the women’s economic activity and fertility. It is difficult to work with a number of children rearing together because when a woman does job, she does not have sufficient time for rearing number of children simultaneously. Bhargava and Saxena (1986) recorded prominent inverse relationship between working women and fertility when the women engaged in white colour jobs. Haavio-Mannila E. (1978) examined the relationship between fertility and economic activity of women in Europe where he finds out that fertility decline and the increase of non-agricultural activity of women coincide in 16 out of 23 European countries. Economic change has the greatest impact on reducing family size and thus slowing population growth, compared to other factors (Science Daily, 2013).
In India, a village study of a Haryana state confirmed that fertility was inversely related to caste and socio-economic status (Arora, 1985). A caste factor prevails to decide the number of fertility though the intensity depends on the socio-economic factor of that caste (Ramesh, 2007).

Som, K. S. & Mishra, R. P. / European Journal of Geography vol.11(1), pp.037–057, 2020
European Journal of Geography - ISSN 1792-1341 © All rights reserved 39
Rural and urban fertility difference have been recorded due to the lower age at marriage in rural areas (Kulkarni, 2011 and Das Gupta et al. 1955). But, Mysore population research center has proved difference between rural-urban marital fertility that clearly exists (United Nations, 1961), while a study in Maharashtra did not show clear rural-urban difference (Dandaker & Dandekar, 1953, and Sovani & Dandekar, 1955). To this end, the key objectives of this study are:
i. To analyze the status of fertility among education groups, scheduled communities (SC and ST) and economic activity group of India for 2011 census.
ii. To examine the impact of education, caste and economic activities on fertility in India.
iii. To assess an impact of fertility on development scenario of Indian.
2. METHODS METHODOLOGY AND DATA
2.1 Methods and Methodology
2.1.1 TFR and ASOFRs Calculation
The AOSFRs that are calculated using the birth in the previous year are used (F-11and F-12 table of census of India, 2011) to project forward the parity distribution that would be expected for each cohart if those rates were continue for the rest of the cohart’s childbearing. This is done by calculating the order-specific equivalent of total fertility, that is the cumulated fertility rates for birth of the i-th order, cumulated for all age groups. This equation are follows:
(i)Derive age-order specific fertility rates: From the tabulation of births in the last year by age group (F-11 and F-12 table of census of India,2011) and parity of mother (F-3,F-4 table of census of India,2011), calculated age specific fertility rates for women in each age group 15-19, …., 45-49, by using following equation:
Again, women of unstated parity excluded from the denominator. denotes
births in the last year by mother age and parity and has the total number of women in the age group (Moultrie and Zaba, 2013).
(ii) Derive cumulated order-specific fertility rates: Cumulated age-order specific fertility rates up to age x+5 for order I calculated by using following equation:
It follows that - is a measure of the additional proportional of
women expected to achieve parity -I between age x+5 and the end of the reproductive period, on the assumption that future fertility will remain the same as current fertility (Moultrie and Zaba, 2013).
European Journal of Geography vol.11(1), pp.037-057, 2020 © Association of European Geographers
European Journal of Geography - ISSN 1792-1341 © All rights reserved 40
2.1.2. Infant Mortality Rate
To estimate the infant mortality rate of various states of India, this study used mean age at childbearing, children ever born and child surviving and then used the life table by the MORTPAK software with CEBCS application (Population Division, U.N. 2013).
2.1.3 Logistic regression
The logistic regression analysis used to understand the impact of education on fertility. For this analysis TFR has converted in dichotomous variables, where less than 3 TFR assigned as 1 and more than3 TFR assigned as two. 3 as used referenced because country’s average TFR is 2.99. For the analysis of impact of education on the fertility, countries population is divided into six educational categories. Illiterate has considered as a reference category. In this study, two types of caste categories are considered and scheduled tribe has considered as a reference category.
On the other hand, the occupation has classified in the six categories i.e. non-worker, marginal worker, main cultivators, main agricultural labourer, main household industry worker and main others worker (Job holder). This classification is based on the census of India, 2011.
2.1.4. Multiple Regression analysis
Co-relation matrix and regression analysis used to determine the impact of development (Infant mortality rate, per capita income, below poverty line, female literacy rate, and urbanization) on population fertility in India.
2.1.5. Diagrams and Thematic Mapping
For prompt representation of the regional variation among the states of India various thematic maps and graphs are prepared.
2.2 Data and Tabulation:
i. Worked out parity progression ratios (Parity by age group of women aged 15-49 or more) the data from Census Fertility Table, 2011 (F-3) have been used.
ii. Worked out Projected Parity Progression ratios- a. Parity by age group of women (aged 15-49 or less) from census fertility
table, 2011 (F-3). b. Number of children born during the preceding census, classified by
mother’s age (in five year groups) and number of children ever born from 2011 census (F-11).
iii. Estimated the infant mortality rate, for this we used F-03 table for child ever born and F-05 table used for child survival.
Som, K. S. & Mishra, R. P. / European Journal of Geography vol.11(1), pp.037–057, 2020
European Journal of Geography - ISSN 1792-1341 © All rights reserved 41
3. RESULTS AND DISCUSSION
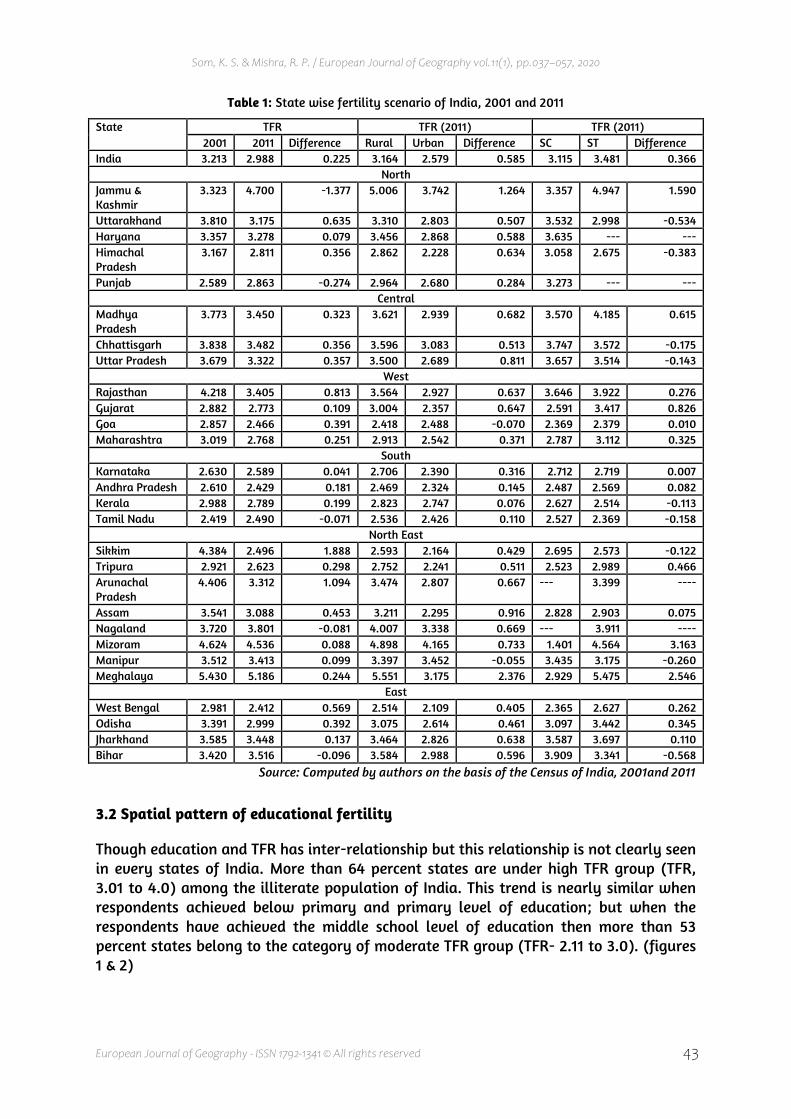
3.1 Spatial pattern of fertility
Among northern states, Jammu and Kashmir has the highest TFR (4.7), while Himachal Pradesh has the lowest TFR (2.811) in 2011.On the other hand, during 2001 census, the scenario of TFR was different in these states. Uttarakhand(3.81) was on the top and Punjab (2.59) was at the lowest. It is interesting to mention that Jammu & Kashmir and Punjab TFR have increased during 2001-11. IncreasedTFRin Jammu & Kashmir may be due to inappropriate quality data in the state during Kargil war.
In rural areas of northern states, Jammu & Kashmir has the highest TFR, while Himachal Pradesh has the lowest TFR. The similar situation is also recorded in urban centers of these states. The highest rural-urban difference in TFR is also recorded in Jammu & Kashmir (1.264) because of high disparity in the development between two regions, while the lowest in Punjab (0.28) may be the outcome of less disparity in the development (Figure-4). Jammu and Kashmir urban area developed while rural area least developed due to international conflict and terrorist activity.
Highest scheduled caste fertility recorded in the state of Haryana while Himachal Pradesh has lowest. In five northern states, Punjab and Haryana has no scheduled population. Jammu & Kashmir has the highest scheduled tribe fertility while Himachal Pradesh has the lowest. Scheduled caste fertility in all the northern states is above 3 and while in the context of scheduled tribe only one state has above 3.
Central region includes three empowered action group of states (Chhattisgarh, Madhya Pradesh and Uttar Pradesh). Chhattisgarh has the highest (3.84) TFR in this region and all the states have higher than 3.6 TFR in 2001. In 2011, Madhya Pradesh has the highest TFR in this region and all the states have higher than 3.3TFR.
Madhya Pradesh state has the highest TFR (3.62) in rural areas while Chhattisgarh state (3.08) has the highest TFR in urban areas. Rural-urban TFR differentialis highest in the state of Uttar Pradesh (0.81). Scheduled caste fertility is highest in the state of Chhattisgarh (3.747) and scheduled tribe fertility is highest in Madhya Pradesh (4.185). In the state of Madhya Pradesh scheduled tribe fertility is higher than scheduled caste fertility, while other two states have higher scheduled caste fertility than scheduled tribe.
Among states of western region (Rajasthan, Gujarat, Goa and Maharashtra), Rajasthan (an EAG state) has very high TFR (4.218 in 2001) and (3.405 in 2011). Goa is a developed state which has lowest TFR in this region during last two decades (i.e.2.857 in 2001 and2.466 in 2011). During 2001-2011, Rajasthan state has recorded fastest decline in fertility (diff.=0.813) while Gujarat state has recorded slowest decline in fertility (diff.=0.109).
In rural context, Rajasthan has the highest TFR (3.56) and Goa (2.42) the lowest in 2011. On the other hand, in urban centers, Rajasthan is on the highest and Gujarat is on the lowest. Rural-urban TFR difference is highest in the state of Gujarat (0.65), while in Goa rural fertility is lower than urban fertility. It may be the outcome of least disparity in the state. Scheduledcaste (3.646) and scheduled tribe (3.922) fertility is highest in the states of Rajasthan and lowest in Gujarat (2.369 in SC& 2.379 in ST). Gujarat has recorded the highest SC and ST fertility difference while Goa has the lowest.

European Journal of Geography vol.11(1), pp.037-057, 2020 © Association of European Geographers
European Journal of Geography - ISSN 1792-1341 © All rights reserved 42
Southern region includes four highly educated and developed states i.e. Karnataka, Andhra Pradesh, Kerala and Tamil Nadu. Kerala has the highest TFR (2.988) in 2001 and (2.789) 2011 in this region. Tamil Nadu, a developed state, has lowest TFR in this region during last two decades (2.419 &2.429 respectively). In this region, pace of fertility rate is decreasing at a slow rate and in Tamil Nadu fertility rate has slightly increased (0.071 only) in last decade. Rural-urban TFR difference is very low in this region (Figure-4). In rural areas, Kerala has the highest TFR (Rural 2.823, Urban 2.747) and Andhra Pradesh (Rural 2.469, Urban 2.324) has the lowest TFR in both the areas in 2011. Scheduled caste (2.712) and scheduled tribe (2.719) fertility is the highest in the states of Karnataka. Lowest SC TFR and lowest ST TFR have also recorded in Andhra Pradesh (2.487) and in Tamil Nadu (2.369). Kerala and Tamil Nadu states have higher SC fertility than ST while in other two states condition is reversed.
North-Eastern states include Sikkim, Tripura, Arunachal Pradesh, Assam, Nagaland, Mizoram, Manipur and Meghalaya. Among these eight north-eastern states, Tripura (2.921) has the lowest fertility and Meghalaya (5.43) has the highest in 2001. Sikkim, Arunachal Pradesh and Mizoram states have recorded fertility from 4 to 5; and Assam, Nagaland and Manipur have fertility between 3 and 4. According to 2001 census, this is the region with very high TFR (Table 1). In 2011census, Sikkim (2.446) has lowest TFR, while Meghalaya (5.186) has highest in this region. Sikkim (1.888) and Arunachal Pradesh (1.094) are the two very fast decreasing states but in contrary Nagaland (0.081) has only state in this region where fertility has increased from previous census (2001).
In rural areas, Meghalaya is the highest TFR (5.551) state and Sikkim (2.543) is the lowest in 2011. On the other hand, Mizoram (4.165) is on the highest position and Sikkim (2.164) has the lowest urban TFR. Meghalaya (2.376) and Assam (0.916) has strong Rural-urban TFR disparity in this region. Manipur has the highest scheduled caste TFR state, while scheduled tribe fertility is highest in the state of Meghalaya (5.475) and lowest ST TFR in Sikkim (2.573).
Eastern region includes four states i.e. Jharkhand, Bihar, Odisha and West Bengal. In 2001 census, low fertility has recorded in state of West Bengal (TFR-2.981), while Jharkhand has the highest fertility (TFR-3.585) among eastern region. While in 2011 census, West Bengal (2.412) has emerge India’s lowest fertility state as well as lowest in this region and Bihar (3.516) has highest fertility among these states. Bihar has recorded slightly increasing in the fertility in last decade, while west Bengal has fastest decreasing states among these states.
Both in urban and rural areas, Bihar has the highest TFR state and West Bengal has the lowest in 2011 (Table 2). Jharkhand (0.638) has strong Rural-urban TFR disparity in this region. Bihar (3.909) has the highest scheduled caste TFR and lowest SC TFR in West Bengal (2.365). Scheduled tribe fertility is highest in the state of Jharkhand (3.697) and lowest ST TFR in West Bengal (2.627). In Bihar SC fertility is higher than the ST while in other states the condition is reversed. Five major states (Jammu and Kashmir, Bihar, Tamil Nadu, Punjab and Nagaland) have recorded an increase in their total fertility rate in last decade, while all other states have recorded a reduction in the TFR (Figure-2). This fertility reduction ranges from 0.041 (Karnataka) to 1.89 (Sikkim).
Som, K. S. & Mishra, R. P. / European Journal of Geography vol.11(1), pp.037–057, 2020
European Journal of Geography - ISSN 1792-1341 © All rights reserved 43
Table 1: State wise fertility scenario of India, 2001 and 2011
State TFR TFR (2011) TFR (2011) 2001 2011 Difference Rural Urban Difference SC ST Difference
India 3.213 2.988 0.225 3.164 2.579 0.585 3.115 3.481 0.366 North
Jammu & Kashmir
3.323 4.700 -1.377 5.006 3.742 1.264 3.357 4.947 1.590
Uttarakhand 3.810 3.175 0.635 3.310 2.803 0.507 3.532 2.998 -0.534 Haryana 3.357 3.278 0.079 3.456 2.868 0.588 3.635 --- --- Himachal Pradesh
3.167 2.811 0.356 2.862 2.228 0.634 3.058 2.675 -0.383
Punjab 2.589 2.863 -0.274 2.964 2.680 0.284 3.273 --- --- Central
Madhya Pradesh
3.773 3.450 0.323 3.621 2.939 0.682 3.570 4.185 0.615
Chhattisgarh 3.838 3.482 0.356 3.596 3.083 0.513 3.747 3.572 -0.175 Uttar Pradesh 3.679 3.322 0.357 3.500 2.689 0.811 3.657 3.514 -0.143
West Rajasthan 4.218 3.405 0.813 3.564 2.927 0.637 3.646 3.922 0.276 Gujarat 2.882 2.773 0.109 3.004 2.357 0.647 2.591 3.417 0.826 Goa 2.857 2.466 0.391 2.418 2.488 -0.070 2.369 2.379 0.010 Maharashtra 3.019 2.768 0.251 2.913 2.542 0.371 2.787 3.112 0.325
South Karnataka 2.630 2.589 0.041 2.706 2.390 0.316 2.712 2.719 0.007 Andhra Pradesh 2.610 2.429 0.181 2.469 2.324 0.145 2.487 2.569 0.082 Kerala 2.988 2.789 0.199 2.823 2.747 0.076 2.627 2.514 -0.113 Tamil Nadu 2.419 2.490 -0.071 2.536 2.426 0.110 2.527 2.369 -0.158
North East Sikkim 4.384 2.496 1.888 2.593 2.164 0.429 2.695 2.573 -0.122 Tripura 2.921 2.623 0.298 2.752 2.241 0.511 2.523 2.989 0.466 Arunachal Pradesh
4.406 3.312 1.094 3.474 2.807 0.667 --- 3.399 ----
Assam 3.541 3.088 0.453 3.211 2.295 0.916 2.828 2.903 0.075 Nagaland 3.720 3.801 -0.081 4.007 3.338 0.669 --- 3.911 ---- Mizoram 4.624 4.536 0.088 4.898 4.165 0.733 1.401 4.564 3.163 Manipur 3.512 3.413 0.099 3.397 3.452 -0.055 3.435 3.175 -0.260 Meghalaya 5.430 5.186 0.244 5.551 3.175 2.376 2.929 5.475 2.546
East West Bengal 2.981 2.412 0.569 2.514 2.109 0.405 2.365 2.627 0.262 Odisha 3.391 2.999 0.392 3.075 2.614 0.461 3.097 3.442 0.345 Jharkhand 3.585 3.448 0.137 3.464 2.826 0.638 3.587 3.697 0.110 Bihar 3.420 3.516 -0.096 3.584 2.988 0.596 3.909 3.341 -0.568
Source: Computed by authors on the basis of the Census of India, 2001and 2011
3.2 Spatial pattern of educational fertility
Though education and TFR has inter-relationship but this relationship is not clearly seen in every states of India. More than 64 percent states are under high TFR group (TFR, 3.01 to 4.0) among the illiterate population of India. This trend is nearly similar when respondents achieved below primary and primary level of education; but when the respondents have achieved the middle school level of education then more than 53 percent states belong to the category of moderate TFR group (TFR- 2.11 to 3.0). (figures 1 & 2)

European Journal of Geography vol.11(1), pp.037-057, 2020 © Association of European Geographers
European Journal of Geography - ISSN 1792-1341 © All rights reserved 44
Figure 1. Educational Fertility in India, 2011 Figure 2. Fertility Differentials in India, 2001-11
There is strong difference of respondents who have matric education and below the level for achieving the level of fertility, same opinion that only after reaching a certain minimum level of education has greater impact on fertility (Jaffe, 1959; Coachrane, 1979, 1983; Encarnacion, 1974; Stycos, 1965). Among the graduate level of education and above, 32 percent states recorded below replacement level of fertility and no one states have fertility among vary high TFR (TFR, above 4.01) group (Table 2). It is interesting to mention that in India only 6.69 percent women in reproductive age have graduate and higher level of education (Table 2).
Table 2. Educational fertility scenario of India, 2011
Source: Computed by the authors on the basis of the Census of India, 2011. Note: Figures in parentheses indicate percentage distribution of the educational group.
3.3 Spatial pattern of scheduled caste and tribal fertility
After independence government of India has introduced several welfare schemes to uplift these communities (Kulkarni, 2002) and therefore situation improved but the gap is still prevailed.
Count (TFR)
Educational Level
Graduate and Above
Matric or secondary but
below graduate
Middle but below matric or
secondary
Primary but below middle
Literate but below
primary
Illiterate
<2.1 9 (32.14%) 2 (7.14%) 0 0 0 1 (3.57%)
2.11-3.00 16 (57.14%) 21 (75%) 15 (53.57%) 13 (46.43%) 13 (46.43%) 9 (32.14%)
3.01-4.00 3 (10.72%) 4 (14.29%) 10 (35.71%) 12 (42.86%) 11 (39.28%) 14 (50%)
>4.01 0 1 (3.57%) 3 (10.72%) 3 (10.72%) 4 (14.29%) 4 (14.29%)
Total no of States
28 28 28 28 28 28

Som, K. S. & Mishra, R. P. / European Journal of Geography vol.11(1), pp.037–057, 2020
European Journal of Geography - ISSN 1792-1341 © All rights reserved 45
Among the twenty-eight states, two states (Arunachal Pradesh and Nagaland) have no schedule caste population. Only one state has below replacement level of fertility while 13 (50 %) states have 3+ TFRin case of SCs population. No state has four plus fertility among SC background in India.
Scheduletribesare settled in the area of forest and hilly land far from the major settlement areas. Among the twenty-eight states, two states (Punjab and Haryana) have no schedule tribe population. No other state has reached below replacement level in case of STs population. More than 57 percent states have 3+ TFR in case of STs population while 43 percent of state ST population fertility between 2.11 to 3.00. Differentials among schedule castes and tribes are higher in Mizoram and Jammu & Kashmir. Schedule tribe fertility is higher in most of the states than schedule caste fertility expect nine states (Figure 3 & 4).
Figure 3.SC and ST Fertility Differential in India, 2011 Figure 4.Rural-Urban Fertility Differential in India, 2011
Table 3.Caste wise fertility scenario of India, 2011
Count (TFR)
Caste Total
SC ST
<2.1 1(3.85%) 0 1
2.11-3.00 12 (46.15%) 11 (42.31%) 23
3.01-4.00 13 (50%) 11(42.31%) 24
>4.01 0 4 (15.38%) 4
Total 26 26 52
Source: Computed on the basis of the Census of India, 2011. Note: Figures in parentheses indicate percentage distribution of the caste group
3.4 Spatial pattern of economic activity wise fertility
Higher proportion of employment among women is considered to be a positive indicator to curb fertility (Mandelbaum, 1974; United Nations, 1961) than non-earning women. Fertility behavior is affected by the nature of the work done by women; normally

European Journal of Geography vol.11(1), pp.037-057, 2020 © Association of European Geographers
European Journal of Geography - ISSN 1792-1341 © All rights reserved 46
employed women have low fertility than the non-earning women (Jaffe and Azumi, 1968; Stycos, 1965; Whelpton et. al. 1966; Goldstein 1972; Devanzo, 1972, Weller, 1977, Germain, 1975). In India, among main workers, cultivators have the highest TFR in 2011 due to increasing demand of labour force from household. Main agriculture labourershave TFR 2.816 in 2001. Other workers have very low fertility due to majority of eligible married women in this group has engaged in a government job with sufficient income or have income security. Average fertility (TFR-2.735) of the main worker group in India in 2011 is lower than the marginal (TFR-3.235) and non-worker fertility (TFR-3.033).
Northern region including the state of Jammu and Kashmir, Himachal Pradesh, Punjab, Uttarakhand and Haryana and have 82.98 million populations which is 6.86 % of the country. Marginal worker fertility has higher than the main and non-worker in northern states, except Punjab. Marginal worker feel insecurity regarding income and they produce more number of childrentoincrease their income by way of wage earner. Among the main worker, others worker have lowest fertility because they are mainly permanent wage earner and have a job security.Fertility among cultivators in Punjab (TFR 2.303) is low due to their economic prosperity than other states. Agricultural labourers have lowest fertility (TFR 2.951) in Himachal Pradesh. Three states viz. Himachal Pradesh, Uttarakhand and Haryana are richin household industry (silk, woodwork and handicraft), and, therefore, TFR is lower than cultivators and labourers in these states.
Central region includes three empowered action group of states (Chhattisgarh, Madhya Pradesh and Uttar Pradesh) and have 297.72 million population which is 24.6 % of the country. In this state, fertility is higher in the marginal workersthan main and non-workers. Among the main workers, other group has only less than TFR 3, whilefertility in all other group has recorded less differential.
Western region includes four statesviz. Rajasthan, Gujarat, Goa and Maharashtra; they have 242.83 million populations, which is 20.07 % of the country.Marginal workers have fertility higher than that of the main and non-workers (expect Goa).Cultivators have highest fertility in Gujarat (TFR 2.937) and Maharashtra (2.997). Agricultural Labour has highest fertility in the state of Rajasthan (3.594). Goa has very high difference between the non-workers fertility and main & marginal workers fertility. Maharashtra and Rajasthan have minimum difference across the economic groups. In this region,fertility in others group has reached below replacement level, except Rajasthan.
Southern region includes four highly educated and developed states viz. Karnataka, Andhra Pradesh, Kerala and Tamil Naduand they have 216.33 million populations, which is 17.88 % of the country. In southern states, impact of economic activity has clearly observed, and this trend moves from main and marginalworkers towards non workers. Among the main workersfertility among different economic groups has nearer to Karnataka and Andhra Pradesh and below replacement level in Kerala and Tamil Nadu. Non workers have high fertility among all the southern states (2.646) when comparison made with other states of the country. Andhra Pradesh has the minimum fertility difference across the economic activities group.
North-Eastern states include Sikkim, Tripura, Arunachal Pradesh, Assam, Nagaland, Mizoram, Manipur and Meghalayaand have 42.86 million populations, which is 3.54 % of the country. Nagaland and Arunachal Pradesh have the highest fertility among main

Som, K. S. & Mishra, R. P. / European Journal of Geography vol.11(1), pp.037–057, 2020
European Journal of Geography - ISSN 1792-1341 © All rights reserved 47
workers than marginal and non-worker. Manipur (2.256) has the lowest fertility in main worker group. Tripura (2.256), Sikkim (2.388) and Assam (2.702) have the fertility below three in the main workers group, while Nagaland (4.364) and Meghalaya (5.234) have extremely high fertility among main workers; this figure was seen earlier in 19’s century in India. It is interesting to mention here that Manipur has the highest fertility in the other main workers group which is not normally seen in other states.
Table 4: Economical activity wise fertility in India States, 2011
State Main Worker Marginal Worker
Non worker Cultivators Agricultural
Labourers Household industry worker
Others Average
India 3.150 2.816 2.830 2.162 2.735 3.235 3.033
Northern states
Jammu & Kashmir 4.180 4.478 4.609 3.976 4.168 5.312 4.571
Himachal Pradesh 2.967 2.951 2.318 2.251 2.830 2.963 2.742
Punjab 2.303 2.987 2.642 2.373 2.487 2.833 2.916
Uttarakhand 3.316 3.259 2.922 2.380 3.142 3.196 3.214
Haryana 3.156 3.565 3.020 2.663 3.012 3.454 3.319
Central states
Uttar Pradesh 3.078 3.372 3.278 2.754 3.067 3.427 3.343
Chhattisgarh 3.626 3.514 3.218 2.509 3.414 3.626 3.448
Madhya Pradesh 3.598 3.616 3.703 2.678 3.466 3.709 3.312
Western states
Rajasthan 3.584 3.594 3.400 2.861 3.431 3.758 3.157
Gujarat 2.937 2.854 2.263 2.152 2.591 3.232 2.652
Goa 2.231 1.335 2.010 1.632 1.663 1.573 2.751
Maharashtra 2.997 2.863 2.437 1.992 2.737 2.809 2.818
Southern states
Karnataka 2.187 2.578 2.374 1.705 2.295 2.587 2.773
Kerala 2.352 1.581 1.934 1.762 1.785 2.004 2.978
Tamil Nadu 2.370 2.075 2.288 1.458 1.930 2.104 2.830
Andhra Pradesh 2.453 2.220 2.297 1.873 2.208 2.306 2.646
North Eastern states
Nagaland 4.665 4.097 3.174 3.354 4.364 3.768 3.211
Arunachal Pradesh 3.957 3.922 3.407 3.066 3.723 3.507 2.872
Manipur 1.679 1.613 1.917 3.015 1.697 3.446 3.584
Mizoram 4.048 3.480 3.577 3.326 3.842 4.846 5.041
Tripura 2.658 2.323 2.239 2.001 2.256 2.668 2.673
Meghalaya 5.888 5.423 5.834 3.938 5.234 5.457 5.052
Assam 3.012 2.839 2.827 2.474 2.702 3.106 3.184
Sikkim 2.763 2.948 2.253 1.475 2.388 2.597 2.572
Eastern states
West Bengal 2.168 2.159 2.946 1.803 2.218 2.462 2.431
Jharkhand 3.719 3.487 4.123 2.988 3.446 3.698 3.270
Odisha 3.024 2.855 2.828 2.308 2.700 3.116 2.998
Bihar 3.166 3.594 3.282 2.899 3.345 3.689 3.497
Source: Computed on the basis of the Census of India, 2011

European Journal of Geography vol.11(1), pp.037-057, 2020 © Association of European Geographers
European Journal of Geography - ISSN 1792-1341 © All rights reserved 48
3.5 Comparison of TFR in EAG and Non-EAG states
The EAG states comprise 45.9 percent of the country’s population, as consequence of this; India’s population future lies on by the condition of these states. In EAG states TFR is recorded 3.35 in last census (Census of India, 2011) while, developed states (Table-5) have only 2.63 TFR.
Table 5.EAG and Non EAG states TFR Comparision
Region States Mean TFR EAG Bihar, Jharkhand, Chhattisgarh, Madhya Pradesh, Uttar Pradesh,
Uttarakhand, Rajasthan, Odisha 3.35
Non EAG Other than EAG States 3.14 Developed West Bengal, Tamil Nadu, Kerala, Goa, Punjab, Maharashtra 2.63
Source: Computed on the basis of the Census of India, 2011 In recent years, theses states have experienced improvements in various socio-
economic indicators; therefore, they have reached to the stage that was recorded in southern states like Kerala and Tamil Nadu 30 years ago (SRS 1980-2010). However, policy and programmes focusing on family planning need higher attention in EAG states (Srivastava et al, 2012).
3.6 Age – Specific fertility rate
3.6.1 EAG and Non- EAG comparison of ASFR
Chhattisgarh state has very high fertility of lower age group, while Uttar Pradesh has the least position in fertility of low age group among EAG state. This is an interesting fact that West Bengal is the least fertility state in India but it also has very high fertility in lower age group than that of the EAG states (expect Chhattisgarh) (Table-6).
Table 6.EAG and Non EAG states comparison ASFR
Year 15-19 20-24 25-29 30-34 35-39 40-44 45-49 Uttar Pradesh 0.091 0.177 0.152 0.099 0.057 0.042 0.046 Madhya Pradesh 0.124 0.229 0.154 0.077 0.038 0.031 0.037 Uttarakhand 0.114 0.225 0.154 0.071 0.029 0.018 0.024 Chhattisgarh 0.144 0.238 0.156 0.076 0.034 0.023 0.025 Bihar 0.107 0.188 0.156 0.100 0.060 0.045 0.047 Jharkhand 0.136 0.197 0.145 0.087 0.049 0.036 0.039 Rajasthan 0.103 0.216 0.156 0.083 0.042 0.035 0.046 Odisha 0.126 0.189 0.139 0.073 0.033 0.019 0.022 Kerala 0.118 0.183 0.142 0.068 0.022 0.010 0.016 West Bengal 0.140 0.152 0.086 0.042 0.020 0.018 0.023
Source: Computed on the basis of the Census of India, 2011 It is evident from the facts mentioned in Table 8 that two developed states viz. West
Bengal and Kerala has low fertility and it has started fast decreasing from age group of 25-29 years in West Bengal and from age group of 30-34 years in Kerala, it is an indication of more acceptance of permanent method of contraception in these age groups. On the other hand, fertility decrease through age groups is very slow in EAG

Som, K. S. & Mishra, R. P. / European Journal of Geography vol.11(1), pp.037–057, 2020
European Journal of Geography - ISSN 1792-1341 © All rights reserved 49
states and it is continuously high in the higher age groups, it is an indication of lower use of contraception.
3.6.2 Educational ASFR
In India, among all the educational groups of reproductive women the highest fertility has recorded in the age group of 20-24 years expect graduate and above level education. Normally, education and fertility has an inverse relationship, women do the negative association between these two variables becomes prominent (Jaffe, 1959; Coachrane, 1979, 1983; Encarnacion, 1974; Stycos, 1965). It is also recorded in this country that this association has only after certain level of education.
The age specific fertility rate shows that there is a clear distinction in the lower age between below secondary education level and above. In all the age groups the ASFR is lower in above secondary level than below secondary level. Illiterate women have very high fertility in both lower and higher age group (Figure 5).
Figure 5. Educational group wise age specific fertility rate
3.6.3Caste wise ASFR
In India, among Scheduledcastes and tribes the highest fertility has recorded in the age group of 20-24 years. Scheduledcaste fertility is higher in all the age group when comparison made with Scheduled tribes. It is quite interesting to mention that in the later age SC and ST fertility is similar. Higher fertility in lower age group among scheduled tribe women is the main issues of concern in India (Figure 6).

European Journal of Geography vol.11(1), pp.037-057, 2020 © Association of European Geographers
European Journal of Geography - ISSN 1792-1341 © All rights reserved 50
Figure 6.Caste group wise age specific fertility rate
3.6.4 Rural-Urban ASFR
In rural areas, lower age at marriage of girls is a long tradition that has clear impact on the present fertility level. Lower age specific fertility is much higher than that of the urban centers because women in urban areas have a tendency to more engagement in education and occupation (Table-7). On the other hand, in the upper age group this gap in ASFR has reduced than the lower age group.
Table 7.Rural and urban comparision of ASFR
Year 15-19 20-24 25-29 30-34 35-39 40-44 45-49 Rural 0.119 0.198 0.138 0.075 0.038 0.029 0.035 Urban 0.099 0.165 0.120 0.062 0.026 0.018 0.026
Source: Computed on the basis of the Census of India, 2011
3.7 Impact of education, caste and occupation on fertility
The impact of education, caste and occupation is clearly found in this study. It is evident from the data presented in the table 8,9,10,11,12 and 13; it is found that educational level, caste and economic activity have their impact on the fertility.
Table 8.Model summary for education
a. Estimation terminated at iteration number 5 because parameter estimates changed by less than .001.
Table 9.Model summary for caste
a. Estimation terminated at iterationnumber 3because parameter estimates changed by lessthan .001.
Step -2 Log likelihood Cox & Snell R Square Nagelkerke R Square
1 198.885a .153 .206
Step -2 Log likelihood Cox & Snell R Square Nagelkerke R Square
1 109.668a .015 .020

Som, K. S. & Mishra, R. P. / European Journal of Geography vol.11(1), pp.037–057, 2020
European Journal of Geography - ISSN 1792-1341 © All rights reserved 51
Table 10. Model summary for occupation
a. Estimation terminated at iteration number4 because parameter estimates changed by lessthan .001.
3.7.1 Statistical test of predictors
The statistical significance of individual regression coefficients (β) is tested using the Wald chi-square statics (Table 11, 12&13). It is evident from Table 11, that education level is significant predictor of TFR of more than 3 (Sig. <0.001). Graduate and above are significant predictors of TFR of more than 3 (Sig. <0.005) (Table 11).
Table 11. Logistic regression analysis – impact of education
Counts β S.E. Wald df Sig. Exp(β)
Educational status 21.417 5 .001
Graduate and above -2.556 .723 12.486 1 .000 .078
Matric or secondary but below graduate -1.961 .627 9.784 1 .002 .141
Middle but below matric or secondary -.578 .542 1.141 1 .286 .561
Primary but below middle -.292 .542 .291 1 .590 .747
Literate but below primary -.292 .542 .291 1 .590 .747
Constant (Illiterate) .435 .387 1.266 1 .261 1.545 Source: Calculated by the authors by using 2011 census data.
Table 12 shows that, SC and ST population are predictor but not the significance level (<0.05). On the other hand, Table 13, clearly shows that non worker, marginal worker, main worker cultivators, main agricultural labourer and Others main workers (job) population are significant predictors of TFR of more than 3 (Sig.<0.05), while main household industry worker population is significant at the level of 0.1
Table 12. Logistic regression analysis – impact of caste
Source: Calculated by the authors by using 2011 census data.
Table 13. Logistic regression analysis – impact of economic activity
Count β S.E. Wald df Sig. Exp(β)
Economical Activity 8.958 5 .111
Non-Worker 1.299 .596 4.756 1 .029 3.667
Marginal Worker 1.735 .602 8.315 1 .004 5.667
Main Cultivators 1.299 .596 4.756 1 .029 3.667
Main Agricultural Labourers 1.156 .596 3.758 1 .053 3.178
Main Household Industry worker
1.012 .598 2.859 1 .091 2.750
Step -2 Log likelihood Cox & Snell R Square Nagelkerke R Square
1 221.166a .059 .079
Count β S.E. Wald df Sig. Exp( β)
Caste 1.221 2 .543
SC -.620 .561 1.221 1 .269 .538
Constant (ST) .310 .397 .610 1 .435 1.364

European Journal of Geography vol.11(1), pp.037-057, 2020 © Association of European Geographers
European Journal of Geography - ISSN 1792-1341 © All rights reserved 52
Constant (Others /Job) -1.299 .461 7.958 1 .005 0.273 Source: Calculated by the authors by using 2011 census data.
3.7.2 Model Results:
Illiterate population has 1.545 times probability to record higher occurrence of more than 3 TFR in India. All others educational groups have inverse impact on fertility when compare with the illiterate educational group. Literate and primary educated population has 2 times and middle educated population has 3 times lower probability to occurrence more than 3 TFR as compared to the illiterate educational group in the country. On the other hand, above secondary and below graduate has 17times and above graduate has 19 times lower probability to occurrence more than 3 TFR as compared to illiterate educational group. Above mention facts proved that educational difference has highly persists between below secondary education and above (Table 11).
In case of caste, schedule caste population has 2 times lower probability to record higher 3 fertility in the country in reference to schedule tribe (Table 12). In case of occupational impact in fertility, Main other (job) worker has inverse impact on fertility with very lower probability to occurrence of more than 3 TFR. In reference to main others workers, all other categories have positive impact to higher occurrence to more than 3 TFR. Non-worker and main cultivators have similar impact while marginal worker has 5 times higher probability to occurrence more than 3 TFR (Table 13). To make income security marginal workers tend to produce more children as they will be additional hands for earnings in their family.
3.8 Inter-relationship between TFR, IMR and development
After analyzing the spatial pattern of fertility in various contexts, present study finds out the inter-relationship between total fertility rate, infant mortality rate and development. In this study, estimation of TFR (Moultrie and Zaba, 2013) and IMR (UNDP-MORTPAK, 4.3 versions) based on census (2011), while indicators of development considered are (i) per capita income, (ii) below poverty line, (iii) female literacy rate and, (iv) urbanization. A correlation analysis done in this study reveals that there is a strong relationship between TFR, IMR and development in India (Table 14).
Table-14.Co-relation matrix of TFR, IMR and development
TFR IMR PCI BPL FLR URBAN
TFR
0.597 -0.505 0.349 -0.567 -0.657 IMR 0.597
-0.701 0.644 -0.567 -0.770
PCI -0.505 -0.701
-0.797 0.703 0.807 BPL 0.349 0.644 -0.797
-0.507 -0.689
FLR -0.567 -0.567 0.703 -0.507
0.845 URBAN -0.657 -0.770 0.807 -0.689 0.845
Source: Computed on the basis of the Census of India, 2011 High fertility increases the number of infant death due to frequent pregnancy and
their complications which is an outcome of lower age at first birth and low spacing of consecutive birth (Som and Mishra, 2017).

Som, K. S. & Mishra, R. P. / European Journal of Geography vol.11(1), pp.037–057, 2020
European Journal of Geography - ISSN 1792-1341 © All rights reserved 53
Table 15.Population fertility and infant mortality
Estimate Std. Error t value Pr(>|t|) (Intercept) 12.551467 3.736604 3.359 0.00568 ** Infant Mortality Rate 0.010549 0.004096 -2.575 0.02431 * Signif. codes: 0 ‘***’ 0.001 ‘**’ 0.01 ‘*’ 0.05 ‘.’ 0.1 ‘ ’ 1 Multiple R-squared: 0.3559, Adjusted R-squared: 0.3023, p-value: 0.02431
Source: Calculated by the authors Fertility is also associated with high infant and child mortality. Fertility is high
among people who experience high infant and child mortality (Taylor et. al., 1976; Davis, 1963; Freedman, 1964; Singh, 1986), because people continue childbearing until a desired size of children, which they rationalize for various socio-economic and cultural reasons, is obtained. Income and fertility are dependent on each other. On the other hand, per capita income inversely related to fertility and respondent which have below poverty line has a positive relation with fertility. This statement clearly supports that the child bearing is an economic aspect, where high income group produce low number of child for better care and reducing child bearing cost while poor people (BPL) produce more number of children for the consideration of more wage earners by them (Becker, 1960).
Fertility can control by the income in two ways, i.e. (i) higher per capita income has other distinct characteristics such as higher educational levels, urban livelihood that affect their fertility decisions from other. (ii) Income has simply reflected the effect on fertility decisions (Price, 2013).
Fertility and per capita income has inverse relationship as per capita income has influenced 19 percent TFR variability with 0.01significance level (Table 16). It is interesting to mention that, first assumption given above is proved in this study (Table 17 & 18).
Table 16.Population fertility and per capita income
Estimate Std. Error t value Pr(>|t|) (Intercept) 3.486e+00 2.903e-01 12.011 4.79e-08 *** Per capita income -3.283e-05 1.622e-05 -2.024 0.0658 . Signif. codes: 0 ‘***’ 0.001 ‘**’ 0.01 ‘*’ 0.05 ‘.’ 0.1 ‘ ’ 1 Multiple R-squared: 0.2546, Adjusted R-squared: 0.1924, p-value: 0.06579
Source: Calculated by the authors
Table 17.Per Capita income and female literacy rate
Estimate Std. Error t value Pr(>|t|) (Intercept) -1450.33 5500.69 -0.264 0.79651 Female Literacy Rate 328.12 95.95 3.420 0.00508 ** Signif. codes: 0 ‘***’ 0.001 ‘**’ 0.01 ‘*’ 0.05 ‘.’ 0.1 ‘ ’ 1 Multiple R-squared: 0.4936, Adjusted R-squared: 0.4514, p-value: 0.00508
Source: Calculated by the authors
Table 18.Per capita income and urbanization
Estimate Std. Error t value Pr(>|t|) (Intercept) 2636.72 3175.33 0.830 0.422539 Female Literacy Rate 431.31 91.09 4.735 0.000485 ***

European Journal of Geography vol.11(1), pp.037-057, 2020 © Association of European Geographers
European Journal of Geography - ISSN 1792-1341 © All rights reserved 54
Signif. codes: 0 ‘***’ 0.001 ‘**’ 0.01 ‘*’ 0.05 ‘.’ 0.1 ‘ ’ 1 Multiple R-squared: 0.6513, Adjusted R-squared: 0.6223, p-value: 0.0004846
Source: Calculated by the authors Female literacy rate also helps to curb down fertility by creating awareness among
women in India. Female literacy rate has negative relationship with fertility and positive with family planning program. It is proved in this study that female literacy has inverse relation (r=-0.32) with the fertility (Table 19).
Urbanization has many faces of development such as good health facility, high level of educational facilities and higher living standard which impact to curb fertility. Many studiesproved the fact, where most recent one of them is Guo et al. (2011) observes that not only was urbanization important in China’s fertility decline but that it will become the primary factor in future fertility decline, allowing China to relax its one child policy.This study proves that urbanization is a significant indicator to curb down fertility (r = - 0.43) (Table- 20).
Table 19.Population fertility and female literacy rate
Estimate Std. Error t value Pr(>|t|) (Intercept) 3.895151 0.414304 9.402 6.95e-07 *** Female Literacy Rate -0.017232 0.007227 -2.384 0.0345 * Signif. codes: 0 ‘***’ 0.001 ‘**’ 0.01 ‘*’ 0.05 ‘.’ 0.1 ‘ ’ 1 Multiple R-squared: 0.3215, Adjusted R-squared: 0.2649, p-value: 0.03448
Source: Calculated by the authors
Table 20.Population fertility and Urbanization
Estimate Std. Error t value Pr(>|t|) (Intercept) 3.687502 0.263675 13.985 8.64e-09 *** Urbanization -0.022862 0.007564 -3.022 0.0106 * Signif. codes: 0 ‘***’ 0.001 ‘**’ 0.01 ‘*’ 0.05 ‘.’ 0.1 ‘ ’ 1 Multiple R-squared: 0.4322, Adjusted R-squared: 0.3849, p-value: 0.01062
Source: Calculated by the authors
5. CONCLUSIONS
The present research aimed to examine the impact of education, caste and economic activities on fertility behaviour among women in in India. For this, the research deployed quantitative techquines —Multiple Classification Analysis, Logistic Regression Analysis and various demographic techniques by using MORTPAK softwear.The findings reveal that education, castes and economic activity does play key roles in fertility behaviour. In addition, this study reveals that there is a strong relationship between TFR, IMR and development in India. However, this research provides a strong ground for similar research to be conducted in other parts of the world.
REFERENCE
Arora, G. (1985). Caste, Socio-economic Status and Fertility- A Study of Proximate Determinants of Fertility in Village Riwasa. Guru Nanak Journal of Sociology: 6 (2),:81-96.

Som, K. S. & Mishra, R. P. / European Journal of Geography vol.11(1), pp.037–057, 2020
European Journal of Geography - ISSN 1792-1341 © All rights reserved 55
Basu, A. M. (1992).Culture, the Status of Women and Demographic Behaviour; Illustrated with the Case of India.Oxford :Clarendon Press.
Basu, A. M. (2002). Why does Education Lead to Lower Fertility? A critical Review of Some of the Possibilities.World Development. 30 (10):1779-1790.
Becker, Gary (1960). An Economic Analysis of Fertility in universities- National Bureau for Economics Research, Demographic and Economic Change in Developed Countries. Princeton: Princeton University.
Bhargava, P. K., &Saxena, P. C. (1986).Female Work Participation and Age at Marriage in an Urban Setting.In K. Srinivasan and S. Mukherjee (Eds.), Dynamics of population and family welfare. Bombay: Himalaya Publishing House.
Bongaart, J. (1978).A Framework for analyzing the proximate determinants of Fertility.Population and Development Review. 4:105-132.
Bongaart, J. and Potter, R.G. (1983).Fertility, Biology and Behaviour. Academic Press: New York.
Carr, David Lopez, Martinez A., Bilsborrow, R. E. & Whitmore, Thomas M. (2017). Geographical and individual determinants of rural out migration to a tropical forest protected area: the Maya biosphere reserve, Guatemala. European Journal of Geography, 8(2): 78-106.
Census of India (2011).Fertility Tables (F-Series). Registrar General India: New Delhi.
Coachrane, S. H. (1979):Fertility and Education: What do We Really Know?(World Bank Occasional Papers No. 26), Baltimore, MD: The John Hopkins University Press.
Coachrane, S. H. (1983). Effects of Education and Urbanization on Fertility. In R. A. Bulatao and R. D. Lee (Eds.), Determinates of Fertility in Developing Countries(Vol.2, Pp.-587-625). New York: Academic Press.
Dandekar, V. M. and KumudiniDandekar, (1953).Survey of Fertility and Mortality in Poona District. Poona: Gokhale Institute of Politics and Economics.
Das Gupta, Ajit ,Ranjan Kumar Som, Murari Mujumder, and Samarendra Nath Mitra, (1955).The National Sample Survey Number 7, Couple Fertility. NSS: Calcutta.
Davis, K. (1963). The Theory of Change and Response in Modern Demographic History.Population.29(4).
Devenoz, J. (1972). The Determinants of Family Formation in Child, An Economic Study of Female Labour Force Participation, Marriage and Fertility Decisions. The Rand Corporation Santa Monics: California.
Encarnacion, J. (1974).Fertility and labour force participant: Philippines 1968 (Population and Employment Working paper No. 2). Geneva, Switzerland: International Labour Organization.
Freedman, R. J. Takeshita and Sun T. H. (1964).Fertility and Family Planning in Taiwan: A case study of demographic transition.American Journal of Sociology.
Germain A. (1975).Status and Role of Women as Factors in Fertility Behaviour: A Policy Analysis.Studies in Family Planning.6(7).

European Journal of Geography vol.11(1), pp.037-057, 2020 © Association of European Geographers
European Journal of Geography - ISSN 1792-1341 © All rights reserved 56
Goldstein S. (1972). The Influence of Labour Force and Education in Thailand. Population Studies.26(3).
Gulimoto CZ and Rajan I, (June, 2013). Fertility at District Level in India: Lessons from the Census. Working Paper du CEPED , UMR 196 CEPED, University Paris Descartes, INED, IRD: Paris.
Guo, Zhen, Zhen Wu, Christoph M. Schimmele, Shuzhuo, Li. (2011). The effect of Urbanization on China’s fertility. http:// paa2012.princeton.edu/papers/120365. P. 37.
Haavio-Mannila E (1978). Fertility and the economic activity of women in historical and cross-national perspective. In Helsinki (Eds), Economic and Demographic Change : Issues for the 1980’s. Proceedings of conference. 3:113-28. IUSSP.
Hobcraft, J. N., Goldman, N. and Chidambaram, V. C. (1982).Advances in the P/F Ratio method for the analysis of Birth histories. Population Studies, 36(2):291-316.
Imai, K. S. and Sato, T (2010).Fertility, Prenatal Education and Development in India: New Evidence from National Household Survey Data (Discussion Paper). Research Institute for Economics and Business Administration, Kobe University, Kobe: Japan.
Jaffe, A. J. &Azumi K.(1968). The Birth Rates and Change of Industries in Under Developed Countries. Economic Development and Cultural Change.1.
Jaffe, A. J. (1959). People, Jobs and Economic Development. Glencoe, IL: Free Press.
Jejeebhoy, S. J. (1995). Women’s Education, Autonomy and Reproductive Behaviour: Experience from developing countries. Oxford: Clarendon Press.
Kulkarni, P. M. (2011). Towards and Explanation of India’s Fertility Transition.George Simmons Memorial Lecture, 33rd Annual Conference of the Indian Association for the Study of Population, Lucknow, November 11-13, 2011.
Kulkarni, P. M. (March, 2002). Special Population Groups.In SEMINAR, New-Delhi, Pp. 58-86, MALIYIKA SINGH.
Mandelbaum, David G. (1974). Human fertility in India: Social Components and Policy Perspectives. University of California Press: USA.
Morgan, S. P. and Nirula, B. (1995).Gender Inequality and Fertility in Two Nepali Villages .Population and Development Review.21(3).
Moultrie, Tom and Zaba, Basia (2013).Parity Progression Ratios.in Moultrie, Tom and et al. (eds.), Tools for Demographic Estimation, Pp.-69-81, UNFPA and IUSSP: Cape Town.
Population Division, Department of Economic and Social Affairs, United Nations(2013). “MORRTPAK for Windows (version 4.3)” Pp. 61- 62, New York: USA.
Pradhan, Elina (27 Nov. 2015). The Relation between Women’s Education and Fertility. World Economic Forum.
Price Joseph (8 Oct, 2013). How Income Affects Fertility. Institute of Family Studies, (https://ifstudies.org/blog/how-income-affects-fertility - Retrieve from 28/03/17)

Som, K. S. & Mishra, R. P. / European Journal of Geography vol.11(1), pp.037–057, 2020
European Journal of Geography - ISSN 1792-1341 © All rights reserved 57
Ramesh, P. (2007). An Analysis of Fertility Differentials among Caste Groups in Andhra Pradesh.Gokhale Institute of Politics and Economics.
Sathar, Z. A. (1996). Women’s Schooling and Autonomy as factors in fertility Change in Pakistan; Some Empirical Evidence.In R. Jeffery, and A. M. Basu (Eds.) Girl’s Schooling, Women’s Autonomy and Fertility Change in South Asia. New Delhi: Sage.
Science Daily (April 30, 2013). Economics Influence Fertility Rates More than Other Factors.University of Missouri-Columbia.
Singh K. P. (1986). Correlates of Fertility Behaviour: A Study of Rural Communities in Panjab and Haryana. Concept Publishing Co.: New Delhi.
SobotAnkica (2014). On Low Fertility from the Aspects of the Economic Activity of Female Population: Possibility and Restrictions in Encouragement of Childbearing. Stanovnistvo, 52(2):43-66.
Som, K. S. and Mishra, R. P. (2017).Education, Religion, Development and Regional Patterns of Fertility in West Bengal. Indian Journal of Spatial Science. 8(1): 1-8, Spring Issues.
Sovani, N. V. and Kumudini Dandekar (1955).Fertility Survey of Nasik, Kolaba and Satara (North) Districts. Pune: Gokhale Institute of Politics and Economics.
Srivastava, R. K. et al. (2012). Trends and Differentials in fertility and Family Planning Indicators of EAG States in India.The Policy Unit of the National Institute of Health and Family Welfare (NIHFW).
Stycos, J. M. (1965). Education and Fertility in Puerta Rico. Paper presented at the world conference, Belgrade: Serbia.
Stycos, J. M. (1965). Female Employment and Fertility in Limaperll. Milkbank Memorial Fund Quarterly. 43.
Taylor et al. (1976).The Child Survival Hypothesis.Population Studies.30(2).
United Nations (1961).The Mysore Population Study.The Department of Economics and Social Affairs, Population Studies, No. 34, New York: U. N.
Vlassoff, C. (1996). Against the Odds: The Channing Impact of Schooling on Female Autonomy and Fertility in an Indian Village. In R. Jeffery, and A. M. Basu (Eds.) Girl’s Schooling, Women’s Autonomy and Fertility Change in South Asia, New Delhi:Sage.
Weller R. H. (1977).Demographic Correlates of Women’s Participation in Economic Activities. In Proceedings of The International Population Conference, 1977 held in Mexico, IUSSP.
Whelpton, P. K. et al. (1966). Fertility and Family Planning in the United State. Princeton University Press: New Jercy.