education abroad enrollment report -...
TRANSCRIPT

EDUCATION ABROAD ENROLLMENT REPORT
2015-2016

1 | P a g e
Contents Introduction ............................................................................................................................................................................ 3
UK Education Abroad Enrollment ........................................................................................................................................... 3
Host Regions of UK Students, For-Credit ................................................................................................................................ 4
Program Enrollment by Region & Program, For Credit .......................................................................................................... 5
Africa ................................................................................................................................................................................... 5
Asia ...................................................................................................................................................................................... 6
Europe ................................................................................................................................................................................. 7
Latin America .................................................................................................................................................................... 14
Oceania ............................................................................................................................................................................. 16
Middle East ....................................................................................................................................................................... 17
North America ................................................................................................................................................................... 18
Multiple Destinations ........................................................................................................................................................ 18
Leading Destinations, For-Credit........................................................................................................................................... 19
Enrollment by UK College, For-Credit ................................................................................................................................... 20
Enrollment by UK College, Class of 2016 .............................................................................................................................. 21
College Enrollment by Experience Type ............................................................................................................................... 22
Leading College Enrollment by Department, For-Credit....................................................................................................... 23
Student Classification, at Time of Being Abroad ................................................................................................................... 25
Duration of Study, For-Credit ................................................................................................................................................ 25
Term of Study, For-Credit ..................................................................................................................................................... 26
Program Type, For-Credit ...................................................................................................................................................... 26
Enrollment Demographics by Experience Type .................................................................................................................... 27
Enrollment Demographics, For-Credit .................................................................................................................................. 29
Race/Ethnicity ................................................................................................................................................................... 29
Gender .............................................................................................................................................................................. 29
Gender by Region .............................................................................................................................................................. 30
LGBTQ ............................................................................................................................................................................... 31
Residency Status ............................................................................................................................................................... 31
Undergraduate First-Generation Status ........................................................................................................................... 31

2 | P a g e
Undergraduate Honors Enrollment .................................................................................................................................. 32
Undergraduate vs. Graduate/Professional Enrollment .................................................................................................... 32
Athlete Enrollment ............................................................................................................................................................ 32
Disabled Student Enrollment ............................................................................................................................................ 33
Veteran Enrollment ........................................................................................................................................................... 33
Singletary Scholar Enrollment ........................................................................................................................................... 33
Pell Grant Recipient Enrollment........................................................................................................................................ 34
Transfer Student Enrollment ............................................................................................................................................ 34
Chellgren Fellow Enrollment ............................................................................................................................................. 34
Benchmark Institutions, Open Doors 2013-2014 ................................................................................................................. 35
Southeastern Conference Institutions, Open Doors 2013-2014 .......................................................................................... 36
Commonwealth of Kentucky, Open Doors 2013-2014 ......................................................................................................... 37

3 | P a g e
Introduction
The number of UK students who studied abroad for credit during the academic year 2015-16 increased by 8.8% to 1,195
enrollments. Approximately 18.08% of the 2016 graduating class earned credit abroad at some point during their UK
education.
The majority, or 61.3%, of UK students chose destinations in Europe, which is higher than national averages. United
Kingdom was the most popular destination, followed by Spain, Germany and Italy. Together, the College of Arts and
Sciences and the Gatton College of Business account for 40.2% of the total education abroad enrollment. The College of
Design enrolled the largest proportion of its students abroad. UK Sponsored programs enrolled 43.6% (521) of education
abroad participants, followed by UK Partner programs at 21.2% (253). Sixty-three UK students participated in UK
Exchange programs. The data suggest that minority student participation has remained robust in UK’s Education Abroad
programs. In spite of these positive trends, the University of Kentucky ranks last among its benchmark institutions with
regard to education abroad participation.
For the purposes of this report, UK education abroad enrollment is compared to national enrollments as reported in the
Open Doors report published annually by the Institute of International Education. Open Doors 2015 reports on
enrollment during the academic year 2013-14, and is the basis for comparisons in the present document. The 2016 Open
Doors report for 2014-15 enrollment will be released in November 2016.
UK Education Abroad also provides services to participants on education abroad programs not enrolled in academic
credit. During 2015-2016, UK Education Abroad supported 210 non-credit participants, not included in this enrollment
report. Non-credit group travel is tracked by UK International Health, Safety & Security.
UK Education Abroad Enrollment
369 357 421 419
490 563 590 589
637
884 887
1,081 1,098
1,195
-
200
400
600
800
1,000
1,200
1,400

4 | P a g e
Host Regions of UK Students, For-Credit
The majority, or 61.3%, of UK students chose destinations in Europe, which is above national averages. At 20.8%,
programs in Latin America account for the second largest proportion of enrollments- followed by Asia at 6.5%- which is
below national averages. Enrollment in the Middle East increased during this academic year due to student interest.
Only 0.8% of students participated on programs that involved study in multiple countries.
Geographical Regions
2014-2015
EA Enrollment
2015-2016
EA Enrollment
2015-2016 %
EA Enrollment
National Averages
(IEE, 2013-2014)
Africa 62 49 4.1% 4.4%
Asia 115 78 6.5% 11.9%
Europe 709 732 61.3% 53.3%
Latin America 138 240 20.1% 16.2%
Middle East 4 10 0.8% 2.1%
North America 10 13 1.1% 0.5%
Oceania 49 63 5.3% 3.9%
Multiple Destinations
12 10 0.8% 7.7%
1,098 1,195 100% 100%
Africa - 4.1%
Asia - 6.5%
Europe - 61.3%
Latin America - 20.1%
Middle East - 0.8%
North America - 1.1%
Oceania - 5.3%Multiple Destinations -
0.8%

5 | P a g e
Program Enrollment by Region & Program, For Credit
Popular UK faculty-directed programs in Africa have continued to lead enrollments to this region of the world,
particularly to South Africa. Similarly, UK Sponsored programs have sustained enrollments to Asia as well. The
most popular programs in Europe include the CCSA London Winter program, Engineering’s programs in Karlsruhe
and various faculty-directed programs. Enrollments in Latin America are led by credit-bearing options via Shoulder to
Shoulder Global. Oceania enrollments remain modest, but are growing with the popularity of the Bluegrass Down Under
programs.
Africa
Acad. Year
Fall 2015
Spring 2016
Summer 2016
Winter 2016
Total
Graduate Medical Education (GME) House Staff 1 2 1 4
UK Consortia: Teach - South Africa(COST) 1 1
UK External: LeadAbroad- Cape Town 1 1
UK External: Universite de la Reunion (ISEP Exchange) 1 1
UK Independent: College of Health Sciences International
Rotations 3 2 5
UK Independent: College of Medicine International Rotations 5 1 6
UK Independent: College of Public Health International
Practicum 1 1
UK Independent: Independent International Study and Research
(For Credit) 2 2
UK Organization: Summer Alternative Service Breaks - Ghana
(credit-bearing) 2 2
UK Partner: Regional Studies in French (AMIDEAST) 1 1
UK Partner: Tanzania - Wildlife Conservation and Political
Ecology (SIT) 1 1
UK Partner: University of Cape Town (Arcadia) 1 1
UK Sponsored: Semester Internship in Cape Town, South Africa
(Arts & Sciences) 2 2
UK Sponsored: Strategic Communication in South Africa:
Promoting to the Rainbow Nation (Communications &
Information)
12 12
UK Sponsored: Summer Internship in Cape Town, South Africa
(Arts & Sciences) 9 9
Totals 0 4 16 26 3 49
Percentage by Term 0.0% 8.2% 32.7% 53.1% 6.1% 100.0%

6 | P a g e
Asia
Asia cont’d. Acad. Year
Fall 2015
Spring 2016
Summer 2016
Winter 2016
Total
UK Direct: Nagoya University - Automobile Engineering -
Summer (Engineering) 1 1
UK Direct: National Taiwan Normal University - Mandarin
Training Center (Arts & Sciences) 2 2
UK Direct: Osaka University - Japanese Short-Stay In-Session
Summer Program (JshIP) (Arts & Sciences) 3 3
UK Exchange: Akita International University 3 3
UK Exchange: City University of Hong Kong - College of Science
& Engineering (Arts & Sciences) 1 1
UK Exchange: Korea University Business School (Business &
Economics) 2 2
UK Exchange: Korea University Business School Summer
Program (Business & Economics) 1 1
UK Exchange: Meiji Gakuin University 3 3
UK Exchange: Nagoya University (NUPACE) 1 1
UK Exchange: Seoul National University (Agriculture, Food &
Environment) 1 1
UK Exchange: The Education University of Hong Kong (Fine Arts) 1 1
UK External: Chinese Language Program - Zhejiang University 2 2
UK External: Critical Language Scholarship Program - China 1 1
UK External: CUMT Summer School 2 2
UK External: International Management, Business & Economics
(ISA) 1 1
UK External: Princeton in Ishikawa 1 1
UK External: The Himalayan Ecosystem Project: Environment
and Culture 1 1
UK External: Vietnam National University 1 1
UK Independent: 767 Graduate Student Independent
International Study and Research (For Credit) 2 2
UK Independent: College of Pharmacy International Rotations 2 3 5
UK Independent: College of Public Health International
Practicum 2 2
UK Independent: Independent International Study and Research
(For Credit) 1 1 2
UK Partner: Beijing - Contemporary China & Chinese Language
(IES Abroad) 1 1

7 | P a g e
Asia cont’d. Acad. Year
Fall 2015
Spring 2016
Summer 2016
Winter 2016
Total
UK Partner: Chiang Mai University - Summer (TEAN) 1 1
UK Partner: Chiang Mai University (TEAN) 1 1
UK Partner: Intern - Summer in Beijing (KEI) 1 1
UK Partner: Intern - Summer in Singapore (AIC) 1 1
UK Partner: Mahidol University (KEI) 1 1
UK Partner: University of International Business and Economics
(UIBE) (KEI) 1 1
UK Sponsored: Conversational Chinese (Arts & Sciences) 12 12
UK Sponsored: Embedded: Preparing Students for
Interdisciplinary Teaching (Education) 6 6
UK Sponsored: Observing the World: Methods in Cross-Cultural
Observation & Documentation (Design) 7 7
UK Sponsored: Tropical Agroecology & Sustainable
Development in Indonesia (Agriculture, Food & Environment) 7 7
Totals 8 12 17 34 7 78
Percentage by Term 10.3% 15.4% 21.8% 43.6% 9.0% 100.0%
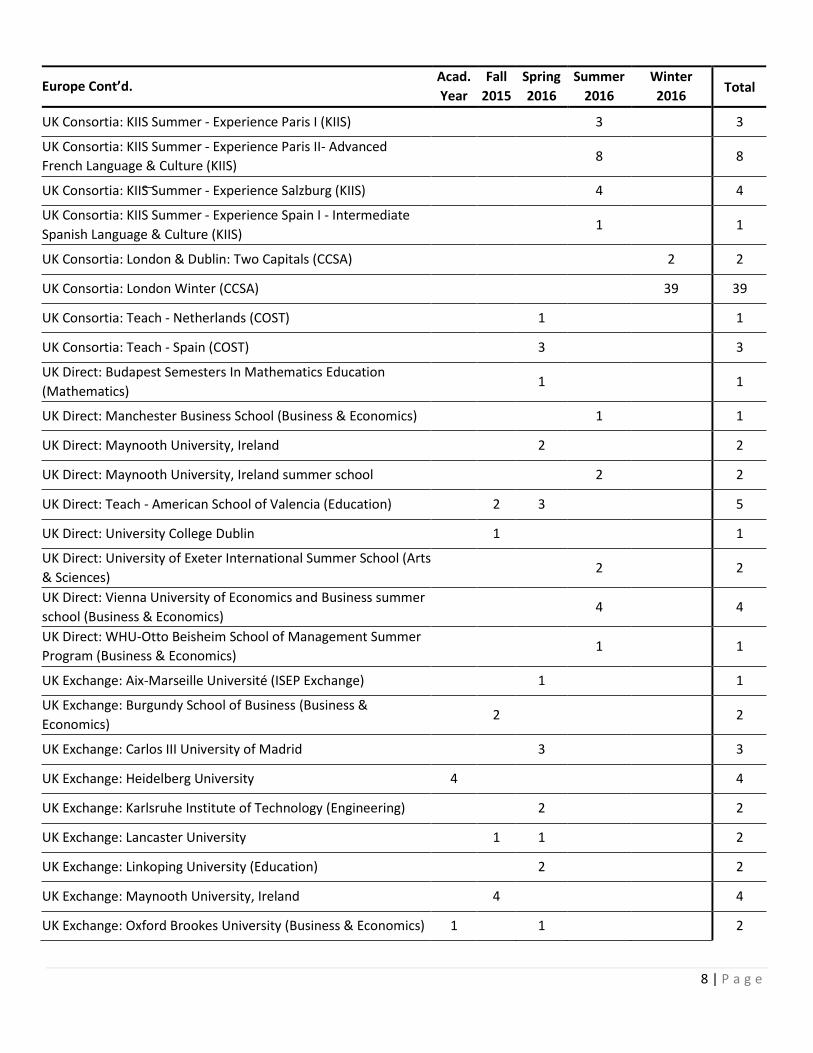
Europe
Europe Cont’d. Acad.
Year
Fall
2015
Spring
2016
Summer
2016
Winter
2016 Total
UK Consortia: CCSA - Ireland Early Summer (CCSA) 1 1
UK Consortia: CCSA - London Summer (CCSA) 2 2
UK Consortia: KIIS Semester - Experience Caen - Beginning to
Advanced French Language & Culture (KIIS) 2 2
UK Consortia: KIIS Semester - Experience Regensburg -
Intermediate to Advanced German Language & Culture (KIIS) 1 1
UK Consortia: KIIS Summer - Experience Austria (KIIS) 3 3
UK Consortia: KIIS Summer - Experience Berlin (KIIS) 2 2
UK Consortia: KIIS Summer - Experience Denmark (KIIS) 4 4
UK Consortia: KIIS Summer - Experience Greece (KIIS) 3 3
UK Consortia: KIIS Summer - Experience Italy (KIIS) 2 2
UK Consortia: KIIS Summer - Experience Munich (KIIS) 3 3
UK Consortia: KIIS Summer - Experience Paris I & II Back-to-Back
(KIIS) 1 1
8 | P a g e
Europe Cont’d. Acad.
Year
Fall
2015
Spring
2016
Summer
2016
Winter
2016 Total
UK Consortia: KIIS Summer - Experience Paris I (KIIS) 3 3
UK Consortia: KIIS Summer - Experience Paris II- Advanced
French Language & Culture (KIIS) 8 8
UK Consortia: KIIS Summer - Experience Salzburg (KIIS) 4 4
UK Consortia: KIIS Summer - Experience Spain I - Intermediate
Spanish Language & Culture (KIIS) 1 1
UK Consortia: London & Dublin: Two Capitals (CCSA) 2 2
UK Consortia: London Winter (CCSA) 39 39
UK Consortia: Teach - Netherlands (COST) 1 1
UK Consortia: Teach - Spain (COST) 3 3
UK Direct: Budapest Semesters In Mathematics Education
(Mathematics) 1 1
UK Direct: Manchester Business School (Business & Economics) 1 1
UK Direct: Maynooth University, Ireland 2 2
UK Direct: Maynooth University, Ireland summer school 2 2
UK Direct: Teach - American School of Valencia (Education) 2 3 5
UK Direct: University College Dublin 1 1
UK Direct: University of Exeter International Summer School (Arts
& Sciences) 2 2
UK Direct: Vienna University of Economics and Business summer
school (Business & Economics) 4 4
UK Direct: WHU-Otto Beisheim School of Management Summer
Program (Business & Economics) 1 1
UK Exchange: Aix-Marseille Université (ISEP Exchange) 1 1
UK Exchange: Burgundy School of Business (Business &
Economics) 2 2
UK Exchange: Carlos III University of Madrid 3 3
UK Exchange: Heidelberg University 4 4
UK Exchange: Karlsruhe Institute of Technology (Engineering) 2 2
UK Exchange: Lancaster University 1 1 2
UK Exchange: Linkoping University (Education) 2 2
UK Exchange: Maynooth University, Ireland 4 4
UK Exchange: Oxford Brookes University (Business & Economics) 1 1 2

9 | P a g e
Europe Cont’d. Acad.
Year
Fall
2015
Spring
2016
Summer
2016
Winter
2016 Total
UK Exchange: Pompeu Fabra University (Arts & Sciences) 1 1
UK Exchange: Stockholm School of Economics (Business &
Economics) 1 1
UK Exchange: The Grenoble School of Management (Business &
Economics) 1 1
UK Exchange: Università Cattolica del Sacro Cuore (ISEP
Exchange) 1 1
UK Exchange: University of Applied Science Potsdam (Fine Arts) 1 1
UK Exchange: University of Caen (Lexington Sister Cities) 1 1 2
UK Exchange: University of Central Lancashire 1 3 4
UK Exchange: University of Sussex 4 2 6
UK Exchange: Vienna University of Economics and Business
(Business & Economics) 2 2
UK Exchange: WHU-Otto Beisheim School of Management
(Business & Economics) 1 2 3
UK External- Leiden University Law 1 1
UK External: CEA Full Curriculum (CEA) 1 1
UK External: DIS Neuroscience: Psychopharmacology 1 1
UK External: Durham University Summer Institute (Fulbright) 1 1
UK External: ESU Cambridge - Literature 1 1
UK External: French Language Immersion (CEA) 1 1
UK External: Grenoble Ecole de Management summer school 1 1
UK External: Institut Catholique de Paris - Intensive French
Language (ISA) 1 1
UK External: LeadAbroad- Go Rome 1 1
UK External: Liberal Arts & Social Sciences (CEA) 1 1
UK External: Lille III (ISEP exchange) 1 1
UK External: Project GO - Intensive Intermediate Russian Abroad 1 1
UK External: Reggio Emilia (USAC) 1 1
UK External: School of Business Administration (USAC) 1 1
UK External: SOAS - University of London 1 1
UK External: Summer School of Polish Language and Culture -
Jagiellonian University 1 1

10 | P a g e
Europe Cont’d. Acad.
Year
Fall
2015
Spring
2016
Summer
2016
Winter
2016 Total
UK External: Tourism, Hospitality Management & Business (ISA) 1 1
UK External: University of Central Lancashire (ISEP exchange) 1 1
UK External: University of Nice (ISEP Exchange) 1 1
UK External: University of Savoie (ISEP Exchange) 1 1 2
UK External: USAC Charles University 2 2
UK Independent: 767 Graduate Student Independent
International Study and Research (For Credit) 3 3
UK Independent: College of Health Sciences International
Rotations 5 5
UK Independent: College of Pharmacy International Rotations 1 2 7 10
UK Independent: Independent International Study and Research
(For Credit) 1 2 10 13
UK Partner: Advanced Russian Language and Area Studies
(American Councils) 1 1
UK Partner: Aix-Marseille University: French Language and
Culture (CEA) 1 1
UK Partner: Antonio de Nebrija University - Spanish Language,
Hispanic Studies & Electives (ISA) 4 4
UK Partner: Biomedicine (DIS) 1 1
UK Partner: Celtic Blue: National University of Ireland - Galway
(Arcadia) 1 1
UK Partner: Charles University- History, Culture and Politics (ISA) 2 1 3
UK Partner: CIEE Global Institute - Berlin Open Campus Program
(CIEE) (Scholarship Discounted) 2 2
UK Partner: Equine Summer Program in Scotland (Adelante) 6 6
UK Partner: European Politics (DIS) 1 1
UK Partner: EuroScholars - Undergraduate Research in Europe
(ISA) 1 1
UK Partner: First-Year Seminar in London (University of Kentucky
- Arcadia University) 5 5
UK Partner: Florence University of the Arts (FUA) (SAI) 3 3
UK Partner: Global Design: Florence University of the Arts (SAI) 5 5
UK Partner: Global Design: Global Architecture + Design in
Barcelona (CIEE) 1 1
UK Partner: Global Design: Griffith College Dublin (KEI) 2 2
UK Partner: Griffith College Dublin (KEI) 2 2

11 | P a g e
Europe Cont’d. Acad.
Year
Fall
2015
Spring
2016
Summer
2016
Winter
2016 Total
UK Partner: Intern - Celtic Blue: Dublin Parliament (Arcadia) 1 1
UK Partner: Intern - Summer in Barcelona (Barcelona SAE) 4 4
UK Partner: Intern - Summer in Dublin (Arcadia) 8 8
UK Partner: Intern - Summer in London (Arcadia) 3 3
UK Partner: Intern -Semester in London (Arcadia) 1 1
UK Partner: ISA Paris & Catholic University of Paris - Arts &
French Language (ISA) 2 2
UK Partner: John Cabot University Direct Enrollment (API) 3 3 3 9
UK Partner: King's College London (IFSA-Butler) 1 1 2
UK Partner: London School of Economics and Political Science -
Summer Program (IFSA-Butler) 1 1
UK Partner: London South Bank University (KEI) 2 4 1 7
UK Partner: Lorenzo de' Medici Program - Florence (API) 6 6 6 18
UK Partner: Menéndez Pelayo International University -
International Studies, Business & Spanish Language (ISA) 2 7 9
UK Partner: Menendez Pelayo International University - Spanish
Language & Culture - Summer (ISA) 3 3
UK Partner: Menéndez Pelayo International University - Spanish
Language, Culture & Business- Summer (ISA) 5 5
UK Partner: Oxford University (IFSA-Butler) 1 1
UK Partner: Pablo de Olavide University - Hispanic Studies,
Business & Spanish Language (ISA) 2 5 7
UK Partner: Summer Nursing Program (Nutrition & Microbiology)
at the University of Ulster, Northern Ireland 7 7
UK Partner: Summer Study Abroad (DIS) 2 2
UK Partner: Switzerland - International Studies and Multilateral
Diplomacy (SIT) 1 1
UK Partner: Universidad Autónoma de Barcelona - International
Studies, Business & Culture (ISA) 4 3 7 14
UK Partner: University College London (IFSA-Butler) 1 1
UK Partner: University of Barcelona -Hispanic Studies (ISA) 3 3
UK Partner: University of Deusto - Spanish Language & Liberal
Arts (ISA) 1 1
UK Partner: University of Economics - International Business &
Economics (ISA) 4 3 7
UK Partner: University of Granada - Intensive Spanish Language
Summer (ISA) (Back-to-Back) 1 1

12 | P a g e
Europe Cont’d. Acad.
Year
Fall
2015
Spring
2016
Summer
2016
Winter
2016 Total
UK Partner: University of Granada - Intensive Spanish Language
Trimester (ISA) 2 2
UK Partner: University of Granada - Spanish Language and
Culture (ISA) 1 1
UK Partner: University of Granada - Spanish Language, Culture,
and Electives (ISA) 1 3 4
UK Partner: University of Malaga- Intensive Spanish Language
(ISA) 1 1
UK Partner: University of Reading (ISA) 1 1
UK Partner: University of Roehampton- Courses with Locals in
Multiple Disciplines (ISA) 1 1 1 3
UK Partner: University of Salamanca - Business & Spanish
Language (ISA) 1 1
UK Partner: University of Seville - Hispanic Studies & Electives
(ISA) 1 2 3
UK Partner: University of Valencia - Spanish Language, Culture &
Literature (ISA) 1 1
UK Partner: University of Westminster (IFSA-Butler) 1 1
UK Partner: Vienna Summer - Psychology (IES Abroad) 1 1
UK Sponsored: Ancient Greeks in Italy (Arts & Sciences) 4 4
UK Sponsored: Architecture Studio in Berlin (Design) 4 4
UK Sponsored: Communications in London: Arcadia in London
(Communications & Information) 4 4
UK Sponsored: Communications in London: London Internship
(Communications & Information) 3 3
UK Sponsored: Concepts of Income Taxation with an
International Flavor (Business & Economics) 10 10
UK Sponsored: Dairy in the Netherlands (Agriculture, Food &
Environment) 5 5
UK Sponsored: Delft Scenarios: Design Studio in the Netherlands
(Design) 4 4
UK Sponsored: Design For Learning (Design) 10 10
UK Sponsored: Drawing & Painting in Paris (Fine Arts) 10 10
UK Sponsored: Embedded: Graecia Copta: Ancient Greek
Literature and Culture in Rome and Southern Italy (Gaines) 8 8
UK Sponsored: Embedded: MBA International Study:
Management in Greece (Business & Economics) 17 17
UK Sponsored: Embedded: Merchandising, Apparel & Textiles in
Paris, France (Agriculture, Food & Environment) 12 12

13 | P a g e
Europe Cont’d. Acad.
Year
Fall
2015
Spring
2016
Summer
2016
Winter
2016 Total
UK Sponsored: Engineering and Calculus IV in Karlsruhe
(Engineering) 24 24
UK Sponsored: Engineering/MBA International Study - Europe
(Engineering) 17 17
UK Sponsored: Exploratory Students in London (Undergraduate
Studies) 6 6
UK Sponsored: Exploring Health & Care of Older People in Great
Britain (Health Sciences) 11 11
UK Sponsored: Global Energy Issues in Karlsruhe (Engineering) 9 9
UK Sponsored: Health, Medicine & Society: A British Perspective
(IHRC) 4 4
UK Sponsored: Honors - Theatre, Culture & Art in Paris (Honors) 10 10
UK Sponsored: Independence Now: The Politics of Nationalism in
Spain (Arts & Sciences) 12 12
UK Sponsored: Intensive Intermediate German (Arts & Sciences) 8 8
UK Sponsored: Intensive Russian Study (Arts & Sciences) 1 1
UK Sponsored: Journalism in Context: World Media Systems in
Dublin (Communication & Information) 10 10
UK Sponsored: Keys to Well-Being: Lessons From the World's
Longest Lived People (Agriculture, Food & Environment) 12 12
UK Sponsored: Kinesiology and Health Promotion in England
(Education) 11 11
UK Sponsored: Leadership Lessons from Prague (Agriculture,
Food & Environment) 9 9
UK Sponsored: London Theatre: How Past Becomes Present (Fine
Arts) 8 8
UK Sponsored: Mix It Up In Germany: Gatton-Style (Business &
Economics) 17 17
UK Sponsored: Prague Summer Nights: A Festival of Music
History and Vocal Literature (Fine Arts) 1 1
UK Sponsored: Renewable Energy (Option A - Long/Apartment)
(Engineering) 3 3
UK Sponsored: Renewable Energy (Option A - Long/Homestay)
(Engineering) 7 7
UK Sponsored: Renewable Energy (Option B - Short/Homestay)
(Engineering) 11 11
UK Sponsored: Rural Development & International Food Business
(Agriculture, Food & Environment) 11 11
UK Sponsored: Sexual Health and Sex Education in the
Netherlands (Education) 6 6
UK Sponsored: Spain & Italy: Ancient to Modern Architecture 19 19

14 | P a g e
Europe Cont’d. Acad.
Year
Fall
2015
Spring
2016
Summer
2016
Winter
2016 Total
(Design)
UK Sponsored: Substance Use as a Global Challenge: Psychology
Senior Capstone (Arts & Sciences) 9 9
UK Sponsored: The Italian Table: An Exploration of the Heritage
of Sustainable Food and Cultural Diversity (Agriculture, Food &
Environment)
10 10
UK Sponsored: Vivere l'Italia: Italian Language, Art & Culture
(Arts & Sciences) 11 11
UK Sponsored: Where Are All The Women?: A Study of the
Attrition of Women in Science and Medicine in Europe (Honors) 6 6
Grand Total 9 71 152 459 41 732
Percentage by Term 1.2% 9.7% 20.8% 62.7% 5.6% 100.0%
Latin America
Latin America cont’d. Acad.
Year
Fall
2015
Spring
2016
Summer
2016
Winter
2016 Total
Graduate Medical Education (GME) House Staff 4 3 7
UK Consortia: KIIS Summer - Experience Argentina (KIIS) 1 1
UK Consortia: KIIS Summer - Experience Costa Rica (KIIS) 2 2
UK Consortia: KIIS Winter - Maya Mexico (KIIS) 6 6
UK Consortia: Teach- Costa Rica (COST) 2 2
UK External: HEALTH CARE COURSES IN ENGLISH & MEDICAL
SPANISH 1 1
UK External: ISA Barranquilla 1 1
UK External: Spanish Language, Liberal Arts & Environment (ISA) 1 1 2
UK Independent: 767 Graduate Student Independent
International Study and Research (For Credit) 1 1
UK Independent: College of Dentistry International Rotations 2 2
UK Independent: College of Medicine International Rotations 1 1
UK Independent: College of Public Health International
Practicum 1 1
UK Independent: Independent International Study and Research
(For Credit) 2 2 2 6
UK Organization: Alternative Service Breaks - Dominican
Republic (credit-bearing) 4 4
UK Organization: Alternative Service Breaks - Ecuador (winter)
(credit-bearing) 3 3

15 | P a g e
Latin America cont’d. Acad.
Year
Fall
2015
Spring
2016
Summer
2016
Winter
2016 Total
UK Organization: Alternative Service Breaks - Nicaragua (spring)
(credit-bearing) 2 2
UK Organization: Alternative Service Breaks - Nicaragua (winter)
(credit-bearing) 3 3
UK Organization: Shoulder to Shoulder Global: Ecuador - August
Brigade (credit-bearing) 16 16
UK Organization: Shoulder to Shoulder Global: Ecuador - June
Brigade (credit-bearing) 13 13
UK Organization: Shoulder to Shoulder Global: Ecuador - March
Brigade (credit-bearing) 22 22
UK Organization: Shoulder to Shoulder Global: Ecuador - May
Brigade (credit-bearing) 21 21
UK Partner: Academia Buenos Aires - ESEADE - Intensive Spanish
Language - Winter (Sol) 1 1
UK Partner: Business & Latin American Studies Courses with
Locals - Universidad del Pacifico (ISA) 1 1
UK Partner: Centro Tinku - Language, Literature & Culture (ISA) 1 1
UK Partner: Costa Rica - Study Abroad & Spanish Immersion in
Heredia (Back-to-Back) (SOL) 2 2
UK Partner: Costa Rica - Study Abroad & Spanish Immersion in
Heredia (SOL) 3 2 5 10
UK Partner: Cusco, Peru 8-week Service-Learning (ISA) 1 1
UK Partner: Cusco, Peru Service Learning (ISA) 1 1
UK Partner: Latin University of Costa Rica - Spanish Immersion
and Study- Winter (Sol) 2 2
UK Partner: Learning Abroad Center - University of Minnesota -
MSID Ecuador 1 1
UK Partner: Lima, Peru 8-week Service-Learning (ISA) 1 1
UK Partner: Panama - Tropical Ecology, Marine Ecosystems, and
Biodiversity Conservation (SIT) 1 1
UK Partner: Pontifical Catholic University - Courses with Locals
in Multiple Disciplines (ISA) 1 1
UK Partner: Study Abroad and Spanish Immersion in Mexico -
Courses with Locals (Sol) 1 1
UK Partner: Study Abroad and Spanish Immersion in Mexico 1 1
UK Partner: Universidade do Sul de Santa Catarina - Culture,
Portuguese Language, Business & Courses with Locals (ISA) 1 1
UK Partner: University of Belgrano - Intensive Spanish Language 1 3 4
UK Sponsored: Early Education in Guatemala (Education) 5 5
UK Sponsored: Embedded: Exploring Health Care in Cuba 12 12

16 | P a g e
Latin America cont’d. Acad.
Year
Fall
2015
Spring
2016
Summer
2016
Winter
2016 Total
(Health Sciences)
UK Sponsored: Embedded: Hospitality & Tourism Experience in
Jamaica (Agriculture, Food & Environment) 9 9
UK Sponsored: Embedded: International Agribusiness in
Argentina (Agriculture, Food & Environment) 17 17
UK Sponsored: Embedded: International Energy Experience In
Costa Rica (Engineering) 8 8
UK Sponsored: Exploring the Diverse Communities &
Agricultural Development of the Dominican Republic
(Agriculture, Food & Environment)
20 20
UK Sponsored: Intensive Medical Spanish and Tropical Medicine 4 4
UK Sponsored: Mountains to Coast: Field Studies in Costa Rica
(Agriculture, Food & Environment) 13 13
UK Sponsored: Social & Environmental Justice in Southern
Mexico (Arts & Sciences) 6 6
Grand Total 2 30 136 74 9 241
Percentage by Term 0.8% 12.4% 56.4% 30.7% 3.7% 100.0%
Oceania
Acad.
Year
Fall
2015
Spring
2016
Summer
2016
Winter
2016 Total
UK Consortia: CCSA - Australia Ecosystems (CCSA) 15 15
UK Consortia: Teach - Australia (COST) 2 2
UK Consortia: Teach - New Zealand (COST) 4 3 7
UK Direct: Global Design: Massey University - Wellington (ISEP
Direct) 1 1
UK Exchange: Teach - Charles Sturt University 3 3
UK External: ISA FIJI 1 1
UK External: TEAN Gold Coast Bond University 1 1
UK Independent: Independent International Study and
Research (For Credit) 1 1
UK Partner: Bluegrass Down Under (Arts & Sciences) (Fine Arts) 13 13
UK Partner: Bluegrass Down Under: Griffith University (TEAN) 1 1
UK Partner: Bluegrass Down Under: University of New South
Wales (TEAN) 1 3 4

17 | P a g e
UK Partner: Bluegrass Down Under: University of Newcastle
(TEAN) 1 1
UK Partner: Global Design: International College of
Management (TEAN) 1 1
UK Partner: Intern - Summer in Australia (TEAN) 8 8
UK Partner: Intern - Summer in New Zealand(TEAN) 1 1
UK Partner: Intern - Summer in Sydney (Arcadia) (Gatton) 2 2
UK Partner: University of Otago (Arcadia) 1 1
Grand Total 0 12 24 12 15 63
Percentage by Term 0.0% 19.0% 38.1% 19.0% 23.8% 100.0%
Middle East
Acad.
Year
Fall
2015
Spring
2016
Summer
2016
Winter
2016 Total
UK External: Arabic Language Study - University of Jordan 2 1 3
UK External: Jordan -Intensive Arabic Language Studies (SIT) 1 1
UK External: Jordan Language Academy (SAL) 2 2
UK Independent: 767 Graduate Student Independent
International Study and Research (For Credit) 1 1
UK Independent: Independent International Study and
Research (For Credit) 1 1
UK Partner: University of Jordan - Arabic Language & Middle
Eastern Studies (ISA) 1 1
UK Sponsored: Archaeology of Ancient Israel (Arts &
Sciences) 1 1
Grand Total 3 1 0 1 5 10
Percentage by Term 30.0% 10.0% 0.0% 10.0% 50.0% 100.0%

18 | P a g e
North America
Acad.
Year
Fall
2015
Spring
2016
Summer
2016
Winter
2016 Total
UK Consortia: KIIS Summer - Experience Mexico (KIIS) 1 1
UK Independent: 767 Graduate Student Independent
International Study and Research (For Credit) 1 1
UK Sponsored: Embedded: Service & Cultural Immersion of
Merida, Mexico (Agriculture, Food & Environment) 11 11
Grand Total 0 11 0 1 1 13
Percentage by Term 0.0% 84.6% 0.0% 7.7% 7.7% 100.0%
Multiple Destinations
Acad.
Year
Fall
2015
Spring
2016
Summer
2016
Winter
2016 Total
UK External-Global Brigades 1 1
UK Partner: Semester at Sea - Fall & Spring Voyage 2 1 3
UK Sponsored: Crime and Justice at International Crossroads 6 6
Grand Total 0 2 1 6 1 10
Percentage by Term 0.0% 20.0% 10.0% 60.0% 10.0% 100.0%

19 | P a g e
Leading Destinations, For-Credit
United Kingdom has emerged as the most popular destination for UK students, with a total of 165 (12.5%). It is
followed by Spain (11.4%) and Germany (7.6%). The top five leading destinations (United Kingdom, Spain, Germany,
Italy and France) account for 45.7% of the total enrollment.
Country
2014-2015 EA Enrollment1
2015-2016 EA Enrollment1
Percentage of Total Enrollment
Change in Enrollment Percentage2
1. United Kingdom3 136 165 12.5% 2.7%
2. Spain 172 152 11.4% -1.0%
3. Germany 98 102 7.6% 0.5%
4. Italy 81 99 7.4% 1.6%
5. France 104 91 6.8% -0.7%
6. Ecuador 63 85 6.4% 1.9%
7. Australia 44 53 4.0% 0.8%
8. Costa Rica 25 49 3.7% 1.9%
9. Ireland 97 47 3.5% -3.5%
10. Czech Republic 44 40 3.0% -0.2%
11. Greece 44 35 2.6% -0.6%
12. South Africa 34 30 2.2% -0.3%
13. Mexico 14 28 2.1% 1.1%
14. Netherlands 13 27 2.0% 1.1%
15. Argentina 3 25 1.9% 1.7%
1 Some programs have multiple destinations. For this section of the report, each country visited by such programs was counted
separately. 2 Calculated using the percentage of total enrollment in 2015-2016 minus the 2014-2015 percentage. 3 As reported in Open Doors- England, Scotland, Wales and Northern Ireland are counted within United Kingdom.

20 | P a g e
Enrollment by UK College, For-Credit
The College of Arts & Sciences enrolled 287 students in education abroad programs during 2015-2016, accounting
for 24.0% of the total education abroad enrollment. The Gatton College of Business and Economics followed with
194 students, or roughly 16.2%. The College of Design sent the largest proportion of its students abroad, at 12.5%.
Proportional enrollment is calculated using total enrollment in each respective college.
College 2014-2015 Enrollment
2015-2016 Enrollment
% of Total EA Enrollment
College Proportion4
College of Arts and Sciences 226 287 24.0% 4.9%
College of Business & Economics 163 194 16.2% 5.9%
College of Agriculture 156 173 14.5% 5.3%
College of Communication and Information 117 89 7.4% 5.1%
College of Engineering 95 86 7.2% 2.4%
College of Health Sciences 44 65 5.4% 6.2%
College of Education 99 53 4.4% 1.9%
College of Design 42 49 4.1% 12.5%
College of Pharmacy 23 40 3.3% 6.0%
College of Nursing 38 36 3.0% 2.6%
College of Fine Arts 41 36 3.0% 4.1%
College of Medicine 22 31 2.6% 2.1%
Undergraduate Studies5 4 31 2.6% 1.3%
College of Public Health 11 15 1.3% 4.2%
College of Social Work 5 5 0.4% 1.1%
College of Dentistry 0 2 0.2% 0.7%
College of Law 1 1 0.1% 0.3%
Graduate School(non-degree/transient)6 8 1 0.1% 0.4%
Patterson School of Diplomacy 3 1 0.1% --
1,098 1,195 100% N/A
4 Calculated using enrollment data provided by UK Institutional Research. 5 Undergraduate non-degree seeking students are counted in the College of Undergraduate Studies. 6 Only non-degree seeking or transient graduate students are included. All others are counted in their respective college units.

21 | P a g e
Enrollment by UK College, Class of 2016
Among the class of 20167, 18.08% (n=790) of UK undergraduates participated in a credit-bearing education abroad
program, which is higher than national averages for bachelor students (14.8%) and higher than the preceding class of
2015 (15.04%). The College of Design led with the greatest overall percentage of students in the Class of 2016 who had
studied abroad, at 49.45%. The College of Arts & Sciences had the overall largest number of students who had earned
credit abroad, followed by the Colleges of Business & Economics and Agriculture, Food & Environment.
College Class of 2015
EA Participation
Class of 2016
EA Participation
Total Graduated
2015-2016
College of Design 45.83% (33) 49.45% (45) 91
College of Business & Economics 15.62% (102) 23.36% (164) 705
College of Communications &
Information Studies 16.96% (67) 20.43% (95) 465
College of Fine Arts 17.89% (22) 19.38% (25) 129
College of Arts and Sciences 20.64% (201) 19.17% (195) 1,017
College of Agric., Food & Environ. 16.53% (103) 18.65% (113) 606
College of Health Sciences 17.57% (13) 18.55% (23) 124
College of Education 7.40% (35) 14.59% (69) 473
College of Engineering 10.48% (50) 12.22% (65) 532
College of Nursing 4.27% (9) 7.69% (16) 208
College of Social Work 12.12% (8) 3.03% (2) 66
643 812 4,387
7 Data provided by University of Kentucky Analytics and Technologies (UKAT), September 2016.

22 | P a g e
College Enrollment by Experience Type8
Study Abroad (1,072) was the most popular experience type of education abroad participants from all
colleges/units. It was followed by Service-Learning Abroad (99). 20 students from the College of Education participated
in Teach Abroad programs, and 30 students from the College of Business and Economics did internships abroad.
College Study
Abroad Research Abroad
Intern Abroad
Teach Abroad
Service Abroad
College of Arts and Sciences 276 34 13 0 8
College of Business and Economics
185 0 30 0 3
College of Agriculture 165 9 3 0 14
College of Communication & Information
85 3 5 0 2
College of Engineering 86 2 0 0 0
College of Education 31 2 1 20 4
College of Design 49 0 0 0 0
College of Pharmacy 31 0 0 0 9
College of Medicine 25 0 0 0 9
College of Health Sciences 44 1 0 0 21
College of Nursing 15 0 0 0 21
College of Undergraduate Studies 29 3 1 0 2
College of Fine Arts 35 1 0 1 0
College of Law 1 0 0 0 0
Graduate School (non- d egree/transient)
1 0 0 0 0
College of Social Work 4 1 0 0 1
College of Public Health 10 1 0 0 5
1,072 57 53 21 99
8 Some programs encompass multiple experience types. In those cases, each experience type was counted separately. Therefore, the
totals in this table will not equal the total number of EA participants (1,195), and the totals in each row may not equal the total number of participants from each respective college/unit.

23 | P a g e
Leading College Enrollment by Department, For-Credit
Within the College of Arts & Sciences, Biology majors and International Studies majors account for 31.0% of the
college’s enrollment, followed by Psychology majors at 12.5%. Marketing (27.8%) and Accounting (19.1%) students are
the most frequently represented majors in the Gatton College of Business and Economics. Students are classified by
primary major.
College/Department 2014-2015 EA
Enrollment 2015-2016 EA
Enrollment Percentage Total
College EA Enrollment
College of Arts and Sciences 226 287
Biology 34 51 17.8%
International Studies 39 38 13.2%
Psychology 32 36 12.5%
Political Science 18 24 8.4%
Modern Classical Lang., Lit. and Culture 20 23 8.0%
English 13 14 4.9%
Foreign Languages & Int'l Economics 3 14 4.9%
History 8 14 4.9%
Anthropology 7 12 4.2%
Chemistry 13 12 4.2%
Spanish 8 9 3.1%
Geography 4 7 2.4%
Linguistics 4 6 2.1%
Mathematics 2 6 2.1%
Economics 9 4 1.4%
Mathematical Economics 2 3 1.0%
Philosophy 1 3 1.0%
Sociology 3 3 1.0%
Environmental & Sustainability Studies 3 2 0.7%
Geological Sciences -- 2 0.7%
Health Society and Populations -- 2 0.7%
Physics 3 2 0.7%

24 | P a g e
College/Department 2014-2015 EA
Enrollment 2015-2016 EA
Enrollment Percentage Total
College EA Enrollment
College of Business and Economics 163 194
Marketing and Pre-Marketing 45 54 27.8%
Accounting and Pre-Accounting 36 37 19.1%
Business Administration 6 34 17.5%
Management and Pre-Management 28 32 16.5%
Finance and Pre-Finance 31 20 10.3%
Economics and Pre-Economics 17 17 8.8%

25 | P a g e
Student Classification, at Time of Being Abroad
At 40.3%, seniors account for almost half of total enrollment while juniors account for 28.5% of total enrollment. This
is not surprising as most students typically wait until the summer after their junior year to study abroad. Priority on first
and second year programming in the coming years will likely shows gains in underclassmen participation.
Student Classification 2014-2015 Enrollment
2015-2016 Enrollment 9
Percentage of EA Enrollment
Change in Enrollment Percentage10
Freshman 7 27 2.3% 1.7%
Sophomore 73 160 13.4% 6.8%
Junior 294 341 28.5% 1.7%
Senior 552 482 40.3% -10.0%
Undergraduate-Non-Degree Seeking
16 15 1.3% -0.2%
Graduate/Professional 156 170 14.2% 0.0%
Unclassified 0 0 -- --
1,098 1,195 100% --
Duration of Study, For-Credit
Nearly 80% of UK students participate on short-term programs, which is higher than national averages. These
programs generally include summer, winter intersession and any program lasting fewer than 8 weeks. 21.8% of UK
students participate on mid-length or one-semester programs, and 1.8% of students spend a full academic year
abroad.
Duration of Study 2014-2015 Enrollment
2015-2016 Enrollment
Percentage of EA Enrollment
National Averages (IIE, 2013-2014)
Short-term (0-8 weeks) 877 913 76.4% 62.1%
Mid-Length 209 260 21.8% 34.9%
Long-term 12 22 1.8% 3.0%
1,098 1,195 100% 100%
9 Students are classified by credit hours. 10 Calculated using the percentage of enrollment in 2015-2016 minus the 2014-2015 percentage.

26 | P a g e
Term of Study, For-Credit
Summer 2016 programs enrolled 51.6% of the total number of participants in 2015-2016. UK students generally
favor the spring semester (15.0%) over the fall semester (9.7%), which is generally the case at many public institutions.
Term of Study 2014-2015
EA Enrollment 2015-2016
EA Enrollment Percentage of EA
Enrollment Percentage Change
Academic Year 12 22 1.8% 83.3%
Fall 72 116 9.7% 61.1%
Fall Embedded 12 17 1.4% 41.7%
Winter 43 76 6.4% 76.7%
Spring 137 179 15.0% 30.7%
Spring Embedded 115 168 14.1% 46.1%
Summer 707 617 51.6% -12.7%
1,098 1,195 100.0% 8.8%
Program Type, For-Credit
In 2015-16, UK Sponsored programs enrolled 43.6% (521) of the total education abroad enrollment, followed by UK
Partner programs at 21.2% (253). UK Consortia programs enrolled 122 students, accounting for 10.2% of the total
enrollment.
Program Type 2014-2015
EA Enrollment 2015-2016
EA Enrollment
Percentage of EA Enrollment
Percentage Change
UK Sponsored 534 521 43.6% -2.4%
UK Partner 201 253 21.2% 25.9%
UK Consortia 133 122 10.2% -8.3%
UK Organization11 63 96 8.0% 52.4%
UK Independent12 60 71 5.9% 18.3%
UK Exchange 66 63 5.3% -4.5%
UK External 24 43 3.6% 79.2%
UK Direct 17 26 2.2% 52.9%
1,098 1,195 100.0% 8.8%
11 “UK Organization” is a designation that includes programs such as Shoulder to Shoulder Global and Alternative Service Breaks,
which were categorized as “UK Sponsored” in previous reports. Therefore, the enrollment number of UK Sponsored participants between this reporting year and previous years is not directly comparable.
12 “UK Independent” programs include medical rotations, independent study and research abroad, etc.

27 | P a g e
Enrollment Demographics by Experience Type13
Study abroad had the most participants out of all the experience types, but research abroad saw the most growth
across all demographics. The data suggests no particular trends favoring a particular experience type by race/ethnicity.
Experience Type/Ethnicity 2014-2015
EA Enrollment 2015-2016
EA Enrollment Percent Change
Study Abroad
African - American 57 55 -3.5%
Asian-American/ Pacific Islander 34 43 26.5%
Caucasian/White Non-Hispanic 737 738 0.1%
Hispanic - American 48 49 2.1%
Multiracial 25 42 68.0%
Native Amer./ Alaskan Native 1 0 -100.0%
Prefer Not to Answer/Other 70 44 -37.1%
Research Abroad
African - American 1 2 100.0%
Asian-American/ Pacific Islander 4 4 0.0%
Caucasian/White Non-Hispanic 22 37 68.2%
Hispanic - American 1 5 400.0%
Multiracial 0 3 300.0%
Native Amer./ Alaskan Native 0 0 --
Prefer Not to Answer/Other 4 6 50.0%
Intern Abroad
African - American 6 2 -66.7%
Asian-American/ Pacific Islander 2 1 -50.0%
Caucasian/White Non-Hispanic 39 37 -5.1%
Hispanic - American 1 1 0.0%
Multiracial 1 1 0.0%
Native Amer./ Alaskan Native 0 0 --
Prefer Not to Answer/Other 6 2 -66.7%
Teach Abroad
African - American 1 0 -100.0%
Asian-American/ Pacific Islander 0 0 --
Caucasian/White Non-Hispanic 13 23 76.9%
Hispanic - American 1 0 -100.0%
Multiracial 0 0 --
Native Amer./ Alaskan Native 0 0 --
Prefer Not to Answer/Other 1 1 0.0%
13 Some programs have multiple experience types. In those cases, each experience type was counted separately. Therefore, the totals
in this table will not equal the total number of EA participants.

28 | P a g e
Experience Type/Ethnicity 2014-2015
EA Enrollment 2015-2016
EA Enrollment Percent Change
Service Abroad
African - American 13 1 -92.3%
Asian-American/ Pacific Islander 4 4 0.0%
Caucasian/White Non-Hispanic 72 87 20.8%
Hispanic - American 7 5 -28.6%
Multiracial 5 0 -100.0%
Native Amer./ Alaskan Native 0 0 --
Prefer Not to Answer/Other 8 2 -75.0%

29 | P a g e
Enrollment Demographics, For-Credit
Race/Ethnicity
The data suggest that minority student participation has remained robust in UK’s Education Abroad programs. All racial
minority groups represent an equal or larger percentage in education abroad enrollments than campus-wide
enrollment, with the exception of African American students, whose proportion has fallen since last year.
Race/Ethnicity 2014-2015 Enrollment
2015-2016 Enrollment
Percentage of EA Enrollment
Percentage of UK Enrollment
National Avg. (IIE, 2013-2014)
African-American 70 60 5.0% 7.0% 5.6%
Asian-American/ Pacific Islander
39 52 4.4% 3.4% 7.7%
Caucasian/White Non-Hispanic
825 922 77.2% 78.0% 74.3%
Hispanic-American 55 60 5.0% 4.3% 8.3%
Multiracial 28 46 3.8% 2.9% 3.6%
Native Amer./ Alaskan Native
1 0 -- 0.2% 0.5%
Unreported 80 55 4.6% 4.2% --
1,098 1,195 100% 100% 100%
Gender
Although female students account for 53.5% of UK campus-wide enrollment, 68.0% of the education abroad enrollment
is disproportionately female. However, this is generally comparable to national education abroad enrollment trends as
reported in Open Doors.
Gender 2014-2015 Enrollment
2015-2016 Enrollment
Percentage of EA Enrollment
Percentage of UK Enrollment
National Avg. (IIE, 2013-2014)
Male 370 382 32.0% 46.5% 34.7%
Female 728 813 68.0% 53.5% 65.3%
1,098 1,195 100% 100% 100%

30 | P a g e
Gender by Region
As female students account for 68.0% of education abroad enrollment, it is not surprising to see that female student
enrollment was proportionately higher across regions. The data suggest that more men went to Europe and Latin
America in 2015-2016 than last year.
Region/Gender 2014-2015
EA Enrollment 2015-2016
EA Enrollment Percentage of EA
Enrollment by Region
Africa Male Female
17 45
11 38
22.4% 77.6%
Asia Male Female
47 68
29 49
37.2% 62.8%
Europe Male Female
245 470
256 476
35.0% 65.0%
Latin America Male Female
40 97
64
176
26.7% 73.3%
Middle East Male Female
2 2
3 7
30.0% 70.0%
North America Male Female
2 8
7 6
53.8% 46.2%
Multiple Regions Male Female
1 5
1 9
10.0% 90.0%
Oceania Male Female
16 33
11 52
17.5% 82.5%
1,098 1,195 --

31 | P a g e
LGBTQ
Unfortunately, UK does not collect data on sexual orientation. Data available via the Student Experience in the Research
University (SERU) survey based at the Center for Studies in Higher Education (CSHE) at the University of California,
Berkeley, suggest that LGBTQ students are more likely to study abroad compared to their peers. UK Education Abroad
does not collect this data at the time of application, but does ask students via a voluntary pre-departure survey. On
average, about 5% of students do identify as LGBTQ.
LGBTQ 2013-2014
EA Enrollment 2014-2015
EA Enrollment Percentage of EA
Enrollment Percentage of UK
Enrollment
LGBTQ n/a n/a n/a n/a
Not LGBTQ n/a n/a n/a n/a
Unreported n/a n/a n/a n/a
n/a n/a n/a n/a
Residency Status
The data show that significantly more in-state students than out-of-state students participated in education abroad
programs in 2015-2016, which matches with the overall campus proportion.
Residency Status 2014-2015
EA Enrollment 2015-2016
EA Enrollment Percentage of EA
Enrollment Percentage of UK
Enrollment
In-State 764 778 65.1% 68.2%
Out-of-State 334 417 34.9% 31.8%
1,098 1,195 100% 100%
Undergraduate First-Generation Status
11.7% (120) of undergraduate education abroad participants were first-generation students, which is lower than the
overall campus proportion.
First-Generation Status 2014-2015
Undergraduate EA Enrollment
2015-2016 Undergraduate EA
Enrollment
Percentage of Undergraduate EA
Enrollment
Percentage of Undergraduate UK
Enrollment14
First-Generation 152 120 11.7% 15.4%
Not First-Generation 766 905 88.3% 84.6%
Unreported 22 -- -- --
942 1,025 100% 100%
14 This data represents the proportion of undergraduate First-Generation students among all undergraduates at UK.

32 | P a g e
Undergraduate Honors Enrollment
20.2% of undergraduate education abroad participants are in the Honors Program, yet only about 7.4% of UK students
are, suggesting that education abroad programming appeals disproportionately to academically high achieving students.
This data does not reflect Chellgren, Gaines or other programs for high-achieving students.
Honors Enrollment 2014-2015
Undergraduate EA Enrollment
2014-2015 Undergraduate EA
Enrollment
Percentage of Undergraduate EA
Enrollment
Percentage of Undergraduate UK
Enrollment
Honors 170 207 20.2% 7.4%
Not Honors 772 818 79.8% 92.6%
942 1,025 100% 100%
Undergraduate vs. Graduate/Professional Enrollment
Not surprisingly, undergraduate students disproportionately enroll in credit-bearing education abroad programs,
reflecting 85.8% of the total enrollment.
Student Classification 2014-2015
EA Enrollment 2015-2016
EA Enrollment Percentage of EA
Enrollment Percentage of UK
Enrollment
Undergraduate 942 1,025 85.8% 73.6%
Graduate & Prof. 156 170 14.2% 26.4%
1,098 1,195 100% 100%
Athlete Enrollment
Athletes are traditionally underrepresented in Education Abroad programming. For the purposes of this report,
“athletes” are those students who participate on an athletic team at UK, but who are not necessarily on scholarship.
Student Classification 2014-2015
EA Enrollment 2015-2016
EA Enrollment Percentage of EA
Enrollment Percentage of UK
Enrollment
Athlete 11 1 0.1% 2.1%
Non-Athlete 1,087 1,194 99.9% 97.9%
1,098 1,195 100% 100%

33 | P a g e
Disabled Student Enrollment
Students with disabilities are traditionally underrepresented in Education Abroad programming. For the purposes of this
report, “disabled students” are those who have registered with the UK Disability Resource Center.
Student Classification
2014-2015 EA Enrollment
2015-2016 EA Enrollment
Percentage of EA Enrollment
Percentage of UK Enrollment
Disabled 37 75 6.3% 6.2%
Non-Disabled 1,061 1,120 93.7% 93.8%
1,098 1,195 100% 100%
Veteran Enrollment
All students who have previously served in the U.S. Armed Forces are categorized as veterans. Although about 1.7 % of
the UK student body has veteran status, they remain underrepresented in Education Abroad programming.
Student Classification
2014-2015 EA Enrollment
2015-2016 EA Enrollment
Percentage of EA Enrollment
Percentage of UK Enrollment
Veteran 10 6 0.5% 1.7%
Non-Veteran 1,088 1,189 99.5% 98.3%
1,098 1,195 100% 100%
Singletary Scholar Enrollment
The Singletary Scholarship is the university’s most prestigious undergraduate scholarship, and is awarded to
exceptionally high-achieving students. Enrollment of Singletary Scholars in Education Abroad programming is already
much higher than the campus proportion, but is expected to decrease in coming years as recent changes to eliminate
the summer scholarship.
Student Classification
2014-2015 Undergraduate EA
Enrollment
2015-2016 Undergraduate EA
Enrollment
Percentage of Undergraduate EA
Enrollment
Percentage of Undergraduate UK
Enrollment
Singletary 31 36 3.5% 0.6%
Non-Singletary 911 989 96.5% 99.4%
942 1,025 100% 100%

34 | P a g e
Pell Grant Recipient Enrollment
Students receiving Pell Grants are also eligible to apply for the Benjamin A. Gilman International Scholarship.
Nonetheless, Pell Grant recipients remain underrepresented in Education Abroad programming.
Student Classification
2014-2015 EA Enrollment
2015-2016 EA Enrollment
Percentage of EA Enrollment
Percentage of UK Enrollment
Pell Grant Recipient 126 130 10.9% 23.0%
Non-Pell Grant Recipient
972 1,065 89.1% 77.0%
1,098 1,195 100% 100%
Transfer Student Enrollment
Students who transfer from other institutions are generally underrepresented in Education Abroad enrollments. This
was not the case for students at UK during this academic year. Only undergraduate students are counted in this data.
Student Classification
2014-2015 Undergraduate EA
Enrollment
2015-2016 Undergraduate EA
Enrollment
Percentage of Undergraduate EA
Enrollment
Percentage of Undergraduate UK
Enrollment
Transfer Student 111 104 10.1% 15.5%
Non-Transfer Student 831 921 89.9% 84.5%
942 1,025 100% 100%
Chellgren Fellow Enrollment
The Chellgren Fellowship is a highly selective honor conferred on high achieving undergraduate students. The program
aims to cultivate academic achievement through extracurricular experiences and scholarship advising. Nearly 3% of
undergraduate Education Abroad participants were Chellgren Fellows- much higher than the campus proportion.
Student Classification
2014-2015 Undergraduate EA
Enrollment
2015-2016 Undergraduate EA
Enrollment
Percentage of Undergraduate EA
Enrollment
Percentage of Undergraduate UK
Enrollment
Chellgren Fellow 17 29 2.8% 0.2%
Non-Chellgren Fellow 925 996 97.2% 99.8%
942 1,025 100% 100%

35 | P a g e
Benchmark Institutions, Open Doors 2013-2014
The University of Kentucky ranks last among our benchmark institutions with regard to education abroad participation.
Among the nearly 900 institutions reporting education abroad enrollment data to the Institute of International
Education for the 2015 report (based on 2013-2014 enrollment data), UK ranks at 62. At the top among our benchmarks,
the University of Michigan - Ann Arbor sends more than two times as many students abroad as the University of
Kentucky. Note: The IIE Open Doors Report has different reporting guidelines (i.e., non-degree seeking students,
international student participation, etc.).
2015 Nat. Rank
Institution Student Body
Population EA Enrollment
2012-2013 EA Enrollment
2013-2014 % Change
5 University of Michigan - Ann Arbor 43,651 2,365 2,719 15.0%
6 University of Minnesota - Twin Cities 51,147 2,555 2,634 3.1%
7 Ohio State University 62,270 2,255 2,539 12.6%
8 Michigan State University 50,543 2,514 2,478 -1.4%
10 University of Wisconsin - Madison 43,389 2,157 2,276 5.5%
17 University of Florida 49,459 2,036 2,104 3.3%
22 University of North Carolina - Chapel Hill
29,135 1,682 1,859 10.5%
44 University of California - Davis 35,186 1,127 1,331 18.1%
47 University of Arizona 42,236 1,193 1,255 5.2%
51 University of Iowa 32,150 1,248 1,172 -6.1%
52 University of Missouri - Columbia 35,424 1,209 1,168 -3.4%
62 University of Kentucky 29,203 852 1,029 20.8%

36 | P a g e
Southeastern Conference Institutions, Open Doors 2013-2014
The University of Kentucky ranks sixth among the fourteen institutions of the Southeastern Conference. At the top
among SEC schools, Texas A&M University sends more than twice as many students abroad as the University of
Kentucky. Because of a consortium agreement, students at any SEC school can study abroad on programs at any other
SEC school at the in-state tuition rate.
2015 Nat. Rank
Institution Student Body
Population EA Enrollment
2012-2013 EA Enrollment
2013-2014 % Change
3 Texas A&M University 64,676 2,254 2,911 29.1%
11 University of Georgia 36,130 2,014 2,240 11.2%
17 University of Florida 49,459 2,036 2,104 3.3%
36 University of South Carolina - Columbia
33,772 1,299 1,453 11.9%
52 University of Missouri - Columbia 35,424 1,209 1,168 -3.4%
62 University of Kentucky 29,203 852 1,029 20.8%
69 University of Alabama 37,100 949 990 4.3%
71 University of Tennessee - Knoxville 27,845 970 984 1.4%
78 Auburn University 27,287 973 925 -4.9%
99 University of Arkansas - Main Campus
26,754 667 750 12.4%
119 Louisiana State University 31,044 618 619 0.2%
159 University of Mississippi - Main Campus
22,903 476 491 3.2%
335 Mississippi State University 20,138 185 241 30.3%
-- Vanderbilt University 12,567 749 -- --

37 | P a g e
Commonwealth of Kentucky, Open Doors 2013-2014
The University of Kentucky ranked as the largest sending institution in the Commonwealth of Kentucky, reporting to the
Institute of International Education that it awarded academic credit for study abroad to 1,029 of its students in 2013-
2014. It was followed by the University of Louisville (795) and Western Kentucky University (558).
2015 Nat. Rank
Institution Student Body
Population EA Enrollment
2012-2013 EA Enrollment
2013-2014 % Change
62 University of Kentucky 29,203 852 1,029 20.8%
89 University of Louisville 22,367 719 795 10.6%
137 Western Kentucky University 20,171 544 558 2.6%
230 Centre College 1,367 379 365 -3.7%
266 Murray State University 10,998 310 316 1.9%
285 Northern Kentucky University 15,090 277 296 6.9%
344 Berea College 1,643 161 231 43.5%
406 Bellarmine University 3,846 202 185 -8.4%
465 Transylvania University 1,056 131 151 15.3%
540 Eastern Kentucky University 16,305 -- 111 --
853 Campbellsville University 3,427 10 22 120.0%
863 Georgetown College 979 46 21 -54.3%
-- Kentucky Wesleyan College 709 11 -- --
-- Kentucky State University 1,433 -- -- --