education analyticsedudownloads.azureedge.net/msdownloads/microsoft...education analytics white...
TRANSCRIPT

Education Analytics White paper March 2017

Education Analytics white paper | March 2017 2
Table of Contents
1 Executive summary ................................................................................................................................................................ 3
2 IT trends ..................................................................................................................................................................................... 3
2.1 Cloud based services ............................................................................................................................................................. 5
2.2 Drivers for cloud based services ....................................................................................................................................... 5
2.3 Cloud service models ............................................................................................................................................................ 6
2.4 Data analytics in cloud ......................................................................................................................................................... 7
2.5 Microsoft Services Advanced Analytics offering ........................................................................................................ 9
3 Analytics overview ............................................................................................................................................................... 10
4 Analytics in education........................................................................................................................................................ 14
4.1 Opportunities for analytics in education ..................................................................................................................... 15
4.2 Student success ..................................................................................................................................................................... 16
5 Case: Improving graduation in vocational education in Finland ...................................................................... 19
5.1 User scenarios ........................................................................................................................................................................ 20
5.2 Solution elements ................................................................................................................................................................ 21
5.3 Technology stack .................................................................................................................................................................. 22
6 Getting there ......................................................................................................................................................................... 23
7 References .............................................................................................................................................................................. 26
8 Acknowledgements ............................................................................................................................................................ 27

Education Analytics white paper | March 2017 3
1 Executive summary
The purpose of this document is to describe how schools and school systems can utilize advanced data
analytics to better achieve the goals in education and how modern technologies offer new opportunities for
education system effectiveness, better learning outcomes, and personalization of learning.
The document first describes major IT trends and then continues to explain analytics in general. Chapter four
deep dives in education analytics and also presents some case studies in which advanced analytics are
applied.
Chapter five describes the ongoing pilot project to improve the graduation rate of Finnish vocational schools.
Finally, chapter six presents a framework for analytics projects.
Technology discussed in this document is based on Microsoft Azure and Microsoft Power BI.
2 IT trends
IT trends show where technology is moving. Education and IT leaders are using technologies driven by
today’s IT trends to outpace change and the competition. Organizations need to understand today’s IT
trends and the industry changes that are happening along with them, and begin to use these emerging
technologies to their advantage.
A massive transformation in the education landscape has begun, driven by consumers adopting new trends,
or megatrends, that are based around new social and application patterns, huge data consumption, cloud
computing and mobility.
Picture 1 - IT Trends
Education Analytics white paper | March 2017 4
Mobility. As smartphones and tablets become more capable and user interfaces become more natural, old
methods of computing seem place-bound and much less intuitive. People increasingly expect to be
connected to the Internet wherever they go, and the majority of them use a mobile device to do so. The
unprecedented evolution of these devices and the apps that run on them has opened the door to a myriad
of uses for education. Schools all over the world are adopting apps into their curricula and modifying
websites and educational materials so they are optimized for these devices. The significance for teaching and
learning is that the apps have the potential to facilitate almost any educational experience, allowing learners
to organize virtual video meetings with peers all over the world, use specialized software and tools, and
collaborate on shared documents or projects.
Social refers to a growing trend towards social networking online as an evolution of e-learning rather than a
major paradigm shift. Social tools can help organizations excel by allowing people to connect in ways that
are familiar to them in their personal lives and by spurring creativity and innovation. Microsoft can help
organizations take advantage of social media and integrate it with new and existing communication tools.
Business opportunities for social enterprise can include communicating with students, faculty, and staff in
new ways and improving internal collaboration. Social tools that meet the expectations of multiple
generations of workers can reduce costs and allow organizations to respond faster to new opportunities.
Using tools to share ideas and collaborate in a way that provides a more direct link to customers can help
educational organizations improve the value of customer relationships and respond to opportunity with
speed and intelligence.
Data refers to data sets that are large and complex that need to be processed, stored, shared, analysed, and
used to help make smarter decisions in both the learning process and the management of the institution.
The combination of social networking as a way of life, and the ever-growing number of devices on which
people stay connected, continues to generate untapped sources of data that could help organizations to be
more proactive. But the unprecedented volume, velocity, and variety of the data available make it more
challenging to properly analyse and mine for potential organizational value. As organizations begin to deeply
explore what big data can do for them, it’s important that the chosen enterprise solution is able to address
both business intelligence and big data. Microsoft thinks of this approach as business analytics.
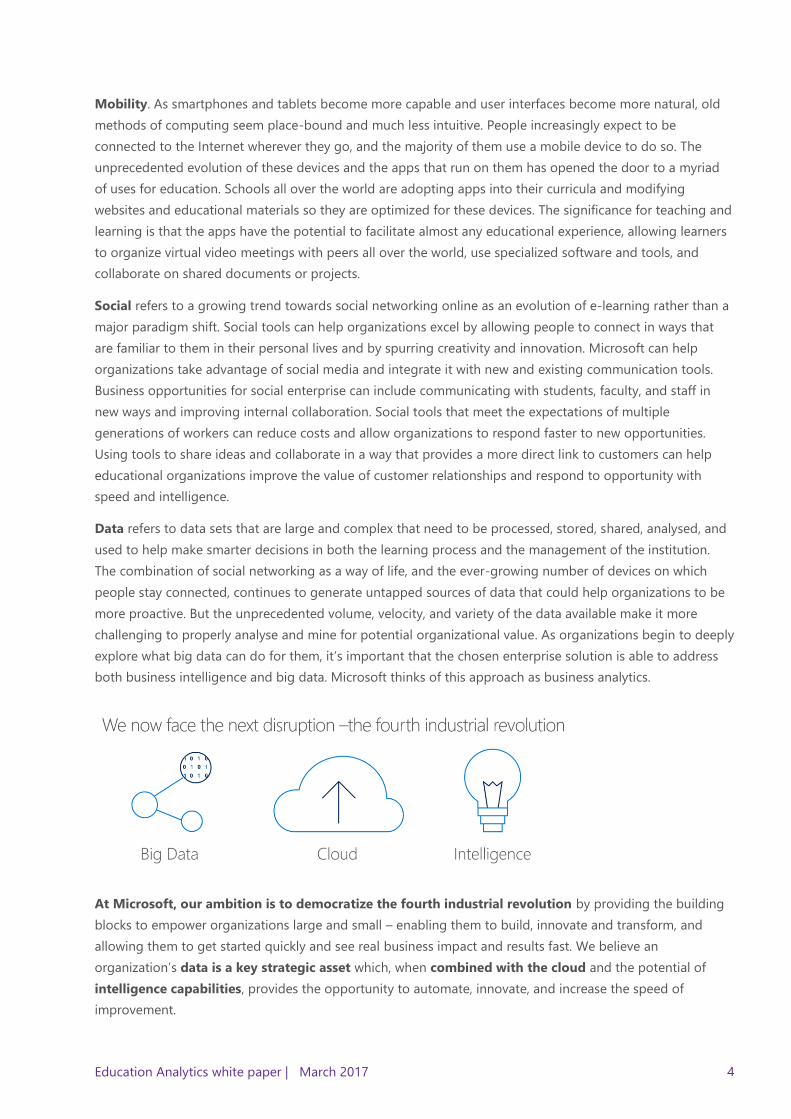
At Microsoft, our ambition is to democratize the fourth industrial revolution by providing the building
blocks to empower organizations large and small – enabling them to build, innovate and transform, and
allowing them to get started quickly and see real business impact and results fast. We believe an
organization’s data is a key strategic asset which, when combined with the cloud and the potential of
intelligence capabilities, provides the opportunity to automate, innovate, and increase the speed of
improvement.
Education Analytics white paper | March 2017 5
Cloud computing refers to expandable, on-demand services and tools that are served to the user via the
Internet from specialized data centres and consume almost no local processing or storage resources. Cloud
computing resources support collaboration, file storage, virtualization, and access to computing cycles, and
the number of available applications that rely on cloud technologies has grown to the point that few
education institutions do not make some use of the cloud, whether as a matter of policy or not. Over the
past few years, cloud computing has been firmly established as an efficient way for businesses to protect
data and deliver software and online platforms. Schools are deploying similar strategies to boost
collaboration, productivity, and mobility in teaching and learning.
2.1 Cloud based services
Most people now agree that cloud based services have become a core element of any enterprise’s
technology strategy. Indeed, in the past few years we have seen the conversation around cloud adoption
move from “if” to “when” and “how.” Cloud based services are one of the most disruptive changes in
computing in years. Their value proposition is many-faceted, ranging from significant cost savings over a
traditional datacenter approach to the ability to quickly build robust, resilient applications that can scale up
as traffic spikes, and scale down as it recedes.
Cloud solutions overall will decrease implementation and innovation costs, and with unlimited resources
scalability is not an issue anymore. Users can access applications and services from anywhere, anytime, and
with any device.
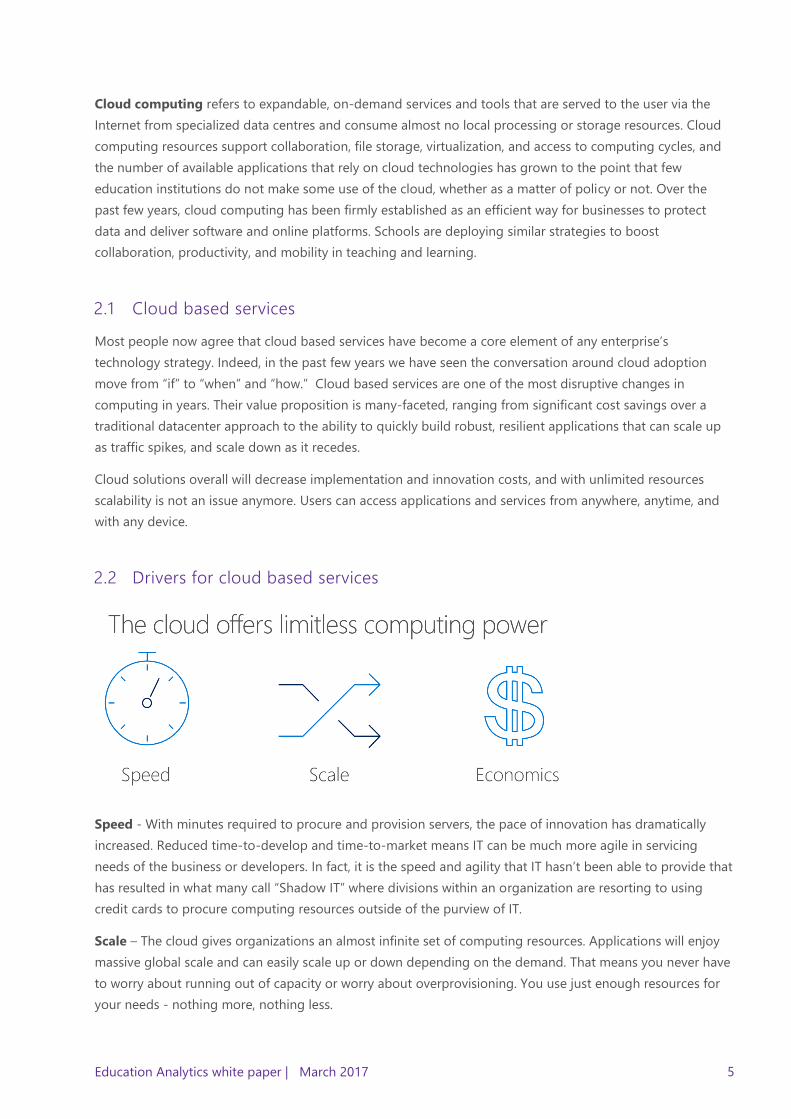
2.2 Drivers for cloud based services
Speed - With minutes required to procure and provision servers, the pace of innovation has dramatically
increased. Reduced time-to-develop and time-to-market means IT can be much more agile in servicing
needs of the business or developers. In fact, it is the speed and agility that IT hasn’t been able to provide that
has resulted in what many call “Shadow IT” where divisions within an organization are resorting to using
credit cards to procure computing resources outside of the purview of IT.
Scale – The cloud gives organizations an almost infinite set of computing resources. Applications will enjoy
massive global scale and can easily scale up or down depending on the demand. That means you never have
to worry about running out of capacity or worry about overprovisioning. You use just enough resources for
your needs - nothing more, nothing less.

Education Analytics white paper | March 2017 6
Economics – Customers are paying only for what they use in the cloud. This saves money for any application
that has variable computing needs. For some organizations, there is also an additional benefit of changing
capital expenses to operating expenses, which frees up capital from infrastructure investments so it can be
put to other uses.
2.3 Cloud service models
Public Cloud Services can be divided into three different service models; IaaS, SaaS, and PaaS.
Infrastructure as a Service (IaaS) - In IaaS, the application virtual machines (VMs) are simply moved from
on-premises to the cloud. This is the easiest migration strategy and has many benefits and cost savings. But
it still means that your operations staff will need to perform such tasks as patch management, updates, and
upgrades. Nevertheless, IaaS is one of the most common cloud deployment patterns to date because it
reduces the time between purchasing and deployment to almost nothing. Additionally, because it is the most
similar to how IT operates today, it provides an easy onboarding ramp for the IT culture and processes of
today.
Platform as a Service (PaaS) - In PaaS, the cloud provider maintains all system software, removing the
burden of upgrades and patches from the IT department. PaaS is similar to the traditional three-tier model of
enterprise software, having a presentation layer (called Web Role), a business logic layer (called Worker Role),
and persistent storage (Microsoft Azure SQL Database or another database). In a PaaS deployment model, all
that the enterprise needs to focus on is in deploying its code on the PaaS machines; the cloud provider
ensures that operating systems, database software, integration software, and other features are maintained,
kept up to date, and achieve a high service level agreement (SLA).
Software as a Service (SaaS) - In SaaS, you simply rent an application from a vendor, such as Microsoft
Office 365 for email and productivity. This is by far the most cost-effective of all the options because typically
the only work involved for the IT department is provisioning users and data and, perhaps, integrating the
application with single sign-on (SSO). Typically, SaaS applications are used for functions that are not
considered business-differentiating, for which custom or customized applications encode the competitively
differentiating business models and rules.
Education Analytics white paper | March 2017 7
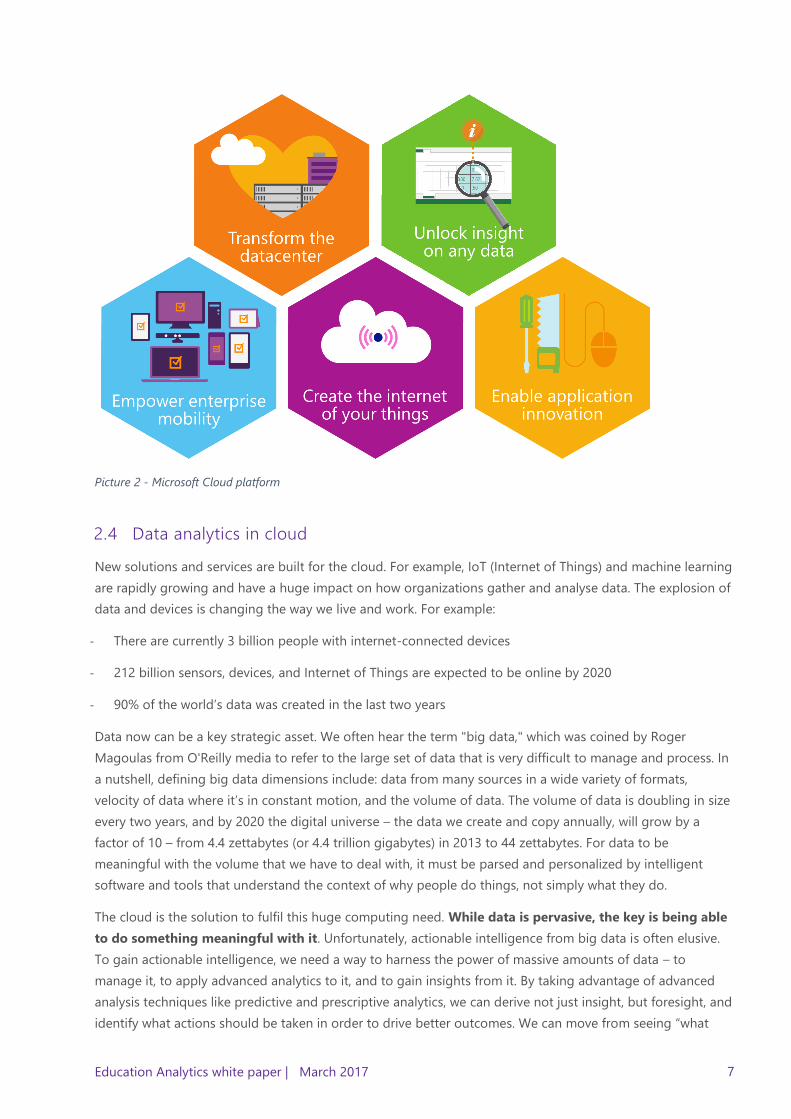
Picture 2 - Microsoft Cloud platform
2.4 Data analytics in cloud
New solutions and services are built for the cloud. For example, IoT (Internet of Things) and machine learning
are rapidly growing and have a huge impact on how organizations gather and analyse data. The explosion of
data and devices is changing the way we live and work. For example:
- There are currently 3 billion people with internet-connected devices
- 212 billion sensors, devices, and Internet of Things are expected to be online by 2020
- 90% of the world’s data was created in the last two years
Data now can be a key strategic asset. We often hear the term "big data," which was coined by Roger
Magoulas from O'Reilly media to refer to the large set of data that is very difficult to manage and process. In
a nutshell, defining big data dimensions include: data from many sources in a wide variety of formats,
velocity of data where it’s in constant motion, and the volume of data. The volume of data is doubling in size
every two years, and by 2020 the digital universe – the data we create and copy annually, will grow by a
factor of 10 – from 4.4 zettabytes (or 4.4 trillion gigabytes) in 2013 to 44 zettabytes. For data to be
meaningful with the volume that we have to deal with, it must be parsed and personalized by intelligent
software and tools that understand the context of why people do things, not simply what they do.
The cloud is the solution to fulfil this huge computing need. While data is pervasive, the key is being able
to do something meaningful with it. Unfortunately, actionable intelligence from big data is often elusive.
To gain actionable intelligence, we need a way to harness the power of massive amounts of data – to
manage it, to apply advanced analytics to it, and to gain insights from it. By taking advantage of advanced
analysis techniques like predictive and prescriptive analytics, we can derive not just insight, but foresight, and
identify what actions should be taken in order to drive better outcomes. We can move from seeing “what

Education Analytics white paper | March 2017 8
happened” and understanding “why it happened” to predicting “what will happen” and ultimately, knowing
“what should I do.” This lets us move from manual, people-heavy decision-making to automated, machine-
assisted decisions that accelerate business and aid competitive advantage. At the platform level Microsoft
Cortana Intelligence Suite and Azure Machine Learning provides powerful cloud-based predictive analytics.
Picture 3 - Cortana Intelligence Suite overview
Cortana Intelligence delivers an end-to-end platform with an integrated and comprehensive set of tools and
services to help build intelligent applications that let us easily take advantage of advanced analytics and
intelligence capabilities. First, Cortana Intelligence provides services to bring data in, so that we can analyse
it. Cortana Intelligence provides information management capabilities like Azure Data Factory so that we can
pull data from any source in an automated and scheduled way, while performing the necessary data
transforms. Think ETL (Extract, Transform, Load) in the cloud. Event Hubs does the same for IoT type
ingestion of data that streams in from lots of end points. The data brought in then can be persisted in
flexible big data storage services like Data Lake Store and Azure SQL Data Warehouse. We can then use a
wide range of analytics services from Azure Machine Learning to Azure Data Lake Analytics to Azure
HDInsight (Hadoop) to Azure Stream Analytics to analyse the data stored in the big data storage. This allows
us to create analytics services and models specific to our business need. The analytics services and models
created by taking these steps can then be surfaced as interactive dashboards and visualizations via Power BI.
These same analytics services and models created can also be integrated into various different UI (web apps
or mobile apps or rich client apps), or with Cortana. At a high level, Cortana Intelligence capabilities are in
three main areas: data, analytics, and intelligence.

Education Analytics white paper | March 2017 9
Picture 4 – Cortana Intelligence capabilities
2.5 Microsoft Services Advanced Analytics offering
Microsoft Services is offering customers an entry point to Advanced Analytics. This offer was developed to
provide customers a tightly-scoped, 3-week proof-of-value to quickly demonstrate business outcomes by
implementing a predictive model with Azure Machine Learning techniques.
This offer exists for Microsoft Services to take a customer from business problem to business solution using
predictive methods. The idea of this jumpstart is to engage with business decision makers to show how
quickly business outcomes can be achieved with tools they already own or are going to use.
Microsoft Services brings the deepest expertise in Microsoft solutions – from enterprise planning to
distribution and support to education-specific workloads – to help you achieve a strategic advantage in your
industry. Wherever you are in your journey to revamp your data visualization experience, we will work with
you to develop the right solution for yourschool by using a highly collaborative, consultative approach that
has demonstrated success in organizations around the world.
The objective is to provide the architectural design for a specific use case, distribution, and configuration of
the Azure environment, custom development of Azure components, and plans for the development and
distribution of the final version of the solution.
Education Analytics white paper | March 2017 10
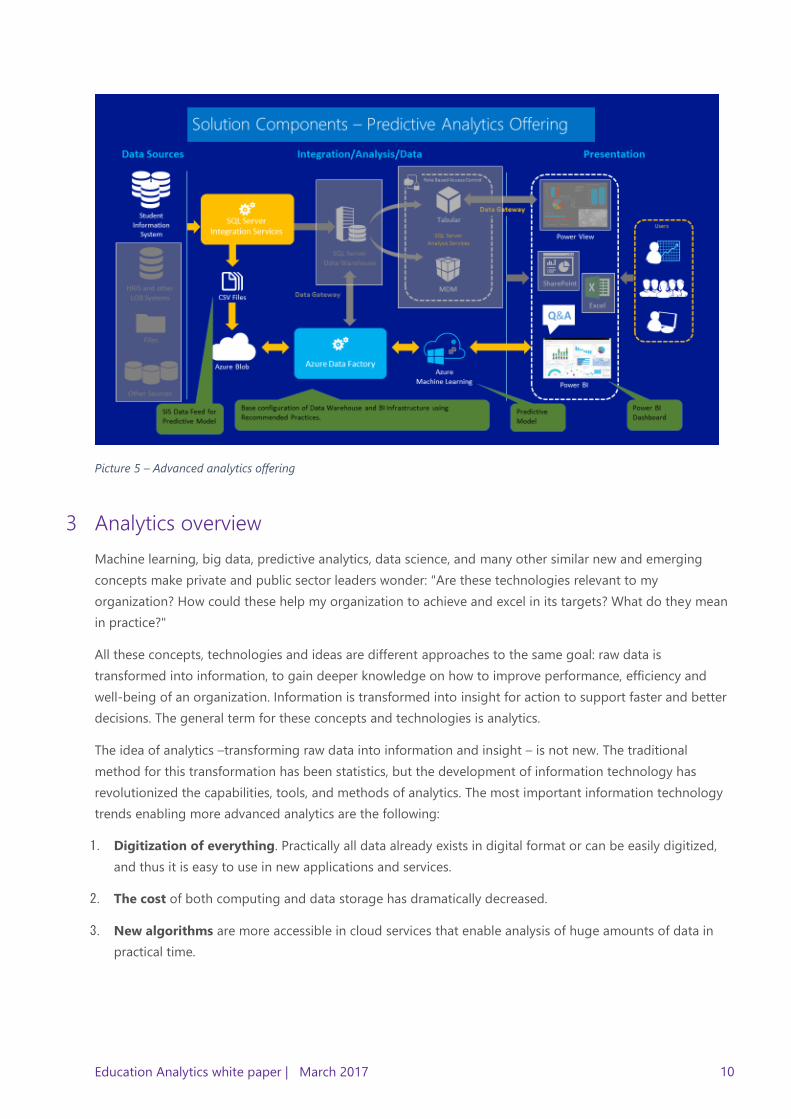
Picture 5 – Advanced analytics offering
3 Analytics overview
Machine learning, big data, predictive analytics, data science, and many other similar new and emerging
concepts make private and public sector leaders wonder: "Are these technologies relevant to my
organization? How could these help my organization to achieve and excel in its targets? What do they mean
in practice?"
All these concepts, technologies and ideas are different approaches to the same goal: raw data is
transformed into information, to gain deeper knowledge on how to improve performance, efficiency and
well-being of an organization. Information is transformed into insight for action to support faster and better
decisions. The general term for these concepts and technologies is analytics.
The idea of analytics –transforming raw data into information and insight – is not new. The traditional
method for this transformation has been statistics, but the development of information technology has
revolutionized the capabilities, tools, and methods of analytics. The most important information technology
trends enabling more advanced analytics are the following:
1. Digitization of everything. Practically all data already exists in digital format or can be easily digitized,
and thus it is easy to use in new applications and services.
2. The cost of both computing and data storage has dramatically decreased.
3. New algorithms are more accessible in cloud services that enable analysis of huge amounts of data in
practical time.
Education Analytics white paper | March 2017 11
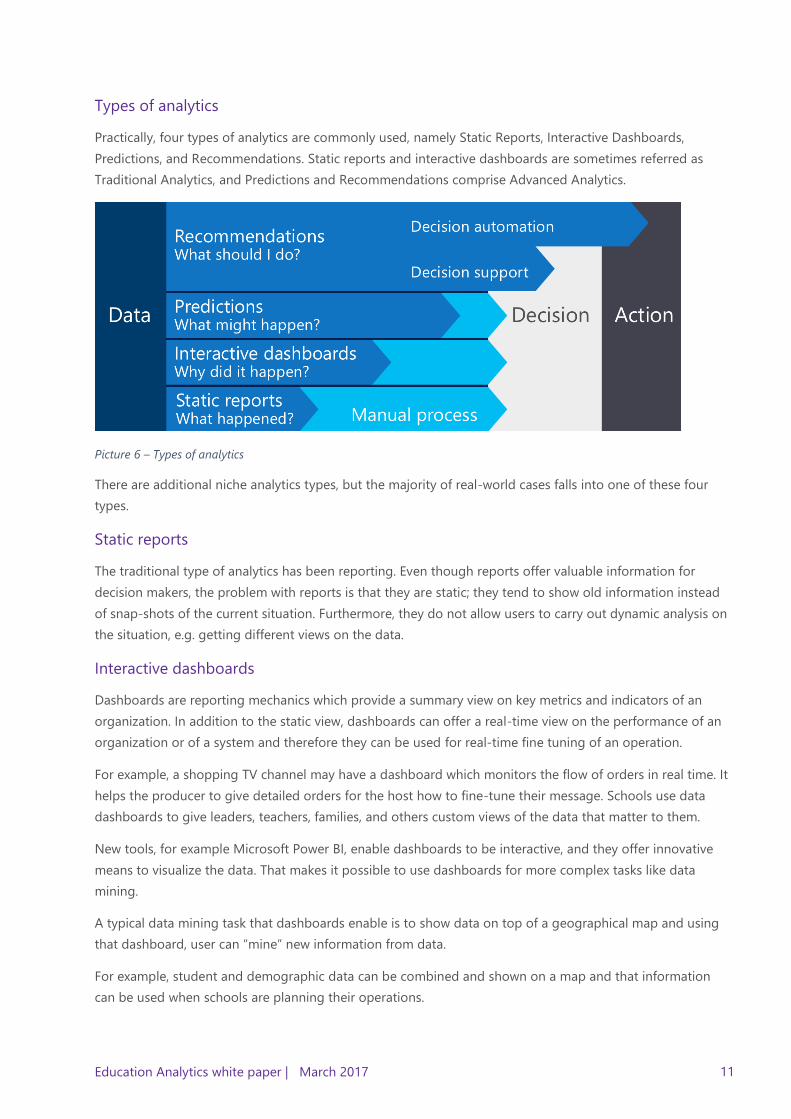
Types of analytics
Practically, four types of analytics are commonly used, namely Static Reports, Interactive Dashboards,
Predictions, and Recommendations. Static reports and interactive dashboards are sometimes referred as
Traditional Analytics, and Predictions and Recommendations comprise Advanced Analytics.
Picture 6 – Types of analytics
There are additional niche analytics types, but the majority of real-world cases falls into one of these four
types.
Static reports
The traditional type of analytics has been reporting. Even though reports offer valuable information for
decision makers, the problem with reports is that they are static; they tend to show old information instead
of snap-shots of the current situation. Furthermore, they do not allow users to carry out dynamic analysis on
the situation, e.g. getting different views on the data.
Interactive dashboards
Dashboards are reporting mechanics which provide a summary view on key metrics and indicators of an
organization. In addition to the static view, dashboards can offer a real-time view on the performance of an
organization or of a system and therefore they can be used for real-time fine tuning of an operation.
For example, a shopping TV channel may have a dashboard which monitors the flow of orders in real time. It
helps the producer to give detailed orders for the host how to fine-tune their message. Schools use data
dashboards to give leaders, teachers, families, and others custom views of the data that matter to them.
New tools, for example Microsoft Power BI, enable dashboards to be interactive, and they offer innovative
means to visualize the data. That makes it possible to use dashboards for more complex tasks like data
mining.
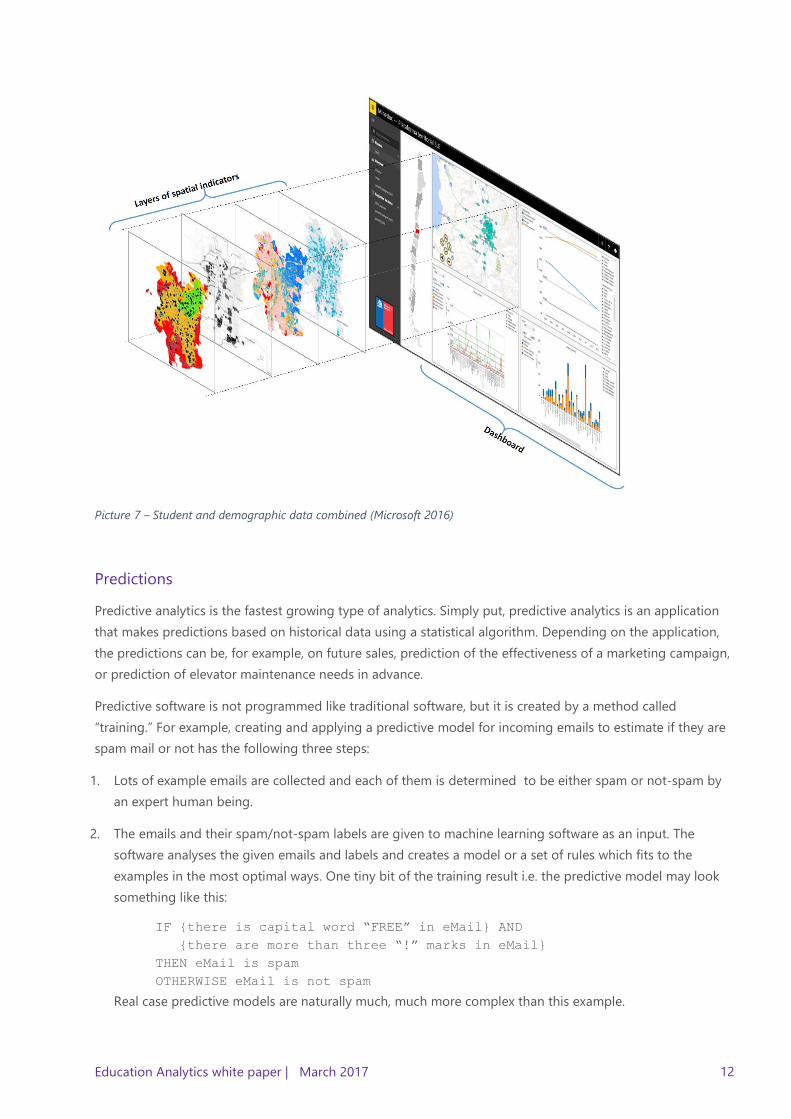
A typical data mining task that dashboards enable is to show data on top of a geographical map and using
that dashboard, user can “mine” new information from data.
For example, student and demographic data can be combined and shown on a map and that information
can be used when schools are planning their operations.
Education Analytics white paper | March 2017 12
Picture 7 – Student and demographic data combined (Microsoft 2016)
Predictions
Predictive analytics is the fastest growing type of analytics. Simply put, predictive analytics is an application
that makes predictions based on historical data using a statistical algorithm. Depending on the application,
the predictions can be, for example, on future sales, prediction of the effectiveness of a marketing campaign,
or prediction of elevator maintenance needs in advance.
Predictive software is not programmed like traditional software, but it is created by a method called
“training.” For example, creating and applying a predictive model for incoming emails to estimate if they are
spam mail or not has the following three steps:
1. Lots of example emails are collected and each of them is determined to be either spam or not-spam by
an expert human being.
2. The emails and their spam/not-spam labels are given to machine learning software as an input. The
software analyses the given emails and labels and creates a model or a set of rules which fits to the
examples in the most optimal ways. One tiny bit of the training result i.e. the predictive model may look
something like this:
IF {there is capital word “FREE” in eMail} AND
{there are more than three “!” marks in eMail}
THEN eMail is spam
OTHERWISE eMail is not spam
Real case predictive models are naturally much, much more complex than this example.
Education Analytics white paper | March 2017 13
3. The accuracy of the predictive model is tested, and if the prediction error meets the criteria, the model is
taken into use and applied to the incoming emails.
The importance of having lots of training data cannot be overemphasized. It is absolutely crucial to achieve a
low level of error in the model. Common wisdom in the analytics community is that lowest prediction error is
not achieved by someone having the most intelligent machine learning algorithm, but by the one who has
the most training data. School systems are able to predict student performance such as course grade, level of
standard attainment, or likelihood of completing a program by training the algorithm to recognize indicators
of success or risk in individuals.
Recommendations
The fourth type of analytics is recommendations, also called Prescriptive Analytics as the applications answer
questions like, “what action or selection, or chain of actions or selections optimally meets the target?”
Everyday examples of prescriptive analytics are online TV or movie providers’ recommendations for
customers on what movie they would like. This same technology can be applied for a variety of other
applications, for example an application recommending books and courses or selecting which
advertisements to show for a user. These applications are often called recommender systems or
recommendation systems.
Another category of prescriptive analytics is automated planning in which the application proposes an action
or set of actions which leads to an optimal result. In simpler cases the application only recommends the
actions to be done, but in more advanced cases the application not only selects the actions, but also
executes the actions automatically. An extreme example of automated planning with automated actions is
stock market robots. They analyse stock markets in real time and automatically submit sales and purchase
orders to the stock exchange.
In education, schools have begun predicting student success probability and getting recommendations such
as effective intervention programs, or recommended pieces of learning content for a student's lesson, or
even a recommended peer who is working toward the same learning goal and shares a learning preference.
Top management view on analytics
Analytics tools and technologies can cause leaders to feel bewildered by new terms and concepts. However,
leaders should lift discussions from technology and tools to a higher abstraction level, to the level of
strategic objectives and goals of an organization.
So instead of discussing whether an organization should apply predictive analytics, or set-up a
recommendation system, leaders should ask questions like, “how can these technologies improve student
retention?”, “Can we improve planning accuracy by predictive analytics?”, or “How much we can lower costs
by automated planning?”
Microsoft’s view on data and analytics
Microsoft’s point of view, in the spirit of democratizing use of data and analytics for all, revolves around
offering a set of platform services for customers and partners to leverage in their journey of building a data
pipeline for deeper insights. The Microsoft Cloud and Data Platform, Azure, provides end-to-end data

Education Analytics white paper | March 2017 14
solutions that ease and accelerate business transformation. As we have discussed, data plays a key role as we
connect our assets, optimize them, and learn from them in both real time and over the long term. Microsoft’s
data approach is complete and robust – built around a core set of tools and services within our overall data
platform. It all begins with your ability to collect and manage a variety of data types in a way that is fast,
secure, and cost-effective. That allows for rapid transformation and analysis of that raw data into something
that's ready and useful for the organization to then visualize and apply to decisions. Now, when all of this is
working together, that’s when the data dividends start adding up. We get the insight, we get the real-time
visibility; we get the ability to proactively make decisions that allow you to differentiate and be the disruptor.
This is what a data-driven digital business looks like with an aligned culture that is empowered to discover, to
look at things differently, and to collaborate.
Picture 8 – From questions to results
4 Analytics in education
Educators and researchers have learned that, “No single way of teaching works best with all students.
Because students differ in motivation, interests, and abilities, using a wide repertoire of approaches…is
essential” (Cuban, n.p., 2015). Among the 138 influences on learning examined by Hattie (2014), positive
influences include acceleration, feedback, spaced practice, mastery learning, and time on task. Given that we
know each student has unique and ever-changing needs, and we know a great deal about factors that
influence learning, how do teachers personalize the learning experience for each student? How do schools
select approaches and content that work well for learning? In recent years, we have answered these
questions with the help of data. Across many countries, teachers and school leaders have access to
increasing flows of data and data tools including custom report dashboards. These data and reports have
positively influenced teaching and learning by providing a clear view of student progress. However, the data
tools do not always offer recommendations for a student’s next steps in learning, and they require
specialized skills as well as time for best effect. New reports show that while “virtually all teachers (93%)
regularly use some form of digital tool to guide instruction, more than two-thirds of teachers (67%), across a
vast range of schools [in the U.S.], say they are not fully satisfied with the effectiveness of the data or the
tools for working with data that they have access to on a regular basis” (Gates Foundation, 2015, p.3).
Education Analytics white paper | March 2017 15
4.1 Opportunities for analytics in education
What if teachers had detailed windows into each student’s past learning? What if school leaders had these
windows into learning and teaching for their schools? What if these views of learning looked into the future
as well as the past?
Imagine if you could proactively identify students needing additional support and coordinate the
additional resources necessary to improve performance and contribute to a higher academic rating for the
school. Also, imagine if you could provide students the means to effectively plan, connect, collaborate,
research, and gain insight from others whether physically or virtually on campus.
Schools and education systems face complexity in preparing diverse students for a dynamic future. Part of
monitoring and evaluating their progress is collecting data on student learning and system performance. As
these datasets have grown larger and more complex, the tools and capacity to leverage data for improved
outcomes has not always kept pace.
Now schools and educators have access to new data and analytics tools that help them with the complexity
of education. Students' static data (for example, demographics; past attainment) and dynamic data (for
example, pattern of online logins; quantity of discussion posts) can be better understood by educators with
powerful data visualization tools that can be customized for each user, can answer specific questions and can
dynamically update to provide current information. Today's advanced analytics tools like machine learning
can show the trajectory that students are on (for example, at risk; high achiever; social learner), and hence
make more timely interventions possible (for example, offering extra social and academic support; presenting
more challenging tasks) (Shum, S.B., 2012).
- Terms and conceptual model on education analytics
Tools like Power BI and Azure Machine Learning give educators and school leaders powerful self-serve
capabilities to view, analyse, and make predictions from data, thus turning the cost of data into advantage. In
addition to reports on past and current performance viewed dynamically using Power BI, Azure Machine
Learning includes data models that conduct predictive analytics that show likelihood of specific outcomes for
students while there is time to make changes in school programs that improve outcomes. The analytics can
include recommended interventions and can calculate costs.
- Insight for actions
Overcoming the challenges to personalize learning, apply effective approaches, and advance learning with
data requires more than reports on student progress. The data for each student should lead to specific
insights about the student’s learning progress and should result in actions that will advance learning. In order
for data to drive insight and action, powerful analytics are needed. While many school data systems include
analytics, few combine dynamic early indication of student progress with the kind of recommendations that
students, teachers, families, and schools can use to best guide learning.
The advantages of data visualization, analysis, and prediction benefit:
- Students get feedback on their pattern of performance in learning systems, and who may be assessed
more frequently in ways that better guide progress and give them a personalized learning experience
- Parents get detailed reports on student progress
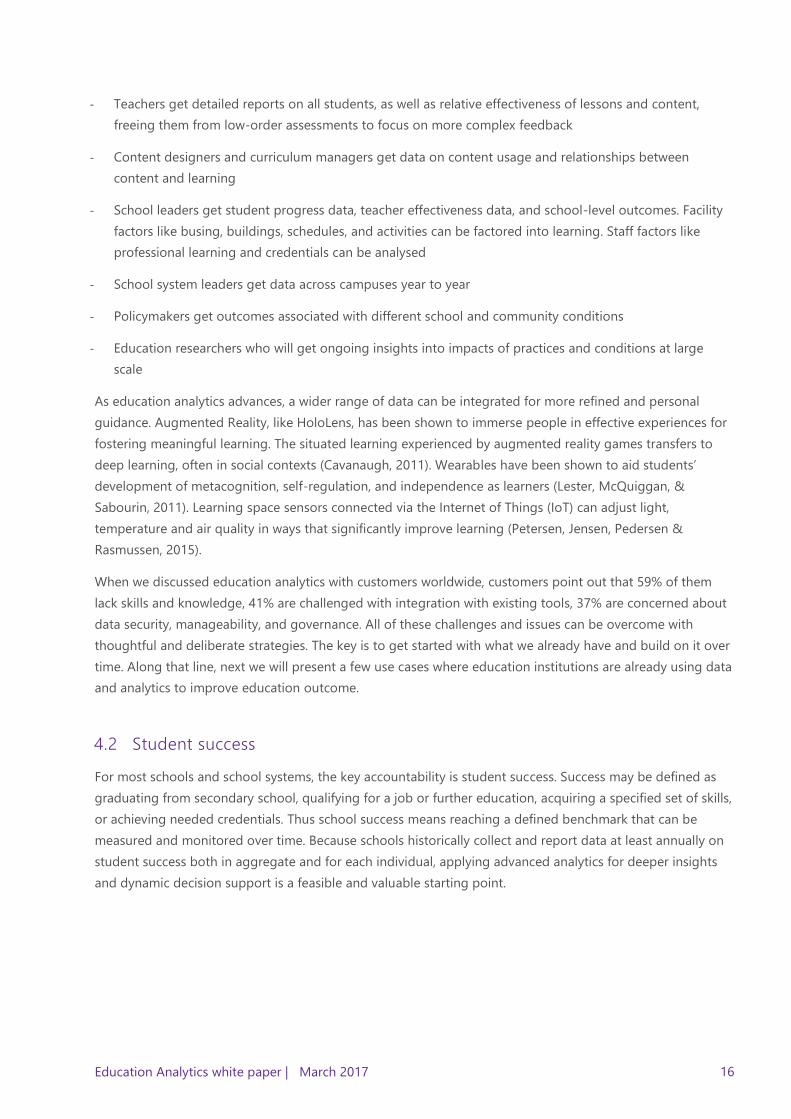
Education Analytics white paper | March 2017 16
- Teachers get detailed reports on all students, as well as relative effectiveness of lessons and content,
freeing them from low-order assessments to focus on more complex feedback
- Content designers and curriculum managers get data on content usage and relationships between
content and learning
- School leaders get student progress data, teacher effectiveness data, and school-level outcomes. Facility
factors like busing, buildings, schedules, and activities can be factored into learning. Staff factors like
professional learning and credentials can be analysed
- School system leaders get data across campuses year to year
- Policymakers get outcomes associated with different school and community conditions
- Education researchers who will get ongoing insights into impacts of practices and conditions at large
scale
As education analytics advances, a wider range of data can be integrated for more refined and personal
guidance. Augmented Reality, like HoloLens, has been shown to immerse people in effective experiences for
fostering meaningful learning. The situated learning experienced by augmented reality games transfers to
deep learning, often in social contexts (Cavanaugh, 2011). Wearables have been shown to aid students’
development of metacognition, self-regulation, and independence as learners (Lester, McQuiggan, &
Sabourin, 2011). Learning space sensors connected via the Internet of Things (IoT) can adjust light,
temperature and air quality in ways that significantly improve learning (Petersen, Jensen, Pedersen &
Rasmussen, 2015).
When we discussed education analytics with customers worldwide, customers point out that 59% of them
lack skills and knowledge, 41% are challenged with integration with existing tools, 37% are concerned about
data security, manageability, and governance. All of these challenges and issues can be overcome with
thoughtful and deliberate strategies. The key is to get started with what we already have and build on it over
time. Along that line, next we will present a few use cases where education institutions are already using data
and analytics to improve education outcome.
4.2 Student success
For most schools and school systems, the key accountability is student success. Success may be defined as
graduating from secondary school, qualifying for a job or further education, acquiring a specified set of skills,
or achieving needed credentials. Thus school success means reaching a defined benchmark that can be
measured and monitored over time. Because schools historically collect and report data at least annually on
student success both in aggregate and for each individual, applying advanced analytics for deeper insights
and dynamic decision support is a feasible and valuable starting point.

Education Analytics white paper | March 2017 17
Case: Tacoma public schools
In the U.S., 1.2 million students drop out of high school annually. Student dropout rates can contribute to
societal issues, for example those without high school diplomas have an average $200,000 of unrealized
income, and 75% of crimes in the U.S. are committed by high school dropouts.
Just a few years ago, Tacoma Public School System in the U.S. had a school graduation rate of 55%. By
adopting a Whole Child approach to education powered by predictive analytics, Tacoma raised its
graduation rate to over 83%. Using advanced analytics and a dynamic business intelligence dashboard,
Tacoma leaders get early warnings for each student who is identified as at risk for not graduating, and school
staff can intervene quickly. Shaun Taylor, Tacoma Public Schools CIO, said, “With Azure Machine Learning, we
proved that we have the right tool to get us where we want to go in terms of predicting student success. It’s
a tool our educators will be able to use to start tackling the problem of student disengagement. “
Benefits of cloud-based advanced analytics for Tacoma include:
- Both static data, such as student characteristics and past performance, and dynamic data such as
formative assessments and usage of learning systems can be accommodated by cloud-based advanced
analytics, making the results far more useful in guiding student learning
- The full range of descriptive, diagnostic, predictive, and prescriptive analytics are possible (see figure
below)
- The data models can be built once and then run as needed, making the reports more easily and
frequently accessible by educators
- Analysis and reporting are done at system, school, and individual student levels, enabling personalization
of learning and broader insights about what works
- Each student’s progress can be viewed in the Power BI displays, as well as on-demand aggregated views
of data accessed using natural language query. This capability enables greater use of data with fewer
specialized skills and less time needed
- At-risk prediction allowed early identification of students needing additional supports
Picture 9 – Tacoma dashboard
Here is more on Tacoma's story

Education Analytics white paper | March 2017 18
Case: Cleveland Metro School District student performance
When the Cleveland Metropolitan School District wanted to change how it delivers education, it looked for a
better way to predict student and school performance. The district worked with Microsoft and Neal Analytics,
an independent software vendor, to build a cloud-based data visualization and predictive-analysis solution
using Microsoft Power BI and Azure Machine Learning. Now the district can monitor and help the children
who need it, identify learning barriers, act quickly, and give every student a better chance. If a child in the
Cleveland Municipal School District (CMSD) in the U.S. fails to meet the third-grade reading standard, she
cannot move on to fourth grade – and she is at very high risk of failing to graduate from high school. Using
powerful predictive analytics tools, the district can identify the early warning signs – from pre-kindergarten
on – that indicate which students may need help to meet the reading standard. Now teachers in kindergarten
and first, second, and third grades can monitor the child who may be falling behind in reading. They can
identify the challenges she faces – health, attendance, behaviour, or missed assignments – and help her,
before she fails the third-grade assessment. CMSD’s Executive Director for Enterprise Apps mentioned, “We
are using Power BI and Azure Machine Learning to transform education in Cleveland. When we can predict
where kids will need help and where they’ll succeed, we can allocate resources where and when we need
them.”
Picture 10 – Cleveland school dashboard
Here is more on Cleveland's story
Case: Denton ISD improves student monitoring and reclaims 146,000 hours
Denton Independent School District in the U.S. needed to make better use of the data it collects on student
performance, mobility, and attendance in order to prevent student failure and make more informed
decisions earlier. Working with Microsoft Partner, Dell, the district implemented the Education Data
Management (EDM) solution, to capture, store, and use actionable data. As a result, predictive analytics is

Education Analytics white paper | March 2017 19
helping district and school leaders to identify individual student needs and risk levels, thus better keeping
students on a path for academic success. More frequent learning assessments are keeping classroom
instruction on track and adding to the richness of data that indicate student progress. Using the data tools
has enabled teachers to reclaim 146,000 hours of their time per school year district-wide, giving them more
time in direct support of student learning. The district projects an increase in student attendance and
graduation rates, improving education.
Picture 11 – Student profile view
More on Denton’s story, see https://dell.com/casestudies
5 Case: Improving graduation in vocational education in Finland
Currently less than 65% of the students in Finnish vocational education complete their studies as planned.
Part of the students will move to work without graduation or change the branch of studies to another
institute, but too many have either delayed in their studies (12.3%) or will completely discontinue (8.5%)
(Statistics of Finnish vocational education 2014, 2015).
The delayed and dropout students pose significant direct costs to Finnish cities and vocational schools due
to reduced funding from government. Furthermore, the indirect costs for Finnish society are even more
severe. Dropouts especially have challenges in finding a job and this problem is causing serious impacts on
society in the long run.
To alleviate this problem, Tampere Vocational College (Tredu) in Finland, Microsoft, and partner Steamlane
initiated a concept project on how to apply analytics to improve graduation in vocational schools. The core
of the idea is the following: utilize advanced analytics and machine learning to identify students who have
elevated risk to dropout or delay in studies, so that interventions and support actions can be initiated early
enough.
Currently (Dec 2016) the project is in small scale pilot phase.

Education Analytics white paper | March 2017 20
5.1 User scenarios
The administrators of the graduation improvement service are:
- Teachers or tutors who have overall responsibility for a class or group of students
- Principals and other school leaders who set targets, monitor the status and initiate interventions and
support
Tutor scenario
Teachers or class tutors are concerned with the progress of their classes and want to ensure student success.
The predictive analytics software helps teachers in their task and the software analyses students’ background
information and also students’ progress. Predictive analytics identifies and then triggers for a student with
elevated risk of delayed studies or even risk of dropping out. The tutor initiates a process for intervention
and support described below. The icon indicates those steps which are automatically initiated based on
the advanced analytics model:
1
The tutor monitors the overall status of her student group with a real-
time dashboard.
2
The tutor gets an alert from the predictive analytics system. One of the
students has been identified as having an increased risk of dropping out.
Based on the alert, the tutor calls a meeting with the student to plan the
possible intervention or support.
3
The system gives recommendations about which intervention and
support could be optimal for the student.
4
The student and tutor have an open discussion about the status and
future plans. Their target is to create and agree on a common plan to
support studies and ensure overall student success. Analytics tools can
help by providing factors that lead to risk indication assessment and
proposals for support activities. Finally, the agreed support plan is
documented.

Education Analytics white paper | March 2017 21
5
During the support period the tutor follows the student and their
activities regularly. Analytics can help by offering more detailed data
and insight to student progress.
6
After the support activities have been completed, the tutor and student
reconvene to check status and progress together. If the process has
been beneficial and status has improved, the tutor can close the support
case and record effectiveness.
7
Back to the beginning. The tutor monitors the overall status of her
student group with the help of predictive analytics and the real time
dashboard. All this info can be used to create better understanding on
overall support benefits and to improve overall school performance.
5.2 Solution elements
The graduation improvement service consists of elements to identify students who need support,
recommendations on how to support them and real time and interactive status dashboards for education
leaders:
Picture 12 – Graduation improvement service elements

Education Analytics white paper | March 2017 22
1 – Advanced Analytics
The core of the graduation improvement service is an Advanced Analytics module that predicts which
students have elevated risk of delayed studies or even dropping out. Technically, the predictive analytics
module is implemented with the Azure Machine Learning service. Predictive analytics software runs in the
background and users never see or use it directly. However, users see and use it indirectly as they use its
predictions on students potentially having issues in on time graduation.
2 – Recommendations for interventions
Predictions alone are never enough; they must lead to some interventions and support actions. Therefore,
the guided planning tool for interventions and support is an integral part of the graduation improvement
service.
The guided planning tool is based on prescriptive analytics. It lists students who need support and makes
recommendations on which interventions or support actions could be addressed to the student to best
improve his or her situation.
3 – Real time dashboard for education management
The third service component is a real time, interactive dashboard for education management. It gives
information on school sector, profession, and class level on how many students are identified to possibly
need support, whether they have support actions in place and the success rate of the interventions.
The dashboard also shows predictions on what will be the status at the end of semester, and it provides tools
to compare the status between years, between sectors or between classes of a school.
5.3 Technology stack
The graduation improvement service is implemented in Microsoft Azure consists of the following
technologies. Each numbered element is explained more thoroughly below.
Picture 13 – Technology stack of the graduation improvement service

Education Analytics white paper | March 2017 23
1. School operational systems e.g. student information systems having students’ personal data, study
plans, achievement, and absences.
2. School data warehouse which consolidates data from different sources. This is not mandatory for
analytics projects but makes the integration part of the analytics project more efficient. Typically school
data warehouses are implemented using Microsoft SQL Server.
3. Office 365 Directory to manage single sign-on, authentication and authorizations.
4. Azure Data Factory for extract-transform-load (ETL) operations; to extract data from school data
warehouse, transform them into the required format, and load the data into Azure SQL database.
5. Azure Machine Learning service which identifies students who need intervention and support.
6. Azure SQL database to store student data and Azure Machine learning results data.
7. Power BI embedded for dashboard graphs and visuals in apps (9).
8. Azure Web App for (9) and (10).
9. Real time dashboard for education management is implemented by integrated Azure Web App and
Power BI. The dashboard graphs are implemented with Power BI, and more complex functionality with
Azure Web App Service.
10. Recommendations for interventions service is implemented with Azure Web App.
6 Getting there
Effective change can be achieved only when there is strong leadership in setting goals and providing a vision
and strategy through the change journey. The IT solution is an essential element, but alone it's not enough
to achieve the goals. Before we diverge into some of the process to make data analytics useful in education,
it’s important to note that we must consider strategic factors for data governance, data management, data
security, and privacy issues. There’s no alternative to complying with regulatory, protection and compliance
laws. It’s also important that, when leveraging education data for analytics, there is no other option but to
“do the right thing” and be transparent, even if it means over communicating about use of the data (where,
how, who, when), and providing specific value add to end stakeholders. Many of these can be addressed by
having some clear guidelines, standard practices, and empathy for all Education stakeholders both internal
and external to the institution – Educators, Students, Parents, Community, and of course Public Sector
entities.
In his book, global authority and best-selling author on Big Data Analytics Mr. Bernard Marr mentions that,
“Businesses use less than 5% of the information available to them to inform decisions.” He devised the
SMART Data framework which helps provide guidance on thinking about smart data instead of big data. His
SMART model outlines the following – start with strategy, measure metrics and data, apply analytics, report
results, and transform your business. Mr. Marr’s recommendation is to start with business objectives to raise
the right questions that will in turn provide requirements for data to be analyzed.
Education Analytics white paper | March 2017 24
A successful project typically has the following steps:
1 – Prerequisite: ensure the school has objectives
The very first step of analytics projects is to ensure that the school has high level objectives, which are up-to-
date, approved, and communicated. If not, an analytics project should not be initiated before objectives are
defined because the analytics project may solve the wrong problem. For example, a school could have
objectives like:
- What: Improve graduation rate
- How: Initiate early interventions and support actions for students whose studies are possibly delayed
2 – Define questions
An analytics project starts by defining questions the analytics tool is expected to answer. The questions fall
into two categories: questions about current state and questions about the future. Questions about current
state could be:
- How effective are interventions and support actions?
- Do we have fewer dropouts now than last year?
Future looking questions may be:
- Which students are likely to dropout within the next four months?
- What is the estimated dropout rate at the end of semester?
Predictions and predictive analytics are needed for the future looking questions, and therefore they are often
harder to implement than questions about current state. Therefore, a practical first step in applying analytics
is often to focus on current state at first. Just making the current status visible helps organizations to improve
their performance and achieve their goals.
3 – Designing data requirements
To answer the defined questions, data is needed. A lot of relevant data already exists in IT systems, but
depending on the questions defined in step two, new data sources may be needed.
Designing the data requirements is also a feasibility check for the defined questions. In the worst case, the
data requirements for a previously defined question may simply be too expensive to implement.
Monitor and
Improve
Implement and
Deploy
Create for Action
Create Analytics
Model
Design Data
Require-ments
Define Questions
Decide Objectives
Education Analytics white paper | March 2017 25
4 – Analytics model creation
This step is optional depending on what kind of analytics tool is created. In the case of a current state
dashboard, this step could be skipped whereas if the tool is supposed to make predictions or
recommendations, this is an essential task done by data analysts or data scientists.
The output of their effort is a mathematical model on how the predictions and recommendations are derived
out of the raw data.
5 – Design for actions
The insight given by analytics tools must lead to actions, otherwise there is no change and no progress
within the organization.
The actions, their planning, and follow-up could be done manually, but in big organizations it may be
beneficial to implement IT tools to support actions and possibly automate and track some of the tasks.
Sometimes the tools for planning and executing the actions already exist, but quite often new tools are
needed or the existing tools must be adapted for the new way of work.
6 - Implementation and deployment
The near final step of an analytics project does not differ from a normal project of implementing IT systems.
Agile development is usually an efficient development model for analytics related projects as extensive and
iterative end user involvement is needed for the successful end result.
7 - Monitor and improve
One final step, often overlooked, is the ongoing monitoring and improvement that may be needed to refine
and adjust the actions based on the results from implementation of a data analytics solution. This provides
the feedback loop and validation needed for the analytics to be the decision support tool and to be the
learning system itself. This step could result in a revisit of some of the previous steps where new data sources
may be needed or additional questions might be asked of the data analytics system, or even to make
refinements in the analytics model to derive refined insights for revised actions.
Microsoft and its partner Steamlane are available to support you and take your analytics journey all the way.
- Visit Microsoft’s Education site on Student Lifecycle and Success Management here:
https://www.microsoft.com/en-us/education/school-leaders/learning-systems/default.aspx
- Learn more about Cortana Intelligence Suite by visiting:
https://www.microsoft.com/en-us/server-cloud/cortana-intelligence-suite/
- Find a partner who can assist on your analytics journey:
http://cortanaintelligencepartners.azurewebsites.net/
- Visit Industry specific examples on Power BI use cases for Education and Public Sector by visiting:
https://powerbi.microsoft.com/en-us/industries/public-sector/

Education Analytics white paper | March 2017 26
7 References
Cavanaugh, C. (2011). Augmented reality gaming in education: authentic and engaged blended learning, pp.
45-56. In Gaming and Simulations: Concepts, Methodologies, Tools and Applications. Hershey, PA: Idea Group.
Cavanaugh, C. & Liu, F. (2013). Virtual middle school courses to support anytime, anyplace learning, pp. 161-
174. In Mouza & Lavigne, (Eds.), Emerging Technologies for the Classroom. For series, Explorations in the
Learning Sciences, Instructional Systems and Performance Technologies. New York: Springer.
Cuban, L. (2015). Guiding Principles on Teaching, Learning and Reform. Accessed 17 September, 2015 from
https://larrycuban.wordpress.com/
Gates Foundation. (2015). Teachers know best: Making data work for teachers and students. Seattle: Author.
Hattie, J., & Yates, G. C. R. (2014). Visible learning and the science of how we learn. New York: Routledge.
Lester, J., McQuiggan, J. & Sabourin, J. (2011). Affect recognition and expression in narrative-centered
learning environments. In New Perspectives on Affect and Learning Technologies: Explorations in the Learning
Sciences, Instructional Systems and Performance Technologies Volume 3, 2011, pp 85-96.
Microsoft (2016). Data Insights and Analytics in Education presentation by Shakil Ahmed, Worldwide
Education Sales
Petersen, S., Jensen, K., Pedersen, A., & Rasmussen, H. (2015). The effect of increased classroom ventilation
rate indicated by reduced CO2 concentration on the performance of schoolwork by children. Indoor Air.
Wiley.
Shum, S.B. (2012). Learning Analytics. UNESCO IITE Policy Brief, November 2012.
UNESCO & UNICEF. (2007). A human rights-based approach to education for all: A framework for the
realization of children's right to education and rights within education. New York, NY: UNICEF.
Insight and Action to Improve Learning from Data (Cavanaugh, 2015),
http://blogs.technet.com/b/microsoft_in_education/archive/2015/03/05/insight-and-action-to-improve-learning-
from-data.aspx
A Call to Action for Research in Digital Learning: Learning without Limits of Time, Place, Path, Pace…or
Evidence (Cavanaugh, Sessums & Drexler, 2015), http://www.editlib.org/p/149851/
Statistics of Finnish vocational education:
http://www.lapaisy.fi/wp-content/uploads/2015/04/Ammatillisen-koulutuksen-lapaisyn-
ohjelma_seuranta_2014.pdf
http://www.lapaisy.fi/wp-content/uploads/2015/11/Lapaisyutkimus_nettiin.pdf
Roger Magoulas on Big Data:
http://radar.oreilly.com/2010/01/roger-magoulas-on-big-data.html
Big Data In Practice, Bernard Marr, John Wiley & Sons.

Education Analytics white paper | March 2017 27
8 Acknowledgements
Microsoft in Education gratefully acknowledges Microsoft Consulting Services, Dell Education, Tampere
Vocational College (Tredu) in Finland, and Steamlane.
www.microsoft.com/education/