eds - transition technologies s.a. · the eds terminal is a client application for the eds server....
TRANSCRIPT
Enterprise Data Server
EDS
• Comprehensive platform for live data, archival data, data integration, remote visualization of process graphics, trends, and alarms
• Integrated view of multiple systems and sites at au-thorized desktop comput-ers
• Calculation server and reporting system with ex-ecution scheduler
• Data gathering from mul-tiple data sources to a centralized data server for live and local archival and forwarding to the EDS thin and thick clients
• High availability options including clustering, and server virtualization
• Scalable up to 1.200,000 process points in clustered arrays
• Excel plug-in
Features
Enterprise Data Server
Accurate, up-to-date process information for executives, managers, supervisors and engineering ana-lysts is essential for optimal system operation. The ability to monitor your processes from anywhere within your corporate or municipal IT architecture provides additional flexibility for improved operations, and enhanced evaluation and decision support.
EDS ™ is a comprehensive system for collecting and processing data that allows viewing of current and past process information from anywhere within your corporate structure. EDS information is gathered from control systems, as well as other plant data sources and is presented in process and read-only control diagrams, alarm lists, trends, and reports.
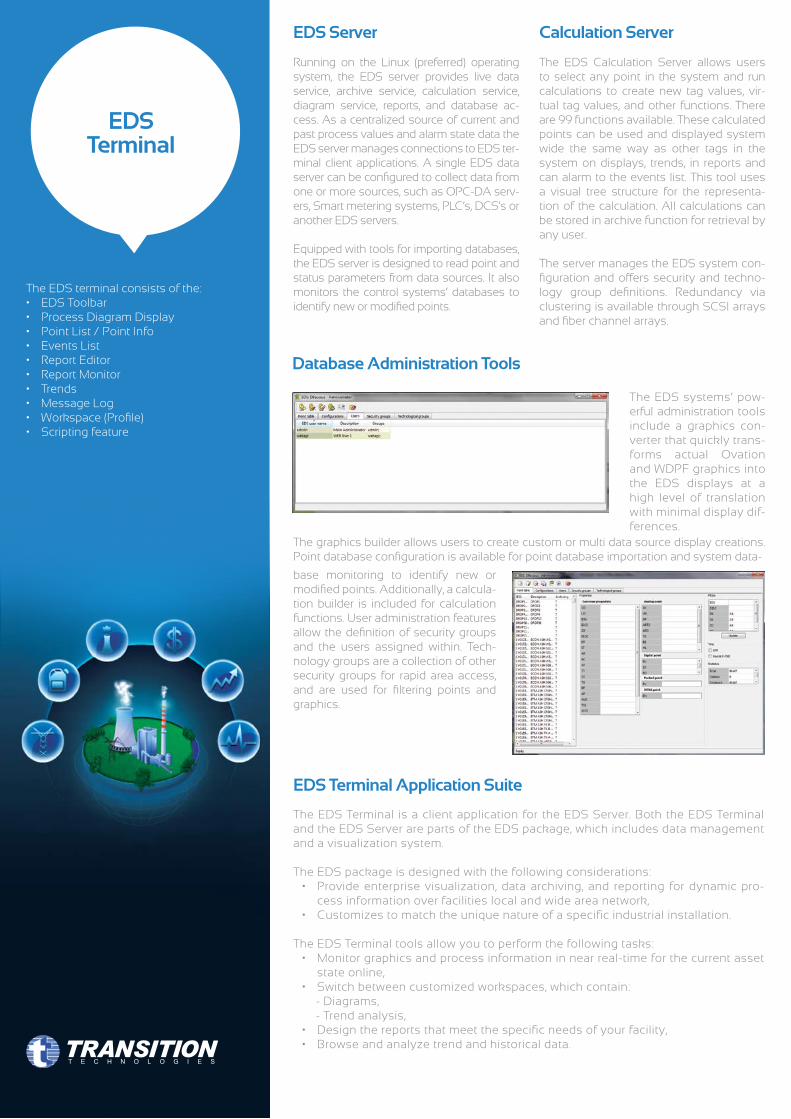
EDS manages the distribution of replicated pro-cess values, alarms, and displays to users running the EDS Terminal client application suite at their desktop computer. The EDS also acts as a data integration platform that provides process infor-mation to plant optimization and performance software applications as well as fleet manage-ment solutions.
The EDS includes software applications which are loaded onto data systems or control sys-tems in order to monitor process value statuses and determine when to transfer this information to the EDS data server. Only value changes are sent to the server, thus minimizing network traf-fic.
The EDS data structure obtains information from those data sources with support for analog, digital, packed, and time point types. Interfaces available are API’s, DCS data feeders, OPC, Mod-bus, and various SCADA protocols.
The key features of the EDS that sets it apart are the one way data communications and data shadowing features. The data shadowing allows for a secondary val-ue to be added where archived data sets are lost or network transmissions are interrupted.
The EDS architecture supports interfacing with data sources, control systems, and PLCs .The client application provides the ability to select between the individual servers in order to focus on process activity from each unique system. In addition, site EDS servers or data feeders can propagate their data to a higher level enterprise EDS server, thus providing multi-site integration support.
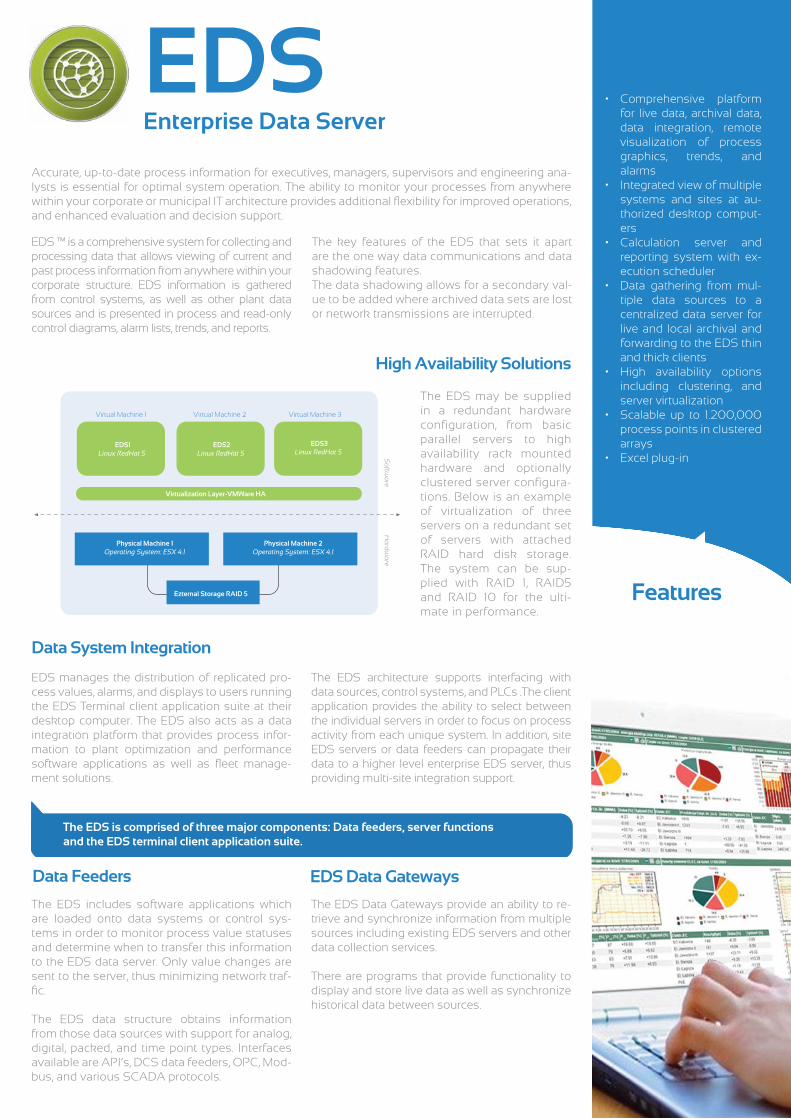
The EDS may be supplied in a redundant hardware configuration, from basic parallel servers to high availability rack mounted hardware and optionally clustered server configura-tions. Below is an example of virtualization of three servers on a redundant set of servers with attached RAID hard disk storage. The system can be sup-plied with RAID 1, RAID5 and RAID 10 for the ulti-mate in performance.
EDS
High Availability Solutions
Data System Integration
Data Feeders EDS Data Gateways
Virtual Machine 1 Virtual Machine 2 Virtual Machine 3
EDS1Linux RedHat 5
EDS2Linux RedHat 5
EDS3Linux RedHat 5
Virtualization Layer-VMWare HA
Physical Machine 1Operating System: ESX 4.1
Physical Machine 2Operating System: ESX 4.1
Ezternal Storage RAID 5
So
ftwa
reH
ard
wa
re
The EDS is comprised of three major components: Data feeders, server functionsand the EDS terminal client application suite.
The EDS Data Gateways provide an ability to re-trieve and synchronize information from multiple sources including existing EDS servers and other data collection services.
There are programs that provide functionality to display and store live data as well as synchronize historical data between sources.
Running on the Linux (preferred) operating system, the EDS server provides live data service, archive service, calculation service, diagram service, reports, and database ac-cess. As a centralized source of current and past process values and alarm state data the EDS server manages connections to EDS ter-minal client applications. A single EDS data server can be configured to collect data from one or more sources, such as OPC-DA serv-ers, Smart metering systems, PLC’s, DCS’s or another EDS servers.
Equipped with tools for importing databases, the EDS server is designed to read point and status parameters from data sources. It also monitors the control systems’ databases to identify new or modified points.
The EDS Calculation Server allows users to select any point in the system and run calculations to create new tag values, vir-tual tag values, and other functions. There are 99 functions available. These calculated points can be used and displayed system wide the same way as other tags in the system on displays, trends, in reports and can alarm to the events list. This tool uses a visual tree structure for the representa-tion of the calculation. All calculations can be stored in archive function for retrieval by any user.
The server manages the EDS system con-figuration and offers security and techno-logy group definitions. Redundancy via clustering is available through SCSI arrays and fiber channel arrays.
EDS Server Calculation Server
Database Administration Tools
EDS Terminal Application Suite
The EDS systems’ pow-erful administration tools include a graphics con-verter that quickly trans-forms actual Ovation and WDPF graphics into the EDS displays at a high level of translation with minimal display dif-ferences.
base monitoring to identify new or modified points. Additionally, a calcula-tion builder is included for calculation functions. User administration features allow the definition of security groups and the users assigned within. Tech-nology groups are a collection of other security groups for rapid area access, and are used for filtering points and graphics.
The graphics builder allows users to create custom or multi data source display creations. Point database configuration is available for point database importation and system data-
The EDS Terminal is a client application for the EDS Server. Both the EDS Terminal and the EDS Server are parts of the EDS package, which includes data management and a visualization system.
The EDS package is designed with the following considerations:• Provide enterprise visualization, data archiving, and reporting for dynamic pro-
cess information over facilities local and wide area network,• Customizes to match the unique nature of a specific industrial installation.
The EDS Terminal tools allow you to perform the following tasks:• Monitor graphics and process information in near real-time for the current asset
state online,• Switch between customized workspaces, which contain:
- Diagrams,- Trend analysis,
• Design the reports that meet the specific needs of your facility,• Browse and analyze trend and historical data.
The EDS terminal consists of the:• EDS Toolbar• Process Diagram Display• Point List / Point Info• Events List• Report Editor• Report Monitor• Trends• Message Log• Workspace (Profile)• Scripting feature
EDSTerminal
Technology RoadmapThe enterprise EDS is a dynamic product that is often updated to reflect new func-tionality, new technology features for the hardware platforms, and new cyber security provisions.
The current EDS 9.1 available in 2013 includes these features:
• mobile solution (iEDS for iPhone and iPad)• whole production set at your fingertip over a se-
cure VPN connection• easy navigation through a multi-level enterprise
hierarchy spread across different geographic locations
• from executive level KPI and key process meas-urements
• to detailed technical data point• information, live and historical plots, live alarms, his-
torical events, live DSC graphics• buffering at data interface level• integration with Ovation Historian• MS Excel multi-server connectivity• ready corporate solutions - ETL for data ware-
housing and reporting applications (i.e. ORACLE, Business Intelligence, Balanced Score Cards)
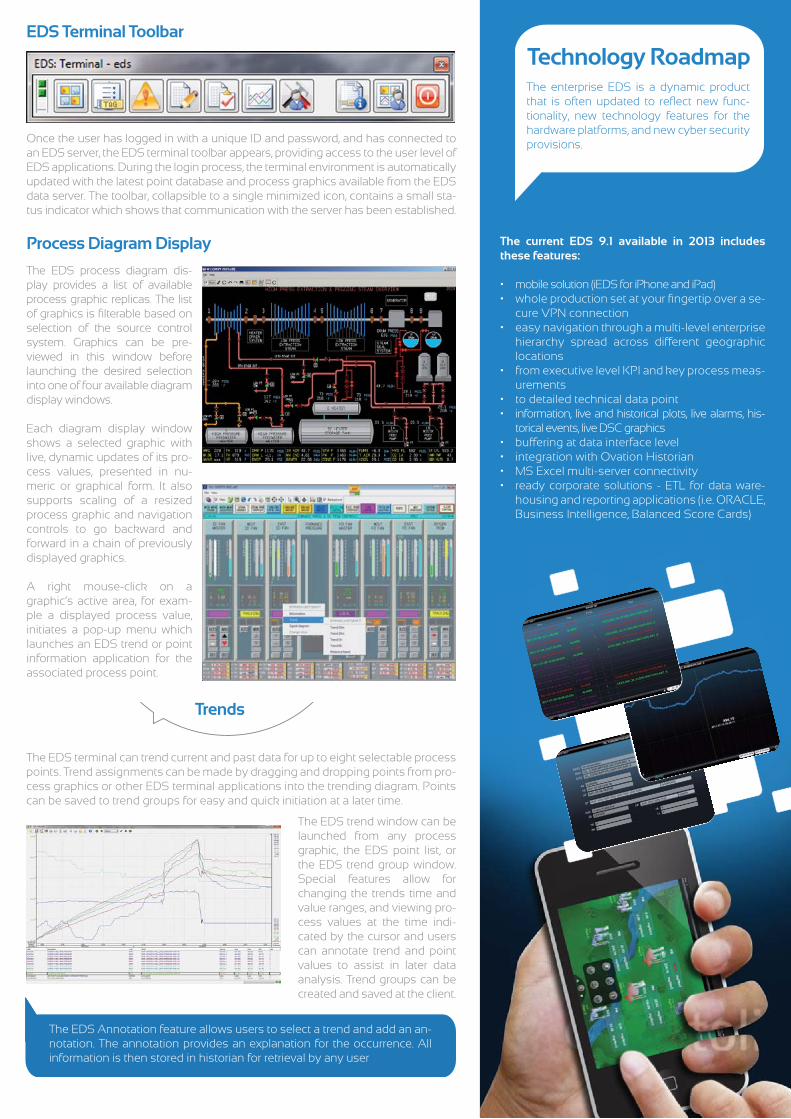
Once the user has logged in with a unique ID and password, and has connected to an EDS server, the EDS terminal toolbar appears, providing access to the user level of EDS applications. During the login process, the terminal environment is automatically updated with the latest point database and process graphics available from the EDS data server. The toolbar, collapsible to a single minimized icon, contains a small sta-tus indicator which shows that communication with the server has been established.
The EDS terminal can trend current and past data for up to eight selectable process points. Trend assignments can be made by dragging and dropping points from pro-cess graphics or other EDS terminal applications into the trending diagram. Points can be saved to trend groups for easy and quick initiation at a later time.
EDS Terminal Toolbar
Process Diagram Display
Trends
The EDS process diagram dis-play provides a list of available process graphic replicas. The list of graphics is filterable based on selection of the source control system. Graphics can be pre-viewed in this window before launching the desired selection into one of four available diagram display windows.
Each diagram display window shows a selected graphic with live, dynamic updates of its pro-cess values, presented in nu-meric or graphical form. It also supports scaling of a resized process graphic and navigation controls to go backward and forward in a chain of previously displayed graphics.
A right mouse-click on a graphic’s active area, for exam-ple a displayed process value, initiates a pop-up menu which launches an EDS trend or point information application for the associated process point.
The EDS trend window can be launched from any process graphic, the EDS point list, or the EDS trend group window. Special features allow for changing the trends time and value ranges, and viewing pro-cess values at the time indi-cated by the cursor and users can annotate trend and point values to assist in later data analysis. Trend groups can be created and saved at the client.
The EDS Annotation feature allows users to select a trend and add an an-notation. The annotation provides an explanation for the occurrence. All information is then stored in historian for retrieval by any user
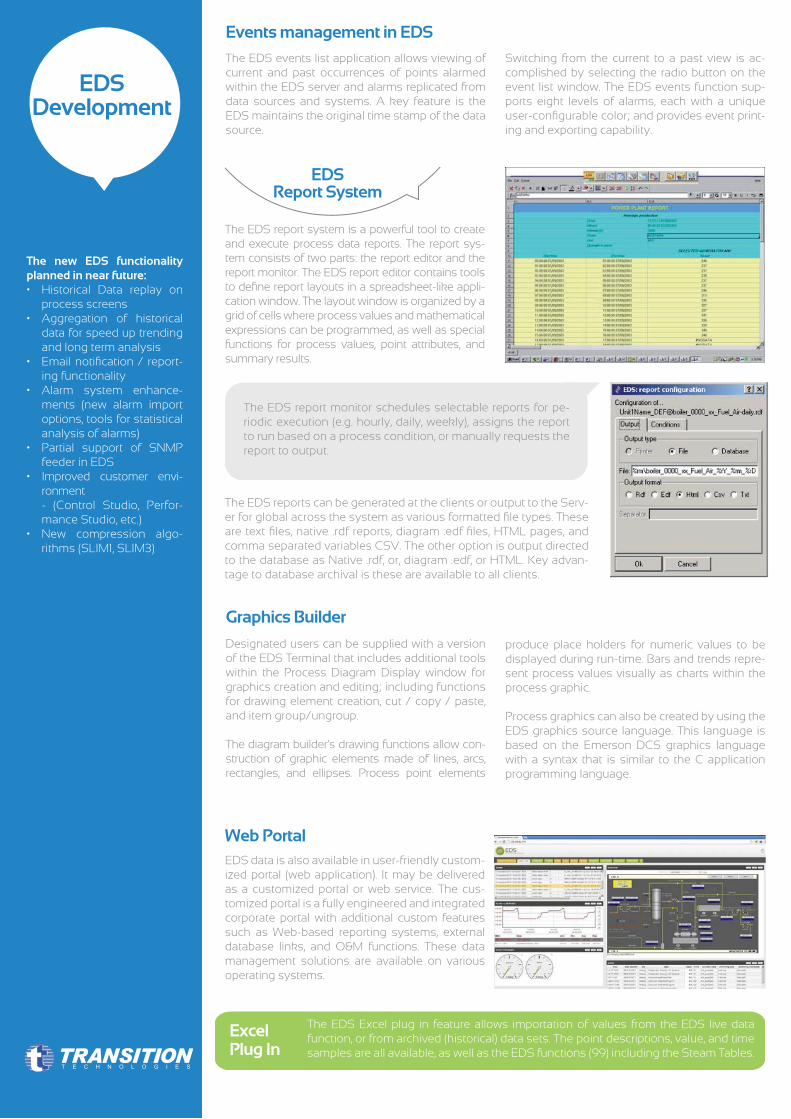
The EDS report system is a powerful tool to create and execute process data reports. The report sys-tem consists of two parts: the report editor and the report monitor. The EDS report editor contains tools to define report layouts in a spreadsheet-like appli-cation window. The layout window is organized by a grid of cells where process values and mathematical expressions can be programmed, as well as special functions for process values, point attributes, and summary results.
The new EDS functionality planned in near future:• Historical Data replay on
process screens• Aggregation of historical
data for speed up trending and long term analysis
• Email notification / report-ing functionality
• Alarm system enhance-ments (new alarm import options, tools for statistical analysis of alarms)
• Partial support of SNMP feeder in EDS
• Improved customer envi-ronment- (Control Studio, Perfor-mance Studio, etc.)
• New compression algo-rithms (SLIM1, SLIM3)
EDS Report System
EDSDevelopment
The EDS report monitor schedules selectable reports for pe-riodic execution (e.g. hourly, daily, weekly), assigns the report to run based on a process condition, or manually requests the report to output.
The EDS reports can be generated at the clients or output to the Serv-er for global across the system as various formatted file types. These are text files, native .rdf reports, diagram .edf files, HTML pages, and comma separated variables CSV. The other option is output directed to the database as Native .rdf, or, diagram .edf, or HTML. Key advan-tage to database archival is these are available to all clients.
The EDS events list application allows viewing of current and past occurrences of points alarmed within the EDS server and alarms replicated from data sources and systems. A key feature is the EDS maintains the original time stamp of the data source.
Designated users can be supplied with a version of the EDS Terminal that includes additional tools within the Process Diagram Display window for graphics creation and editing; including functions for drawing element creation, cut / copy / paste, and item group/ungroup.
The diagram builder’s drawing functions allow con-struction of graphic elements made of lines, arcs, rectangles, and ellipses. Process point elements
EDS data is also available in user-friendly custom-ized portal (web application). It may be delivered as a customized portal or web service. The cus-tomized portal is a fully engineered and integrated corporate portal with additional custom features such as Web-based reporting systems, external database links, and O&M functions. These data management solutions are available on various operating systems.
Switching from the current to a past view is ac-complished by selecting the radio button on the event list window. The EDS events function sup-ports eight levels of alarms, each with a unique user-configurable color; and provides event print-ing and exporting capability.
produce place holders for numeric values to be displayed during run-time. Bars and trends repre-sent process values visually as charts within the process graphic.
Process graphics can also be created by using the EDS graphics source language. This language is based on the Emerson DCS graphics language with a syntax that is similar to the C application programming language.
Events management in EDS
Graphics Builder
Web Portal
Excel Plug In
The EDS Excel plug in feature allows importation of values from the EDS live data function, or from archived (historical) data sets. The point descriptions, value, and time samples are all available, as well as the EDS functions (99) including the Steam Tables.
Enterprise Data Server
EDS
Transition Technologies
For over 20 years we have been providing our customers with the highest quality IT solutions based on the latest technologies. Our services and products cover the following fields:
• Development and distribution of software for utility sectors• Optimization of technological processes• Electrical energy and gas trading• Risk management• Programming• Engineering services• Solutions to mobile technologies • Research and development projects• Software service outsourcing• Software consulting
Our established technological leadership is a consequence of our extensive experience in advanced project implementation and ap-plication of the most innovative solutions, which together have re-sulted in a number of competitive realizations adjusted to the cus-tomers’ needs.We believe that our employees are the key to our success. Our team consists of exceptionally educated young people – graduates of major polish technical universities. Their knowledge and profes-sional consultancy in application of delivered solutions determine the quality and innovation of our products. With offices located in five Polish cities: Warsaw, Lodz, Bialystok, Wroclaw and Ostrow Wielkopolski as well as in Germany and in the United States, our company maintains rapid and dynamic growth.
Transition Technologies S.A.
Pawia 55, 01-030 WarszawaTel.: +48 22 331 80 20Fax: +48 22 331 80 30
www.tt.com.pl/en
Mr Paweł Różacki
Product ManagerMob.: +48 728 825 195Fax.: +48 (0) 22 331 80 [email protected]
Mr Waldemar Bradtke
International Business - European ChallengeAm Forsthaus 9 - 91315 HöchstadtGermanyphone: + 49 9193 689361mobile: + 49 170 385 [email protected]
Contact