edmonton zone health status update 2011 · z4.4a edmonton zone - duggan z4 ... population/geography...
TRANSCRIPT
EDMONTON ZONE Health Status Update
2011

Health Status Update 2011
This is an update to the technical report How Healthy Are We? 2010 Report of the Senior Medical Officer of Health
(http://www.albertahealthservices.ca/5863.asp). Population, Risk Factor and Health Related Indicators have been updated since the 2010 report.
Socioeconomic and Cancer related statistics have not been updated.
The main purpose of this update is to provide current data to describe the health of Alberta residents living in small geographical areas, Zones and
the province of Alberta.
Technical information about the data contained in the Update, including sources and definitions, can be found in the Appendix. Crude rates,
standard errors and confidence intervals are available upon request.
If you have questions about the information in this update, please contact: Health Status Assessment, Population & Public Health, Alberta Health Services Phone 780-342-0284 Suite 104, Main Floor, West Tower 14310 – 111 Avenue Edmonton, AB T5M 3Z7
AHS provides this Health Status Update on an "as-is, where-is" basis, and hereby expressly disclaims any other representation or warranty, express or implied, oral or written, statutory or otherwise, including without limitation, warranties of fitness for a particular purpose, implied warranties, and warranties of non-infringement or merchantability. AHS has made reasonable efforts to ensure the accuracy of the information included in the Update. AHS expressly disclaims all liability for the use of the Update and for any claims, actions, demands or suits arising from such use. © 2012 Alberta Health Services
This material is protected by Canadian copyright law.
Suggested Citation: Predy GN, Lightfoot P, Edwards J, Sevcik M, Fraser-Lee N, Zhang J, Dominey J, Pennicott D, Walker S. Health Status Assessment Update 2011 - Senior
Medical Officer of Health, Population and Public Health, Alberta Health Services, Edmonton, AB (February 2012).

S
.ert
Leduc &Devon
StC
Z4.2DEEdmonton Zone -Abbottsfield/NEZ4.2A
Edmonton Zone -Castle Downs
Z4.2BEdmonton Zone -
NorthgateZ4.2C
Edmonton Zone -
Eastwood
Z4.1AEdmonton
Zone -Woodcroft
East
Z4.1BEdmonton
Zone -Woodcroft West
Z4.1CEdmonton Zone -
Jasper Place
Z4.1DEdmonton
Zone -West Jasper
Place
Z4.4CEdmonton Zone -
Rutherford
Z4.4BEdmonton
Zone -Twin Brooks
Z4.4AEdmonton
Zone -Duggan
Z4.3BEdmonton
Zone -Millwoods
West
Z4.3AEdmonton Zone -
Bonnie Doon
Z4.3CEdmonton
Zone -Millwoods
SE
0 10 205Kilometers
Z4.8BEdmonton Zone -
Westview excluding Stony Plain &Spruce Grove
Z4.6ABEdmonton Zone - Sherwood Park/
Strathcona County
Z4.5BEdmonton Zone - Sturgeon County
East & FortSaskatchewan
Z4.5AEdmonton Zone -
Sturgeon County West
Z4.9AEdmonton Zone -
St. Albert
Z4.8A
Z4.7
Edmonton Zone - Stony Plain & Spruce Grove
Edmonton Zone - Leduc County
0 30 6015Kilometers
Edmonton Zone (Z4)Health Status Areas
Edmonton Zone Health Status Report 2011 - February 2012 Page 3 of 26

Year Male Female Total2000 462,303 470,348 932,6512010 577,091 579,837 1,156,9282020 697,847 690,689 1,388,536
Indicators Z4.1A Z4.1B Z4.1C Z4.1D Z4.2A Z4.2B Z4.2CBoth Males and Females 57,555 29,250 44,677 77,696 56,733 77,295 68,813Males 29,286 14,621 21,776 38,094 27,662 38,323 37,045Females 28,269 14,629 22,901 39,602 29,071 38,972 31,768Percent of population less than 1 year of age 1.2% 1.1% 1.3% 1.2% 1.5% 1.3% 1.2%Percent of population 1 to 4 years of age 3.7% 4.6% 4.6% 5.3% 6.2% 5.1% 4.2%Percent of population 5 to 14 years of age 6.7% 9.7% 9.6% 11.6% 13.1% 12.2% 7.9%Percent of population 15 to 19 years of age 3.7% 5.7% 5.5% 7.0% 6.6% 7.0% 4.9%Percent of population 20 to 44 years of age 45.5% 35.3% 39.5% 36.2% 37.9% 34.8% 42.4%Percent of population 45 to 64 years of age 26.1% 28.9% 25.1% 28.0% 25.0% 25.3% 28.0%Percent of population 65 to 74 years of age 6.0% 6.7% 6.6% 5.7% 5.6% 7.3% 5.6%Percent of population 75 years of age or older 7.2% 8.0% 7.9% 4.9% 4.1% 7.0% 5.9%Largest 5 year age group, Both males and females 25-29 yrs 50-54 yrs 25-29 yrs 50-54 yrs 25-29 yrs 45-49 yrs 25-29 yrsLargest 5 year age group, Males 25-29 yrs 50-54 yrs 25-29 yrs 50-54 yrs 25-29 yrs 45-49 yrs 25-29 yrsLargest 5 year age group, Females 25-29 yrs 50-54 yrs 25-29 yrs 50-54 yrs 25-29 yrs 45-49 yrs 25-29 yrsAverage age (years) 39.7 yrs 40.0 yrs 38.9 yrs 36.9 yrs 35.2 yrs 37.9 yrs 38.8 yrs
Area (km2) 21 60 14 88 33 30 22Number of people per km2 2,740.7 487.5 3,191.2 882.9 1,719.2 2,576.5 3,127.9
Number of dwellings per km2 (2006) 1,490.4 202.2 1,315.2 282.8 538.6 871.6 1,448.2
Population Summary for Edmonton Zone Residents Edmonton Zone's Changing Population
Population of Edmonton Zone, 2011
38,012 33,839
34,986 38,353
42,964 47,395
44,167 41,815 41,361
45,864 44,391
36,642 28,521
19,547 14,664
11,305 7,695
5,570
80,000 60,000 40,000 20,000 0
0-45-910-1415-1920-2425-2930-3435-3940-4445-4950-5455-5960-6465-6970-7475-7980-8485+
Males 2010Males 2000Males 2020
36,275 32,152 32,842
37,042 42,921
47,737 43,620
40,560 40,506
45,576 43,537
35,829 28,638
20,183 16,155
13,675 10,949
11,640
0 20,000 40,000 60,000 80,000
Females 2010Females 2000Females 2020
Age Group
Population/Geography Indicators for Edmonton Zone Residents, 2011 (Z4.1A - Z4.2C)
7,955
31,594
69,627
38,358
225,169
160,236
35,569
25,301
7,540
30,206
65,827
36,976
221,820
157,590
37,902
37,048
0% 10% 20% 30% 40% 50%
Percentage
Male Female<1 year
1-4 years
5-14 years
15-19 years
20-44 years
45-64 years
65-74 years
75+ years
EDMONTON POPULATION DASHBOARD REPORT 2011
Edmonton Zone Health Status Report 2011 - February 2012 Page 4 of 26

Indicators Z4.2DE Z4.3A Z4.3B Z4.3C Z4.4A Z4.4B Z4.4CBoth Males and Females 88,250 94,527 54,089 60,186 40,549 65,317 28,908Males 43,696 47,353 26,824 30,262 19,938 31,915 14,300Females 44,554 47,175 27,264 29,923 20,611 33,402 14,608Percent of population less than 1 year of age 1.4% 1.0% 1.3% 1.5% 1.3% 1.3% 2.7%Percent of population 1 to 4 years of age 6.1% 3.6% 5.5% 5.9% 5.3% 5.1% 9.0%Percent of population 5 to 14 years of age 12.6% 7.7% 13.0% 13.5% 11.1% 11.6% 11.6%Percent of population 15 to 19 years of age 6.5% 4.7% 6.7% 7.0% 6.1% 6.4% 4.4%Percent of population 20 to 44 years of age 38.3% 41.5% 38.4% 39.6% 39.7% 34.5% 48.7%Percent of population 45 to 64 years of age 25.4% 26.3% 25.6% 25.7% 23.2% 28.0% 17.9%Percent of population 65 to 74 years of age 5.8% 6.6% 5.4% 4.3% 7.1% 6.8% 3.3%Percent of population 75 years of age or older 3.9% 8.6% 4.0% 2.4% 6.2% 6.1% 2.3%Largest 5 year age group, Both males and females 25-29 yrs 25-29 yrs 25-29 yrs 25-29 yrs 25-29 yrs 50-54 yrs 30-34 yrsLargest 5 year age group, Males 25-29 yrs 25-29 yrs 25-29 yrs 25-29 yrs 25-29 yrs 50-54 yrs 30-34 yrsLargest 5 year age group, Females 25-29 yrs 25-29 yrs 25-29 yrs 25-29 yrs 25-29 yrs 50-54 yrs 30-34 yrsAverage age (years) 35.3 yrs 40.3 yrs 35.5 yrs 33.9 yrs 37.2 yrs 38.2 yrs 31.4 yrs
Area (km2) 154 74 20 33 15 40 95Number of people per km2 573.1 1,277.4 2,704.4 1,823.8 2,703.3 1,632.9 304.3Number of dwellings per km2 (2006) 191.9 617.6 844.5 495.0 1,071.2 507.8 74.2
Indicators Z4.5A Z4.5B Z4.6AB Z4.7A Z4.8A Z4.8B Z4.9ABoth Males and Females 22,245 27,476 92,495 58,341 48,686 29,453 66,178Males 11,009 13,991 46,112 29,464 24,367 15,173 32,597Females 11,236 13,485 46,383 28,877 24,319 14,280 33,581Percent of population less than 1 year of age 1.6% 1.2% 1.1% 1.5% 1.6% 1.2% 1.0%Percent of population 1 to 4 years of age 6.4% 5.6% 5.0% 5.8% 5.7% 5.2% 4.5%Percent of population 5 to 14 years of age 14.9% 12.3% 12.7% 12.8% 12.6% 13.1% 12.5%Percent of population 15 to 19 years of age 8.4% 7.2% 7.4% 6.8% 7.2% 7.6% 7.4%Percent of population 20 to 44 years of age 34.1% 35.4% 33.4% 36.0% 35.2% 30.1% 32.3%Percent of population 45 to 64 years of age 26.1% 27.9% 29.6% 26.7% 27.1% 30.6% 30.7%Percent of population 65 to 74 years of age 5.4% 6.0% 6.9% 6.0% 6.6% 8.0% 6.9%Percent of population 75 years of age or older 3.1% 4.4% 3.9% 4.4% 4.1% 4.2% 4.7%Largest 5 year age group, Both males and females 15-19 yrs 50-54 yrs 45-49 yrs 30-34 yrs 45-49 yrs 50-54 yrs 45-49 yrsLargest 5 year age group, Males 15-19 yrs 50-54 yrs 45-49 yrs 30-34 yrs 50-54 yrs 50-54 yrs 50-54 yrsLargest 5 year age group, Females 45-49 yrs 50-54 yrs 45-49 yrs 30-34 yrs 45-49 yrs 50-54 yrs 45-49 yrsAverage age (years) 34.1 yrs 36.6 yrs 37.3 yrs 36.0 yrs 36.2 yrs 37.7 yrs 38.1 yrs
Area (km2) 1,700 578 1,250 2,750 62 4,700 35Number of people per km2 13.1 47.5 74.0 21.2 785.3 6.3 1,890.8
Number of dwellings per km2 (2006) 5.2 15.2 23.4 6.9 195.2 2.9 598.2
Population/Geography Indicators for Edmonton Residents, 2011 (Z4.2DE - Z4.4C)
Population/Geography Indicators for Edmonton Residents, 2011 (Z4.5A - Z4.9A)
Edmonton Zone Health Status Report 2011 - February 2012 Page 5 of 26

IndicatorsCity of
EdmontonEDMONTON
ZONEALBERTA
Both Males and Females 843,590 1,188,718 3,788,805Males 420,973 593,809 1,899,899Females 422,617 594,909 1,888,906Percent of population less than 1 year of age 1.3% 1.3% 1.4%Percent of population 1 to 4 years of age 5.2% 5.2% 5.5%Percent of population 5 to 14 years of age 10.8% 11.4% 12.1%Percent of population 15 to 19 years of age 5.9% 6.3% 6.5%Percent of population 20 to 44 years of age 39.2% 37.6% 37.3%Percent of population 45 to 64 years of age 25.9% 26.7% 26.4%Percent of population 65 to 74 years of age 6.0% 6.2% 6.0%Percent of population 75 years of age or older 5.7% 5.2% 5.0%Largest 5 year age group, Both males and females 25-29 yrs 25-29 yrs 25-29 yrsLargest 5 year age group, Males 25-29 yrs 25-29 yrs 25-29 yrsLargest 5 year age group, Females 25-29 yrs 25-29 yrs 25-29 yrsAverage age (years) 37.3 yrs 37.1 yrs 36.6 yrs
Area (km2) 697 11,800 660,200
Number of people per km2 1,210.3 100.7 5.7
Number of dwellings per km2 (2006) 451.0 36.2 1.9
Source: Alberta Health Care Insurance Plan Registration File, 2011
Population/Geography Indicators for Edmonton Residents, 2011 (City of Edmonton - Alberta)
Edmonton Zone Health Status Report 2011 - February 2012 Page 6 of 26

Indicator Categories Z4.1A Z4.1B Z4.1C Z4.1D Z4.2A Z4.2B Z4.2C
Number of Births (2008-2010) 1,926 1,066 1,617 2,831 2,511 2,922 2,284
Percent Low Birth Weight (of live births, <2500 gm) 7.6% 7.9% 6.3% 5.8% 7.0% 7.2% 9.2%Percent High Birth Weight (of live births, ≥ 4000 gm) 9.7% 10.7% 10.3% 10.4% 9.9% 10.9% 10.6%Percent Small-for-Gestational-Age (of singleton live births) 11.4% 9.7% 11.7% 9.6% 10.2% 10.6% 11.7%Percent Preterm Births (of live births, <37 wks gestation) 8.6% 8.9% 8.2% 8.1% 9.2% 10.0% 12.3%
Crude Birth Rate (per 1,000) 11.7 12.5 12.7 12.8 15.5 13.1 11.6General Fertility Rate (per 1,000 women 15-49 yr) 43.2 51.1 48.3 48.5 57.1 52.3 45.6Teen Birth Rate (per 1,000 women 15-19 yr) 34.5 24.4 27.3 9.8 15.5 20.6 38.9
Percent Maternal Prenatal Smoking (of deliveries) (2008-2010) 20.2% 20.4% 20.9% 10.5% 13.5% 17.0% 25.9%
Life Expectancy (yrs) 2008-2010 77.9 79.8 79.7 83.5 82.5 79.9 77.6Life Expectancy at Birth for Males (yrs) 2008-2010 75.4 77.2 77.9 81.5 80.6 77.0 74.8
Life Expectancy at Birth for Females (yrs) 2008-2010 80.4 82.2 81.2 85.3 84.3 82.8 81.0
Infant Mortality Rate (per 1,000 live births) (2006-2010) 6.6 7.4 7.6 4.8 4.4 6.4 9.0Number of Deaths (2010) 472 194 365 338 260 564 473Number of Deaths (2008 - 2010) 1,550 656 1,085 972 679 1,758 1,504
Top 7 Causes of Death (2008-2010) Circulatory (31.0%) Circulatory (28.4%) Circulatory (29.5%) Cancer (33.7%) Cancer (28.7%) Circulatory (33.0%) Circulatory (30.3%)
Cancer (27.5%) Cancer (27.9%) Cancer (24.0%) Circulatory (28.3%) Circulatory (27.0%) Cancer (23.9%) Cancer (23.9%)
Respiratory (9.4%) Respiratory (11.9%) Respiratory (10.0%) Respiratory (7.7%) Respiratory (13.9%) Respiratory (9.3%) Injury (12.5%)
Injury (8.5%) Injury (8.7%) Mental & Behavioral (7.6%) Injury (7.3%) Injury (8.2%) Injury (6.9%) Respiratory (11.3%)
Digestive (5.2%) Digestive (5.2%) Nervous System (7.2%) Mental & Behavioral (4.9%) Digestive (4.4%) Nervous System (5.5%) Digestive (4.4%)
Nervous System (4.8%) Mental & Behavioral (4.5%) Injury (7.2%) Nervous System (4.1%) Nervous System (4.0%) Mental & Behavioral (5.5%) Mental & Behavioral (4.2%)
Mental & Behavioral (4.0%) Nervous System (4.0%) Digestive (4.7%) Digestive (3.7%) Mental & Behavioral (3.8%) Digestive (4.5%) Nervous System (3.3%)
All Cause Death Rate 646.6 479.6 582.7 417.8 492.5 568.0 636.6All Cause Death Rate for Males 802.8 629.0 710.5 517.9 671.5 702.7 799.9All Cause Death Rate for Females 526.6 371.2 500.4 340.9 378.8 453.7 482.9
Ischaemic Heart Disease Death Rate 110.2 87.7 94.6 58.9 70.6 97.9 122.9Ischaemic Heart Disease Death Rate for Males 149.7 136.0 124.9 83.3 107.5 125.4 165.3Ischaemic Heart Disease Death Rate for Females 79.8 48.5* 73.2 38.6 47.5 74.2 78.0
All Heart Disease Death Rate 134.7 107.6 121.6 82.0 95.5 129.3 152.5All Heart Disease Death Rate for Males 177.4 154.8 149.4 109.0 140.8 164.7 199.0All Heart Disease Death Rate for Females 102.0 69.4 101.3 58.4 68.1 99.3 102.7
Cancer Death Rate 191.0 139.0 156.6 147.3 142.7 142.3 161.1Cancer Death Rate for Males 241.7 172.0 198.8 171.2 168.6 184.0 204.9Cancer Death Rate for Females 158.1 119.5 131.3 130.4 124.9 110.2 124.5
Respiratory Death Rate 59.0 46.2 55.4 31.7 70.2 49.9 69.7Respiratory Death Rate for Males 75.6 59.4* 71.2 45.9 115.4 66.8 94.7Respiratory Death Rate for Females 51.4 38.4* 46.3 21.9* 46.2 39.3 50.6
All Injury Death Rate 63.3 51.2 51.6 30.8 36.4 49.6 83.2All Injury Death Rate for Males 88.7 71.5* 62.5 37.6 53.0 80.6 104.7All Injury Death Rate for Females 38.2* 35.1* 44.3* 24.8* 21.2* 21.2* 64.2
Unintentional Injury Death Rate 18.9* 17.1* 21.5* 14.5* 15.2* 20.1 25.7Unintentional Injury Death Rate for Males 25.4* 29.1* 31.6* 16.9* 23.2* 34.5 42.9Unintentional Injury Death Rate for Females 12.4* ** 15.5* 12.4* ** 8.0* 10.2*
BIRTHS 2008-2010
Birth Data Special Years
Life Expectancy
Deaths
Deaths (2008-2010) Age Standardized (per 100,00) to 1991 Canadian Population
EDMONTON ZONE HEALTH SUMMARY DASHBOARD REPORT 2011 Summary of Health Indicators for Edmonton Zone (Z4.1A - Z4.2C)
Edmonton Zone Health Status Report 2011 - February 2012 Page 7 of 26

Indicator Categories Z4.1A Z4.1B Z4.1C Z4.1D Z4.2A Z4.2B Z4.2C
Intentional Injury Death Rate 27.2 18.7* 19.2* 11.3* 10.4* 20.0 27.8Intentional Injury Death Rate for Males 44.6 26.6* 22.1* 15.3* 16.3* 33.0* 32.0Intentional Injury Death Rate for Females ** ** 16.2* 7.6* ** 7.3* 23.4*
Suicide Rate 23.5 17.9* 17.5* 9.0* 9.7* 14.4* 20.3Suicide Rate for Males 38.1* 26.6* 20.5* 12.7* 15.0* 23.7* 21.6*Suicide Rate for Females ** ** 14.2* ** ** ** 19.3*
Lung Cancer Death Rate 59.2 41.6 39.6 36.3 29.3 42.3 53.6Lung Cancer Death Rate for Males 82.2 49.3* 44.8* 43.4 36.3* 55.7 69.3Lung Cancer Death Rate for Females 42.3 38.0* 36.2* 30.8 24.9* 31.2 40.4
Colorectal Cancer Death Rate 22.6 15.6* 12.6* 18.1 20.1* 16.7 14.5*Colorectal Cancer Death Rate for Males 27.8* 17.9* 20.6* 20.6* 21.9* 23.9* 18.1*Colorectal Cancer Death Rate for Females 19.2* 13.4* ** 15.4* 18.9* 11.4* 12.0*
Breast Cancer Death Rate for Females 23.6* 20.4* 19.3* 19.9* 19.1* 15.8* 16.1*Prostate Cancer Death Rate for Males 26.4* 21.2* 32.2* 18.3* 19.3* 18.4* 13.8*Stroke Death Rate 31.0 12.4* 27.1 23.1 30.8 32.7 24.2
Stroke Death Rate for Males 31.8* ** 34.6* 23.8* 33.6* 32.3 28.2*Stroke Death Rate for Females 29.8 10.1* 21.1* 21.9* 29.3* 31.9 19.5*
Chronic Obstructive Pulmonary Disease (COPD) Death Rate 31.0 28.8 30.3 11.2* 40.2 22.5 28.6Chronic Obstructive Pulmonary Disease Death Rate for Males 44.9 27.3* 35.0* 19.2* 68.7 31.2* 40.5Chronic Obstructive Pulmonary Disease Death Rate for Females 23.6* 32.3* 28.1* ** 26.1* 15.9* 19.6*
Number of Hospitalizations (2010) 5,687 2,779 4,320 5,962 4,687 7,362 7,439
Number of Hospitalizations (2008-2010) 17,262 8,847 12,669 17,485 13,664 21,562 21,919
Percent of hospitalizations that are birth or pregnancy related (2008-2010) 21.8% 23.3% 24.3% 31.0% 34.3% 25.9% 20.4%
Percent due to top 7 Causes (2008-2010) 62.9% 63.1% 63.8% 64.4% 65.3% 63.8% 63.9%
Top 7 overall reasons for Hospitalization (2008-2010) Obstetric Related (12.9%) Obstetric Related (13.5%) Obstetric Related (13.9%) Obstetric Related (17.5%) Obstetric Related (19.5%) Obstetric Related (15.0%) Obstetric Related (12.5%)
Health Status (9.9%) Birth Event (9.8%) Birth Event (10.4%) Birth Event (13.5%) Birth Event (14.8%) Birth Event (10.9%) Mental & Behavioral (10.2%)
Birth Event (8.9%) Health Status (8.8%) Health Status (9.3%) Health Status (7.9%) Digestive (7.8%) Health Status (8.4%) All Injury (8.6%)
Circulatory (8.4%) Circulatory (8.8%) Digestive (8.1%) Digestive (7.7%) Health Status (6.8%) Circulatory (8.2%) Respiratory (8.6%)
Digestive (7.8%) Digestive (8.2%) Circulatory (8.1%) Circulatory (6.7%) Circulatory (5.8%) Digestive (8.2%) Health Status (8.2%)
Mental & Behavioral (7.6%) All Injury (7.6%) All Injury (7.1%) All Injury (6.4%) Respiratory (5.4%) Respiratory (6.8%) Birth Event (7.9%)
All Injury (7.4%) Mental & Behavioral (6.3%) Respiratory (6.9%) Respiratory/Cancer (4.7%) All Injury (5.3%) All Injury (6.2%) Circulatory (7.8%)
Hospitalization Rate (Including birth and pregnancy) 93.8 96.7 89.7 81.8 86.5 92.4 104.9
Hospitalization Rate for Males (Including birth) 83.4 83.0 77.5 65.9 70.2 78.6 96.9
Hospitalization Rate for Females (Including birth and pregnancy) 106.4 112.3 102.9 97.3 101.6 106.5 115.3
Hospitalization Rate (Excluding birth and pregnancy) 69.7 67.2 63.2 52.9 56.8 62.9 80.0
Hospitalization Rate for Males (Excluding birth) 72.8 71.4 66.4 54.9 59.5 67.6 86.4
Hospitalization Rate for Females (Excluding birth and pregnancy) 67.7 63.8 60.8 51.4 54.6 59.0 74.1
Deaths (2008-2010) Age Standardized (per 100,00) to 1991 Canadian Population (continued)
Hospitalization Standardized Rates 2008 to 2010
Health Service Utilization Hospitalizations 2008-2010
Edmonton Zone Health Status Report 2011 - February 2012 Page 8 of 26

Indicator Categories Z4.1A Z4.1B Z4.1C Z4.1D Z4.2A Z4.2B Z4.2C
Number of Emergency Department Visits (2010) 20,223 9,810 16,395 22,167 18,241 29,884 30,329
Top 7 overall reasons for Emergency Department visits (2010) All Injury (23.5%) All Injury (23.8%) All Injury (23.5%) All Injury (26.6%) All Injury (22.5%) All Injury (22.3%) All Injury (23.9%)
Signs & Symptoms (21.6%) Signs & Symptoms (19.2%) Signs & Symptoms (17.4%) Signs & Symptoms (17.5%) Signs & Symptoms (22.1%) Signs & Symptoms (21.9%) Signs & Symptoms (20.5%)
Respiratory (7.7%) Respiratory (8.1%) Respiratory (8.7%) Respiratory (8.6%) Respiratory (99.3%) Respiratory (9.0%) Respiratory (8.6%)
Digestive (5.9%) Digestive (6.7%) Digestive (6.6%) Digestive (6.2%) Digestive (5.8%) Health Status (6.3%) Mental & Behavioral (7.1%)
Musculoskeletal (5.5%) Health Status (5.4%) Health Status (5.5%) Health Status (5.4%) Health Status (5.4%) Digestive (5.8%) Musculoskeletal (5.3%)
Mental & Behavioral (5.4%) Musculoskeletal (5.2%) Genitourinary (5.3%) Genitourinary (5.3%) Genitourinary (5.3%) Musculoskeletal (5.4%) Digesive (5.3%)
Health Status /Genitourinary (4.9%)
Genitourinary (5.1%) Infectious & Parasitic (5.0%) Infectious & Parasitic (4.9%) Musculoskeletal (4.9%) Genitourinary (5.3%) Health Status (5.0%)
Emergency Department Visit Rate (per 1,000) 346.0 332.3 361.1 293.8 329.9 386.3 431.3
Emergency Department Visit Rate for Males (per 1,000) 337.9 325.5 358.9 296.9 321.0 377.5 427.8
Emergency Department Visit Rate for Females (per 1,000) 355.4 339.3 365.4 291.6 338.8 396.5 434.8
Emergency Department Visits 2010
Emergency Department Standardized Rates 2010
Edmonton Zone Health Status Report 2011 - February 2012 Page 9 of 26

Indicator Categories Z4.2DE Z4.3A Z4.3B Z4.3C Z4.4A Z4.4B Z4.4C
Number of Births (2008-2010) 3,933 2,712 1,997 2,663 1,538 2,490 2,257
Percent Low Birth Weight (of live births, <2500 gm) 7.2% 7.3% 9.1% 7.9% 5.9% 6.7% 6.7%
Percent High Birth Weight (of live births, ≥ 4000 gm) 10.0% 10.7% 9.5% 9.6% 9.7% 10.1% 9.3%
Percent Small-for-Gestational-Age (of singleton live births) 11.3% 10.5% 13.1% 12.7% 9.2% 9.6% 10.4%
Percent Preterm Births (of live births, <37 wks gestation) 9.8% 8.6% 12.1% 9.7% 8.7% 9.2% 8.5%
Crude Birth Rate (per 1,000) 15.6 10.0 12.8 15.6 13.3 13.6 29.8
General Fertility Rate (per 1,000 women 15-49 yr) 57.9 38.2 48.7 56.9 50.0 53.6 97.8
Teen Birth Rate (per 1,000 women 15-19 yr) 26.8 17.7 15.9 11.8 10.2 5.0 4.5
Percent Maternal Prenatal Smoking (of deliveries) (2008-2010) 20.8% 13.8% 16.5% 9.5% 11.2% 4.9% 4.7%
Life Expectancy (yrs) 2008-2010 79.9 81.1 80.7 83.9 81.6 83.7 84.0
Life Expectancy at Birth for Males (yrs) 2008-2010 77.7 79.1 78.6 83.1 79.7 82.1 82.4
Life Expectancy at Birth for Females (yrs) 2008-2010 82.1 83.1 82.7 84.5 83.5 85.2 85.5
Infant Mortality Rate (per 1,000 live births) (2006-2010) 6.2 8.6 7.1 5.2 5.9 4.6 5.1
Number of Deaths (2010) 389 667 273 150 257 331 73
Number of Deaths (2008 - 2010) 1,267 2,136 819 452 765 976 180
Top 7 Causes of Death (2008-2010) Cancer (29.9%) Circulatory (33.1%) Circulatory (30.6%) Cancer (30.3%) Circulatory (28.7%) Cancer (32.2%) Cancer (26.4%)
Circulatory (25.8%) Cancer (25.7%) Cancer (24.4%) Circulatory (27.9%) Cancer (27.0%) Circulatory (28.5%) Circulatory (25.3%)
Injury (10.1%) Respiratory (10.4%) Respiratory (11.3%) Injury (10.6%) Respiratory (10.0%) Respiratory (8.3%) Injury (10.7%)
Respiratory (9.0%) Injury (5.9%) Injury (8.1%) Respiratory (7.4%) Injury (7.6%) Mental & Behavioral (6.1%) Respiratory (6.2%)
Mental & Behavioral (4.9%) Mental & Behavioral (5.5%) Mental & Behavioral (6.6%) Digestive (4.7%) Mental & Behavioral (7.1%) Nervous System (6.1%) Digestive (6.2%)
Digestive (4.7%) Nervous System (4.7%) Digestive (5.5%) Nervous System (3.4%) Nervous System (6.7%) Injury (5.7%) Nervous System (4.5%)
Nervous System (3.6%) Digestive (4.2%) Nervous System (3.6%) Endocrine & Metabolic (3.1%) Genitourinary (3.0%) Genitourinary (3.4%) Genitourinary (4.5%)
All Cause Death Rate 554.0 504.6 549.3 377.0 506.6 402.7 420.8All Cause Death Rate for Males 681.4 613.8 653.7 405.5 586.4 477.3 476.4All Cause Death Rate for Females 449.4 418.4 463.0 350.6 435.8 343.1 380.0
Ischaemic Heart Disease Death Rate 90.9 87.7 88.5 69.2 80.9 64.8 63.0*Ischaemic Heart Disease Death Rate for Males 125.2 127.7 113.0 100.5 108.6 87.3 81.4*Ischaemic Heart Disease Death Rate for Females 61.5 56.2 64.8 43.9* 59.4 46.6 **
All Heart Disease Death Rate 115.0 113.3 118.2 91.9 100.2 80.4 81.5*All Heart Disease Death Rate for Males 149.3 156.8 145.8 118.7 120.5 111.3 96.2*All Heart Disease Death Rate for Females 87.2 77.9 90.3 71.2 82.4 56.1 66.0*
Cancer Death Rate 163.3 140.0 139.3 102.4 145.6 135.1 111.9Cancer Death Rate for Males 201.4 160.2 162.8 114.9 174.5 146.8 122.0*Cancer Death Rate for Females 138.2 127.8 122.9 94.9 125.2 125.2 105.0*
Respiratory Death Rate 50.2 49.0 63.6 33.3* 46.1 31.7 28.7*Respiratory Death Rate for Males 61.2 64.0 81.7 ** 53.0* 36.9* **Respiratory Death Rate for Females 40.6 39.2 52.2 39.1* 42.9 28.9 **
All Injury Death Rate 51.5 37.3 41.8 28.7 43.8 26.2 34.7*All Injury Death Rate for Males 77.7 49.0 49.3 50.3* 58.7* 42.7 52.1*All Injury Death Rate for Females 28.5* 26.1 32.7* ** 28.6* 12.1* **
Unintentional Injury Death Rate 22.8 13.5 16.7* 14.5* 19.5* 13.0* 27.3*Unintentional Injury Death Rate for Males 35.1* 17.8* 14.6* 25.4* 25.4* 22.1* **Unintentional Injury Death Rate for Females 13.2* 10.0* 17.4* ** 13.6* ** **
BIRTHS 2008-2010
Birth Data Special Years
Life Expectancy
Deaths
Deaths (2008-2010) Age Standardized (per 100,00) to 1991 Canadian Population
Summary of Health Indicators for Edmonton Zone (Z4.2DE - Z4.4C)
Edmonton Zone Health Status Report 2011 - February 2012 Page 10 of 26

Indicator Categories Z4.2DE Z4.3A Z4.3B Z4.3C Z4.4A Z4.4B Z4.4C
Intentional Injury Death Rate 16.9 14.9 16.0* 10.6* 17.0* 9.1* **Intentional Injury Death Rate for Males 27.2* 20.3* 22.0* 17.6* 26.2* 15.7* **Intentional Injury Death Rate for Females ** 9.8* ** ** ** ** **
Suicide Rate 12.6* 12.9 14.8* 7.5* 16.2* 7.5* **Suicide Rate for Males 19.3* 17.1* 20.7* ** 24.6* 12.4* **Suicide Rate for Females ** 9.2* ** ** ** ** .0
Lung Cancer Death Rate 54.2 39.4 45.8 21.7* 34.9 31.2 **Lung Cancer Death Rate for Males 62.3 43.5 51.9* 30.5* 41.4* 34.3* **Lung Cancer Death Rate for Females 49.5 36.4 42.3* 16.9* 30.6* 28.8* **
Colorectal Cancer Death Rate 13.9* 14.9 17.0* 11.7* 19.9* 9.4* **Colorectal Cancer Death Rate for Males 17.3* 16.0* 20.7* ** 22.9* 10.1* **Colorectal Cancer Death Rate for Females 10.7* 14.2* 13.3* ** 17.1* 8.7* **
Breast Cancer Death Rate for Females 17.8* 14.1* 19.5* 14.7* 17.4* 16.3* **Prostate Cancer Death Rate for Males 17.2* 23.0 ** 24.8* 18.7* 12.2* **Stroke Death Rate 21.9 27.1 35.3 19.9* 30.0 20.1 **
Stroke Death Rate for Males 21.2* 37.2 44.9* ** 21.8* 23.2* **Stroke Death Rate for Females 21.5* 20.1 29.5* 23.7* 35.6* 18.3* **
Chronic Obstructive Pulmonary Disease (COPD) Death Rate 22.3 22.1 24.5* ** 22.0* 11.7* **Chronic Obstructive Pulmonary Disease Death Rate for Males 28.3* 32.4 33.8* ** 20.0* 11.3* **Chronic Obstructive Pulmonary Disease Death Rate for Females 17.2* 15.8* 19.6* ** 23.7* 12.0* **
Number of Hospitalizations (2010) 8,048 8,120 4,196 4,347 3,213 5,054 2,800
Number of Hospitalizations (2008-2010) 23,350 24,103 12,248 12,907 9,519 14,952 7,813
Percent of hospitalizations that are birth or pregnancy related (2008-2010) 31.5% 21.2% 31.1% 39.5% 14.2% 31.7% 53.7%
Percent due to top 7 Causes (2008-2010) 65.2% 62.3% 64.5% 67.5% 64.9% 64.7% 76.5%
Top 7 overall reasons for Hospitalization (2008-2010) Obstetric Related (18.5%) Obstetric Related (12.2%) Obstetric Related (17.9%) Obstetric Related (22.5%) Obstetric Related (17.1%) Obstetric Related (17.7%) Obstetric Related (29.8%)
Birth Event (13.0%) Health Status (9.7%) Birth Event (13.2%) Birth Event (17.0%) Birth Event (13.1%) Birth Event (14.0%) Birth Event (23.9%)
Digestive (7.6%) Birth Event (9.0%) Digestive (7.8%) Digestive (6.8%) Health Status (8.4%) Health Status (7.8%) Digestive (5.8%)
Health Status (7.4%) Circulatory (9.0%) Health Status (6.9%) Circulatory (5.9%) Digestive (7.4%) Digestive (7.7%) Perinatal Conditions (5.8%)
Circulatory (6.7%) Digestive (8.4%) Circulatory (6.7%) All Injury (5.2%) Circulatory (7.1%) Circulatory (6.6%) Health Status (4.2%)
All Injury (6.6%) All Injury (7.2%) Respiratory (6.3%) Health Status (5.2%) All Injury (5.9%) All Injury (5.9%) All Injury (3.6%)
Respiratory (5.3%) Respiratory (6.7%) All Injury (5.7%) Perinatal Conditions (4.8%) Respiratory (5.8%) Cancer (5.0%) Circulatory/Respiratory (3.3%)
Hospitalization Rate (Including birth and pregnancy) 94.3 79.2 81.9 81.4 77.8 82.0 93.8
Hospitalization Rate for Males (Including birth) 77.8 70.7 69.1 64.8 62.0 64.8 67.6
Hospitalization Rate for Females (Including birth and pregnancy) 110.4 89.7 95.1 98.1 94.0 97.9 118.6
Hospitalization Rate (Excluding birth and pregnancy) 64.5 57.0 55.6 51.3 51.5 49.8 56.4
Hospitalization Rate for Males (Excluding birth) 67.2 59.7 58.7 53.4 51.4 52.7 55.6
Hospitalization Rate for Females (Excluding birth and pregnancy) 62.4 55.0 53.1 49.5 51.7 47.2 57.4
Deaths (2008-2010) Age Standardized (per 100,00) to 1991 Canadian Population (continued)
Hospitalization Standardized Rates 2008 to 2010
Health Service Utilization Hospitalizations 2008-2010
Edmonton Zone Health Status Report 2011 - February 2012 Page 11 of 26
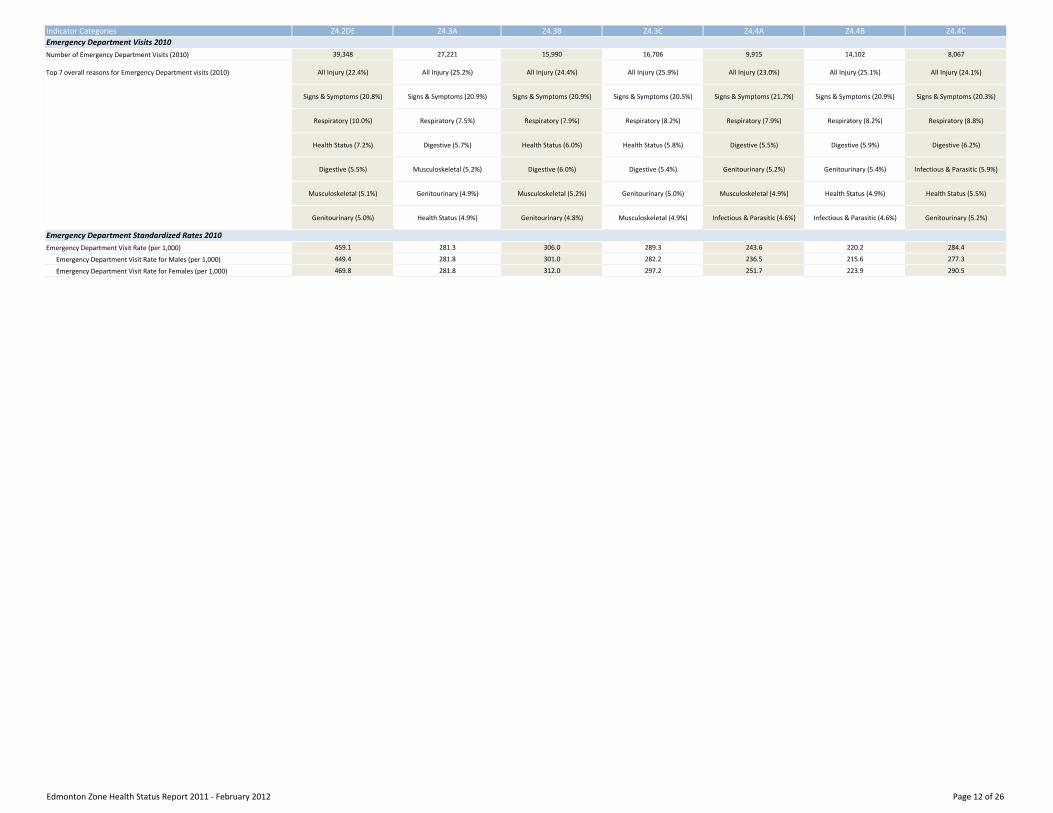
Indicator Categories Z4.2DE Z4.3A Z4.3B Z4.3C Z4.4A Z4.4B Z4.4C
Number of Emergency Department Visits (2010) 39,348 27,221 15,990 16,706 9,915 14,102 8,067
Top 7 overall reasons for Emergency Department visits (2010) All Injury (22.4%) All Injury (25.2%) All Injury (24.4%) All Injury (25.9%) All Injury (23.0%) All Injury (25.1%) All Injury (24.1%)
Signs & Symptoms (20.8%) Signs & Symptoms (20.9%) Signs & Symptoms (20.9%) Signs & Symptoms (20.5%) Signs & Symptoms (21.7%) Signs & Symptoms (20.9%) Signs & Symptoms (20.3%)
Respiratory (10.0%) Respiratory (7.5%) Respiratory (7.9%) Respiratory (8.2%) Respiratory (7.9%) Respiratory (8.2%) Respiratory (8.8%)
Health Status (7.2%) Digestive (5.7%) Health Status (6.0%) Health Status (5.8%) Digestive (5.5%) Digestive (5.9%) Digestive (6.2%)
Digestive (5.5%) Musculoskeletal (5.2%) Digestive (6.0%) Digestive (5.4%) Genitourinary (5.2%) Genitourinary (5.4%) Infectious & Parasitic (5.9%)
Musculoskeletal (5.1%) Genitourinary (4.9%) Musculoskeletal (5.2%) Genitourinary (5.0%) Musculoskeletal (4.9%) Health Status (4.9%) Health Status (5.5%)
Genitourinary (5.0%) Health Status (4.9%) Genitourinary (4.8%) Musculoskeletal (4.9%) Infectious & Parasitic (4.6%) Infectious & Parasitic (4.6%) Genitourinary (5.2%)
Emergency Department Visit Rate (per 1,000) 459.1 281.3 306.0 289.3 243.6 220.2 284.4
Emergency Department Visit Rate for Males (per 1,000) 449.4 281.8 301.0 282.2 236.5 215.6 277.3
Emergency Department Visit Rate for Females (per 1,000) 469.8 281.8 312.0 297.2 251.7 223.9 290.5
Emergency Department Visits 2010
Emergency Department Standardized Rates 2010
Edmonton Zone Health Status Report 2011 - February 2012 Page 12 of 26

Indicator Categories Z4.5A Z4.5B Z4.6AB Z4.7A Z4.8A Z4.8B Z4.9A
Number of Births (2008-2010) 1,151 981 3,109 2,570 2,055 1,000 1,835
Percent Low Birth Weight (of live births, <2500 gm) 5.6% 6.1% 6.0% 6.0% 6.5% 6.0% 5.8%
Percent High Birth Weight (of live births, ≥ 4000 gm) 14.5% 11.1% 11.2% 12.9% 13.1% 12.4% 12.6%
Percent Small-for-Gestational-Age (of singleton live births) 7.1% 7.6% 8.3% 7.3% 7.8% 8.5% 7.8%
Percent Preterm Births (of live births, <37 wks gestation) 8.8% 7.3% 8.8% 9.0% 7.5% 7.7% 8.3%
Crude Birth Rate (per 1,000) 18.6 12.6 11.7 15.5 14.9 11.7 9.6
General Fertility Rate (per 1,000 women 15-49 yr) 68.9 49.7 46.3 61.6 58.0 50.4 38.2
Teen Birth Rate (per 1,000 women 15-19 yr) 14.7 12.1 5.4 12.2 15.7 27.2 4.7
Percent Maternal Prenatal Smoking (of deliveries) (2008-2010) 22.7% 21.9% 10.0% 15.6% 17.5% 30.9% 11.5%
Life Expectancy (yrs) 2008-2010 79.2 80.8 82.7 81.3 81.2 79.7 82.5
Life Expectancy at Birth for Males (yrs) 2008-2010 77.0 78.8 81.0 79.3 78.9 76.7 80.0
Life Expectancy at Birth for Females (yrs) 2008-2010 81.6 82.8 84.5 83.5 83.6 83.4 84.9
Infant Mortality Rate (per 1,000 live births) (2006-2010) 6.1 2.5 3.6 7.1 2.8 7.2 5.5
Number of Deaths (2010) 113 135 391 305 245 162 342
Number of Deaths (2008 - 2010) 317 432 1,168 866 723 493 1,007
Top 7 Causes of Death (2008-2010) Cancer (29.4%) Circulatory (30.8%) Cancer (31.8%) Circulatory (30.0%) Cancer (32.9%) Cancer (30.3%) Circulatory (31.3%)
Circulatory (29.0%) Cancer (30.3%) Circulatory (29.3%) Cancer (29.5%) Circulatory (28.1%) Circulatory (28.7%) Cancer (30.7%)
Injury (8.9%) Respiratory (10.2%) Respiratory (8.2%) Respiratory (9.2%) Injury (8.2%) Injury (12.4%) Respiratory (10.3%)
Respiratory (8.5%) Injury (8.3%) Injury (7.4%) Injury (8.2%) Respiratory (7.2%) Respiratory (8.1%) Nervous System (5.5%)
Digestive (4.8%) Digestive (4.4%) Mental & Behavioral (4.7%) Nervous System (4.4%) Nervous System (5.1%) Digestive (4.5%) Injury (5.1%)
Nervous System (3.8%) Nervous System (3.9%) Digestive (4.5%) Digestive (3.8%) Digestive (4.4%) Endocrine & Metabolic (2.6%) Digestive (4.4%)
Genitourinary (3.4%)Mental & Behavioral/Endocrine &
Metabolic (2.5%)Nervous System (4.0%) Mental & Behavioral (3.7%) Mental & Behavioral (4.3%) Genitourinary (2.4%) Mental & Behavioral (4.1%)
All Cause Death Rate 563.0 531.4 456.6 504.3 521.3 586.9 502.7All Cause Death Rate for Males 691.4 646.9 543.4 631.2 633.1 753.0 677.0All Cause Death Rate for Females 462.1 438.9 382.6 403.9 422.6 425.9 383.8
Ischaemic Heart Disease Death Rate 96.1 90.9 78.5 84.4 62.0 92.5 86.1Ischaemic Heart Disease Death Rate for Males 143.6* 133.5 118.6 130.6 74.7 123.1 131.1Ischaemic Heart Disease Death Rate for Females 59.0* 59.2* 47.8 55.6 48.8 64.6* 54.1
All Heart Disease Death Rate 112.8 115.1 102.5 109.9 104.9 124.8 115.6All Heart Disease Death Rate for Males 152.6* 160.6 141.4 157.3 123.3 159.3 165.4All Heart Disease Death Rate for Females 79.9* 83.2 71.5 81.5 85.9 87.7 78.9
Cancer Death Rate 171.5 166.6 139.3 154.6 168.8 158.4 154.6Cancer Death Rate for Males 215.3 187.1 161.8 179.1 198.2 203.9 195.9Cancer Death Rate for Females 126.5* 147.7 124.9 134.9 140.8 116.6 123.8
Respiratory Death Rate 48.0* 55.4 39.5 44.6 39.6 54.8 52.3Respiratory Death Rate for Males 59.8* 60.3* 50.2 45.8* 47.0* 96.5* 78.7Respiratory Death Rate for Females 37.0* 53.2* 30.3 42.0 36.1* 24.0* 38.1
All Injury Death Rate 41.1* 44.7* 31.9 42.3 41.5 73.4 27.0All Injury Death Rate for Males 57.3* 63.2* 45.1 72.1 67.3 111.4* 40.8*All Injury Death Rate for Females ** 24.6* 18.9* 13.3* 16.5* 39.7* 15.7*
Unintentional Injury Death Rate 26.9* 29.5* 14.0* 21.8* 19.7* 33.1* 14.3*Unintentional Injury Death Rate for Males 40.0* 34.5* 20.1* 35.3* 30.5* 59.4* 21.7*Unintentional Injury Death Rate for Females ** ** 8.0* ** ** ** 9.4*
Life Expectancy
Birth Data Special Years
Deaths
Deaths (2008-2010) Age Standardized (per 100,00) to 1991 Canadian Population
BIRTHS 2008-2010
Summary of Health Indicators for Edmonton Zone (Z4.5A- Z4.9A)
Edmonton Zone Health Status Report 2011 - February 2012 Page 13 of 26
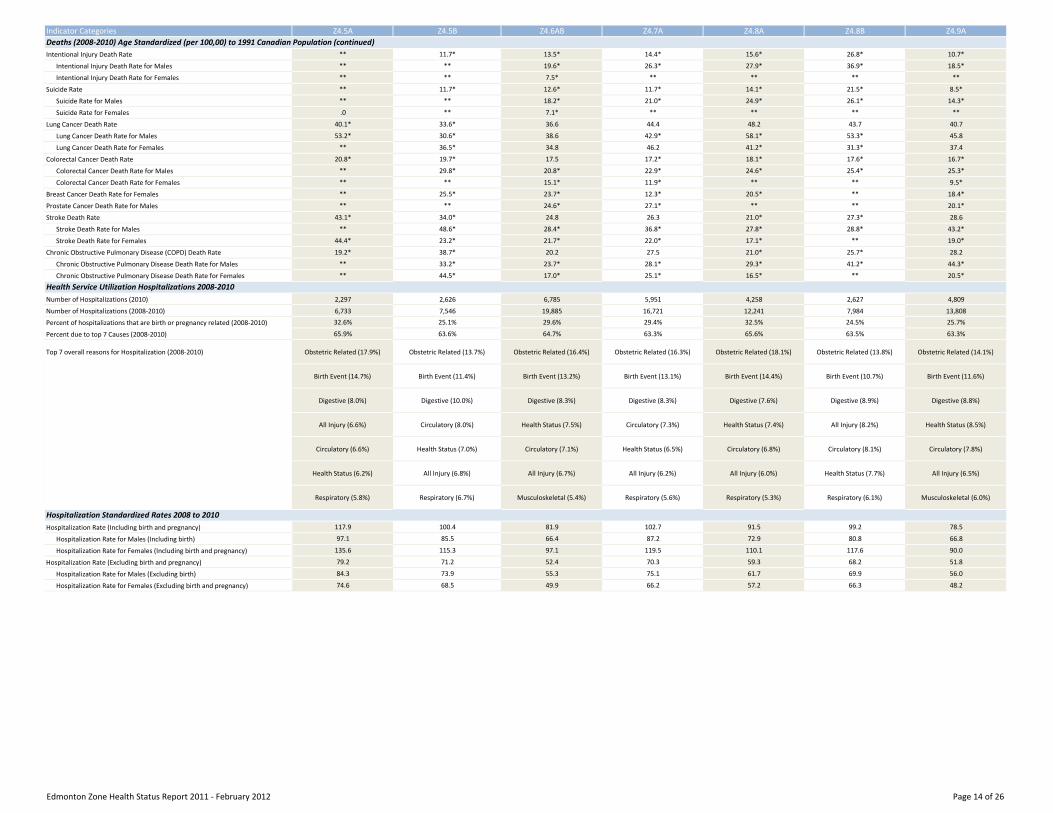
Indicator Categories Z4.5A Z4.5B Z4.6AB Z4.7A Z4.8A Z4.8B Z4.9A
Intentional Injury Death Rate ** 11.7* 13.5* 14.4* 15.6* 26.8* 10.7*
Intentional Injury Death Rate for Males ** ** 19.6* 26.3* 27.9* 36.9* 18.5*
Intentional Injury Death Rate for Females ** ** 7.5* ** ** ** **
Suicide Rate ** 11.7* 12.6* 11.7* 14.1* 21.5* 8.5*
Suicide Rate for Males ** ** 18.2* 21.0* 24.9* 26.1* 14.3*
Suicide Rate for Females .0 ** 7.1* ** ** ** **
Lung Cancer Death Rate 40.1* 33.6* 36.6 44.4 48.2 43.7 40.7
Lung Cancer Death Rate for Males 53.2* 30.6* 38.6 42.9* 58.1* 53.3* 45.8
Lung Cancer Death Rate for Females ** 36.5* 34.8 46.2 41.2* 31.3* 37.4
Colorectal Cancer Death Rate 20.8* 19.7* 17.5 17.2* 18.1* 17.6* 16.7*
Colorectal Cancer Death Rate for Males ** 29.8* 20.8* 22.9* 24.6* 25.4* 25.3*
Colorectal Cancer Death Rate for Females ** ** 15.1* 11.9* ** ** 9.5*
Breast Cancer Death Rate for Females ** 25.5* 23.7* 12.3* 20.5* ** 18.4*
Prostate Cancer Death Rate for Males ** ** 24.6* 27.1* ** ** 20.1*
Stroke Death Rate 43.1* 34.0* 24.8 26.3 21.0* 27.3* 28.6
Stroke Death Rate for Males ** 48.6* 28.4* 36.8* 27.8* 28.8* 43.2*
Stroke Death Rate for Females 44.4* 23.2* 21.7* 22.0* 17.1* ** 19.0*
Chronic Obstructive Pulmonary Disease (COPD) Death Rate 19.2* 38.7* 20.2 27.5 21.0* 25.7* 28.2
Chronic Obstructive Pulmonary Disease Death Rate for Males ** 33.2* 23.7* 28.1* 29.3* 41.2* 44.3*
Chronic Obstructive Pulmonary Disease Death Rate for Females ** 44.5* 17.0* 25.1* 16.5* ** 20.5*
Number of Hospitalizations (2010) 2,297 2,626 6,785 5,951 4,258 2,627 4,809
Number of Hospitalizations (2008-2010) 6,733 7,546 19,885 16,721 12,241 7,984 13,808
Percent of hospitalizations that are birth or pregnancy related (2008-2010) 32.6% 25.1% 29.6% 29.4% 32.5% 24.5% 25.7%
Percent due to top 7 Causes (2008-2010) 65.9% 63.6% 64.7% 63.3% 65.6% 63.5% 63.3%
Top 7 overall reasons for Hospitalization (2008-2010) Obstetric Related (17.9%) Obstetric Related (13.7%) Obstetric Related (16.4%) Obstetric Related (16.3%) Obstetric Related (18.1%) Obstetric Related (13.8%) Obstetric Related (14.1%)
Birth Event (14.7%) Birth Event (11.4%) Birth Event (13.2%) Birth Event (13.1%) Birth Event (14.4%) Birth Event (10.7%) Birth Event (11.6%)
Digestive (8.0%) Digestive (10.0%) Digestive (8.3%) Digestive (8.3%) Digestive (7.6%) Digestive (8.9%) Digestive (8.8%)
All Injury (6.6%) Circulatory (8.0%) Health Status (7.5%) Circulatory (7.3%) Health Status (7.4%) All Injury (8.2%) Health Status (8.5%)
Circulatory (6.6%) Health Status (7.0%) Circulatory (7.1%) Health Status (6.5%) Circulatory (6.8%) Circulatory (8.1%) Circulatory (7.8%)
Health Status (6.2%) All Injury (6.8%) All Injury (6.7%) All Injury (6.2%) All Injury (6.0%) Health Status (7.7%) All Injury (6.5%)
Respiratory (5.8%) Respiratory (6.7%) Musculoskeletal (5.4%) Respiratory (5.6%) Respiratory (5.3%) Respiratory (6.1%) Musculoskeletal (6.0%)
Hospitalization Rate (Including birth and pregnancy) 117.9 100.4 81.9 102.7 91.5 99.2 78.5
Hospitalization Rate for Males (Including birth) 97.1 85.5 66.4 87.2 72.9 80.8 66.8
Hospitalization Rate for Females (Including birth and pregnancy) 135.6 115.3 97.1 119.5 110.1 117.6 90.0
Hospitalization Rate (Excluding birth and pregnancy) 79.2 71.2 52.4 70.3 59.3 68.2 51.8
Hospitalization Rate for Males (Excluding birth) 84.3 73.9 55.3 75.1 61.7 69.9 56.0
Hospitalization Rate for Females (Excluding birth and pregnancy) 74.6 68.5 49.9 66.2 57.2 66.3 48.2
Hospitalization Standardized Rates 2008 to 2010
Deaths (2008-2010) Age Standardized (per 100,00) to 1991 Canadian Population (continued)
Health Service Utilization Hospitalizations 2008-2010
Edmonton Zone Health Status Report 2011 - February 2012 Page 14 of 26
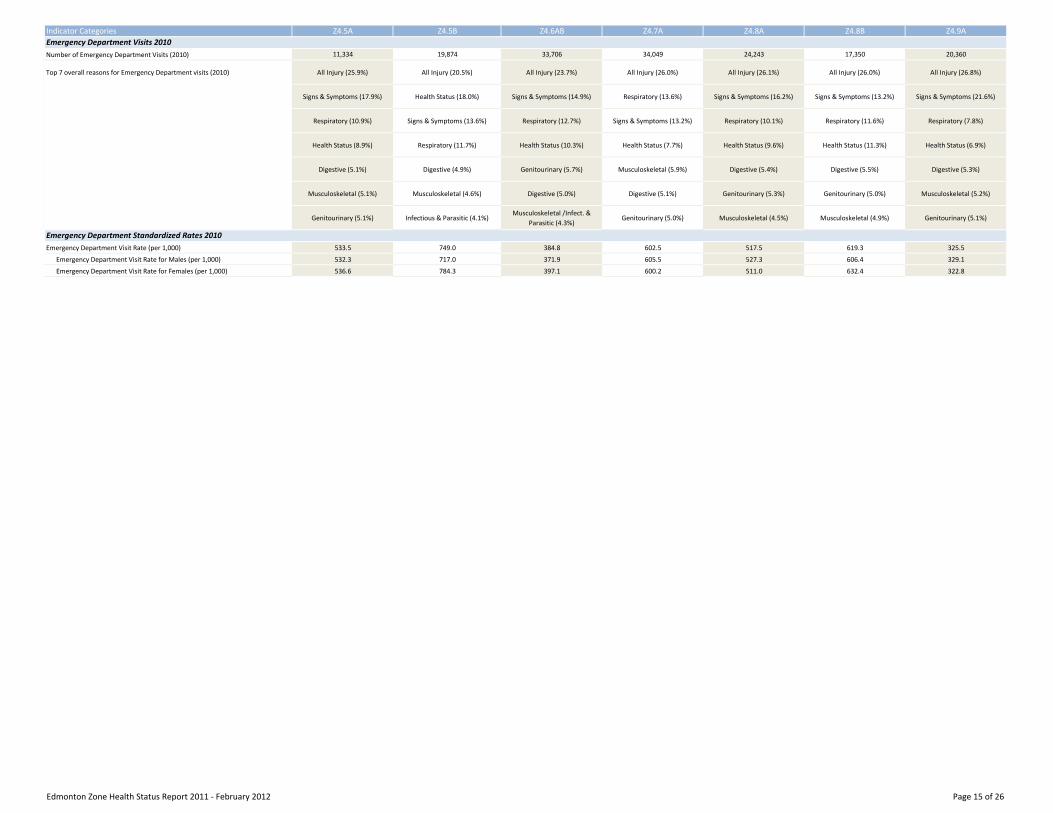
Indicator Categories Z4.5A Z4.5B Z4.6AB Z4.7A Z4.8A Z4.8B Z4.9A
Number of Emergency Department Visits (2010) 11,334 19,874 33,706 34,049 24,243 17,350 20,360
Top 7 overall reasons for Emergency Department visits (2010) All Injury (25.9%) All Injury (20.5%) All Injury (23.7%) All Injury (26.0%) All Injury (26.1%) All Injury (26.0%) All Injury (26.8%)
Signs & Symptoms (17.9%) Health Status (18.0%) Signs & Symptoms (14.9%) Respiratory (13.6%) Signs & Symptoms (16.2%) Signs & Symptoms (13.2%) Signs & Symptoms (21.6%)
Respiratory (10.9%) Signs & Symptoms (13.6%) Respiratory (12.7%) Signs & Symptoms (13.2%) Respiratory (10.1%) Respiratory (11.6%) Respiratory (7.8%)
Health Status (8.9%) Respiratory (11.7%) Health Status (10.3%) Health Status (7.7%) Health Status (9.6%) Health Status (11.3%) Health Status (6.9%)
Digestive (5.1%) Digestive (4.9%) Genitourinary (5.7%) Musculoskeletal (5.9%) Digestive (5.4%) Digestive (5.5%) Digestive (5.3%)
Musculoskeletal (5.1%) Musculoskeletal (4.6%) Digestive (5.0%) Digestive (5.1%) Genitourinary (5.3%) Genitourinary (5.0%) Musculoskeletal (5.2%)
Genitourinary (5.1%) Infectious & Parasitic (4.1%)Musculoskeletal /Infect. &
Parasitic (4.3%)Genitourinary (5.0%) Musculoskeletal (4.5%) Musculoskeletal (4.9%) Genitourinary (5.1%)
Emergency Department Visit Rate (per 1,000) 533.5 749.0 384.8 602.5 517.5 619.3 325.5
Emergency Department Visit Rate for Males (per 1,000) 532.3 717.0 371.9 605.5 527.3 606.4 329.1
Emergency Department Visit Rate for Females (per 1,000) 536.6 784.3 397.1 600.2 511.0 632.4 322.8
Emergency Department Visits 2010
Emergency Department Standardized Rates 2010
Edmonton Zone Health Status Report 2011 - February 2012 Page 15 of 26

Indicator Categories City of Edmonton EDMONTON ZONE ALBERTA
Number of Births (2008-2010) 32,747 45,452 151,449
Percent Low Birth Weight (of live births, <2500 gm) 7.2% 6.9% 6.8%
Percent High Birth Weight (of live births, ≥ 4000 gm) 10.1% 10.3% 10.5%
Percent Small-for-Gestational-Age (of singleton live births) 10.9% 10.0% 10.2%
Percent Preterm Births (of live births, <37 wks gestation) 9.5% 9.1% 8.7%
Crude Birth Rate (per 1,000) 13.6 13.4 14.0
General Fertility Rate (per 1,000 women 15-49 yr) 51.6 51.5 53.9
Teen Birth Rate (per 1,000 women 15-19 yr) 18.6 16.0 19.1
Percent Maternal Prenatal Smoking (of deliveries) (2008-2010) 14.9% 15.2% 16.4%
Life Expectancy (yrs) 2008-2010 80.9 81.0 81.0
Life Expectancy at Birth for Males (yrs) 2008-2010 78.7 78.8 78.9
Life Expectancy at Birth for Females (yrs) 2008-2010 83.1 83.3 83.2
Infant Mortality Rate (per 1,000 live births) (2006-2010) 6.3 6.4 5.9
Number of Deaths (2010) 4,806 6,562 20,515
Number of Deaths (2008 - 2010) 14,799 19,980 62,102
Top 7 Causes of Death (2008-2010) Circulatory (29.9%) Circulatory (29.8%) Circulatory (31.4%)
Cancer (27.1%) Cancer (27.9%) Cancer (27.3%)
Respiratory (9.9%) Respiratory (9.6%) Respiratory (8.9%)
Injury (8.1%) Injury (8.2%) Injury (8.5%)
Mental & Behavioral (5.2%) Mental & Behavioral (4.9%) Mental & Behavioral (5.1%)
Nervous System (4.7%) Nervous System (4.6%) Nervous System (4.1%)
Digestive (4.4%) Digestive (4.4%) Digestive (4.1%)
All Cause Death Rate 515.0 514.3 519.5All Cause Death Rate for Males 634.7 636.2 633.8All Cause Death Rate for Females 420.3 416.7 425.2
Ischaemic Heart Disease Death Rate 86.4 85.3 91.5Ischaemic Heart Disease Death Rate for Males 119.4 119.2 125.1Ischaemic Heart Disease Death Rate for Females 59.3 57.9 63.7
All Heart Disease Death Rate 110.9 110.8 117.0All Heart Disease Death Rate for Males 146.4 147.3 152.3All Heart Disease Death Rate for Females 81.6 80.9 87.7
Cancer Death Rate 147.3 149.6 147.6Cancer Death Rate for Males 177.4 180.0 174.5Cancer Death Rate for Females 126.2 127.5 127.4
Respiratory Death Rate 48.9 48.1 45.4Respiratory Death Rate for Males 64.8 63.7 59.2Respiratory Death Rate for Females 39.2 38.2 36.5
All Injury Death Rate 45.2 44.4 46.2All Injury Death Rate for Males 63.8 64.2 67.1All Injury Death Rate for Females 28.5 26.3 26.3
Unintentional Injury Death Rate 17.9 18.8 22.5Unintentional Injury Death Rate for Males 26.7 28.3 32.9Unintentional Injury Death Rate for Females 10.7 10.8 12.9
Birth Data Special Years
Deaths
Deaths (2008-2010) Age Standardized (per 100,00) to 1991 Canadian Population
Life Expectancy
BIRTHS 2008-2010
Summary of Health Indicators for Edmonton Zone (City of Calgary - ALBERTA)
Edmonton Zone Health Status Report 2011 - February 2012 Page 16 of 26
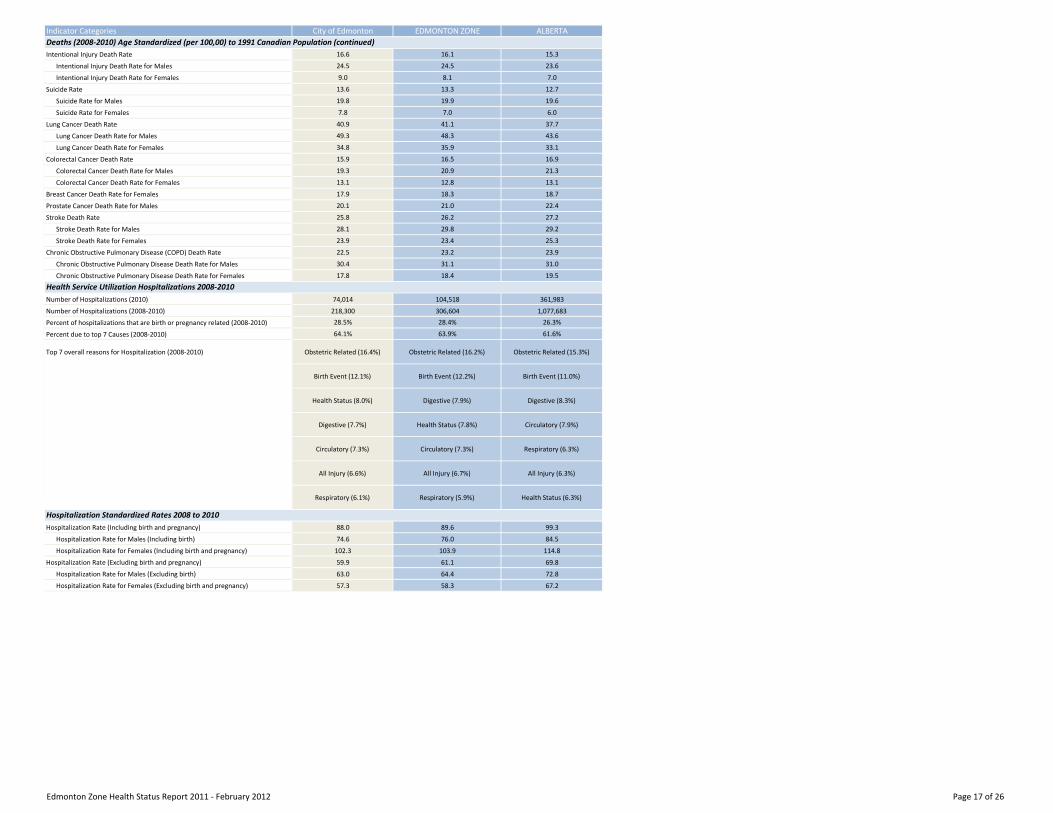
Indicator Categories City of Edmonton EDMONTON ZONE ALBERTA
Intentional Injury Death Rate 16.6 16.1 15.3
Intentional Injury Death Rate for Males 24.5 24.5 23.6
Intentional Injury Death Rate for Females 9.0 8.1 7.0
Suicide Rate 13.6 13.3 12.7
Suicide Rate for Males 19.8 19.9 19.6
Suicide Rate for Females 7.8 7.0 6.0
Lung Cancer Death Rate 40.9 41.1 37.7
Lung Cancer Death Rate for Males 49.3 48.3 43.6
Lung Cancer Death Rate for Females 34.8 35.9 33.1
Colorectal Cancer Death Rate 15.9 16.5 16.9
Colorectal Cancer Death Rate for Males 19.3 20.9 21.3
Colorectal Cancer Death Rate for Females 13.1 12.8 13.1
Breast Cancer Death Rate for Females 17.9 18.3 18.7
Prostate Cancer Death Rate for Males 20.1 21.0 22.4
Stroke Death Rate 25.8 26.2 27.2
Stroke Death Rate for Males 28.1 29.8 29.2
Stroke Death Rate for Females 23.9 23.4 25.3
Chronic Obstructive Pulmonary Disease (COPD) Death Rate 22.5 23.2 23.9
Chronic Obstructive Pulmonary Disease Death Rate for Males 30.4 31.1 31.0
Chronic Obstructive Pulmonary Disease Death Rate for Females 17.8 18.4 19.5
Number of Hospitalizations (2010) 74,014 104,518 361,983
Number of Hospitalizations (2008-2010) 218,300 306,604 1,077,683
Percent of hospitalizations that are birth or pregnancy related (2008-2010) 28.5% 28.4% 26.3%
Percent due to top 7 Causes (2008-2010) 64.1% 63.9% 61.6%
Top 7 overall reasons for Hospitalization (2008-2010) Obstetric Related (16.4%) Obstetric Related (16.2%) Obstetric Related (15.3%)
Birth Event (12.1%) Birth Event (12.2%) Birth Event (11.0%)
Health Status (8.0%) Digestive (7.9%) Digestive (8.3%)
Digestive (7.7%) Health Status (7.8%) Circulatory (7.9%)
Circulatory (7.3%) Circulatory (7.3%) Respiratory (6.3%)
All Injury (6.6%) All Injury (6.7%) All Injury (6.3%)
Respiratory (6.1%) Respiratory (5.9%) Health Status (6.3%)
Hospitalization Rate (Including birth and pregnancy) 88.0 89.6 99.3
Hospitalization Rate for Males (Including birth) 74.6 76.0 84.5
Hospitalization Rate for Females (Including birth and pregnancy) 102.3 103.9 114.8
Hospitalization Rate (Excluding birth and pregnancy) 59.9 61.1 69.8
Hospitalization Rate for Males (Excluding birth) 63.0 64.4 72.8
Hospitalization Rate for Females (Excluding birth and pregnancy) 57.3 58.3 67.2
Hospitalization Standardized Rates 2008 to 2010
Deaths (2008-2010) Age Standardized (per 100,00) to 1991 Canadian Population (continued)
Health Service Utilization Hospitalizations 2008-2010
Edmonton Zone Health Status Report 2011 - February 2012 Page 17 of 26

Indicator Categories City of Edmonton EDMONTON ZONE ALBERTA
Number of Emergency Department Visits (2010) 264,661 444,270 2,045,279
Top 7 overall reasons for Emergency Department visits (2010) All Injury (23.9%) All Injury (24.3%) All Injury (20.7%)
Signs & Symptoms (20.6%) Signs & Symptoms (18.6%) Signs & Symptoms (14.4%)
Respiratory (8.6%) Respiratory (9.6%) Health Status (13.8%)
Digestive (5.8%) Health Status (7.3%) Respiratory (11.6%)
Health Status (5.6%) Digestive (5.6%) Musculoskeletal (5.4%)
Musculoskeletal (5.1%) Genitourinary (5.0%) Digestive (5.2%)
Genitourinary(5.0%) Musculoskeletal (5.0%) Genitourinary (4.8%)
Emergency Department Visit Rate (per 1,000) 316.7 381.1 551.8
Emergency Department Visit Rate for Males (per 1,000) 311.1 378.7 538.6
Emergency Department Visit Rate for Females (per 1,000) 323.2 384.3 566.3
Legend : * - Release with caution due to sampling variability; ** - Supressed due to extreme sampling variability
Source : Please refer to Appendix 1 – Data Sources and Definitions
Emergency Department Visits 2010
Emergency Department Standardized Rates 2010
Edmonton Zone Health Status Report 2011 - February 2012 Page 18 of 26

Population
DATA SOURCE Alberta Health Care Insurance Plan (AHCIP) Historical population values (that is, for points in time between June 30, 1986 and March 31, 2010) are interpolations of actual population values (that is, annual values from June 30, 1986 to June 30, 1991 and from March 31, 1992 to March 31, 2010) from the Alberta Health Care Insurance Plan (AHCIP) Registration File. Forecast values (that is, for points in time after March 31, 2010) are estimated using the March 31, 2010 AHCIP Registration File values and year-over-year population growth values based on forecasts provided by the Health Surveillance Branch of Alberta Health and Wellness. The forecasts have been further adjusted using June 30, 2010 AH&W Registration File data. The following registrants are included in the population estimates: residents of Alberta; ‘residents’ of Alberta temporarily living elsewhere, such as extended visits or vacations or students attending an educational institute outside of Alberta, or Albertans temporarily (up to four years) working outside Alberta; persons during the first three months after they move from Alberta to another Canadian province; dependants of members of the RCMP and Armed Forces; persons from another country who are working or studying in Alberta on valid visas; and Natives/Aboriginals whose premiums are paid by Health Canada, First Nations and Inuit Health Branch. Not included are: members of the Armed Forces and RCMP; inmates at federal penitentiaries; persons from other provinces during their first three months in Alberta; and persons who have not registered for eligibility, or have opted out. The annual historical population files provided by Alberta Health and Wellness (AH&W) include individuals registered under the Alberta Health Care Insurance Plan for only part of that fiscal year, but not as at March 31. AH&W marks these records (i.e., about 97,000, or 2.8% in 2006/07, representing residents that have died, moved, opted out, and so forth) as "inactive" and we exclude them. Individuals in the Alberta Health Care Insurance Plan aged 121 years or older have their date of birth (DOB) checked against additional sources and are "corrected", if possible; otherwise they are removed from the database. Finally, an extremely small volume of individuals with a missing or obviously invalid postal code, date of birth, or gender (e.g., about 600, or 0.02% in 2006/07) have been excluded. Slight differences between values provided at this level of aggregation and data provided at other levels of aggregation may occur because of round-off error. Population values are subject to change without notice when new data are received.
Area (km2) Data Source: MapInfo program and Boundary files for the Geographic Areas used in the report.
Number of people per km2
Numerator (N): 2011 Population
Denominator (D): Area of geography (from MapInfo and Boundary files)
Calculation: N/D = people per km2
Number of dwellings per km2
(2006) Numerator (N): Number of dwellings (2006 Census)
Denominator (D): Area of geography (from MapInfo and Boundary files)
Calculation: N/D = dwellings per km2
DATA ANNOTATIONS
NA Not available Data are suppressed when the numbers are small enough to jeopardize confidentiality
Appendix 1 – Data Sources and Definitions
Edmonton Zone Health Status Report 2011 - February 2012 Page 19 of 26

Birth Indicators Percent Low Birth Weight (of live births, <2500 gm) Data Source: Service Alberta, Vital Statistics (Births)
Years: 2010, and 2008 to 2010 combined
Numerator (N): Number of live births with a low birth weight (<2500 grams)
Denominator (D): Number of live births
Calculation: N/D X 100= Percent (%)
Percent High Birth Weight (of live births, ≥ 4000 gm)
Data Source: Service Alberta, Vital Statistics (Births)
Years: 2010, and 2008 to 2010 combined
Numerator (N): Number of live births with a high birth weight (≥ 4000 grams)
Denominator (D): Number of live births
Calculation: N/D X 100= Percent (%)
Percent Small-for-Gestational-Age (of singleton live births)
Data Source: Service Alberta, Vital Statistics (Births)
Years: 2010, and 2008 to 2010 combined
Numerator (N): Number of singleton, live births with a birth weight below the 10th
percentile of appropriate weight for gestational age (Reference: Robertson C, Svenson L. Birth weight by gestational age for Albertan live born infants, 1985-1998. JOGC (2002), February, pp 138-147)
Denominator (D): Number of singleton, live births
Calculation: N/D X 100= Percent (%)
Percent Preterm Births (of live births, <37 wks gestation)
Data Source: Service Alberta, Vital Statistics (Births)
Years: 2010, and 2008 to 2010 combined
Numerator (N): Number of live births with a gestational age of <37 weeks
Denominator (D): Number of live births
Calculation: N/D X 100= Percent (%)
Crude Birth Rate (per 1,000 population) Data Sources: (1) Service Alberta, Vital Statistics (Births); (2) Alberta Health Care Insurance Plan (Population)
Years: 2010, and 2008 to 2010 combined
Numerator (N): Number of live births
Denominator (D): Total Population
Calculation: N/D X 1000= Rate per 1,000
General Fertility Rate (per 1,000 females aged 15-49 yr)
Data Sources: (1) Service Alberta, Vital Statistics (Births); (2) Alberta Health Care Insurance Plan (Population)
Years: 2010, and 2008 to 2010 combined
Numerator (N): Number of live births
Denominator (D): Number of females aged 15-49 yrs
Calculation: N/D X 1000= Rate per 1,000
Teen Birth Rate (per 1,000 females aged 15-19 yr) Data Sources: (1) Service Alberta, Vital Statistics (Births); (2) Alberta Health Care Insurance Plan (Population)
Years: 2010, and 2008 to 2010 combined
Numerator (N): Number of live births born to females aged 15-19 years
Denominator (D): Number of females aged 15-19 yrs
Calculation: N/D X 1000= Rate per 1,000
Edmonton Zone Health Status Report 2011 - February 2012 Page 20 of 26

Percent Maternal Prenatal Smoking (of women who delivered)
Data Sources: Alberta Perinatal Health Program
Years: 2006 to 2008 combined
Numerator (N): Number of women who reported smoking cigarettes at some point during their pregnancy
Denominator (D): Number of women who delivered
Calculation: N/D X 100= Percent (%)
Life Expectancy at birth (yrs) Data Sources: (1) Service Alberta, Vital Statistics (Deaths); (2) Alberta Health Care Insurance Plan (Population)
Years: 2010 or 2008 to 2010 combined
Life Expectancy at birth is defined as the average number of years a hypothetical birth cohort would live if they were subjected to the current mortality conditions throughout the rest of their lives.
Calculation: The calculation is complex and is available in the Life Expectancy Indicator Template.
http://insite.albertahealthservices.ca/1764.asp
Deaths
DATA SOURCES Service Alberta, Vital Statistics (Births and Deaths) Alberta Health Care Insurance Plan (Population) Canadian 1991 Population (Standard Population)
Infant Mortality Rate (per 1,000 live births) Years: 2006 to 2010 combined
Numerator (N): Number of babies who died before 12 months of age
Denominator (D):Number of live births
Calculation: N/D X 1000= Rate per 1,000 live births
Top 7 Causes of Death Years: 2010 and 2008-2010 combined
Top seven causes were based on percentage of all deaths due to a specific cause; and the causes with the seven highest percentages were selected.
See the ICD10 coding table for categories
Deaths Crude Rates (per 100,000) All cause and specific causes
Years: 2010 and 2008-2010 combined
Numerator (N): Number of deaths due to a specific cause (see ICD10 coding table) or all causes
Denominator (D): Population
Calculation: N/D X 100,000=Rate per 100,000
Deaths Age Standardized Rates (per 100,000) All cause and specific causes Standardized to the 1991 Canadian population
Years: 2008-2010 combined
The standardized death rates were calculated using the direct approach with the standard population being the 1991 Canadian population. Both cause-specific death rates (see ICD10 coding table) and all-cause rates were computed.
An age standardized rate should be used when comparing rates across geographies.
DATA ANNOTATIONS
* Release with caution due to sampling variability
V Suppressed due to extreme sampling variability
Edmonton Zone Health Status Report 2011 - February 2012 Page 21 of 26

Hospitalizations
DATA SOURCE Health Care Utilization Data (Inpatient data from AHS – Data Integration Measurement and Reporting) Alberta Health Care Insurance Plan (Population) Canadian 1991 Population (Standard Population)
Percent of Hospitalizations that are Birth or Pregnancy Related
Years: 2010, 2008-2010 combined
Numerator (N): Number of hospitalizations with an ICD10 code related to Birth/Pregnancy
Denominator (D): Number of hospitalizations
Calculation: N/D X 100=Percent (%)
Top 7 overall reasons for Hospitalization Years: 2010, 2008-2010 combined
Top seven reasons for hospitalization were based on percentage of all hospitalizations due to cause; and the causes with the seven highest percentages were selected.
See the ICD10 coding table for categories.
Hospitalization Rate (Including Births and Pregnancy) Crude and Age Standardized (per 1,000)
Years: 2010, 2008-2010 combined
Numerator (N): Number of hospitalizations
Denominator (D): Population
Calculation for Crude Rate: N/D X 1000=Rate per 1,000
This calculation can also be done for males and females separately using only females or only males in the numerator and denominator.
The standardized hospitalization rate was calculated using the direct approach; with the standard population being the 1991 Canadian population.
An age standardized rate should be used when comparing rates across geographies.
Emergency Department Visits DATA SOURCE Health Care Utilization Data (Emergency and Urgent Care Visits from AHS – Data Integration Measurement and
Reporting) Alberta Health Care Insurance Plan (Population) Canadian 1991 Population (Standard Population)
Top 7 overall reasons for Emergency Department visits
Years: 2010
Top seven reasons for visiting the Emergency Department or Urgent Care Center were based on percentage of all Emergency and Urgent Care visits due to cause; and the reasons with the seven highest percentages were selected.
See the ICD10 coding table for categories.
Emergency Department Visit Rate Crude and Age Standardized (per 1,000)
Years: 2010
Numerator (N): Number of emergency and urgent care visits
Denominator (D): Population
Calculation for Crude Rate: N/D X 1000=Rate per 1,000
This calculation can also be done for males and females separately using only females or only males in the numerator and denominator.
Edmonton Zone Health Status Report 2011 - February 2012 Page 22 of 26
The standardized ED/Urgent care visit rate was calculated using the direct approach; with the standard population being the 1991 Canadian population.
An age standardized rate should be used when comparing rates across geographies.
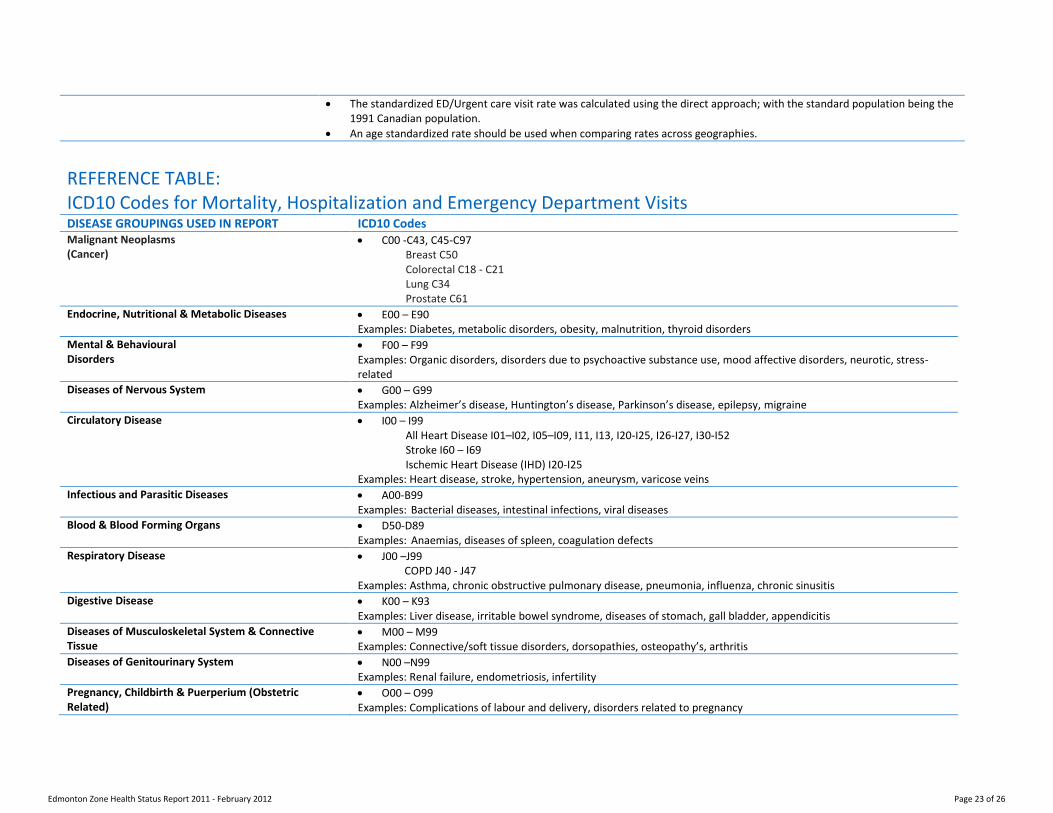
REFERENCE TABLE: ICD10 Codes for Mortality, Hospitalization and Emergency Department Visits
DISEASE GROUPINGS USED IN REPORT ICD10 Codes Malignant Neoplasms (Cancer)
C00 -C43, C45-C97 Breast C50 Colorectal C18 - C21 Lung C34 Prostate C61
Endocrine, Nutritional & Metabolic Diseases E00 – E90 Examples: Diabetes, metabolic disorders, obesity, malnutrition, thyroid disorders
Mental & Behavioural Disorders
F00 – F99 Examples: Organic disorders, disorders due to psychoactive substance use, mood affective disorders, neurotic, stress-related
Diseases of Nervous System G00 – G99 Examples: Alzheimer’s disease, Huntington’s disease, Parkinson’s disease, epilepsy, migraine
Circulatory Disease
I00 – I99 All Heart Disease I01–I02, I05–I09, I11, I13, I20-I25, I26-I27, I30-I52 Stroke I60 – I69 Ischemic Heart Disease (IHD) I20-I25
Examples: Heart disease, stroke, hypertension, aneurysm, varicose veins
Infectious and Parasitic Diseases A00-B99 Examples: Bacterial diseases, intestinal infections, viral diseases
Blood & Blood Forming Organs D50-D89 Examples: Anaemias, diseases of spleen, coagulation defects
Respiratory Disease J00 –J99 COPD J40 - J47
Examples: Asthma, chronic obstructive pulmonary disease, pneumonia, influenza, chronic sinusitis
Digestive Disease K00 – K93 Examples: Liver disease, irritable bowel syndrome, diseases of stomach, gall bladder, appendicitis
Diseases of Musculoskeletal System & Connective Tissue
M00 – M99 Examples: Connective/soft tissue disorders, dorsopathies, osteopathy’s, arthritis
Diseases of Genitourinary System N00 –N99 Examples: Renal failure, endometriosis, infertility
Pregnancy, Childbirth & Puerperium (Obstetric Related)
O00 – O99 Examples: Complications of labour and delivery, disorders related to pregnancy
Edmonton Zone Health Status Report 2011 - February 2012 Page 23 of 26

Birth Event Z37 – Z389 Examples: Birth
Certain Conditions Originating in Perinatal Period (Perinatal Conditions)
P00 – P96 Examples: Disorders due to length of gestation, haemorrhagic/respiratory/cardiovascular conditions with newborn
Congenital Malform, Deformities & Chromosomal Abn (Congenital Anomaly)
Q00-Q99 Examples: Congenital malformations of digestive, circulatory, musculoskeletal systems
Health Status Z00 – Z369, Z39 – Z999 Examples: Specific procedures, medical exams, education
Symptoms, Signs & Abnorm Clin. Findings (Signs & Symptoms)
R00 – R99 Examples: Nausea & vomiting, murmurs, fever, headache
Diseases of Skin & Subcutaneous Tissue L00 – L99 Examples: Infections of the skin, dermatitis, eczema
Ear and Mastoid Process H60 – H95 Examples: Otitis media, diseases of inner ear
Eye and Adnexa H00 – H59 Examples: Disorders of conjunctiva, eyelid, sclera, glaucoma
Suicide X60-X84.9, Y87.0
All Injury
V01-Y98 Unintentional Injury V01 – V99, W00 – W99, X00 – X59, Y85 – Y86 Intentional Injury X60 – X99, Y00 – Y09, Y35 – Y36, Y87 – Y87.1, Y89 – Y89.1 Undetermined Intent Injury Y10 – Y34, Y89.9, Y87.2
Examples: Transport accidents, falls, exposure, intentional self harm, assault, poisoning
Risk Factors
DATA SOURCE Statistics Canada – Canadian Community Health Survey, 2009/2010 (www.statcan.gc.ca) Self-reported survey data, analyzed for Zones by Alberta Health & Wellness 2010 (www.ahw.gov.ab.ca/IHDA_Retrieval)
Percent who are normal weight Numerator (N): Number of adults (20-64 yrs, not pregnant) whose self reported Body Mass Index (BMI) is in the normal BMI range (18.5 – 24.9), where BMI = Weight (kg) / Height
2 (m
2)
Denominator (D): All respondents 20-64 yrs, not pregnant
Calculation: N/D x 100 = Percent (%)
Percent who are overweight Numerator (N): Number of adults (20-64 yrs, not pregnant) whose self reported Body Mass Index (BMI) is in considered overweight (25.0 – 29.9), where BMI = Weight (kg) / Height
2 (m
2)
Denominator (D): All respondents 20-64 yrs, not pregnant
Calculation: N/D x 100 = Percent (%)
Percent who are obese Numerator (N): Number of adults (20-64 yrs, not pregnant) whose self reported Body Mass Index (BMI) is considered obese (≥ 30.0), where BMI = Weight (kg) / Height
2 (m
2)
Denominator (D): All respondents 20-64 yrs, not pregnant
Calculation: N/D x 100 = Percent (%)
Edmonton Zone Health Status Report 2011 - February 2012 Page 24 of 26

Percent who are never or former smokers
Numerator (N): Number of respondents (≥ 12 yrs) who have never smoked or are former smokers, currently
Denominator (D): Total number of respondents 12 yrs and up
Calculation: N/D x 100 = Percent (%)
Percent who are daily smokers Numerator (N): Number of respondents (≥ 12 yrs) who reported smoking every day, currently
Denominator (D): Total number of respondents 12 yrs and up
Calculation: N/D x 100 = Percent (%)
Percent who are daily or occasional smokers
Numerator (N): Number of respondents (≥ 12 yrs) who reported smoking every day or almost every day, currently
Denominator (D): Total number of respondents 12 yrs and up
Calculation: N/D x 100 = Percent (%)
Percent who eat 5 or more servings of fruit and vegetables per day
Numerator (N): Number of respondents (≥ 12 yrs) who report eating 5 or more servings of fruits and vegetables/day
Denominator (D): Total number of respondents 12 yrs and up
Calculation: N/D x 100 = Percent (%)
Percent who are active or moderately active
Numerator (N): Number of respondents (≥ 12 yrs) who are active or moderately active based on responses to physical activity questions
Denominator (D): Total number of respondents 12 yrs and up
Calculation: N/D x 100 = Percent (%)
Percent who are inactive Numerator (N): Number of respondents (≥ 12 yrs) who are inactive based on responses to physical activity questions
Denominator (D): Total number of respondents 12 yrs and up
Calculation: N/D x 100 = Percent (%)
Percent who are heavy drinkers (>=5 drinks on one occasion, at least once /month)
Numerator (N): Number of respondents (≥ 12 yrs) who report having ≥ 5 drinks at least once per month in the past year
Denominator (D): Total number of 12 yrs and up
Calculation: N/D x 100 = Percent (%)
Percent who are binge drinkers (>=5 drinks two or more times/month)
Numerator (N): Number of respondents (≥ 12 yrs) who report having ≥ 5 drinks 2-3 times per month, once per week or more than once per week in the past year
Denominator (D): Total number of respondents 12 yrs and up
Calculation: N/D x 100 = Percent (%)
Percent who say their life is extremely or quite a bit stressful
Numerator (N): Number of respondents (≥ 18 yrs) who report that their life stress is extreme or quite a bit stressful
Denominator (D): Total number of respondents 18 yrs and up
Calculation: N/D x 100 = Percent (%)
Percent who say their mental health is very good or excellent
Numerator (N): Number of respondents (≥ 12 yrs) who report that their mental health is excellent or very good
Denominator (D): Total number of respondents 12 yrs and up
Calculation: N/D x 100 = Percent (%)
Percent who say they rarely or never wear a helmet when bicycling
Numerator (N): Number of respondents (≥ 12 yrs) who say they rarely or never wear a helmet when bicycling
Denominator (D): Total number of respondents 12 yrs and up who responded yes to cycling for leisure or commuting
Calculation: N/D x 100 = Percent (%)
Percent who say they have arthritis
Numerator (N): Number of respondents (≥ 14 yrs) who say they have arthritis
Denominator (D): Total number of respondents 14 yrs and up
Calculation: N/D x 100 = Percent (%)
Edmonton Zone Health Status Report 2011 - February 2012 Page 25 of 26

Percent who say they have asthma
Numerator (N): Number of respondents (≥ 12 yrs) who say they have asthma
Denominator (D): Total number of respondents 12 yrs and up
Calculation: N/D x 100 = Percent (%)
Percent who say they have back problems (excluding fibromyalgia and arthritis)
Numerator (N): Number of respondents (≥ 12 yrs) who say they have back problems (excluding fibromyalgia and arthritis)
Denominator (D): Total number of respondents 12 yrs and up
Calculation: N/D x 100 = Percent (%)
Percent who say they have ever had cancer
Numerator (N): Number of respondents (≥ 12 yrs) who say they have ever had cancer
Denominator (D): Total number of respondents 12 yrs and up
Calculation: N/D x 100 = Percent (%)
Percent who say they have heart disease
Numerator (N): Number of respondents (≥ 12 yrs) who say they have heart disease
Denominator (D): Total number of respondents 12 yrs and up
Calculation: N/D x 100 = Percent (%)
Percent who say they have high blood pressure
Numerator (N): Number of respondents (≥ 12 yrs) who say they have high blood pressure
Denominator (D): Total number of respondents 12 yrs and up
Calculation: N/D x 100 = Percent (%)
Percent who say they have migraines
Numerator (N): Number of respondents (≥ 12 yrs) who say they have migraines
Denominator (D): Total number of respondents 12 yrs and up
Calculation: N/D x 100 = Percent (%)
Percent who say their breast cancer screening is up to date (mammography for any reason in previous 2 years for women 50 to 69 yrs)
Numerator (N): Number of female respondents (50 to 69 yrs) who say their breast cancer screening is up to date
Denominator (D): Total number of female respondents 50 to 69 yrs
Calculation: N/D x 100 = Percent (%)
HATi (Average number of risk factors per person)
The Healthy Alberta Trends Index – HATi – measures the average number of risk factors per person.
The calculation of the HATi involves each of the 6 indicators listed below being dichotomized as 0 or 1 (0 for healthy or 1 for unhealthy) and totaling; meaning a 6 would be most unhealthy and 0 would be most healthy.
Life Stress
BMI Category
Fruit and Vegetable Consumption
Physical Activity Category derived from reported physical activities
Smoking Status
Heavy Drinking frequency
HATi = sum of risk factors
Average = Sum of HATi’s/number of respondents (Ages 20-64)
Edmonton Zone Health Status Report 2011 - February 2012 Page 25 of 25