editorial boardpublications.quest.edu.pk/downloads/rjcomplete/vol.17, no. 1, jan … · editor and...
TRANSCRIPT


Bi- Annual ISSN: 2523-0379 (E), ISSN: 1605-8607 (P)
ANNUAL SUBSCRIPTION……………………………………… Rs. 200.00 (INLAND), US$ 20.00 (FOREIGN, BY SURFACE MAIL) SINGLE ISSUE………………………………………….……………. Rs. 100.00 (INLAND), US$ 10.00 (FOREIGN, BY SURFACE MAIL)
The Bi-Annual Quaid-e-Awam University Research Journal of Engineering, Science & Technology , Shall be supplied free of cost in exchange of Research Journal(s) from other Universities / Institution and Research Centres.
EDITORIAL BOARD
Prof. Dr. Saleem Raza Samo
Patron-in-Chief & Vice Chancellor
Dr. Umair Ali Khan
Editor and Assoc. Prof., Department of Computer Systems Engineering
Prof. Dr. Abdul Sattar Saand
Editor and Professor Department of Electrical Engineering
MEMBERS (INLAND)
Prof. Dr. Adnan Manzoor Rajper
Professor Dept., of Information
Technology, QUEST, Nawabshah
Dr. Ghulam Mustafa Bhutto
Assoc. Prof., Dept., of Electrical
Engineering, QUEST, Nawabshah
Dr. Adnan Ahmed Arain
Assoc. Prof., Dept., of
Telecommunication Engineering,
QUEST, Nawabshah
Dr. Ehsan Ali Buriro
Assoc. Prof., Dept., of Electronics,
QUEST, Nawabshah
Dr. Suhail Khokhar
Assoc. Prof., Dept., of Electrical
Engineering, QUEST, Nawabshah
Dr. Sajjad Sandelo
Assoc. Prof., Dept., of Mathematics
& Statistics, QUEST, Nawabshah
Dr. Fizza Abbas Alvis
Assoc. Prof., Dept., of Computer
Systems Engineering, QUEST,
Nawabshah
Dr. Rajab Ali Malookani
Asst. Prof., Dept., of BSRS,
QUEST, Nawabshah
Dr. Mukhtiar Ali Soomro
Assoc. Prof., Dept., of Civil
Engineering, QUEST, Nawabshah
Dr. Gordhan Das Valasai
Asst. Prof., Dept., of Mechanical
Engineering, QUEST, Nawabshah
Dr. Noor Ul Hassan Zardari
Assoc. Prof., Dept., of Civil
Engineering, QUCEST, Larkana
Dr. Muhammad Adil Ansari
Assoc. Prof., Dept., of Electronic
Engineering, QUCEST, Larkana
MEMBERS (ABROAD)
Dr. Wen-Ping Cao
Professor, Dept., of Electrical
Power Engineering, Aston
University, United Kingdom
Dr. Irfan Awan
Professor, Dept., of Computer
Science, University of Bradford,
United Kingdom
Dr. Abd Halid Abdullah
Professor, Faculty of Engineering &
Environment, University Tunn,
Malaysia
Andrew Ragai Henry Rigit
Professor, Dept., of Mechanical
Engineering, University Malaysia,
Malaysia
Dr. Ir. W. T. Van Horseen
Assoc. Prof., Dept., of Applied
Mathematics, Delft University of
Technology, Neherlands
Dr. Varun Jeoti
Professor, Department of Electrical &
Electronics, University Technology,
PETRONAS, Perak, Malaysia
Dr. Qi Jia
Senior Lecturer, Department of
Mining & Geotechnical
Engineering, Lulea University of
Technology, Sweden.
Dr. Muhammad Abdel-Awwad
Research scientist, Institute of
Nanostructure Technologies and
Analytics, University of Kassel,
Germany.
Miguel Angel Martinez Del Amor
Asst. Prof., Dept., of Computer Science
& Artificial Intelligence, University of
Seville, Spain
Dr. Raheeb Muzaffar
Senior researcher, Institute of
Networked & Embedded Systems,
University of Klagenfurt, Austria

Bi- Annual ISSN: 2523-0379 (E), ISSN: 1605-8607 (P)
ANNUAL SUBSCRIPTION……………………………………… Rs. 200.00 (INLAND), US$ 20.00 (FOREIGN, BY SURFACE MAIL) SINGLE ISSUE………………………………………….……………. Rs. 100.00 (INLAND), US$ 10.00 (FOREIGN, BY SURFACE MAIL)
The Bi-Annual Quaid-e-Awam University Research Journal of Engineering, Science & Technology , Shall be supplied free of cost in exchange of Research Journal(s) from other Universities / Institution and Research Centres.
EDITORIAL TEAM
EDOTORS
Dr. Umair Ali Khan
Associate Professor, Dept., of Computer Systems
Engineering, QUEST, Nawabshah.
Prof. Dr. Abdul Sattar Saand
Professor, Dept., of Electrical Engineering, QUEST,
Nawabshah.
ASSOCIATE EDITORS
Prof. Dr. Muhamamd Mujtaba Shaikh
Professor, Dept., of Electronic Engineering, QUEST,
Nawabshah
Dr. Mukhtiar Ali Kori
Assistant Professor, Dept., of Information
Technology, QUEST, Nawabshah
Dr. Intesab Hussain Sadhayo
Associate Professor, Dept., of Telecommunication
Engineering, QUEST, Nawabshah
Dr. Shakeel Ahmed Kamboh
Associate Professor, Dept., of Mathematics &
Statistics, QUEST, Nawabshah
Dr. Abdul Qayoom Jakhrani
Associate Professor, Dept., of Engery & Environment
Engineering, QUEST, Nawabshah
Dr. Mukhtiar Ali Soomro
Associate Professor, Dept., of Civil Engineering,
QUEST, Nawabshah
Dr. Jawaid Ahmed Leghari
Associate Professor, Dept., of Electrical Engineering,
QUEST, Nawabshah
Dr. Abdul Qadir Jamali
Assistant Professor, Dept., of Mechanical
Engineering, QUEST, Nawabshah
WEB EDITORS
Dr. Ubaidullah Rajput
Associate Professor, Computer Systems Engineering
Department.
Dr. Sajida Parveen Soomro
Assistant Professor, Computer Systems Engineering
Department
MANUSCRIPT EDITORS
Dr. Imtiaz Ali Halepoto
Associate Professor, Computer Systems Engineering
Department
Dr. Riaz Hussain Bhanbhro
Assistant Professor, Civil Engineering Department
Engr. Agha Shiraz Ahmed Khan
Lecturer, Computer Systems Engineering Department

Bi- Annual ISSN: 2523-0379 (E), ISSN: 1605-8607 (P)
ANNUAL SUBSCRIPTION……………………………………… Rs. 200.00 (INLAND), US$ 20.00 (FOREIGN, BY SURFACE MAIL) SINGLE ISSUE………………………………………….……………. Rs. 100.00 (INLAND), US$ 10.00 (FOREIGN, BY SURFACE MAIL)
The Bi-Annual Quaid-e-Awam University Research Journal of Engineering, Science & Technology , Shall be supplied free of cost in exchange of Research Journal(s) from other Universities / Institution and Research Centres.
ACKNOWLEDGEMENT
The member of Editorial Board, Quaid-e-Awam University Research Journal of Engineering, Science &
Technology are grateful for the valuable and critical suggestions on various research papers sent to the
following researchers / experts for volume 17, No. 1, JAN-JUN, 2019 issue. The members also
appreciate the referees / experts for sharing their knowledge and expertise for uplifting the standard of
this research journal.
Dr. Zeinab Rezaiefar
Researcher, Information System
Security Laboratory, Hanyang
University, South Korea.
Dr. Amir Iqbal Umrani
Assistant professor, Computer
Science Department, DHA Suffa
University, Karachi.
Dr. Ahsan Rahman
Assistant professor, Electronic
Engineering Department,
Qassim University, Saudia
Arabia.
Dr. Asif Khan
Assistant professor, Faculty of
Computer Science and
Engineering, GIK Institute of
Engineering Sciences &
Technology, Topi.
Dr. Safeellah Soomro
Assistant professor, Department of
Basic Sciences & Related Studies,
QUCEST, Larkana.
Ahmad Fadhil Yusof
Senior Lecturer, Department
of Information Systems,
University Technology,
Malysia.
Dr. Rehmanullah Khan
Faculty of Cognitive Sciences &
Human Development, Universiti
Malaysia Sarawak, Malaysia.
Dr. Mushtaque Ali
Professor, Institute of Chemistry,
Shah Abdul Latif University (SALU),
Khairpur Mir"s
Prof. Dr. Khadija Qureshi
Professor, Department of
Chemical Engineering,
MUET, Jamshoro.
Prof. Dr. Mumtaz Ahmed
Sohag
Director, Center of Sustainable
Built Environment, Faculty of
Environmental Sciences, Federal
University, Birnin Kebbi,
Nigeria.
Dr. Miguel Angel Martinez Del
Amor
Assistant Professor, Department of
computer science and artificial
intelligence, University of Sevilla,
Spain.
Dr. Qasim Arain
Assistant professor, Software
Engineering Department,
MUET, Jamshoro.
Dr. Nawab Muhammad Faseeh
Qureshi
Assistant professor, Department
of computer education,
Sungkunkwan University, Seoul,
South Korea.
Dr. Moazzam Jawaid
Assistant Professor, Department of
Computer Systems Engineering,
MUET, Jamshoro.
Dr. Asif Wagan
Assistant professor,
Department of Computer
Science, Sindh Madressa-tul-
Islam University, Karachi.

Bi- Annual ISSN: 2523-0379 (E), ISSN: 1605-8607 (P)
ANNUAL SUBSCRIPTION……………………………………… Rs. 200.00 (INLAND), US$ 20.00 (FOREIGN, BY SURFACE MAIL) SINGLE ISSUE………………………………………….……………. Rs. 100.00 (INLAND), US$ 10.00 (FOREIGN, BY SURFACE MAIL)
The Bi-Annual Quaid-e-Awam University Research Journal of Engineering, Science & Technology , Shall be supplied free of cost in exchange of Research Journal(s) from other Universities / Institution and Research Centres.
CONTENTS
VOLUME 17 NO.1 JAN – JUN 2019
1. Analysis of Total Dissolved Solids and Electrical Conductivity in Different Water
Supply Schemes of Taluka Chachro, District Tharparkar
Sadam Hussain Jakhrani, Hira Lal Soni, Noor Zaman Shar 01-05
2. A Hybrid Decision Model For Renewable Energy Source Selection In Pakistan
Muzumil Anwar, Wasim Ahmad, Mirza Jahanzaib, Shama Mustafa 06-11
3. Video Image Detector: A Tool for Finding Similarity in Video Contents
Muhammad Imran Saeed, Intesab Hussain Sadhayo, Jawaid Shabbir, Nazar Hussain Phulpoto 12-20
4. Spectrum Sensing in ISM Band Using Cognitive Radio
Najamuddin Sohu, Nawaz Ali Zardari, Mushtaque Ahmed Rahu, Azeem Ayaz Mirani4, Nazar Hussain Phulpoto
21-27
5. A Review of Agro-Industry in IoT: Applications and Challenges
Azeem Ayaz Mirani, Muhammad Suleman Memon, Mushtaque Ahemd Rahu, Mairaj Nabi Bhatti 1, Umair Ramzan Shaikh
28-33
6. Road Traffic Accidents (RTAS) Safety Issues On Highways: A Review
Amir Detho, Saleem Raza Samo, Kishan Chand Mukwana, Kamran Ahmed Samo, Mahmoud Hijab Abubaker
34-40

QUEST RESEARCH JOURNAL, VOL. 17, NO. 1, PP. 1–5, JAN–JUN, 2019 1
Analysis of Total Dissolved Solids and Electrical Conductivity in DifferentWater Supply Schemes of Taluka Chachro, District Tharparkar
Sadam Hussain Jakhrani1,*, Hira Lal Soni2, Noor Zaman Shar3
1Department of Civil and Environmental Engineering, Hanyang University, Seoul, Republic of Korea2Department of Chemical Engineering, QUEST, Nawabshah, Sindh, Pakistan3PCRWR, Ministry of Science and Technology, Nawabshah*Corresponding author: [email protected]
Abstract
The present work aims at investigating groundwater quality parameters, particularly total dissolved solids (TDS)and electrical conductivity (EC) of Taluka Chachro District Tharparkar in Sindh province of Pakistan. The samplingwas performed at twenty six different locations for the assessment of water quality and the results were comparedwith World Health Organization (WHO) standards. Water samples were stored in sterilized plastic containers of 500ml immediately after collection from the site. pH and water temperature of the samples were checked at the time ofsampling, whereas, TDS and EC were examined in the laboratory. The pH measurement was made with calibratedHanna 3910 pH meter, electrical conductivity with Hanna 2210 EC meter and total dissolved solids (TDS) withHanna 103 TDS meter. The results revealed that the amount of both TDS and EC in all examined water sampleswas more than WHO standards. It was concluded from the study that the examined groundwater samples are unsafefor human as well as livestock consumption.
Keywords—Fuzzy logic controller, flexible alternating current transmission, PI controller, unified power flow controller.
F
1 Introduction
All living creatures living on the earth requirewater for their existence and evolution. Its ac-
ceptable quality as well as appropriate quantity isvery important for their survival. Water has distinc-tive structure, as it has the capability to disperse,dissolve, and captivate a number of compounds thatdeteriorate the quality of drinking water. It dissolvescontaminants from the surroundings through humanand animals activities [1]. The water quality refersto the physical, chemical, biological parameters andother practices that may change the characteristics ofwater. Indeed, water quality could be affected in anystep of the hydrological cycle. It might be influencedfrom the evaporation process in the atmosphere up tothe end of its cycle when it is taken out from a well orspring. Groundwater contribution for drinking purposein rural areas is about 88% where there is scatteredpopulation [2].In Asia alone, around one billion people are directlydependent on the groundwater aquifers [3]. The drink-able water in Sindh province is mostly based on the
ISSN: 2523-0379 (Online), ISSN: 1605-8607 (Print)
surface water of the river Indus and groundwater fromdifferent aquifers. Tharparkar district covers an areaof about 22,000 square kilometers with an estimatedpopulation of 1.2 million. Out of that, ninety fivepercent live in nearly two thousand scattered villages,especially adjoining any source of water. The arrange-ments required for the treatment and supply of surfacewater do not exist. Therefore, ground water is the onlysource of drinking water in rural communities whichis being acquired from the dug wells at the averagedepth of 10 to 100 m. Furthermore, the quantity ofgroundwater is not enough to serve the people, thusthey compel to use saline water. In fact, the groundwa-ter of the area contains extremely high level of varioussalts and minerals and therefore it is not safe for theconsumption of human as well as livestock population.It has been reported that the level of total solublesalts in the groundwater of Tharparkar is between 636ppm to 9543 ppm. Although, different governmentaland non-governmental organizations installed varioustube wells, hand pumps through use of solar andwind energy systems, but these schemes have not beencompletely successful due to lack of technical expertise

QUEST RESEARCH JOURNAL, VOL. 17, NO. 1, PP. 1–5, JAN–JUN, 2019 2
and maintenance issues. On average, the villagers takeabout four to six hours to get five pots (50 to 60 liters)of water from dug-wells using traditional tactics. Suchpractices not only take too much time but also requiremuch labor and efforts.It is reported that about 81 % population of the arearelies only on rain-fed agriculture for their source ofrevenue as well as on farm animals. The total do-mestic water requirement of the Tharparkar districtis about 0.25 % of the received rainfall. However, rainwater harvesting capacity in the area is only 0.6 % ofthe total water requirement. Both rainwater harvest-ing and groundwater recharging are the most usefulalternatives to tackle the water issue faced by thepeople. It has been observed that mega projects andoverwhelming water schemes could not solve the waterissues of the area and therefore it is recommended tosupport local practice sustained by renewable energybased community-managed water projects with propermaintenance to provide safe water to the people [1-3].Among all water quality parameters, concentrationof hydrogen ion (pH), temperature, total dissolvedsolids (TDS) and electrical conductivity (EC) are thefocused parameters for every researcher. The pH ofnormal drinking water should be between 6.5 and8.5 as given by World Health Organization (WHO).Acidic water can lead to corrosion of metal pipes andplumping system. On the other hand, alkaline wateris generally considered to be safe; however, it couldproduce side effects in body at high alkanity [4]. Tem-perature influences the biological activity and growthof the organism in the water. It controls the typesof organisms that can live in different water bodies.As temperatures vary from their desired range, thenumber of species decreases and finally they disappearat high temperature. Generally, the rate of chemicalreactions increases as water temperature increases andvice versa. Groundwater have tendency to dissolvesmore minerals from the rocks at higher temperaturesand thus acquires higher electrical conductivity. Thesituation could be opposite in view of the oxygen,dissolved in the water. When the water is warm, itholds less dissolved oxygen as compared to cold water.Thus, the survival of aquatic life is more problematicwhen there is less dissolved oxygen [4][5].
1.1 Measurement Techniques of Total DissolvedSolids (TDS)TDS refer to any mineral salts and metals such asCa, Mg, Fe, NaCl and sulfates dissolved in water thatcan pass through a 2.0 µm or smaller pore size filter.It is useful in describing chemical density of water.
Direct measurements for TDS include gravimetric, andflow densitometry, which are considered as expensiveand time consuming [6]. Total dissolved solids havewidely been adopted as a quantifiable measurement ofpossible taste and odor complications or a controlledparameter in industrial effluents [7]. Although, TDSis not a fully specified parameter, yet its low costand simplicity make it widely accepted variable inresearch [8]. Thus, in most research activities, elec-trical conductivity test is being substituted for TDS.Empirical relationships are mostly adopted to convertelectrical conductivity into the concentration of totaldissolved solids [9]. A suitable conversion factor couldbe developed when water samples are somewhat stableover time and are well embodied [10].
1.2 Relationship of Total Dissolved Salts andElectrical ConductivityWater is a good solvent. The amount of total dissolvedsalts as well as electrical conductivity of water increasein the solution when the salts are dissolved in water.Thus, electrical conductivity test is used as correlatedparameter of total dissolved salts. It gives an indi-cation of the amount of total dissolved replacementor exchange. Actually, an electrical conductivity forgroundwater is the ability of 1 cm3 water to conductan electric current at 25◦C and is measured in microSiemens per centimeter [10][11].
TDS(ppm) = 0.64 × EC(µS cm) (1)
Electrical conductivity depends on various factors suchas depth of the collected samples, concentration ofions, groundwater movement, temperature and natureof soil. Temperature changes rely on the level of dif-ferent salts in solution, thus it influence the electricalconductivity. In dilute solutions, an increase of 1◦Ctemperature can increase the conductance of about2% - 3%. It also increases with the increase of theamount of total dissolved salts in the solution [12].Once the level of electrical conductivity is known,the amount of total dissolved solids can be estimatedusing a factor of 0.55 to 0.90 by converting electricalconductivity into the amount of total dissolved solids.Units used for measuring electrical conductivity ofwater are (µS/cm), (mS/cm) and (dS/m). EC valueof water obtained from different locations is given inTable 1 [13]. The relationship of total dissolved solidsand electrical conductivity for groundwater can beapproximated with the help of Equation 2,
TDS = keEC (2)
where TDS (mg/L or ppm) and EC (µS/cm) at 25◦C.The correlation factor, ke is between 0.55 - 0.8. TDS

QUEST RESEARCH JOURNAL, VOL. 17, NO. 1, PP. 1–5, JAN–JUN, 2019 3
Water Collection Point EC (ÂţS/cm)Absolute Pure Water 0.055Distilled Water 0.5Power Plant Boiler Water 1.0Deionized Water 0.1-10Good City Water 0.5-1Ocean Water 5310 % NaOH 35510 % H2SOÂŋ4 432
TABLE 1: Electrical Conductivity at various watercollection units
reported in the freshwater range from 0 to 1000 mg/l,brackish water from 1000 to 10000 mg/l and salinewater 10000 to 100000 mg/l [14]. Mishra et al. [15]reported that the permissible range of pH is 6.5 to 8.5,EC at 1000 (micro mhos/cm), and TDS at 500 mg/l. Itis deduced from literature review that the level of totaldissolved solids and electrical conductivity of drinkingwater quality must be within standards to make peoplehealthy and fit. Otherwise, the consumption of higherTDS and EC water may cause complicated healthissues to the people of the area. Thus, this study aimsat investigating the concentration of total dissolvedsolids and electrical conductivity from Taluko Chachroof District Tharparkar. It may help to see whetherthere is short-term or long-term health risks for humanpopulation consuming groundwater prior to treatmentor not.
2 Materials and MethodsChachro is a Taluka (Tehsil) in the District ofTharparkar, Sindh, Pakistan as shown in Figure 1and Figure 2. Twenty Six different locations of TalukaChachro have been chosen for this study. Out of these,seven from private owned dug wells and nineteengroundwater samples were taken from governmentowned water supply schemes as shown in Table 2 andTable 3, respectively. Water samples taken for theanalysis were stored in sterilized plastic containers of500 ml immediately after collection from the site. Fourwater quality parameters, namely pH, temperature,TDS and EC were assessed following the standardprotocols and by using standard instruments. pH andwater temperature of the samples were noted at thetime of sampling at the site, whereas, TDS and ECwere examined in the laboratory. The pH of water sam-ples was made with calibrated Hanna 3910 pH meterwith glass electrode and reference internal electrode.Electrical conductivity was recorded with calibratedHanna 2210 EC meter and total dissolved solids (TDS)with Hanna 103 TDS meter.
Water Collection Point EC (ÂţS/cm)Absolute Pure Water 0.055Distilled Water 0.5Power Plant Boiler Water 1.0Deionized Water 0.1-10Good City Water 0.5-1Ocean Water 5310 % NaOH 35510 % H2SOÂŋ4 432
TABLE 2: Location of villagers owned water wells ofTaluka Chachro
Water Collection Point EC (ÂţS/cm)Absolute Pure Water 0.055Distilled Water 0.5Power Plant Boiler Water 1.0Deionized Water 0.1-10Good City Water 0.5-1Ocean Water 5310 % NaOH 35510 % H2SOÂŋ4 432
TABLE 3: Location of government owened water sup-ply schemes of Taluka Chachro
3 Results and DiscussionThe values obtained from Government owned watersupply schemes (GWSS) for TDS and EC are shownin Figure 3, and Private owned dug well schemes(PDWS) are given in Figure 4. The maximum TDSfrom GWSS was found as sample G-1 with 10656mg/l while second, third, fourth and fifth maximum
Fig. 1: Location of District Tharparkar in SindhProvince

QUEST RESEARCH JOURNAL, VOL. 17, NO. 1, PP. 1–5, JAN–JUN, 2019 4
Fig. 2: Location of Taluka Chachro in DistrictTharparkar [16]
values were recorded from G-14, G-15, G-16, and G-11with 8185 mg/l, 7513 mg/l, 7462 mg/l, and 7200 mg/lrespectively.The minimum value of TDS was observed in G-2 with766 mg/L. Similarly, the maximum electrical conduc-tivity (EC) was observed from sample G-1 with 16650µS/cm, and minimum from G-2 with 1197 µS/cm.It can be seen from the analysis that all values ofelectrical conductivity showed similar trend as that oftotal dissolved solids. On the other hand, from dugwells owned by private people, the maximum TDS wasfound from the sample P-6 with 29152 mg/l and min-imum from P-3 with 2476 mg/l. Similarly, maximumEC from sample P-6 with 45550 µS/cm and minimumfrom sample P-3 with 3870 µS/cm.The values obtained from Government owned watersupply schemes for pH and water temperature (T) areshown in Figure 5 and private owned dug well schemesare shown in Figure 6. Maximum pH of the samplestaken from government owned water units was notedfrom the sample G-7 with 8.4 and minimum from G-11 with 6.6. No major change in pH and temperaturewas reported from different locations of both GOWSSand PODWS. Maximum pH of samples taken fromdug wells were found from two samples identified asP-3 and P-6 with 7.6, and minimum from sample P-4with pH of 7.2. Moreover, the maximum temperatureof samples taken from government owned water bodieswas observed from sample G-12 with 36.1◦C, andminimum from sample G-19 with 30.8◦C. Similarly,maximum temperature of dug well samples was noted
Fig. 3: TDS and EC of government owned water supplyschemes
Fig. 4: TDS and EC of private owned water supplyschemes
from P-6 with 34.7◦C, and minimum from P-1 with31.2◦C. It is because samples taken in different timing,therefore different pH and temperature were recorded.In addition, a correlation study of TDS and EC wasconducted by using Pearson Correlation. The analysisrevealed that there is strong correlation between totaldissolved solids (TDS) and government owned with acorrelation of 0.983 and 01.
4 ConclusionIt is revealed from the analysis of examined groundwa-ter samples that the amount of both total dissolvedsolids (TDS) and electrical conductivity of TalukaChachro is very high from the standards set by WorldHealth Organization (WHO). Thus, the groundwateris not good for human as well as livestock without anyprior treatment for reduction of TDS and EC. Theregular consumption of this groundwater may increasevarious health anomalies in people, including kidneystones, joint pains, etc. Strong correlation betweentotal dissolved solids (TDS) and electrical conductivity

QUEST RESEARCH JOURNAL, VOL. 17, NO. 1, PP. 1–5, JAN–JUN, 2019 5
Fig. 5: Sampling time pH and water temperature ofGovernment Owned Water Supply Schemes
Fig. 6: Sampling time pH and water temperature ofPrivate Owned Water Supply Schemes
(EC) was found both from the government as well asprivate owned water supply scheme with 0.983 and1.0, respectively. Moreover, no deviation of water tem-perature and pH was observed than WHO guidelinesvalues in all examined water samples. On the basis ofpresent observations, further study could be carriedout to make actual correlation between TDS and EC.On the basis of our present observation, there arisesa provision to investigate the actual relation betweenthese two parameters (TDS and EC). This should havethe need of some further analysis of water of thesewater bodies and a detailed study of these parameters.
References[1] M. A. Khattak et al., “Evaluation of ground water quality
for irrigation and drinking purposes of the areas adjacentto Hudiara Industrial Drain, Lahore, Pakistan”, Pakistan J.Agric. Sci., vol. 49, no. 4, pp. 549–556, 2012.
[2] R. Shyamala, M. Shanthi, and P. Lalitha, “PhysicochemicalAnalysis of Borewell Water Samples of TelungupalayamArea in Coimbatore District, Tamilnadu, India”, E-JournalChem., vol. 5, no. 4, pp. 924–929, 2008.
[3] Z. Hoko, “An assessment of the water quality of drinkingwater in rural districts in Zimbabwe. The case of GokweSouth, Nkayi, Lupane, and Mwenezi districts”, Phys. Chem.Earth, vol. 30, no. 11-16 SPEC. ISS., pp. 859–866, 2005.
[4] N. Rahmanian et al., “Analysis of physiochemical parame-ters to evaluate the drinking water quality in the state ofperak, Malaysia”, J. Chem., vol. 2015, no. Cd, 2015.
[5] A. Miraj, S. Pal, S. Bhattacharya, and K. Chakraborty,“Observation on the TDS and EC Values of Different WaterBodies at Cooch Behar, West Bengal, India”, Int. J. Theor.Appl. Sci., vol. 9, no. 2, pp. 106–113, 2017.
[6] H. van Niekerk, M. J. Silberbauer, and M. Maluleke, “Ge-ographical differences in the relationship between total dis-solved solids and electrical conductivity in South Africanrivers”, Water SA, vol. 40, no. 1, pp. 133–138, 2014.
[7] H. A. Qdais and H. Moussa, “Removal of heavy metals fromwastewater by membrane processes: A comparative study”,Desalination, vol. 164, no. 2, pp. 105–110, 2004.
[8] K. R. Gilmore and H. V. Luong, “Improved Method forMeasuring Total Dissolved Solids”, Anal. Lett., vol. 49, no.11, pp. 1772–1782, 2016.
[9] N. S. B Forsatz, “HPLC with charged aerosol detectionfor pharmaceutical cleaning validation”, 131 W First St,Duluth, MN, 2007.
[10] T. Vehovec and A. Obreza, “Review of operating principleand applications of the charged aerosol detector”, J. Chro-matogr. A, vol. 1217, no. 10, pp. 1549–1556, 2010.
[11] R. Udhayakumar, P. Manivannan, K. Raghu, and S.Vaideki, “Assessment of physico-chemical characteristics ofwater in Tamilnadu”, Ecotoxicol. Environ. Saf., vol. 134, pp.474–477, 2016.
[12] S. A. M. Al Dahaan, N. Al-Ansari, and S. Knutsson,“Influence of Groundwater Hypothetical Salts on ElectricalConductivity Total Dissolved Solids”, Engineering, vol. 08,no. 11, pp. 823–830, 2016.
[13] E. A. Atekwana, E. A. Atekwana, R. S. Rowe, D. D.Werkema, and F. D. Legall, “The relationship of total dis-solved solids measurements to bulk electrical conductivityin an aquifer contaminated with hydrocarbon”, J. Appl.Geophys., vol. 56, no. 4, pp. 281–294, 2004.
[14] Sharma, S. K. “Influence of Sea water ingress: a casestudy from east coast aquifer in India”, In 20th Salt WaterIntrusion Meeting, 2008.
[15] R. Mishra, A.K., Arya, M., and Mathur, “Assessment ofpre-monsoon and post-monsoon ground water quality withspecial reference to fluoride concentration in Narwar, Shiv-puri, Madhya Pradesh, India”, J. Environ. Res. Dev.,vol.6,No.1, pp.77–81, 2011.
[16] R. S. A. A. U. K. H. authorMuhammad Yaseen, “PracticalApplication of Solar Energy at Desert of Tharparkar, Pak-istan”, Energy, Environ. Sustain. Dev., pp. 141–146, 2011.

QUEST RESEARCH JOURNAL, VOL. 17, NO. 1, PP. 6–11, JAN–JUN, 2019 6
A Hybrid Decision Model For Renewable Energy Source Selection In Pak-istan
Muzumil Anwar*, Wasim Ahmad, Mirza Jahanzaib, Shama MustafaDepartment of Industrial Engineering, University of Engineering and Technology, Taxila.*Corresponding author: [email protected]
Abstract
Energy needs are increasing all over the world. The current sources of energy are decreasing rapidly and their usage iscausing environmental pollution including air and water pollution. Due to this reason, the need of the hour is to switchtowards renewable and sustainable energy sources. The selection of a suitable renewable energy source is the mostimportant task to meet the country’s energy need, especially in a scenario where these alternatives negatively affectthe surrounding environment. Involvement of multiple benchmarks such as technical, environmental, economic, landoccupy, and sustainability are making energy planning more complex for decision makers. Wind, biomass, hydro-thermal, geothermal and solar are the alternative renewable energy sources in Pakistan. In such circumstances,companies need tools and techniques to find out the best solution in the contest of conflicting objectives, multiplealternatives and different criteria. Multi-Criteria Decision Making (MCDM) techniques are the decision supportingtechniques which are ideal for such scenarios. After accessing the potential of energy generation from differentrenewable energy resources in Pakistan through literature review and discussion with experts, this research workpresents a hybrid model for decision support about the selection of the renewable energy source in Pakistan. In orderto develop this model, two MCDM techniques, i.e. Analytical Hierarchy Process (AHP) and Technique for Order ofPreference by Similarity to Ideal Solution (TOPSIS) are employed in this study. The results of the analysis suggestthat solar power is the best option in Pakistan. The proposed model will help the policy makers and energy plannersfor the development of long run energy policies for the country.
Keywords—Analytical Hierarchy Process (AHP), Energy Planning, Renewable Energy, Technique for Order of Preferenceby Similarity to Ideal Solution (TOPSIS).
F
1 Introduction
Energy production is essential for human develop-ment. The demand of energy is increasing rapidly
due to increased population. Fossil fuels are coveringalmost 80% of global demand of energy. Renewableenergy and nuclear energy are contributing only 13.1%and 6.5% respectively [1]. Increase in the demand ofenergy all over the world is forcing policy makersand planners to consider the decentralized concept ofrenewable energy systems which has been recognizedas the solution for the current demand of energy bothin the domestic and industrial environment [2]. Inthis modern age, it is not possible for a society tosurvive without continues energy production and byincreasing the sources of energy. In fact, the progressand development of any nation or society can be scaledin terms of per capital energy consumption [3].
ISSN: 2523-0379 (Online), ISSN: 1605-8607 (Print)
Pakistan is facing the energy shortfall where nearlyhalf population has no or poor access to electricity[4]. The energy demand per capital is increasing re-markably. Pakistan’s energy supply mainly dependsupon fossil fuels which is more than 60% of total en-ergy production, while the renewable energy resourceslike solar, thermal, wind and biomass need dedicatedinfrastructure and special attention to exploit prop-erly [5]. Since fossil fuels are limited and decreasingrapidly, and their usage causes significant effect on theenvironment, the need of the hour is the exploitation ofrenewable energy resources. This is necessary not onlybecause of less dependency on fossil fuels, but also forthe protection of the environment as these alternativerenewable energy resources are environment-friendly[6].Multi-Criteria Decision Making (MCDM) methods arevery prevalent and well-known in efficient energy man-

QUEST RESEARCH JOURNAL, VOL. 17, NO. 1, PP. 6–11, JAN–JUN, 2019 7
agement. These tools are used for the solution of theproblems involving multiple and conflicting objectives.These techniques have helped in most countries tomitigate energy poverty. In these techniques, resultsare dependent upon the decision-makers [7]. Manycountries use these techniques for the identificationof the best model solution or for the selection of thebest alternative in the selection of renewable energyresource, such as Ighravwe et al. [8] made a mini-grid business model for a community in Nigeria underthe criteria of economic and envi-ronment, Chia-NanWang et al. [9] used this technique for choosing theoptimal location of solar power plant in Viet Nam andclaimed that this approach is flexible and practical.Pouya et al. [10] made a hybrid model of all renewableenergy sources and applied MCDM technique to rankall renewable energy sources in Iran. Yunna et al. [11]applied fuzzy MCDM technique for the selection ofmost efficient and appropriate renewable power sourcein China.The purpose of this work is to develop a hybrid de-cision model for ranking the renewable energy sourcein Pakistan. The hybrid decision model is composedof two existing MCDM techniques: AHP and TOPSIS.For making criteria-based decision matrix, the AHPmethod is used and TOPSIS is used for making thedecision matrix of alternatives and then to rank alter-natives.
2 MethodsIn this research study, “Analytical Hierarchy Pro-cess”(AHP) and “Technique for Order of Preferenceby Similarity to Ideal Solution”(TOPSIS) methods areemployed to evaluate the alternatives of renewableenergy production pathways. A questionnaire was de-veloped to gather the data from experts. It includedthe criteria and alternatives. A scale of 1 to 10 is usedas low to the high importance of criteria for TOPSISand Saaty’s scale is used for AHP. Weights are givento each alternative and the criteria by experts. Theaverage of all responses of specific alternative andcriteria is used for further calculation.
2.1 AHPAnalytical hierarchy Process (AHP) is a multi-criteriadecision support technique developed by ThomasSaaty in 1977 [12]. In this decision aiding technique,expert’s opinion is used for weighting the individualalternatives and the alternatives are compared withrespect to criteria. Subsequently, a priority score isderived for each alternative. The alternative with thehighest score is preferred [13]. Table 1 and Table 1
show the templates of the criteria matrix and thepairwise comparison matrix used in this analysis. InTable 1, C1..., Cn represents Criteria 1 to Criteria n.In Table 2, Ci and A1..., An represents the ith Criteriaand Alternatives respectively.The steps of AHP are given below [14-17].
1) State the problem and its objective.2) Make a hierarchy, keeping objective at the
top, the criteria at intermediate level, andalternatives at the bottom level.
3) Develop pairwise comparison matrices (n×n)of alternatives based on each of criteria byusing the Saaty’s scale to weight the alterna-tive. The dominant alternative gets the higherweight. Similarly construct a pairwise criteriamatrix.
4) Normalize the pair wise comparison matricesand obtain individual priorities for all matri-ces.
5) Synthesize the model by multiplying the pri-ority matrix of all alternatives with priority ofcriteria matrix.
6) Check the consistency of all matrices bycomputing the value of (λmax). First calcu-late the consistency index given by C.I =λmax − n
(n−1) . Compute consistency ratio(C.R) as R = C.I
R.I , where R.I is a randomindex and is given in the Table 3 [16, 17].
2.2 TOPSISTOPSIS (Technique for Order of Preference by Sim-ilarity to Ideal Solution) is a multi-criteria decision-making tool designed by Huang and Yoon in 1981 [18].In this technique, the +ve and -ve ideal solutions areidentified and the separation from both are calculated.The alternative at the smallest distance from +veideal solution and the largest distance from -ve idealsolution is selected as most preferable alternative [19].The calculation steps of TOPSIS are given below.
1) Development of decision matrix
A =
x11 x12 ... x1n
x21 x22 ... x2n...
......
x1m x2m . . . xnm
(1)
Where xnm is the average weight of an alter-native.
2) Normalization of decision matrix3) Weighted normalization of matrix D.C, where
D is the matrix of average weights for all

QUEST RESEARCH JOURNAL, VOL. 17, NO. 1, PP. 6–11, JAN–JUN, 2019 8
Criteria Matrix Expert 1 Expert 2 ... Expert n AverageC1 C1 ... C C1 Cn C1 ... Cn C1 ... CnC2...C n
TABLE 1: Criteria matrix
Ci Expert 1 Expert 2 ... Expert n AverageA1 A1 ... An A1 ... An A1 ... An A1 ... AnA2...An
TABLE 2: Pariwise comparison matrix
n 1 2 3 4 5 6 7 8 9 10R.I 0 0 0.58 0.9 1.12 1.24 1.32 1.41 1.45 1.49
TABLE 3: Random index
criteria, C = matrix(c1, c2, ..., cn), wherec1, c2, ..., cn are criteria.
4) Calculate Positive Ideal Solution (PIS) andNegative Ideal solutions (NIS).
5) Calculation of Separation from Positive IdealSolution (SPIS) and Separation from NegativeIdeal solutions (SNIS).
6) Calculate closeness to coefficient (CC) idealsolution.
Table 4 shows the weight matrix of criteria. Table 5shows decision matrix for alternative i.
3 An Application: Renewable Energy SourceSelection for PakistanThe proposed model (Figure 1) is a combination oftwo different MCDM techniques: AHP method andTOPSIS method. In AHP method, we identify criteriaweights and from TOPSIS method selection of alter-nate renewable energy source is done. Decision makersor opinion of experts are used for making pairwisecomparison of criteria. The criteria chosen for theproposed model are most commonly used globally andlocally (shown in Table 6) and from opinion of decisionmakers.
4 Model DevelopmentA hybrid model (Figure 1) is created to evaluate theoverall rank of renewable energy pathway. AHP is usedto derive the weights of criteria and TOPSIS is usedto evaluate the overall rank of alternatives. Hybridmodel enhances the reliability of overall results as twotechniques are incorporated due to which limitationsof techniques are minimized.
5 Results and DiscussionA hybrid model of two MCDM techniques, i.e. AHPand TOPSIS, has been developed. Local weights ofcriteria are calculated by using AHP as shown inTable 7. These local priorities are index to the im-portance of each criteria. All weights are based on thesubjective judgments made by experts. It is evidentfrom the results that the efficiency has the highestpriority value of 53%, the second highest value of21% for environmental impacts, 11% for overall cost,8% for the sustainability, and least value of 5% forland use. Environmental impacts are important indeciding the pathway of the energy generation dueto the increasing burden of CO2 emission and Ozonedepletion. Therefore, it can be inferred that a renew-able energy pathway having a high efficiency and lowerenvironmental impacts is desirable based on the localpriorities derived from the criteria matrix.Table 8 shows the weighted decision matrix obtainedby multiplying the local priority of criteria by decisionmatrix. This table shows the integrated result of cri-teria and alternatives which is further normalized toevaluate the +ve and -ve ideal solutions.Table 9 is derived from Table 8. It shows the sepa-rations from positive (SPIS), negative ideal solutions(SNIS), closeness coefficient (CC) and rank of renew-able energy (R.E) alternatives. A desirable alternativeshould have minimum separation from the positiveideal solution, maximum separation from negativeideal solution, and a highest value of closeness coeffi-cient. The solar energy alternative has 0.041 unit sepa-rations from positive ideal solution and 0.285 unit sep-aration from negative ideal solution with the highest

QUEST RESEARCH JOURNAL, VOL. 17, NO. 1, PP. 6–11, JAN–JUN, 2019 9
Criteria Expert 1 Expert 2 Expert 3 ... Expert n AverageCriteria 1Criteria 2Criteria 3...Criteria n
TABLE 4: Weight matrix of the criteria
Criteria Expert 1 Expert 2 Expert 3 ... Expert n AverageCriteria 1Criteria 2Criteria 3...Criteria n
TABLE 5: Decision matrix for the alternatives
Fig. 1: The proposed model
Criteria ReferenceTechnical Efficiency [20] [21] [22] [23] [24] [25]Overall Cost [26] [22] [21] [27] [28]Environmental [21] [27] [29] [20]Land Use [21] [29] [30] [25]Sustainability [29] [27] [31] [32] [33] [34]
TABLE 6: Decision table for the alternatives
Criteria matrix PriorityLand use 0.053Sustainability 0.080Overall installation cost 0.116Environmental impact 0.213Efficiency 0.538Sum 1.000
TABLE 7: Local priority of criteria matrix
value of closeness coefficient. Hence, the solar energyalternative has been ranked number 1 among otheralternatives. In the same way, hydro-thermal, wind,geothermal and biomass energy alternatives have beenranked as 2,3,4,5, respectively.
6 ConclusionThe purpose of this study was to select a suitablerenewable energy resource using proposed hybrid de-cision model. The result of this research study showsthat solar energy is the most suitable renewable energysource for Pakistan. Solar Energy capacity in Pakistanis estimated to be 2,900,000 MW, but only 200 MW ofsolar energy power plants were installed till 2018 [35].Hence, the proposed research study and the resultedranks in Table 8 will help the policy makers and energyplanners for making long-term energy policies for Pak-istan. However, changing the criteria or alternatives

QUEST RESEARCH JOURNAL, VOL. 17, NO. 1, PP. 6–11, JAN–JUN, 2019 10
Decision Matrix Wind Solar Biomass Geothermal Hydro-thermalLand Use 8.00 8.67 4.33 4.33 9.33Sustainability 6.00 8.33 5.33 6.67 6.67Overall Cost to install 5.33 8.67 6.00 5.00 7.67Environmental Impacts 3.67 4.67 5.67 3.33 5.00
TABLE 8: Decision matrix of the alternatives
Alternatives SPIS SNIS CC RankWind 0.184 0.119 0.392 3.000Solar 0.041 0.285 0.874 1.000Biomass 0.277 0.097 0.259 5.000Geothermal 0.209 0.098 0.319 4.000Hydrothermal 0.085 0.211 0.713 2.000
TABLE 9: Computation of SPIS, SNIS & CC
using this model may change the ranking. Alternativescan also be assessed with the simulation model.
References[1] I. E. Agency, Renewables in Global Energy Supply: An IEA
fact sheet, International Energy Agency, 2003.[2] A. Chaudhry, M., R. Raza, and S.A. Hayat, Renewable
Energy Technologies in Pakistan: Prospects and challenges.Renewable and Sustainable Energy Reviews, Vol. 13, No. 6,p. 1657–1662, 2009.
[3] U.K. Mirza, N. Ahmad, T. Majeed and K. Harijan, WindEnergy Development in Pakistan. Renewable and Sustain-able Energy Reviews, Vol. 11, No. 9, pp. 2179–2190, 2007.
[4] U. Zafara, T. U. Rashida, A. Khosab, M. S. Khalila, M.Rahi, An Overview of Implemented Renewable Energy Pol-icy of Pakistan. Renewable and Sustainable Energy Re-views, Vol. 82: pp. 654–665, 2018.
[5] M. Asif, Sustainable Energy Options for Pakistan. Renew-able and Sustainable Energy Reviews, Vol. 13, No. 4, pp.903–909, 2009.
[6] S. Hamal, O. Senvar, and O. Vayvay, Selection of Opti-mal Renewable Energy Investment Project Via Fuzzy Anp.Journal of Economics Finance and Accounting, Vol. 5, No.2, pp. 224–233, 2018.
[7] S. D. Pohekar and M. Ramachandran, Application of Multi-Criteria Decision Making To Sustainable Energy Plan-ningâĂŤA review. Renewable and Sustainable Energy Re-views, Vol. 8, No. 4, pp. 365–381, 2004.
[8] D. Ighravwe and M. Babatunde, Selection of A Mini-GridBusiness Model For Developing Countries Using CRITIC-TOPSIS With Interval Type-2 Fuzzy Sets. Decision ScienceLetters, Vol. 7, No. 4, pp. 427–442, 2018.
[9] C.N. Wang, V.T. Nguyen, H.T.N. Thai and D.H Duong,Multi-Criteria Decision Making (MCDM) Approaches forSolar Power Plant Location Selection In Viet Nam. Ener-gies, Vol. 11, No. 6 pp. 1504, 2018.
[10] P. Ifaei, A. Farid, and C. Yoo, An Optimal Renewable En-ergy Management Strategy with And Without HydropowerUsing A Factor Weighted Multi-Criteria Decision-MakingAnalysis And Nation-Wide Big Data-Case Study In Iran.Energy, Vol. 158, pp. 357–372, 2018.
[11] Y. Wu, C. Xu, and T. Zhang, Evaluation of RenewablePower Sources Using A Fuzzy MCDM Based On Cumula-tive Prospect Theory: A Case In China. Energy, Vol. 147,pp. 1227–1239, 2018.
[12] T.L. Saaty, A Scaling Method for Priorities in HierarchicalStructures. Journal of Mathematical Psychology, Vol. 15,No. 3, pp. 234–281, 1977.
[13] M. Marttunen, V. Belton, and J. Lienert, Are Objec-tives Hierarchy Related Biases Observed in Practice? AMeta-Analysis of Environmental and Energy Applicationsof Multi-Criteria Decision Analysis. European Journal ofOperational Research, Vol. 265, No. 1, pp. 178–194, 2018.
[14] T.L. Saaty, Analytic Hierarchy Process, In Encyclopediaof Operations Research and Management Science, Springer,pp. 52-64.2013.
[15] T.L. Saaty and K.P. Kearns, Analytical Planning: TheOrganization of Systems, International Series in ModernApplied Mathematics and Computer Science, Vol. 7, Ox-ford: Pergamon Press, 1985.
[16] T.L. Saaty, How to Make A Decision: The Analytic Hier-archy Process. European Journal of Operational Research,Vol. 48, No. 1, pp. 9–26, 1990.
[17] T.L. Saaty, Decision making for leaders. IEEE Transac-tions on Systems, Man, and Cybernetics, Vol. 3, pp. 450-452, 1985.
[18] C.L. Hwang and K. Yoon, Methods for Multiple AttributeDecision Making, In Multiple Attribute Decision Making,Springer, pp. 58-191, 1981.
[19] K. Shahroudi and H. Rouydel, Using A Multi-CriteriaDecision-Making Approach (ANP-TOPSIS) To EvaluateSuppliers in IranâĂŹs Auto Industry. International Journalof Applied Operational Research-An Open Access Journal,Vol. 2, No. 2, 2012.
[20] Y.A. Solangi, Q. Tan, N.H. Mirjat, G.D. Valasai, M.W.A.Khan and M. Ikram, An Integrated Delphi-AHP and FuzzyTOPSIS Approach toward Ranking and Selection of Renew-able Energy Resources in Pakistan. Processes, Vol. 7, No. 2,pp. 118, 2019.
[21] F. Boran, K. Boran, and T. Menlik, The Evaluation of Re-newable Energy Technologies for Electricity Generation inTurkey Using Intuitionistic Fuzzy TOPSIS. Energy Sources,Part B: Economics, Planning, And Policy, Vol. 7, No. 1, pp.81-90, 2012.
[22] G. Buyukozkan and S. Guleryuz, Fuzzy Multi Criteria De-cision Making Approach for Evaluating Sustainable EnergyTechnology Alternatives. International Journal of Renew-able Energy Sources, Vol. 1, pp. 1–6, 2016.
[23] Y. ÃĞelikbilek and F. TÃijysÃijz, An Integrated GreyBased Multi-Criteria Decision-Making Approach for TheEvaluation of Renewable Energy Sources. Energy, Vol. 115,pp. 1246–1258, 2016.
[24] M. Vafaeipour, S.H. Solfani, M.H.M. Varzandeh, A. De-rakhti and M.K. Eshkalag, Assessment of Regions Pri-ority for Implementation of Solar Projects In Iran: NewApplication Of A Hybrid Multi-Criteria Decision MakingApproach. Energy Conversion and Management, Vol. 86,pp. 653–663, 2014.
[25] M.A. Sheikh, Energy and Renewable Energy Scenario ofPakistan. Renewable and Sustainable Energy Reviews, Vol.14, No. 1, pp. 354–363, 2010.

QUEST RESEARCH JOURNAL, VOL. 17, NO. 1, PP. 6–11, JAN–JUN, 2019 11
[26] M. Amer and T.U. Daim, Selection of Renewable EnergyTechnologies for A Developing County: A Case Of Pakistan.Energy for Sustainable Development, Vol. 15, No. 4, pp.420–435, 2011.
[27] G. Buyukozkan and Y. Karabulut, Energy Project Perfor-mance Evaluation With Sustainability Perspective, Energy,Vol. 119, pp. 549–560, 2017.
[28] O. Demirtas, Evaluating The Best Renewable EnergyTechnology For Sustainable Energy Planning, InternationalJournal of Energy Economics and Policy, Vol. 3, No. 5, pp.23–33, 2013.
[29] Y. Ali, M. Butt, M. Sabir, U. Mumtaz and A. Salman,Selection of Suitable Site in Pakistan For Wind PowerPlant Installation Using Analytic Hierarchy Process (AHP).Journal of Control and Decision, Vol. 5, No. 2, pp. 117–128,2018.
[30] S. Ahmad and R.M. Tahar, Selection of Renewable EnergySources for Sustainable Development of Electricity Gener-ation System Using Analytic Hierarchy Process: A Case ofMalaysia. Renewable Energy, Vol. 63, pp. 458–466, 2014.
[31] A. Mardani, A. Jusoh, E.K. Zavadskas, F. Cavallaro and Z.Khalifah, Sustainable and Renewable Energy: An Overviewof The Application of Multiple Criteria Decision-MakingTechniques and Approaches. Sustainability, Vol. 7, No. 10,pp. 13947–13984, 2015.
[32] I. Dincer, Renewable Energy and Sustainable Develop-ment: A Crucial Review. Renewable and Sustainable En-ergy Reviews, 2000. Vol. 4, No. 2, pp. 157–175, 2000.
[33] A. Evans, V. Strezov, and T.J. Evans, Assessment of Sus-tainability Indicators for Renewable Energy Technologies.Renewable and Sustainable Energy Reviews, Vol. 13, No. 5,pp. 1082-1088, 2009.
[34] D. Chwieduk, Towards Sustainable-Energy Buildings. Ap-plied Energy, Vol. 76, No. 1-3, pp. 211-217, 2003.
[35] S. Ladanai and J. VinterbÃďck, Global Potential of Sus-tainable Biomass for Energy. No. 13, 2009.

QUEST RESEARCH JOURNAL, VOL. 17, NO. 1, PP. 12–20, JAN–JUN, 2019 12
Video Image Detector: A Tool for Finding Similarity in Video Contents
Muhammad Imran Saeed1,*, Intesab Hussain Sadhayo2, Jawaid Shabbir3, Nazar Hussain Phulpoto4
1Department of Computer Science, Nazeer Hussain University Karachi, Pakistan .2Department of Telecom. Engineering, QUEST ,Nawabshah, Pakistan.3Department of Computer Engineering, Sir Syed University of Engineering & Technology, Karachi, Pakistan.4Department of Public Administration, Shah Abdul Latif University, Khairpur, Pakistan.*Corresponding author: [email protected]
Abstract
Nowadays, when a sheer volume of multimedia data is being generated on daily basis, video piracy has become agenuine issue. In this paper, we propose a technique for matching video frames in two (or more) video files. Most ofthe work in this domain has been done on object detection, text detection, and spatio-temporal methods, however,the detection of copyright contents in videos has not been well-addressed. In this paper, we propose a technique todetect the copyright video frames in two or more videos. The given videos can be an advertisement or an especiallyworked-out video file by a journalist which is legally owned by the person who made it. Such a video files/clips canbe matched with certain video streams or files to check if they contain the whole or a part of the given video file.The given video clip is composed of individual frames which could be matched on frame-to-frame basis with other(live) video streams to find the similarity extent between the successive images/frames. The method/technique tobe proposed in this project will be mainly helpful for tracking or identifying the copyright digital video contents(e.g., songs, ads, news, etc) being played/transmitted illegally by a digital channel.
Keywords—Video similarity, content matching, feature matching
F
1 Introduction
Copyright videos can be utilized maliciously byan association with no permission to the video’s
proprietor. The copyright material is more earnestlyto recognize when it is duplicated, i.e., replicating acouple of casings from a video. The majority of pastworks in this context focus on object detection, textdetection, spatio temporal methods etc. and so forth,however, to the best of our knowledge, there is nowork on video-to-video content matching for piracydetection. Some of the video contents transmitted bythe TV channels violate the copyright rules and donot properly acknowledge the videos’ owners. In thisregard, we propose a technique for automatic detectionof the copyright contents in a video. Our proposedtechnique attempts to find the solution of the followingquestions /challenges.
• Finding a specific sequence of images in a videofile.
• Deciding whether direct matching of two videofiles is possible.
ISSN: 2523-0379 (Online), ISSN: 1605-8607 (Print)
• Determining the extent of color variation in apixel to be accepted as identical.
• Determining the threshold/criteria based onthe number of matched frames/images in avideo to decide whether the contents are simi-lar?
Our proposed technique has the ability to workwith following types of videos.
1) Videos with same resolution for pixel-to-pixelcomparisons
2) Videos with different frame rates, data ratesand bit rates.
3) Videos with different resolutions with differ-ent data and bit rates.
In this technique, the movement calculation is uti-lized to satisfy the above parameters. The techniqueworks well on small video contents, however, for largervideos, frames comparison requires huge storage.
Section II characterizes the related work in this do-main. Section III gives an overview of video similaritydetector. Section IV describes the motion detectionalgorithm. Section V depicts the diagram of the entire

QUEST RESEARCH JOURNAL, VOL. 17, NO. 1, PP. 12–20, JAN–JUN, 2019 13
application. Section VI characterizes the operationaloutline in which it finds the comparability substancebetween recordings. Section VII explains the trackingprocess for matching images. Section VIII describesthe experimental results. Section IX concludes thepaper.
2 Related WorkIn [1], the authors propose a technique based onmulti-frame end-to-end learning of image features andcross-frame motion. In some other techniques [2] [3],the authors present a programmed video subtitlingmodel that joins spatio-temporal correlation and pic-ture arrangement by neural network structures basedon long short-term memory. The resulting system isdemonstrated to produce state-of-the-art results inthe standard YouTube captioning benchmark whilealso offering the advantage of localizing the visualconcepts (subjects, verbs, objects), with no groundingsupervision, over space and time. In [4], the authorsaddress the issue of content based action recoveryin video. Given a sentence portraying an action, theundertaking is to recover coordinating clasps from anuntrimmed video. To capture the inherent structurespresent in both text and video, the authors present amultilevel model that coordinates vision and language.First, the authors inject text features early on whengenerating clip proposals to help eliminate unlikelyclips and thus speeding up processing and boostingperformance. Second, to learn a fine-grained similaritymetric for retrieval, the authors use visual featuresto modulate the processing of query sentences at theword level in a recurrent neural network. In [5], theauthors propose a content-based copy detection tech-nique. This approach is based on the contents of mediafiles. In this technique, the main focus is based onresolution, compression and digitization effects duringdetection of content based videos. In [6], the authorsproposed a new motion signature. A different applica-tion of ordinal signature and experimental comparisonof these methods to the color signature is proposed.This technique also matches content-based signaturesto detect copies of videos as opposed to watermark-ing, which relies on inserting a distinct pattern intothe video stream. In the end, the statistical featuresfrom this technique indicate that it has an impressiveperformance.In [7], authors propose another copy detection tech-nique which detects the key frames by using colorhistograms. This technique basically relies on color;however, dissimilarities in color are expected to bereasonable complications in this approach. In [8], the
authors present a comparative study of backgroundsubtraction strategies. Methodologies extending fromstraightforward foundation subtraction with globalthresholding to increasingly complex measurable tech-niques are implemented and tested on various videoswith a ground truth. The objective of this investigationis to provide a strong systematic ground to highlightthe qualities and shortcomings of the most widelyused movement discovery strategies. The techniquesare contrasted based on their vigor with various kindsof video, their memory requirement, and the com-putational exertion they require. In [9], the authorspropose a new algorithm for motion detection. In thisproposed scheme, the moving object is detected byusing a stationary camera within a scene. Anothersuccessive result is to compare the frames on both sideswith the calculation of n consecutive frames. It findsout the percentage area in which the motion exists.In [10], the authors discuss the visual surveillanceintegration system that achieves better performancewith respect to visual tracking in motion detection.However, the information and motion of tracking al-gorithm is combined into an appearance model andis used as a particle filter framework for tracking theobject in subsequent frames. In [11] [12], the authorspropose a simple recursive nonlinear operator, usedalong with a spatial temporal regularization algorithm.By using a static camera, these motions are performedby approximating the fixed part of the videos. Theextensive range of motion is detected in a complexscene with different time constants.Most of the work in this domain is done on back-ground subtraction calculation which is focused ondistinguishing an item in one frame to another frame.During the video playback, it is hard to identify mov-ing objects from one video to another video. In [13], theauthors present an algorithm for identifying movingobjects from a static scene based on frame difference.Firstly, the first frame is captured through the staticcamera and the successive frames are captured atcustomary interims. Secondly, the absolute differenceis calculated between the consecutive frames and thedifference image is stored in the system. In [14], theauthors present a survey on the most recent strategiesfor moving object detection in video sequences cap-tured by a moving camera.
3 Video Similarity DetectorVideo identification is a technique that discovers thoseedges that are coordinated with one video into an-other video. This technique contrasts with the currentmotion picture outlines and the prior casings or with

QUEST RESEARCH JOURNAL, VOL. 17, NO. 1, PP. 12–20, JAN–JUN, 2019 14
something that will be called as foundation. If anobject in the frame is moving slickly, lesser variationis obtained by the smaller predefined threshold. Thiscalculation additionally matches both the video out-lines one by one amid the running video streams. Amidcorrelation of recordings, the entire moving edge isidentified autonomously by its movement speed.
4 Motion Detection AlgorithmMotion detection [9] is the primary procedure in theabstraction of data concerning moving entities main-taining in efficient regions such as tracking, cataloging,acknowledging, etc. The background of video framesare calculated by taking means of n successive framesand matching them with the existing frames using thesub blocks of the matching-based scheme.BS techniques take the notion to experiential videosequence. Image I is made up of a static backgroundB in front of which stirring entities are observed. Bythe observation of every moving object that is madeup of color distribution different from the one in B, BSmethods can be applied by the following formula,
Xt(s) ={1, if d(I(s,t), Bs) > τ
0, otherwise (1)
where τ is a threshold, Xt(s) is the motion label field attime t, d is the distance between I(s,t) and pixels, andBs is the background model at pixels.The reasonable way to model the background B isto conclude by a single gray scale color image voidof moving objects [10]. By the instruction of handlingwith brightness changes and background adjustments,it can be iteratively updated as follows,
B(s, t+ 1) = (1− α)B(s, t) + αI(s, t) (2)
where α is a constant whose value ranges between 0and 1. In the case of mean method, background is themean or average of the earlier frames and mathemati-cally it is written by the following formulae.
B(x, y, t) = 1n
(n−1)∑(i=0)
(x, y, t− 1) (3)
|(x, y, t)−B(x, y, t)| > Th (4)
The background model is subtracted from the n previ-ous or existing frames. The threshold value used in thistechnique checks if the value of pixel is greater than theother pixel, in which case it is treated as a foregroundpixel. Otherwise, if a pixel’s value is smaller than thethreshold value, it becomes a background pixel.
5 Overview of the ApplicationA given video clip which is required to be monitoredin another video can be a notice or a particularlyworked-out video document by a columnist which islegitimately claimed by the individual who made it.Such a video records/clasps can be coordinated withcertain video streams to check in the event that theycontain the entire or a piece of the given video. Therecordings might be songs and ads, etc.We initialize both the videos and start the trackingprocess. If the frames are found, they are stored intothe resultant directory. This comparison will run tillit completes the last nth frame to be matched withthe whole video. If the initial frame is not matched,the recognition procedure analyzes the whole movingframe independent of its motion speed. Frames andbackground are intended to be calculated by takingmean of n successive frames and comparing themwith the existing frame. The subsequent frames usethe threshhold values. These qualities demonstratethe variation of colors which is increased up to 10%,whereas, if the frames are not compared during de-tection process, then the comparison process itselfcontinues and checks the next frame to compare withthe previous or current frame. Figure 1 gives the logicalview of this application.
6 Finding Similarity in Video ContentsTo determine the similarity between two or morevideos, some small or large videos are collectedthrough different media programs. First video is con-trasted and the second video in the given time span canbe chosen from the client’s decision. Figure 2 depictsthe overall framework of our application.
Stage 1:Choose two videos that have diverse timeframes and begin correlation.
Stage 2:Two directories are created automaticallybefore the start of the comparison pro-cess. First directory is made when thevideo document is stacked into the videostream. This directory is named as “Re-sulting Matched Frame Folder”.
Stage 3:The second directory is created and namedas “Advertisement Image”. The frames areseparated and stored into this directory.We wait until the application completes itsprocedure.
Stage 4:In Figure 2, two cases are conceivable dur-ing the video matching phase. The firstframe of the advertisement video clip ismatched with the first frame of the videofile. If the frame is matched, it is stored into

QUEST RESEARCH JOURNAL, VOL. 17, NO. 1, PP. 12–20, JAN–JUN, 2019 15
Fig. 1: Logical view of this application (operationalmodel)
the directory “Resulting Matched FrameFolder”.
Step 5: After consummation, the coordinated cas-ing will likewise check amid or after thecorrelation.
Step 6: After completion, the matched frame willalso check during or after the comparison.This application uses the motion detectiontechnique in which the examination reliesupon the shading variety and blend of dif-ferent calculations in which the comparisonrelies upon the variety of changing naturebetween videos and blend of different cal-culations.
7 Tracking Process for Matching ImagesThe accompanying procedure shows the trackingframes between two recorded videos. Figure 3 demon-strates the tracking process while the threshold values
Fig. 2: Flow Chart for finding similarity in videocontents
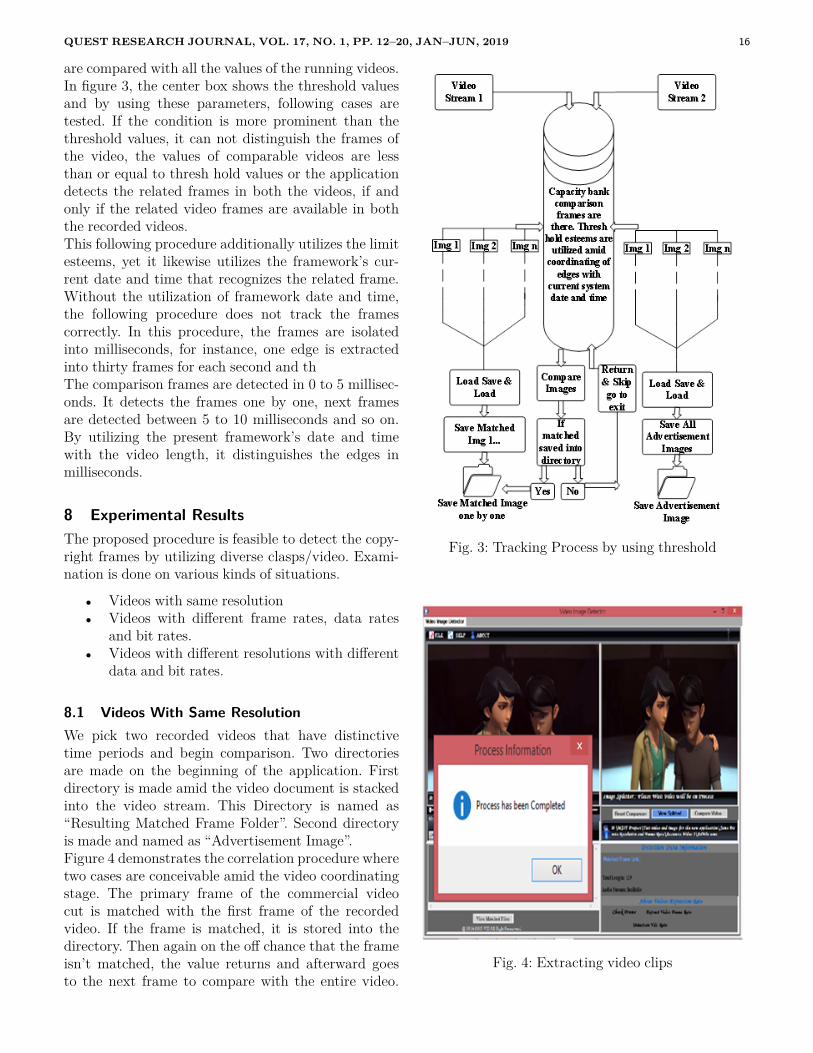
QUEST RESEARCH JOURNAL, VOL. 17, NO. 1, PP. 12–20, JAN–JUN, 2019 16
are compared with all the values of the running videos.In figure 3, the center box shows the threshold valuesand by using these parameters, following cases aretested. If the condition is more prominent than thethreshold values, it can not distinguish the frames ofthe video, the values of comparable videos are lessthan or equal to thresh hold values or the applicationdetects the related frames in both the videos, if andonly if the related video frames are available in boththe recorded videos.This following procedure additionally utilizes the limitesteems, yet it likewise utilizes the framework’s cur-rent date and time that recognizes the related frame.Without the utilization of framework date and time,the following procedure does not track the framescorrectly. In this procedure, the frames are isolatedinto milliseconds, for instance, one edge is extractedinto thirty frames for each second and thThe comparison frames are detected in 0 to 5 millisec-onds. It detects the frames one by one, next framesare detected between 5 to 10 milliseconds and so on.By utilizing the present framework’s date and timewith the video length, it distinguishes the edges inmilliseconds.
8 Experimental ResultsThe proposed procedure is feasible to detect the copy-right frames by utilizing diverse clasps/video. Exami-nation is done on various kinds of situations.
• Videos with same resolution• Videos with different frame rates, data rates
and bit rates.• Videos with different resolutions with different
data and bit rates.
8.1 Videos With Same ResolutionWe pick two recorded videos that have distinctivetime periods and begin comparison. Two directoriesare made on the beginning of the application. Firstdirectory is made amid the video document is stackedinto the video stream. This Directory is named as“Resulting Matched Frame Folder”. Second directoryis made and named as “Advertisement Image”.Figure 4 demonstrates the correlation procedure wheretwo cases are conceivable amid the video coordinatingstage. The primary frame of the commercial videocut is matched with the first frame of the recordedvideo. If the frame is matched, it is stored into thedirectory. Then again on the off chance that the frameisn’t matched, the value returns and afterward goesto the next frame to compare with the entire video.
Fig. 3: Tracking Process by using threshold
Fig. 4: Extracting video clips

QUEST RESEARCH JOURNAL, VOL. 17, NO. 1, PP. 12–20, JAN–JUN, 2019 17
Fig. 5: Comparison process
Table 1 shows the original video data. Note that theresolution, data, frame rate and total bit rate of boththe videos have the same data but their duration timesare different from one another. Figure 5 demonstratesthe correlation procedure in which the frames of avideo files are coordinated with each other. The datais stored with frame numbers and is made availablein the application. It can be seen in Figure 6(a) and6(b) that the advertisement video clip are comparedand the length, frame width, height and other relatedcharacteristics of both the videos are matched. Dur-ing the comparison of both videos, the frames aredetected and the parameters in this figure show thatthe contents of the video are copied. Figure 7 focuseson both the directories of the matched video frame.After comparison, the outcome among Adframe 0and the matched frame TransPrimeVideo 0 has same
(a) Advertisement video (b) Full video with adver-tisement clip
Fig. 6: Videos with similar resolution
properties. Just a single frame of both the directoriesis pronounced to exhibit the properties after matching.Table 2 shows the results of the comparison. Out of165 frames, the number of matched frames are 14. Theresolution of both the videos is 720x480. The framerates of both the videos is 23 frames/second, and theirbit rate are 1943 kbps.
8.2 Video With Different Frame, Data & BitRatesWe also test different resolution, frame rates and bitrates. The threshold values must be higher or like theperfect qualities. In the case when the threshold ishigher than the other values during video comparison,the resultant is not identified and the procedure willproceed until the next frame is matched. Figure 8shows video comparison of different length, date rate,and bit rate. Figure 9 delineates that these edges aredistinguished effectively. Figure 10 shows that theseframes are coordinated by utilizing diverse data rateand bit rate. Hence, our proposed technique distin-guishes the video frames with different date rate andbit rate. Figure 10 also shows the matched (copyright)frames of the videos. Table 3 shows that out of 249frames, the numbers of matched frames are 9. The

QUEST RESEARCH JOURNAL, VOL. 17, NO. 1, PP. 12–20, JAN–JUN, 2019 18
Original Video DataVideo 1 (Advert. video clip) Video 2 ( Normal video with Advert)
Original Video Original VideoVideo Resolution 720 * 480 Video Resolution 720 * 480VideoData rates 1503 kbps Video
Data rates 1503 kbps
VideoFrame rates 23 frames /sec Video
Frame rates 23 frames /sec
Total bit rates 1943 Kbps Total bit rates 1943 Kbps
TABLE 1: Video resolution, data, frame and total bit rate
Matched Image Data b/w two videosAdvertisement video clip Normal video with Advert
Experimental ResultsNo of original matching frames 165 No of frames matched 14Video Resolution 720 * 480 Video Resolution 720 * 480VideoData rates 1503 kbps Video
Data rates 1503 kbps
VideoFrame rates 23 frames /sec Video
Frame rates 23 frames /sec
Total bit rates 1943 Kbps Total bit rates 1943 Kbps
TABLE 2: Total 165 frames 80 frames are similar, No of matched frames are 4.
(a) Advertisement video (b) Full video with adver-tisement clip
Fig. 7: Advertisement & Matched frame properties
(a) Advertisement video (b) Full video with adver-tisement clip
Fig. 8: Video Frame detection rate

QUEST RESEARCH JOURNAL, VOL. 17, NO. 1, PP. 12–20, JAN–JUN, 2019 19
Fig. 9: Frames are detected & displayed in the direc-tory
Fig. 10: Resultant Frames
resolution of both the videos is 640x480. The framerate of both the videos is 30 frames/second. The bitrates of the two videos are 811 kbps and 1203 kbps,respectively.
8.3 Video With Different Resolutions, Data Rate& Bit Rates
In the third scenario, the experiment is done on dif-ferent resolutions, data and bit rates. The outcomeappeared in Figure 11(a) and 11(b) demonstrates thatthe two videos are different and there bit rates areentirely different with one another. The comparisonbetween the two videos begins from different param-eters mentioned above. In this figure, the conceivableresults may be 8-10 frames.
References[1] Zhu, Xizhou, Jifeng Dai, Lu Yuan, and Yichen Wei. “To-
wards high performance video object detection.”, In Pro-ceedings of the IEEE Conference on Computer Vision andPattern Recognition, pp. 7210–7218. 2018.
[2] Zanfir, Mihai, Elisabeta Marinoiu, and Cristian Sminchis-escu. “Spatio-temporal attention models for grounded videocaptioning.”, In asian conference on computer vision, pp.104–119. Springer, Cham, 2016.
[3] Guo, Dashan, Wei Li, and Xiangzhong Fang. “Capturingtemporal structures for video captioning by spatio-temporalcontexts and channel attention mechanism.”, Neural Pro-cessing Letters 46, no. 1 (2017): 313-328.
[4] Xu, Huijuan & He, Kun & Sigal, Leonid & Sclaroff, Stan& Saenko, Kate.“Text-to-Clip Video Retrieval with EarlyFusion and Re-Captioning.”, ArXiv, 2018.
[5] Sand, Peter, and Seth Teller. “Video matching.”, In ACMTransactions on Graphics (TOG), vol. 23, no. 3, pp. 592-599. 2004.
[6] Hampapur, Arun, and Ruud M. Bolle. “Comparison OfDistance Measures For Video Copy Detection.”, In ICME,pp. 737-740. 2001.
[7] Hampapur, Arun, Kiho Hyun, and Ruud M. Bolle. “Com-parison of sequence matching techniques for video copydetection.”, In Storage and Retrieval for Media Databases,vol. 4676, pp. 194-202. International Society for Optics andPhotonics, 2001.
[8] Benezeth, Yannick, Pierre-Marc Jodoin, Bruno Emile,HÃľlÃĺne Laurent, and Christophe Rosenberger. “Compar-ative study of background subtraction algorithms.”, Journalof Electronic Imaging, vol. 19, no. 3, 2010.
[9] Kohli, Kamna, and Jatinder Pal Singh. “Motion DetectionAlgorithm.”, International Journal of Computer Science &Applications (TIJCSA), vol. 1, no. 12, pp.1-5, 2013.
[10] Abdelkader, Mohamed F., Rama Chellappa, QinfenZheng, and Alex L. Chan. “IEEE International Conferenceon, Integrated motion detection and tracking for visualsurveillance.”, pp. 28-28, 2006.
[11] Manzanera, Antoine, and Julien C. Richefeu. “A newmotion detection Algorith based on ÎčâĂŞÎŤ backgroundestimation.”, Pattern Recognition Letters, vol. 28, no. 3,pp.320- 328, 2007.
[12] Deori, Barga, and Dalton Meitei Thounaojam. “A surveyon moving objects Tracking in video.”, International Journalon Information Theory (IJIT), vol. 3, no. 3, pp.1-16, 2014.
[13] Singla, Nishu. “Motion detection based on frame differencemethod.”International Journal of Information & Computa-tion Technology, vol. 4, no. 15, pp. 1559–1565, 2014.
[14] Yazdi, Mehran, and Thierry Bouwmans. “New trends onmoving object detection in video images captured by amoving camera: A survey.”, Computer Science Review, vol.28, pp. 157–177, 2018.

QUEST RESEARCH JOURNAL, VOL. 17, NO. 1, PP. 12–20, JAN–JUN, 2019 20
Original video dataVideo 1 (Advertisement video clip) Video 2 ( Normal video with Advert)
Original Video Original Video
Video Resolution 640 * 480 VideoResolution 640 * 480
VideoData rates 683 kbps Video
Data rates 1079 kbps
VideoFrame rates 30 frames /sec Video
Frame rates 23 frames /sec
Total bitrates 811 Kbps Total bit
rates 1203 Kbps
TABLE 3: Total 249 frames, 73 frames are similar, No of matched frms 9
(a) Different Resolution, Frame rate, bit rate of a FullVideo
(b) Full video with advertisement clip
Fig. 11: Video with different resolutions, data rate & bit rates

QUEST RESEARCH JOURNAL, VOL. 17, NO. 1, PP. 21–27, JAN–JUN, 2019 21
Spectrum Sensing in ISM Band Using Cognitive Radio
Najamuddin Sohu1,*, Nawaz Ali Zardari2, Mushtaque Ahmed Rahu3, Azeem Ayaz Mirani4, Nazar Hus-sain Phulpoto5
1Administration Department, SBBU, Nawabshah, Pakistan.2Department of Telecommunication Engineering, QUEST, Nawabshah, Pakistan.3Education & Literacy Department, Nawabshah, Pakistan.4Department of Computer Science, SBBU, Nawabshah, Pakistan.5Department of Public Administration, Shah Abdul Latif University, Khairpur, Pakistan.*Corresponding author: [email protected]
Abstract
Wireless communication is one of the essential parts of contemporary technology. Although, the popularity of thewireless communication is growing day by day, the quality and data transfer rate is limited and wireless spectrumneeds to be focused more clearly. The telecommunication workers and internet service providers are facing problemof the wireless spectrum in case of the large amount of data transfer rate with respective to the need of customer.The Cognitive Radio (CR) shortage has gradually inclined towards progress. CR ensures the efficient usage of under-utilized spectrum. Spectrum sensing performs the key functionality in identifying the free gaps in the spectrum.The aim of this research is to validate the under-utilization of unlicensed ISM band in the vicinity of Nawabshah. Aspectrum analyzer is used to collect the raw signal data. The study of the free space in the spectrum is done withdifferent techniques such as cycle stationary, feature detection, wavelet based edge detection and energy detection.The performance of all three techniques are compared and the optimum technique is suggested. Our in-depthanalysis presented in this paper provides a critical review of the spectrum sensing methods and contract spectrumsensing.
Keywords—Spectrum sensing, Data Acquisition, Probability.
F
1 Introduction
W ireless communication spectrum needs to beutilized as efficiently as possible in order to
cope with the modern challenges. We have to interruptdown the spectrum carefully and reason assumptionsin order to assist us in developing spectrum operationprepare mo e frequency spectrum are widely used intelecommunication system for the efficient and rapidcommunication over network. This is important tomake standard frequency range of spectrum that is 30Hz to 300 GHz. In telecommunication system, a spec-trum is a concept which is used to refer to some timefrequency band. It is actually a specific frequency bandwhich is called spectrum. This spectrum is dividedinto low frequency rang and high frequency range.However, each frequency band has certain boundariesusually called upper and lower limit.An electromagnetic radio spectrum can be reflected asa feature asset. Radio spectrum is deployed with the
ISSN: 2523-0379 (Online), ISSN: 1605-8607 (Print)
help of different exceptional receivers and transmit-ters which are operated through means of numerouscontrolling government and agencies. Cognitive Radio(CR) is considered one of the candidate solutions forthe spectrum practice problem at some distance likespectrum sensing strategies. Spectrum sensing takesdual method. Initially, accessible spectrum is sensingthen its miles allocated to non-adjusted clients foreffective use. The underutilized frequency sub-bandsare generally referred to as “white spaces” or “spec-trum holes”. Spectrum gap could be characterized asa band of frequencies. It can not be used through anoverhauled patron at a specific period and particulargeographical position. There are a few specific mea-surements of spectrum detecting inclusive of code, at-titude, space (geographical place), time and frequency.Significant number of spectrum sensing proceduresexist to discover spectrum holes. The concept of basicspectrum frequency management and finding holes inspectrum is one crucial part of research.

QUEST RESEARCH JOURNAL, VOL. 17, NO. 1, PP. 21–27, JAN–JUN, 2019 22
The study presented in this paper shows the use ofspectrum sensing by electricity detection and wavelettransformation set of rules utilizing GNU Radio andGW-Instek Spectrum Analyzer with the aid of fre-quency and time measurements. The most capablemethod of analysis of all reachable spectrum sensingmethods is displayed. Spectrum sensing of the CR isdeliberated as the high component of spectrum. Thedifficulties in the frequency spectrum can be found viaunused frequency bands.
2 MotivationCognitive radio is the developing innovation for sup-porting element range access. To identify the close-ness of the primary clients in an authorized range isconsidered as an important issue for CR. In Cognitiveradio, execution of the range detecting relies upon thedetecting time and the combination plan. These plansare utilized when agreeable detecting is connected. Inthis proposition, range detecting systems, for example,vitality identification, coordinated separating location,cyclo-stationary recognition and waveform based de-tecting techniques are examined. Vitality recognitionis most generally utilized as a part of neighborhoodrange detecting. This case study provides an outlineabout examination between various strategies. It alsohighlights the better technique for range detecting.
3 Related WorkThe study of software defined radio and CR technol-ogy is an important aspect of research community.For instance, GNU radio is focused in terms of theCR [8]. Relevant literature demonstrates a number oftechniques addressing the diverse parts of spectrumsensing and CR. Majority of continuous level regulateddiscussion is focused on the appropriate spectrumsensing. Procedures for CR, channel distribution andtransmission power taking care of Physical (PHY) andMAC layer usage [9]. The important factor for anyspectrum is to detect the underutilized bandwidth [10].Consequently, a number of phases are accessible forthe usage of CR as a SDR. One of them is Open source(SCA) usage Embedded (OSSIE) in [11]. The OSSIEsupports the open source facility for the radio suitewhich can support SDR and CR operations. Differentstages incorporate large power SDR (HPSDR) [25]and Flex Radio [26]. Nearby few distinct strategieswhich can be reflected as contrasting option towardsrange detecting. Among these strategies is cognizanceempowering pilot channel (CPC) [6]. As indicatedby CPC, the database of authentic manipulators toidentify and use on the screen recognition spectrum is
created by making next channel and spreading spec-trum opportunities in auspicious way. Be that as itmay, this results in extra infrastructure and utilizationof alternative network referred to as CPC. That is nota better way to deal with spectrum shortage, as thisresults in additional overhead in radio supply.
4 System MethodologyIn this study, quantitative and qualitative experimen-tal and analysis procedures have been used to investi-gate the research problem in concern. We started workwith survey literature of CR. Initially, the detailedstudy of cognitive radio pattern was conducted. Sub-sequently, after getting familiar with working values ofCRs, we narrowed down the possibility to more precisearea of concern, i.e. spectrum sensing. Spectrum sens-ing was selected for the reason of its vital role in mak-ing CR feasible. Additionally, sophisticated examina-tion was conceded out on spectrum sensing to acquireinformation about existing state-of-the-art research inthe capacity of spectrum sensing. On the basis of theinformation collected over a period of time, we demar-cated research questions of our study. We prepareddeductive and statistical hypothesis to address theresearch question. To reinforce our defined hypothesisand to inspire our answer, we first assumed that thereare some white spaces in congested 2.4 GHz ISMband. The most crucial part of any CR is to discoverunderutilized bandwidth in obtainable radio spectrumin an efficient way. The underutilized bandwidth orspectrum holes should be created with least data aboutspectrum as it is challenging to contemplate entiremeasurements of radio spectrum, however, observingspectrum for spectrum holes. Research about entireavailable spectrum sensing practices was conceded outin terms of qualitative analysis. For experimental andquantitative exploration, we tried a GW Instek Spec-trum Analyzer for sensing purpose and MATLAB fordata analysis. Firstly, we collected signal informationusing Spectrum Analyzer for 2.4GHz ISM band. Aftercollecting the real time data, we employed algorithmsover MATLAB and collected outcomes in the form ofraw data comprising of FFT values of spectrum in theorder as shown in Figure 1. The information collectedin real time was prescribed in tables so that outcomescould be observed in graphical manner. One of the keychores was to show the data in a graphical way sothat all three measurements, i.e., gain, time, frequencycould be taken under consideration at the same inter-val. For this persistence, we developed spectrogramsand 3D-plots to acquire reasonable appreciative resultsand to confirm outcomes in contrast to hypothesis in

QUEST RESEARCH JOURNAL, VOL. 17, NO. 1, PP. 21–27, JAN–JUN, 2019 23
Fig. 1: Research Methodology
concern. In Figure 1, an antenna is a device (normallysteel) for sending or receiving electromagnetic waves.In transmission, a radio transmitter applies a radiofrequency to the terminals of the antenna and thenthe antenna radiates the strength from the antennaas electromagnetic waves. In reception, an antennaintercepts some of the electricity of an electromagneticwave to provide a radio frequency at its terminals thatis implemented to a receiver a good way to be amplifiedand demodulated. In some cases, the equal antennacan be used for each transmitting and receiving. A2.4 GHz Antenna series covers 2300-2600 MHz bandapplications for IEEE 802.16 and 802.11 [12][13]. Ananalyzer is a device that analyses the given data.It examines in element the shape of the given factsand tries to discover styles and relationships betweencomponents of the records. An analyzer may be apiece of hardware or a software program applicationgoing for walks on a computer. A spectrum (pluralspectra or spectrums) is a circumstance that is notalways confined to a selected set of values but canvary infinitely within a continuum [14]. The phrase wasfirst used scientifically inside the discipline of opticsto explain the rainbow of colors in visible mild whenseparated the use of a prism. It miles the procedureof sampling signals that degree actual global physicalconditions and converting the ensuing samples intodigital numeric values that can be manipulated withthe aid of a computer. The records acquisition systems,abbreviated as DAS or DAQ, commonly convert ana-log wave forms into virtual values for processing. Thecomponents of statistics acquisition systems encom-pass Sensors to transform bodily parameters to electricalerts, sign conditioning circuitry to transform sensorsignals right into a shape that can be transformedto digital values, and analog-to-virtual converters toconvert conditioned sensor indicators to digital values.Statistics acquisition applications are generally con-trolled by means of software applications advancedin the use of numerous popular reason programminglanguages including meeting, primary, C, C++, C#,
Fig. 2: Cognitive Cycle
Fortran, Java, Lab VIEW, Lisp, Pascal, and manyothers.There are also open-source software programs provid-ing all the important tools to acquire information froma specific hardware equipment. This equipment comesfrom the scientific community where complicated testrequires fast, bendy and adaptable software. Theseprograms are usually custom suit, however, greaterstandard DAQ package like the maximum integratedfacts acquisition device may be easily tailor-made andis utilized in numerous physics experiments. There arefour main steps in cognitive cycle, as shown in Figure2 [15], by which we acquired signal data. The digitalimplementations provide more flexibility by means ofspending FFT-based totally spectral approximations.Figure 3 displays the framework for virtual executionof a power indicator [4]. Electricity detector basedtechnique is the best corporate technique of spectrumsensing due to small computational overhead. Whenprimary person signal is indefinite or receiver can notacquire appropriate statistics about primary sign user,a power detection technique is used. This technique isideal for identifying any indefinite zero-mean collectionsignals and must be imposed to cognitive radios (CRs).Procedure stream of energy detector in the receivedsignal is passed by ADC after measuring the FFT con-stant form and average of observational interval. In or-der to decide primary user occurrence/non-occurrence,the output is compared to the predefined initial value.Figure 4 shows simulation the steps using MATLAB.
These steps are defined as under.
• Initialization- After the completion of allbasic configurations, carrier frequency bands,message frequency and sampling are initializedfor the user.

QUEST RESEARCH JOURNAL, VOL. 17, NO. 1, PP. 21–27, JAN–JUN, 2019 24
Fig. 3: Digital implementation of an energy detector
Fig. 4: Simulation Set up using MATLAB
• Modulation- The process of modulating dataover elective frequency band by AM.
• Adder- Sum of totally modulated signals togenerate the transmitting signal
• Periodogram- Estimation of power spectraldensity of conventional signal.
• Vacant Slot Allocation- Different Usersare allocated to first spectral hole while itstretches.
• Emptying a slot- Ask a user to vacant theparticular slot if all slots are busy.
• Addition of noise- The addition of noise isthe amount which is to be added. .
• Attenuation- The status of the distorted sig-nals which directly affects the single strength.
5 Results and Discussion
The data of spectrum, collected by using GW Instek,is stored in csv files. MATLAB tool can be an effectivetool to import all these files for the processing. Al-gorithms and complete results are designed/generatedin MATLAB 2014. The obtained results show the useof 2.4 GHz Wi-Fi channels in QUEST Nawabshah andalso show the free spectrum holes and channels as well.The results are obtained by the implementation of 2.4GHz center frequency. Further, it is evaluated for theresults that vary from different spectral consequencesbelow in detail.Figure 5 illustrates the consequences achieved for 2.4GHz ISM band with the use of frequency of 50 MHz,i.e. signal gain across ISM band in stages of 50 MHzstarting from 2.3 GHz and completion at 2.550 GHz.Purpose of this graph is to monitor the improvement ofthe channel under observation. However, exact channelutilization of Wi-Fi (802.11) cannot be observed.Spectrogram in Figure 66 shows the relationship be-tween the time frequency affiliations to advance. Inthis regard, the spectral representation of signal withrespect to the time is called spectrogram. This depictsthe variations in spectral density of signal with respectto time. The highlighted bar in the graph shows vari-ous levels of loss and gain of energy values.In order to find the availability of spectrum at thepredefined threshold, the comparison of the color withtime and frequency alliance can be analyzed. Theinstance of time and frequency spectrum holes arerepresented in red colors in this spectrogram. Here, wecan simply observe channel operation in the QUESTWLAN. Each stem value in the spectrogram showsoutcomes collected throughout distinct cycle of datafor every step of frequency. The utilization of channelfor CR can be exploited at the channel frequenciesfor which we have completely obtained data at certaininstant of period t. The spectrogram shown in Figure 6precisely depicts the spectrum holes in the form of redtiled apparent in existence of further shades showingdiverse gain values of energy spectrum.Results of energy detection, Cyclostationary FeatureDetection (CFD) and wavelet based detection basedon the possibility of primary user detection, possibilityof miss detection and the possibility of false detectionhas been compared. In this discussion, we refer to Hoas null hypothesis. Ho shows that the Primary User(PU) has not occupied the channel and it can beutilized by a Secondary User (SU). H1 is the alternatehypothesis that shows that the channel is engaged bythe PU.

QUEST RESEARCH JOURNAL, VOL. 17, NO. 1, PP. 21–27, JAN–JUN, 2019 25
5.1 Probability of False DetectionFalse alarm is a condition when PU is detected evenwhen a free channel is essentially free. In other words,we can say H1 is declared under Ho hypothesis. Thisresults in the wastage of channel resource. Therefore,the probability of false detection should as low aspossible. Figure 7 shows the probability of false alarmdetection with respect to SNR. It can be observedthat the wavelet based detection outperforms the othertwo methods. Energy detection, despite being lesscomplex, shows worst performance in terms of falsedetection.
5.2 Probability of DetectionIt is possible that the primary user is occupying chan-nel and it is detected as such. Ideally, the probabilityof detection can be as much probable for lower SNR aspossible.Figure 8 depicts the comparison of probability ofdetection of all three sensing techniques under con-sideration. It can be viewed that the probability ofdetection of wavelet detection is greater than rest ofthe techniques at lower SNR. Whereas, the energydetection requires more SNR for better probability ofdetection.
5.3 Probability of Miss DetectionMiss detection occurs when the channel is employedby PU, but it is detected to be idle. Miss detectionresults in the interference to the communication of PU.It is, therefore, the probability of declaring Ho underH1 hypothesis. For a better CR system, miss detectionshould be minimum.Figure 9 shows the results of miss detection. In thiscase again, the wavelet based detection performs bet-ter at sufficiently lower SNR as compare to the Cy-clostationary feature detection and energy detection.
6 ConclusionThe study presented in this paper gave a comprehen-sive detail regarding implementation of energy detec-tion, cyclostationary feature detection method, andwavelet based spectrum sensing. These three spec-trum sensing techniques were analyzed for variousSNR values. To find the spectrum holes in 2.4 GHzallocated ISM band, different number of simulationswere performed. The statistics data were collectedby using the GW-instek. The final qualitative inves-tigation of the sensing techniques indicated that thewavelet based method is most consistent and accurate
Fig. 5: Sensed signals bandwidth at 2.4GHz
Fig. 6: Spectrogram of sensed signal
technique for spectrum sensing as it showed optimumresults for primary User detection, miss detectionand false detection for the lower SNR values. Thematerial collected in the form of FFT bins, provedto be an effective technique of collecting data forspectrum sensing as it needs some signal processingprocedures. Other work is implemented in GW-Instek.The obtained results showed that this is possible todiscover an underutilized bandwidth in the spectrumapart from having earlier understanding of PU andSU. However, the Spectrograms, frequently utilizedin acoustics and astronomy, can be used to detectspectrum holes as displayed in outcome by drawingspectrograms. The threshold level for few particular

QUEST RESEARCH JOURNAL, VOL. 17, NO. 1, PP. 21–27, JAN–JUN, 2019 26
Fig. 7: Plot of Probability of False Detection Vs SNR
Fig. 8: Plot of Probability of Detection Vs SNR
Fig. 9: Plot of Probability of Miss Detection Vs SNR
spectrums of frequencies consists of some features likereceiver sensitivity and the number of energy transmit-ting/receiving nodes and dimensions occupied underconsideration.Proposed Research could be enhanced by performingsimilar experimentation for licensed frequency bands.The results obtained could be matched with ISM bandresults to acquire good understanding of an area ofstudy. In order to find the availability of spectrum atthe predefined threshold, the comparison of the colorwith time and frequency alliance can be analyzed.
References
[1] K. B. Letaief and W. Zhang, “Cooperative Spectrum Sens-ing”, In Cognitive Wireless Communication Networks, E.Hossain and V. Bhargava, Eds., ed Boston, MA: SpringerUS, pp. 115–138, 2007.
[2] J. Mitola and G. Q. Maguire, “Cognitive radio: makingsoftware radios more personal”, IEEE personal communi-cations, vol. 6, pp. 13–18, 1999.
[3] H. Urkowitz, “Energy detection of unknown deterministicsignals”, Proceedings of the IEEE, vol. 55, pp. 523–531,1967.
[4] M. A. Sarijari, A. Marwanto, N. Fisal, S. K. S. Yusof, R. A.Rashid, and M. H. Satria, “Energy detection sensing basedon GNU radio and USRP: An analysis study”, In IEEE9th Malaysia International Conference on Communications(MICC), pp. 338–342, 2009.
[5] S. Spectrum, “Spectrum Reports.”Available at:http://www.sharedspectrum.com/papers/spectrum-reports/
[6] T. Bisseling, J. L. Dangl, and P. Schulze-Lefert,“Next-generation communication”, Science, vol. 324, pp. 691–691,2009.
[7] J. Mitola, “Software radios: Survey, critical evaluation andfuture directions”, IEEE Aerospace and Electronic SystemsMagazine, vol. 8, pp. 25–36, 1993.
[8] T. Yucek and H. Arslan. “A survey of spectrum sensingalgorithms for cognitive radio applications”, IEEE commu-nications surveys & tutorials, vol. 11, pp. 116–130, 2009.
[9] B. Shent, L. Huang, C. Zhao, Z. Zhou, and K. Kwak. “En-ergy detection based spectrum sensing for cognitive radiosin noise of uncertain power”, In International Symposiumon Communications and Information Technologies (ISCIT2008), pp. 628–633, 2008.
[10] D. Cabric, A. Tkachenko, and R. W. Brodersen. “Experi-mental study of spectrum sensing based on energy detectionand network cooperation”, In Proceedings of the first inter-national workshop on Technology and policy for accessingspectrum, p. 12, 2006.
[11] J. Snyder, B. McNair, S. Edwards, and C. Dietrich.“OSSIE: An open source software defined radio platformfor education and research”, In International conference onfrontiers in education: computer science and computer engi-neering (FECSâĂŹ11). Computer engineering and appliedcomputing. Las Vegas, p. 1, 2011.
[12] Y.-L. Kuo and K.-L. Wong. “Printed double-T monopoleantenna for 2.4/5.2 GHz dual-band WLAN operations”,IEEE Transactions on Antennas and Propagation, vol. 51,pp. 2187–2192, 2003.

QUEST RESEARCH JOURNAL, VOL. 17, NO. 1, PP. 21–27, JAN–JUN, 2019 27
[13] C. Soras, M. Karaboikis, G. Tsachtsiris, and V. Makios.“Analysis and design of an inverted-F antenna printed on aPCMCIA card for the 2.4 GHz ISM band”, IEEE Antennasand Propagation Magazine, vol. 44, pp. 37–44, 2002.
[14] Cabric, Danijela, Shridhar Mubaraq Mishra, and RobertW. Brodersen, “Implementation issues in spectrum sensingfor cognitive radios”, In Conference Record of the Thirty-Eighth Asilomar Conference on Signals, Systems and Com-puters, 2004., vol. 1, pp. 772–776. IEEE, 2004.
[15] Tandra, Rahul, and Anant Sahai. “SNR walls for signaldetection”, IEEE Journal of selected topics in Signal Pro-cessing 2, no. 1, pp. 4–17, 2008.
[16] Kolodzy, Paul, and Interference Avoidance. “Spectrum pol-icy task force”, Federal Commun. Comm., Washington, DC,Rep. ET Docket 40, no. 4, pp. 147–158, 2002.
[17] Haykin, Simon, David J. Thomson, and Jeffrey H. Reed.“Spectrum sensing for cognitive radio”, Proceedings of theIEEE 97, no. 5, pp. 849–877, 2009.
[18] Bagwari, Ashish, and Brahmjit Singh. “Comparative per-formance evaluation of spectrum sensing techniques for cog-nitive radio networks”, In 2012 Fourth International Con-ference on Computational Intelligence and CommunicationNetworks, pp. 98–105. IEEE, 2012.
[19] Sharma, N., et. al. “Implementation of Cognitive RadiosUsing MATLAB”, International Journal of Recent ResearchAspects ISSN: 2349–7688, Vol. 3,Issue 1, pp. 59–62, 2016.
[20] Manikandan, G., N. Mathavan, M. Suresh, M. Paramisi-van, and V. Lavanya. “Cognitive radio spectrum sensingtechniquesâĂŞa survey”, Int. J. Adv. Eng. Technol. 3, no.2, pp. 48-52, 2016.
[21] Raju, S., et. al., “Optimization of Cooperative SpectrumSensing and Network Lifetime Maximization of CognitiveRadio Sensor Networks by MODLEACH”, InternationalJournal of Innovative Research in Computer and Commu-nication Engineering, Vol. 3, Issue 9, ISSN (Online): 2320-9801, ISSN (Print): 2320-9798, pp. 8597-8603, .
[22] Garg, Sonia, Poonam Mittal, and C. K. Nagpal. “Appli-cation of Game Theory to Cognitive Radio Networks forPower Allocation: An Overview”, International Journal ofHybrid Information Technology 8, no. 5, pp. 251–258, 2015.
[23] Sharma, N., et. al., “Methodology for implementation ofcognitive radios using MATLAB”, International Journal ofRecent Research Aspects ISSN: 2349-7688, Special Issue:Engineering Research Aspects, pp. 113–116, 2015.
[24] Kumbhar, Abhaykumar, Farshad Koohifar, IsmailGÃijvenÃğ, and Bruce Mueller., “A survey on legacy andemerging technologies for public safety communications”,IEEE Communications Surveys & Tutorials 19, no. 1, pp.97–124, 2016.
[25] Singh, Sumit, and Mandeep Kaur., “A Survey on CognitiveRadio using Spectrum Sensing”, International Journal ofEngineering Research and General Science 3, no. 2, 2015.
[26] Muchandi, Niranjan, and Rajashri Khanai. “Cognitive ra-dio spectrum sensing: A survey”, In IEEE 2016 Interna-tional Conference on Electrical, Electronics, and Optimiza-tion Techniques (ICEEOT), pp. 3233–3237, 2016.
[27] Anusha, S., and V. Mohanraj. “Dynamic spectrum accessin cognitive radio wireless sensor networks using differentspectrum sensing techniques”, International Journal of Ap-plied Engineering Research 11, no. 6, pp. 4044–4048, 2016.
[28] Kanti, Jyotshana, and Geetam Singh Tomar. “Varioussensing techniques in cognitive radio networks: a review”,Int J Grid Distrib Comput 9, no. 1, pp. 145–154, 2016.

QUEST RESEARCH JOURNAL, VOL. 17, NO. 1, PP. 28–33, JAN–JUN, 2019 28
A Review of Agro-Industry in IoT: Applications and Challenges
Azeem Ayaz Mirani1,*, Muhammad Suleman Memon2, Mushtaque Ahemd Rahu3, Mairaj Nabi Bhatti 1,Umair Ramzan Shaikh 1
1Department of Information Technology, SBBU, Nawabshah, Pakistan.2University of Sindh, Jamshoro, Pakistan.3Education & Literacy Department, Nawabshah, Pakistan.*Corresponding author: [email protected]
Abstract
IoT and WSN, the two emerging fields, introduced efficient and reliable agricultural and livestock monitoring.Researchers are focusing these fields to introduce several new trends and techniques for agricultural automationindustry. The automation industry is now seeking new opportunity in the field of agriculture and livestock. The ideaof IoT is to embed a particular framework by adding computer software, sensors, and actuators and to establishthe connection over internet for the purpose of uploading and processing the data over a cloud. However, IoTdevices require less processing power, limtited life, heterogeneity support, platform independence, RFID, WiFi andblutooth. This support made IoT devices more suitable for the remote sensing. It is used to perform rapid and quickresponse on decision managment. Micro-controller technology has several application areas in agriculture whereIoT devices can be implemented for the further monitoring, processing and upload semantics which improve theagriculture automation industry and crop product. In this paper, IoT in agricultural and its respective applicationsand challenges are discussed.
Keywords—IoT, machine learning, agriculture.
F
1 Introduction
Internet of things (IoT), also called internet ofeverything (IoE), is a growing network of smart
physical devices with the integration of the sensors,actuators with smart energy . IoT is the network ofphysical objects having heterogeneous nature whichcan work together for a specific purpose. IoT is oneof the leading technologies these days for the devel-opment of industry, education, health and agriculture.Monitoring and recording the events in real-time hasmade it easier and convenient to get up-to-date in-formation about the agriculture. The smartness of thedevices brought a revolution in human life with severalreal-life applications [3]. IoT covers almost all fieldsof life. Any device, any time, can be fixed anywherewithout any restriction for getting the things better.The idea of IoT is to embed a particular frameworkby adding computer software, sensors, and actuatorsand to establish the connection over internet for thepurpose of uploading and processing the data over acloud. However, energy is a main concern due to lim-ited battery life and it constraints the processing power
ISSN: 2523-0379 (Online), ISSN: 1605-8607 (Print)
of IoT, but at the same time it makes IoT suitablefor remote sensing and processing [4]. Micro-controllertechnology has brought new trends and developed inseveral application areas where IoT devices can beimplemented.
1.1 IoT and the WorldIoT became more prominent technology since lastdecade. The population of IoT devices has been in-creasing day by day. According to international datacorporation (abbreviated as IDC), the 2013 predictionabout the IoT devices was an estimated number of41 billion IoT devices till 2020. This increase of theIoT devices may lead a revenue of about $8.9 trillionin the world. The purpose of the increase growth ofthe IoT technology and smart devices is to switchfrom the problem of manually developed methods tosmart automatically controlled systems. Furthermore,connectivity of the internet made it easy to uploadstatistics over cloud for further assessment [5]. Cloudcomputing is the part of internet of things which offersthe remote data access facility over the internet with-out the problem of distance. It is basically a solution to

QUEST RESEARCH JOURNAL, VOL. 17, NO. 1, PP. 28–33, JAN–JUN, 2019 29
remote data access problem and offers several featuressuch as security, reliability and authenticity of the dataaccess. IoT with integration of different technologiesoffers efficient and reliable methods of automationwithout the human involvement.
2 Related Contribution
IoT’s major contribution related to the latest methodsand techniques brought remarkable changes in com-putational science and several applications are madein this regard for the easiness. It covers almost allfields of life such as the robot-based model designedin [9] which works in the field and performs severaltasks automatically. In their study, a remote GPS-based robot system has been introduced to work inthe remote places. The robot can perform a numberof tasks in a field such as weeding, spraying, soil mon-itoring and moisture monitoring, etc. Furthermore, itcan also control irrigation system by statistics of soilstatus [6]. The important parameters monitored inthis study include temperature, humidity and theftdetection. The study in [6] focuses on agriculturalsoil monitoring with the effective usage of the soilmonitoring using soil sensors. Soil sensors are deployedin the field for monitoring agricultural soil status. Theobjective of this study is to enhance the quality ofsoil and improve the crops production. The conceptof remote monitoring is focused in this study for theevaluation and monitoring of the soil. Smart irrigationcontrol is focused in [12] where a smart module ofthe Wi-Fi kt is deployed for the internet connectivityto upload and connect the IoT kit with internet. Intheir work, a number of sensors are deployed in thefield where all the sensors are connected with smartmicro-controllers [7]. The automation industry is nowseeking new opportunity in the field of agricultureand livestock. Agricultural crop disease diagnosis hasbecome easy which is a crucial part of the researchers’focus in these days.The concept of remote monitoring is focused in an-other study [17] for the evaluation and monitoring ofthe soil. Smart irrigation control is focused in thisstudy where a smart module of the Wi-Fi Kit is de-ployed for the internet connectivity to upload and con-nect the IoT kit with internet. In their work, a numberof sensors are deployed in the field where all the sen-sors are connected with smart micro-controllers. Afterconnectivity, the data is uploaded over an androidapplication for updating the status of agriculturalsoil which is obtained from the soil and temperaturesensors.
3 Applications of IoT in AgricultureIOT is gradually becoming the important stockholderof the industry due to its reliability, efficiency andsmart working principle. With help of other emerg-ing technologies such as sensor, micro-controller andactuator [1], IoT framework can sense the data fromenvironment.
3.1 Agricultural field MonitoringThe traditional methods of monitoring agriculturalfields are very time consuming and also have lack ofaccurate field monitoring. The sensitive parameters ofthe agricultural fields cannot be monitored with ac-ceptable accuracy. Plants diseases are very importantfactor and have direct impact on agriculture productand it is very difficult to diagnose them manually.IoT technology is one of the interesting aspects ofthe IoT smart frame work. The automated calculationof the product samples and the quality measure fea-tures can easily be implemented by the help of smartmonitoring of the precision agriculture frame work[2]. The harvesting in fields are very critical for theIoT based agent like robots. These robots can workefficiently with the implementation of sensor basedtechnology and actuators for moving and performingthe harvesting tasks. For this purpose, a number ofsensors are needed to implement such as temperature,humidity, human detectors, locomotion, etc.
3.2 Green House MonitoringIoT technology, with emerging role of the related fields,have brought a revolution in automation of the reallife. Agriculture science is one of the most importantarea of focus in these days. The parameters includestemperature, humidity, soil monitoring and evapora-tion rate of water, etc [13]. These physical parameterscan be measured with implementation of the micro-controller based smart devices having integration ofdifferent types of tiny sensors. Sensors are smart de-vices used to measure the physical parameters of theenvironment. Improving smartness of the agriculturalfarming LM–35 temperature sensor is used to measurethe temperature of the fields. PIR sensor is used tomeasure the radiation from the devices. Likewise, soilmoisture sensor are used to monitor the real timestatus of the agricultural soil.
3.3 Agricultural DronesIoT with drone technology has become very popularin modern technology which can monitor and regu-late the activities of any environment. In agricultural

QUEST RESEARCH JOURNAL, VOL. 17, NO. 1, PP. 28–33, JAN–JUN, 2019 30
S.No Author Name & Year Contribution
1 Goldstein, A., Fink, L. (2018).
Crop yield prediction from the collected data form soil and environmentalvariables which applied on eight plots. However machine learningalgorithms applied different for the classification and regression of theefficient crop yield.
2 Ana Laura Diedrichs (2018)
Presented a model of machine learning algorithms which predicts the agriculturalfrost prediction system on the basis of different condition of the crop yield.They monitored thermodynamics conditions from the environment to predictsuing training set of the data obtained from sensors.
3 Anat Goldstein1 , Lior Fink1,Amit Meitin1(2017)
The study is about predicting irrigation recommendations. Different regressionand classiïňĄcation algorithms were applied on this dataset to develop models thatwere able to predict the weekly irrigation plan as recommended by the agronomist.
4 Keith H. Coble (2018)An efficient analytical techniques related to the agricultural and appliedeconomics contribution. Big data concepts are discussed in detailed whichis part of the research and development of the agricultural data analytics.
5 Tiantian Yang et.al (2016)
A robust reservoir outïňĆow simulation model is presented, which incorporates oneof the well-developed data-mining models (ClassiïňĄcation and Regression Tree)to predict the complicated human-controlled reservoir outïňĆows and extract thereservoir operation patterns.
6 Sami Khanal et. al (2017)
A review focuses on the application areas of thermal RS in agriculturediscussed here include irrigation scheduling, drought monitoring, cropdisease, detection, and mapping of soil properties, residues and tillage,field tiles, and crop maturity and yield. Some of the issues related to itsapplication include spatial and temporal resolution, atmospheric conditions,and crop growth stages.
7 Rehman, T. U.(2019)
The study is to review the statistical machine learning techniques includingsupervised and unsupervised learning for the agricultural environment.The study is to apply machine vision approach in agricultural data and suggestsome future implementation of the machine vision approaches.
8 Park, S (2016)
The study is to research six drought factors were selected based on the relativeimportance by their category to develop drought indicators that representmeteorological and agricultural drought by using the relative importanceas weights. While TRMM showed higher relative importance for meteorologicaldrought, LST and NDVI showed higher relative importance for agriculturaldrought in the arid and humid regions, respectively.
9 Vineela, M. T (2018)
Automated irrigation control with the same approach is also discussed in(Vineela et al.). The study also focused on the implementation of the IoT andWSN technology for the monitoring of the water stress in the pipe, waterneed in the agricultural field with the water arrival of the each and every partof the crops.
TABLE 1: IoT and Machine Learning Research Contribution
science, the drone technology can be used to mon-itor the activities of the agricultural crops [1]. Thedrone technology brought revolutionary changes in theagricultural monitoring activities with accuracy andfrequent updates which is difficult to manage by usingtraditional methods. A number of activities can bemonitored using the drone technology such as sprayingthe plants with desired amount of pesticides, andmonitoring the theft of the crops from the premises ofthe agricultural farm, to name a few. Drone technologycan be implemented in the agricultural 3D maps whichare very important for seeding and spraying the fields.Pod shooting with the nutrition of the plants andthe soil level nutrition can be monitored by using thedrone technology. Drone technology is also useful forthe remote sites monitoring of the agricultural fieldsto monitor which area is dry and which one is wet,
so that the necessary measures can be taken for theimprovements of agricultural crops.
3.4 Livestock MonitoringIoT, with the implementation of the emerging fields,has turned out to be an efficient way of the live-stock monitoring [10]. Livestock monitoring is usedto monitor location and health parameters such astemperature, blood pressure measurement, etc, andthe environmental parameters of the animal farm suchas temperature, humidity and carbon dioxide of thefarm area where animals are kept. The herd area canbe monitored easily using the sensor technology andIoT has made it easy to perform real time monitoringtime to time. Animal monitoring has become easierto implement with the help of GPS system for thedetection of animal location. The animal location with

QUEST RESEARCH JOURNAL, VOL. 17, NO. 1, PP. 28–33, JAN–JUN, 2019 31
continuous monitoring is very important for an animalfarmer. In the area where animals are moving andhave the proper grass monitoring is also importantin this regard. The feasibility of grass status can alsobe investigated by the implementation of a smart IoTframework.
3.5 Smart Irrigation ControlWater supply regulation and controlling the waterusage in agricultural field is a very important area ofresearch. The time management of the water pouringin the field is very important for the soil. This givesthe need of IoT to give the automated status of thesoil. The soil update and water level measuring isimportant for the automated water supply manage-ment. IoT gives a method of smart agricultural fieldmonitoring to check whether the agricultural area iscompletely poured [14]. The implementation of thesmart IoT framework can enhance the capability ofthe agricultural field monitoring better than the tra-ditional methods. Polluted water is a big issue inPakistan, especially for the agricultural crops. Thewater quality can also be measured easily with theimplementation of water quality sensors that measurethe water pollution.
3.6 Agriculture Warehouse MonitoringIn agriculture water monitoring, IoT has brought theconcept of smart warehouse monitoring. IoT enhancedthis capability with a very rapid and fast threat de-tection. Agricultural warehouse can be monitored realtime with the implementation of the human detectionsensors, temperature status of the warehouse by thetemperature sensors, and other important parametersrelated to the staff monitoring and owner awarenessrelated to the warehouse status [16]. This can beachieved by the implementation of the IoT deviceswith cloud connectivity and having the proper updat-ing mechanism for the owner. Anything, any time, canbe connected and monitored with real time update.IoT made it an easy and smart solution to monitorthe real-time environment of the warehouse and detectpotential threats to the products.
3.7 Soil MonitoringSoil is a key component for the agricultural crops.For monitoring the soil, IoT made it easy to controland coordinate the changes in soil. Nitrogen (N), CO2and other important parameters can be monitored andupdated to the cloud in real time. A robust recommen-dation system can be designed for the betterment ofthe soil fertilization [18].
4 IoT ChallengesThe challenges in the field of IoT are summarized asfollows.
4.1 IOT SecurityIn IoT, security and privacy are one of the most criticalissues and special focus of research these days. Someof the things can be more important with the aspectof security. It is a real challenge to integrated propersecurity mechanisms in IoT devices due to their hetero-geneity. Several security threats have been found in thesmart IoT devices during the environment monitoring.According to the report of enterprise firm in 2013,25% of the device manufacturers are not computerrelated firms and have no professional knowledge of thecomputer security risks. They manufacture the deviceslike game devices, monitors like toys and other homeusage electronic products. This has led to the weaksecurity management for the implementation of theIoT in smart monitoring to provide security againstthe unwanted attacks. The personal information andimportant data can easily be captured if the weaksecurity policies are followed in the smart framework,despite of the fact that IoT devices are very smart andcan perform rapid and efficient job in any environmentof real life. The device infrastructure deployment needscertain parameters for the focus of the study.
4.2 Battery LifeThere are several factors which which can directlyimpact the battery life of the IoT devices such asheterogeneity of the devices, large data processing,less energy power and longtime processing. In remoteareas, IoT devices are often deployed with the sensorsand actuators to monitor certain parameters in realtime. In this sense, the power consumption is veryimportant and devices are deployed with chargeablebattery. However, in remote places, it is very difficultto provide the proper power for the devices. It isimportant to manage the power source for the batterylife time. A plethora of research has been conductedon the energy efficiency and energy efficient protocolsfor the IoT technology deployment. It is also veryimportant research area in this regard for the futureimprovement of the IoT technology in real sense.
4.3 Heterogeneity of the DevicesHeterogeneity refers to the devices having differentnature and architectural structure with different fea-tures of working capabilities. IoT provides flexibility interms of heterogeneity, but also introduces few issues

QUEST RESEARCH JOURNAL, VOL. 17, NO. 1, PP. 28–33, JAN–JUN, 2019 32
Sensor ApplicationSoil sensorsVolumetric water content sensorsTension metersSoil profiling
Measures soil water volumetric content, soilwater potential, soil moisture respectively
GrainPro EcoWise Standard Wireless system designed to remotely monitorthe temperature and humidity
Wind Speed (PK 100-02) anddirection (110 âĂŞ 2) sensors Measures the speed and direction of the wind
Pyrometer (PK 200 - 03) and solar radiation(200 - 04) sensors Measures the intensity of the solar radiation
Water sensors:OTT Orpheus Mini Water Level LoggerOTT ecology 500 Water level loggerOTT CTD sensors
Used to measure the water pressure, water level,water pressure and water conductivity
TABLE 2: Agricultural IoT devices
which can be difficult for the real time monitoring,e.g., security and connectivity issues. The securityin IoT is very crucial due to different nature of thedevices having their own vendor configuration, con-nectivity, memory and security policies which may notbe compatible with other devices and can cause seriousproblems in IoT devices connectivity.
4.4 IoT Agricultural Advance Sensing DevicesSome of the IoT devices are related to the specific ap-plications that are sometime called application specificdevices. These application have their own merits anddemerit related to the platform and device compatibil-ity.
5 ConclusionThe study presented in this paper provided anoverview of IoT and emerging technologies whichcovers the agricultural monitoring with several IoTdevices. The new applications were discussed whichare latest focus of the study in the research commu-nity. Furthermore, it can be more comprehensive ifother areas of the livestock is merged for the furtherimplementation of the study. The new applications canalso be developed if required. IoT provides the ease ofheterogeneity, but still has certain issues which can bedifficult for the real time monitoring, e.g., security andconnectivity.
References[1] Zhang, X., Zhang, J., Li, L., Zhang, Y., & Yang, G. “Moni-
toring citrus soil moisture and nutrients using an iot basedsystem”, Sensors, vol. 17, No. 3, pp 447, 2017.
[2] Salvi, S., Jain, S. F., Sanjay, H. A., Harshita, T. K.,Farhana, M., Jain, N., & Suhas, M. V. “Cloud based dataanalysis and monitoring of smart multi–level irrigation sys-tem using IoT”, In International Conference on I-SMAC(IoT in Social, Mobile, Analytics and Cloud)(I-SMAC), pp.752–757), 2017.
[3] Abdullah, M. F. F., Ali, M. T. B., & Yusof, F. Z. M.”Rfid Application Development For A Livestock MonitoringSystem”, In Bioresources Technology in Sustainable Agri-culture, pp. 103-116. 2018.
[4] Caria, M., Schudrowitz, J., Jukan, A., & Kemper, N. (2017,May). ”40th International Convention on Smart farm com-puting systems for animal welfare monitoring”, In Infor-mation and Communication Technology, Electronics andMicroelectronics (MIPRO), pp. 152-157), 2017.
[5] Bacco, M., Berton, A., Ferro, E., Gennaro, C., Gotta, A.,Matteoli, S., & Zanella, A, “Smart farming: Opportunities,challenges and technology enablers”, In IoT Vertical andTopical Summit on Agriculture-Tuscany (IOT Tuscany, pp.1–6, 2018.
[6] Aiello, G., Giovino, I., Vallone, M., Catania, P., & Argento,A, “A dsecision support system based on multisensory datafusion for sustainable greenhouse management”, Journal ofCleaner Production, vol. 172, pp. 4057–4065, 2018.
[7] Khanal, S., Fulton, J., & Shearer, S., “An overview ofcurrent and potential applications of thermal remote sens-ing in precision agriculture”. Computers and Electronics inAgriculture, vol. 139, pp. 22–32, 2017.
[8] Shaikh, F. K., Zeadally, S., & Exposito, E., “Enablingtechnologies for green internet of things”, Systems Journal,vol. 11, No. 2, pp. 983–994, 2018.
[9] Abbas, S., & Athar, A., “Advance Modeling of AgricultureFarming Techniques Using Internet of Things”, IJCSNS,vol. 17, No. 12, pp. 114, 2017.
[10] Mekala, M. S., & Viswanathan, P., “A Survey: Smartagriculture IoT with cloud computing”. International con-ference on Microelectronic Devices, Circuits and Systems(ICMDCS), pp. –7, 2017.
[11] Suma, D. N., Samson, S. R., Saranya, S., Shanmugapriya,G., & Subhashri, R., “IOT Based Smart Agriculture Mon-itoring System”, International Journal on Recent and In-novation Trends in Computing and Communication, vol. 5,No. 2, pp. 177–181, 2017.
[12] Surai, S., Kundu, R., Ghosh, R., & Bid, G., “An IoT BasedSmart Agriculture System with Soil Moisture Sensor”, Jour-nal of Innovation and Research Vol, vol. 1, No. 1, 2018.
[13] Vineela, M. T., NagaHarini, J., Kiranmai, C., Harshitha,G., & AdiLakshmi, B., “IoT Based Agriculture Monitoringand Smart Irrigation System Using Raspberry Pi”, Interna-tional Research Journal of Engineering and Technology, vol.5, No. 1, pp. 1417–1420, 2018.
[14] Kothiya, R. H., Patel, K. L., & Jayswal, H. S., “Smart

QUEST RESEARCH JOURNAL, VOL. 17, NO. 1, PP. 28–33, JAN–JUN, 2019 33
Farming using Internet of Things”, International Journal ofApplied Engineering Research, vol. 13, No. 12, pp. 10164–10168, 2018.
[15] Gulati, A., & Thakur, S., “Smart Irrigation Using Inter-net of Things”, In 8th International Conference on CloudComputing, Data Science & Engineering (Confluence), pp.819–823, 2018.
[16] Jha, R. K., Kumar, S., Joshi, K., & Pandey, R., “Fieldmonitoring using IoT in agriculture”, In International Con-ference on Intelligent Computing, Instrumentation andControl Technologies (ICICICT), pp. 1417–1420. 2017.
[17] Roopaei, M., Rad, P., & Choo, K. K. R.,“Cloud of thingsin smart agriculture: Intelligent irrigation monitoring bythermal imaging”. Cloud Computing, vol. 4, No.1, pp. 10–15, 2017.
[18] Parameswaran, G., & Sivaprasath, K., “Arduino BasedSmart Drip Irrigation System Using Internet of Things”,Int. J. Eng. Sci, pp. 5518, 2016.
[19] Goldstein, A., Fink, L., Meitin, A., Bohadana, S., Luten-berg, O., & Ravid, G., “Applying machine learning onsensor data for irrigation recommendations: revealing theagronomist‘s tacit knowledge”, Precision agriculture, vol.19, No. 3, pp. 421-444, 2018.
[20] Diedrichs, A. L., Bromberg, F., Dujovne, D., Brun-Laguna,K., & Watteyne, T., “Prediction of frost events using ma-chine learning and IoT sensing devices”, IEEE Internet ofThings Journal, vol. 5, No. 6, pp. 4589–4597, 2018.
[21] Goldstein, A., Fink, L., Meitin, A., Bohadana, S., Luten-berg, O., & Ravid, G., “Applying machine learning onsensor data for irrigation recommendations: revealing theagronomist‘s tacit knowledge”, Precision agriculture, vol.19, No. 3, pp. 421–444, 2018.

QUEST RESEARCH JOURNAL, VOL. 17, NO. 1, PP. 34–40, JAN–JUN, 2019 34
Road Traffic Accidents (RTAS) Safety Issues On Highways: A Review
Amir Detho1,*, Saleem Raza Samo1, Kishan Chand Mukwana1, Kamran Ahmed Samo2,Mahmoud Hijab Abubaker3
1Department of Energy & Environment Engineering, QUEST, Nawabshah, Pakistan.2Department of Electrical Engineering, QUCEST, Larkana, Pakistan.3Department of Civil Engineering, Modibbo Adama University of Technology, Nigeria.*Corresponding author: aamir [email protected]
Abstract
Nowadays, besides the fast development of technology (particularly in the field of the information technology), thenumber of vehicles on the highways/roads has increased enormously. In developing countries, with the increasednumber of vehicles, the significant number of road accidents (RTAs) have been reported. The major reasons for theRTAs in these countries are the lack of proper management (including RTAs data) and guidance to the consumers. Astudy was conducted on Hyderabad-Karachi M-9 Motorway section during half of the year 2017. The data revealedthat total 17 accidents encountered during the reported time in which 15 human lives were lost and 54 people werereported as injured. In addition, 30 vehicles were damaged. Keeping those causes and reasons for RTAs in view,this paper has focused on undertaking a review of the reported RTAs in the available literature. The data analysisreveals that the causes of accidents are careless driving, bad road conditions and improper condition of vehicles.
Keywords—Highway, Careless Driving, Road Traffic Accidents (RTAs), Safety Issues.
F
1 Introduction
In developing countries, according to estimates by2030, road traffic accident claims more than 2.5 mil-
lion people losing their lives and in addition around 60million people (i.e., death and injured) got injured inthese road accidents. Most of the accident involve chil-dren, pedestrian, cyclist and public transport users.Pakistan is a developing country with the populationof around 207,774,520, facing the road crashes crisis.According to unconfirmed data, lack of adequate roadstandard safety measures and violation of traffic lawstook more than 100,000 lives in last 10 years. However,three main factors of road accident were identified.These are human error, vehicular defect and failurein road environment. In Pakistan, most of the roadaccidents occur due to over speeding, wrong overtaking and carrying overloading material, etc. The me-chanical faults like tire bursting and brake failure aremassive contributor of the road accidents. In Pakistan,initially highways were used as feeders to railwaysthat were the main transport source for long distancesand transport goods. However, nowadays, the usage ofhighways has increased, and the length of the roads
ISSN: 2523-0379 (Online), ISSN: 1605-8607 (Print)
increased from 249,972 km (in 2000–01) to 263,356 (in2015–16). A similar increase is recorded in the numberof vehicles, from 4,701,600 (in 2000–01) to 17,317,600(in 2015–16) [34]. In Pakistan, the maintenance andconstruction of roads is under the Government andnational highway authorities. For this research article,a brief literature review is carried out to determine theroad traffic issues in the era of road traffic accidents(RTAs).
2 Literature ReviewThe authors in [1] investigated about road accidentcost including hospital expenses, court expenses andalso the cost of intangible consequences like painand suffering. During the last two decades, rapidincrease in the number of vehicles is the major reasonof increasing number of accidents. To minimize theroad accident impact, the necessary measures includeorganizing safety programs, developing vehicle design,making a suitable plan and implementing traffic lawsto reduce the accident on the roads. It is concludedthat organizing safety programs as per requirementfor reducing the number of accident and fatalities on

QUEST RESEARCH JOURNAL, VOL. 17, NO. 1, PP. 34–40, JAN–JUN, 2019 35
the road in future is indispensable.The authors in [2] revealed that a safety awarenessprograms is conducted with the collaboration ofRegional Transport Offices in 2011. The main aimof this program is to educate the people about theroad rules. In Kerala, highest rate of road accidentoccurred in the country. Each year 3800 people losttheir lives due to road accident. In these accidents40% victims were two-wheeler rider and many morewere permanently disabled. The increasing roadaccidents occur due to inadequate road space inview of this ever-increasing number of vehicles. Thetwo-wheeler rider often does not wear helmet. Thestate government needs to organize safety programsfor public to reduce the severity of road accidents. It isconcluded that organizing such type of programs andsafety classes in the educational institutes on regularbasis is vital.The authors in [3] concluded that day-by-day growingpopulation and increasing the number of vehicles atproportional rates with the population is also the rootcause of the increasing number of RTAs. In addition,untrained vehicle driver become a main source ofaccident. Driver education should be introducedin schools, with its future success will also changethe behavior of the person. Well-equipped trafficaid centers should be installed at every 30-50 kmon the highway which must contain patrol vehicles,ambulances, crane and traffic staff who regulate thetraffic rules and laws and provide first-aid to theRTA’s victims.The authors in [4] used Geographical InformationSystem (GIS) to identify the most frequent accidentspots in the district of Enarkulam and Alappuzha.To identify these spots, the use of WSI method forcollection of data at different location includes tenspots in Enarkulam and six spots at Alappu-zha.According to the collected data, two spots wereidentified in Enarkulam and one spot was identified inAlappuzha. It is concluded from the study that somepossible measures should be taken to reduce RTAsand improve those areas where accident were takingplace on regular basis.The authors in [5] concluded that India is the 2nd
most populated country in the world, yet there is littleresearch on RTAs in India. To prevent injuries (tomake effective policies regarding the accident) safetypolicies and social and economy based policies mustbe envisaged in the country.The authors in [6] revealed that road traffic accidentsis the leading cause of death and property damage dueto complex flow pattern of vehicles on the highways.In year 2011, the rate of death has been increased
which is estimated that 1200 person died in 100accident, whereas in 2001, it is estimated that 700person died in per 100 accident. Mostly, the roadaccident occurred in rural areas due to the damageof roads and improper and untimely maintenance.It is concluded from the study that most of theroad accidents occurred in year 2001 in Palakkad,Enarkulum, Kannur and Alaphuzha. In year 2011,most of the accidents occurred in Kannur, Malapuramand Palakkad. The comparison of the accidents anddeath ratio in the years 2011 to 2001 reveals thatthe ratio of death increases and the rate of accidentdecreases.The authors in [7] concluded that road accident is ahuman tragedy, which results in loss of lives, injuriesand loss of properties. A little amount of research isconducted on road accident to investigate the maincauses of accident. In India, there were 500,000 roadaccidents in calendar year 2010. From the numbers,in every minute ten road accident were reported inwhich every 4 minutes one death occurred due toroad accident. Most of the victims are under theage group of 25-65 years. To reduces these unwantedtragedies, many of the countries are adopting roadsafety measures including quality and design of roads,traffic management, road worthy vehicles, effectivelaw enforcement and first-aid training programs toattend the victims with immediate response. It isconcluded that the government alone can not takesufficient measures to resolve accident problems. It israther a nation-wide problem and must be resolvedwith the cooperation and support of the whole nation.The authors in [8] revealed that during year 2005-2006,there were 38361 and 42363 accidents, respectivelyand the trend was rising. There is a slight decrease inroad accident in year 2006 and it comes to 36,282 inyear 2014. Road accident causes a major social, healthand economic problem. Several safety programs havebeen organized in the country to minimize the impactsof road injuries occurring due to road accidents. Thestate government addressed road safety awarenessprograms as well as introduced a tough license issuingact.The authors in [9] concluded that the major causesof road accident is recklessness and ignorance. Thepeople do not follow the traffic rules and laws. Thegovernment can play a vital role to create educationalinstitutes and offer courses regarding safety awarenessand distribute material among the public and drivers.Governments need to ensure tough process of drivinglicense issuance after proper examination of thedriver. Other main reasons of road accident includeover loading, use of cell phone during driving, and

QUEST RESEARCH JOURNAL, VOL. 17, NO. 1, PP. 34–40, JAN–JUN, 2019 36
use of drugs by the drivers. These problems shouldbe coped by imposing penalties to the offenders andorganizing awareness programs.The study in [10] concluded that in 2001, road trafficinjuries are the fourth main cause of death in Koreaafter stroke, heart and cancer diseases. Analysis byage (1-29) shows that road traffic injuries were thefirst leading cause of death among the young adult,second leading cause of death among the age group of30s, and third leading cause of death among the agegroup of 40s. However, many people around the ageof 50s die due to road injuries and majority of themdie due to heat stroke, heat and cancer problems.The main reason of road traffic injuries is due toover loading, over speeding, reckless driving, drunkdriving and disobeying the traffic rules. It is concludedthat the multiple stakeholders such as policy maker,Korean police, public and media are able to reduceroad traffic accidents as a joint effort.The authors in [11] opined that road traffic accident isan unpredictable event which remain a huge burdenfor any country. Every year, 1.2 million road accidentsoccur in the world. In addition, 90% of the accidentoccur in developing countries and 50% road accidentoccur in Asia pacific region. In the severity of RTAs,50% of death happen within five minutes due toserious injuries including heart failure and brainhemorrhage. Nearly 35% victims die in next 1-2 hoursdue to bleeding and remaining 15% victims die inthe next 30 days due to road infection and negligenthospital treatment. It is concluded that the road safetyknowledge among the drivers and general public mustbe enhanced .The study presented in [12] shows that the transporterand general public in Pakistan do not follow thetraffic laws. The competent authority is failed toenforce wearing of helmet and seat belt during thedriving. The road traffic injuries model establishedespecially for one city is generally applicable for othercities as well. Furthermore, multi-disciplinary privateand public sector organizations arrange road safetyprograms to reduce road traffic accidents.Another study [13] revealed that a huge number ofaccidents occur due to reckless driving. In Pakistan,by the year 2000 to 2010, Punjab has the highest andBaluchistan has the lowest ratio of road accidents.However, Sindh province has a higher ratio of fatalaccidents. The number of RTA deaths in Punjabis higher than other provinces of Pakistan. Thepopulation growth results in higher number ofvehicles, leading to the higher probability of roadtraffic accidents.The authors in [14] state that road traffic accident is
the eights main cause of deaths worldwide. Accordingto WHO (2004), road traffic accidents would becomethe 3rd main cause of death in year 2020, if notcontrolled properly. Furthermore, the available datais not reliable due to under reporting. However, roadtraffic accidents is one of leading causes of deathand injury all over the worldwide. An internationalcomparative study was carried out to investigatevarious regions in terms of motorisation (vehiclesper individual), individual hazards (passings perperson), and traffic chance (passings per vehicle).The study shows that the developing countries hashigher motorization, but lowest risk. Whereas, Africahas least motorization, but have high traffic risk.Southeast Asia, Africa and the Middle East have thehighest risk in terms of personal safety.The authors in [15] stat that the seat belt law wasintroduced in 1994. According to the hospitals record,1200 road accidents were reported after enact seatbelt law in Kuwait. The fatality and injuries wereslightly increased for the use of seat belt as to non-userof seat belt. It is concluded that seat belt non-usersreceived higher number of face, head, abdomen andlimb injuries.The authors in [16] state that road transport isthe most important mode of travel in a country.Nowadays it is an emerging problem which almostall the governments have tried to cope with. Roadaccident causes both economical and social impactson the individuals. The increasing number of vehicleson roads creates a social problem as well as highrate of loss of lives. Furthermore, it is concludedthat bad road condition is one of the main causes ofinjuries, permanent disability and sometimes death.The government and the private agencies shouldrepair the bad portion of the highways on time. Thedriver education to induce good driving habits mustbe carried out.Another study [17] concluded that in developingcountries the abrupt increase in the use of vehiclesis the major reason of increasing accidents . In year2020, road traffic accident will become the thirdleading cause of death, if not controlled properly.Road accidents mainly affect males in their productiveand active period of life. It creates huge economiclosses for the family whose dependent is on the singlesource of income. To reduce these accidents, severalsafety awareness programs must be organized.The authors in [18] revealed that road traffic accidentrate is higher in most of the Gulf countries. SaudiArabia is also facing problems of morbidity andmortality due to RTAs. Road accident deaths andinjuries are avoidable by safety awareness programs

QUEST RESEARCH JOURNAL, VOL. 17, NO. 1, PP. 34–40, JAN–JUN, 2019 37
that educate the road users and vehicle drivers aboutthe traffic laws.The authors in [19] concluded that in rural areasroad accident causes huge loss of lives of young, maleadults who mostly belong to poor families. Most ofthe victims travel by public private transport, persuedby motorcycles and cars. Motorcycle is most economicand common source of transport in rural areas ofSindh province for poor and lower-class families.To reduce these vehicle accidents, struct securitymeasuers must be enforced. There is also need ofpaying attention on improving vehicle condition inrural areas of Sindh.In [20], the authors suggested that a proper trainingto the employees regarding latest skills and knowledgeto the road traffic investigator must be provided. Thecity must apply road traffic standards and improvefuture road safety facilities such as first aid, cameras,ambulance, computers and well establish offices.The authors in [21] stated that the worldwide roadtraffic accident fatalities and injuries have become aserious problem. In Nigeria, road accident fatalitiesand injuries have become alarming and ranked amongthe other countries with higher rate of accidentsworldwide. However, by introducing road safetyconcepts and awareness campaigns can significantlyreduce RTAs. Furthermore, such campaigns havebeen introduced through media and road side sloganssuch as “drive to stay alive”, “drive carefully”,and “accident kill more passenger”. Effective safetyprograms must be organized by tear round and shouldnot be kept limited to festival season.In [22], the data collected in Keral, India from2010-2016 reveals that the ratio of deaths is on therise. Road accidents are the main source of loss oflives, injuries, polluting the environment and alsodestructing service sector. The study also found otherroad accident occurring frequently in the state’shighways. In rural areas, road conditions are very poorand also the main cause of increasing road accident.The authors in [23] state that road accident is oneof the main sources of loss of lives and injuries. Itbecomes not only a social problem, but it is alsoputting an adverse impact on the dependents of familymembers. The increasing trend of road accidents enacta negative impact on the individuals as well as ondependents. Young age groups of people are unsafedue to road accidents which cause economic loss,but also pain, grief and suffering, etc. It is concludedthat design-friendly transportation policies, roadinfrastructure as well as improved vehicle design toreduce the impact of road accident must be envisaged.In [24], the authors investigated the magnitude and
pattern of fatalities in Sindh, Pakistan. The collecteddata indicated that every 1 or 2 road traffic crashesproduce fatal accident. In addition, every day morethan four people lose their lives and these are commonin rural areas as compared to urban areas. Road trafficcrashes mostly affect male adults who are passengersor pedestrians.The study in [25] reveals that pedestrians are moreinjured in road accidents due to lack of awareness.They are not conscious about the risk of an accidentwhen they move on the road. However, limited numberof officials perform their duties from Dhaka to Sylhethighways followed by one car. The main reason of roadaccident is the domestic and wild life animals comingon the highway and creating problems for drivers,leading to accidents.The authors in [26] conducted a survey on Hyderabad-Karachi Highway for two years (2015-2016) in terms oftraffic accidents, loss of lives and vehicles. In addition,they investigated the causes of the occurrence ofroad accidents. Their data has revealed that carelessdriving is the major cause of RTAs on the motorway.Due to this reason, 29 and 19 people died in year2015 and 2016, respectively and total 293 numbers ofpeople got injured in both the reported years. As faras economical loss is concern, 93 numbers of vehicleswere damaged 2015 and 110 numbers of vehicles weredamaged 2016. The condition of the road/highway hasbeen recognized as a reason for the RTAs. The datahas shown that 16 people died in accidents due to badroad conditions. Furthermore, 40 people got injuredand 34 vehicles were damaged in the accidents whichoccurred due to bad road condition.The study presented in [27] concluded that pedestriansare the common victim of road accident. The collecteddata indicated that 46.55% male victims were ofthe ages between 21-40 years. Mostly, the accidentsoccurred during daytime (62.06%). In addition,79.31% of victims lost their lives on the spot due toseverity of the accidents. Pedestrian were commonvictims of road traffic accidents (81.89%). The mainreason of death occurred on the spot due to head injuryis about 45.68%. It is concluded that to reduce deathtoll rate, various prevention measures must be takensuch as seat belt and helmet wearing while drivingon the highways. Strict laws should be enforced onthe road users to control over speeding, consumptionof alcohol, improving road infra-structure, providinghospital care centre, and medical services, etc.Authors in [29] carried out a research on theoccurrence of RTAs in Jordan, based on the accidentsregistered in hospitals. They concluded that majorityof the accidents occurred on first day of a week and

QUEST RESEARCH JOURNAL, VOL. 17, NO. 1, PP. 34–40, JAN–JUN, 2019 38
during summer time.The authors in [30] state that road traffic accidentpose a serious challenge. The government of Indiarevises its policies and rules time-to-time regardingthe road traffic accidents. Although, it still fails toaddress the appropriate legislation and policies.A study in [31] states that one in two road trafficaccidents in Sindh cause a loss of four human livesper day. The data was obtained from governmentdocuments and daily newspapers reports on accidents.The results show that the total annual number ofRTAs, fatal RTAs and RTA deaths were 2272 (±293),1104 (±89) and 1321 (±136), respectively. The resultsrevealed that 85% of victims were male between theages of 15-49 years. The most common victims arepedestrians, motorcyclists and drivers. In rural areas,the death rate is higher as compared to the urbanareas. The most common cause of RTAs was ‘hit bythe vehicle’, collision of motor vehicles, breakdownand over speeding.The authors in [14] state that RTAs cause significantsocial and economic issues for people and society.Shara-e-Faisal, one of the busiest road of Karachi city,was selected for study purpose knowing the patternsof RTAs. Due to high flow of vehicles in weekendsand on Mondays, the percentage of road accidenthigher as compared to the other days of the week washigher. Young people between the ages of 20-30 aregenerally affected due to RTAs. The proportion ofmale affectees in RTAs is higher than female affectees.It is due to higher demand of travel by males. DayTime Crashes (DTCs) were found to be higher innumber as compared to Night Time Crashes (NTCs).The frequency of crashes was recorded higher in themid-block as compared to intersection. Nevertheless,the data revealed that crashes increased with thepassage of time. Bike riders are the highest contributorin road traffic accidents because of reckless riding.Rear end and side-swipe was observed to have asignificant impact on RTAs. More RTAs were reportedon the road sections where street lights and lanemarkings were not present. The arrangement of thesebasic needs may help to reduce RTAs on this busiestroad in the city. An investigation was carried out toidentify harmful road sections. The analysis revealedthat the areas without street lights and lane markingswere the most risky sections. An evaluation model wasproposed with the help of LDFA to mitigate the risksof RTAs on Shara-e-Faisal. The model depends onMVK, DTCs and NTCs, and can predict the conditionwhere a risky section of the road can be named asperilous. This model can be used as a successful toolin the improvement of a traffic safety program to
reduce RTA risk in Pakistan.A study by World Health Organization (WHO) [32]on Global Burden of Disease (2004) states that roadtraffic accidents in 2004 were 9th main source of lossof lives. The study forecasts that at current rate theRTAs will rise to 2.4 million deaths by 2030 and willbecome third major causes of death, even supersedingthe deaths by HIV and diabetes.RTAs injures affect all age groups, but their impact ismost striking among the young. RTAs have becomesecond major cause of deaths worldwide in age of 5 to14, 15-29, and 30-44.The authors in [33] state that in Dhaka, heavy vehiclesincluding buses, mini-buses and trucks are the mainsource of road accidents. Around 79% of RTA casesinvolve the heavy vehicles (buses 20%, mini-buses22% and trucks 37%). Both in urban and rural areas,pedestrian accident are a most dominant accident typewhich (26.95%). This type of fatal accident followsby head on 13.95%, rear end 15.95% and run off road17.95%. The majority of victims of accidents involvedyoung males, about 29% falling in between the age of25-35. The gender-wise statistics are as follows: 37%female falling in the age of 35-45, and 31% are fall inbetween the age of 55. It is noticeable that 62.50%of the victims were below the age of 10 years, and37.50% were between the ages of 10-15 years. Most ofthe victims were primary school level students whodo not follow the traffic rules and regulation. It isconcluded that pedestrian are the primary victim ofroad accidents.
3 Problems in the area of road safetyThe problems pertaining to the area of road safety canbe summarized as follows.
1) Traffic education is the area that could helppromulgate a safety culture on roads in Pak-istan by inculcating traffic rules among thepeople. Unfortunately, traffic education andawareness programs have never been givenmuch importance in Pakistan.
2) The road environments need significant im-provements. Roads are full of potholes whichhave become death traps. Maintenance ofroads has never been a priority from the gov-ernment. The billions earned by the govern-ment every year from the fuel duty, motor reg-istration dues, and driving license fees are notgainfully spent on the maintenance of roads.Besides, over speeding is almost uncontrol-

QUEST RESEARCH JOURNAL, VOL. 17, NO. 1, PP. 34–40, JAN–JUN, 2019 39
lable and offenders are conveniently ignoredby the enforcing agencies.
3) The majority of the commercial vehicles inPakistan are not road worthy and there is nosystem of banning their entry on roads. Manyaccidents happen due to faulty engines, poorbrakes, worn out tires and ill trained drivers.There is too much laxity in the laws and it isvery difficult to punish errant drivers.
4) There is a dearth of dual carriage ways pre-venting head-on collisions on intercity roads.There are no special safety measures nearpublic places like hospitals, schools, mosquesand shopping centres, etc. No street lightingprovision exists which impose serious threatsto security.
5) A large number of fatalities on roads involvespedestrians. These deaths occur simply be-cause the pedestrians have to share the car-riage way with the vehicles in the absence ofproper and adequate space. Similarly, properpedestrian crossings are not provided on theroads and junctions in urban areas. The ran-dom and unchannelized pedestrians crossingcauses many accidents.
6) In Pakistan, education to inculcate trafficsense among the people has never been givendue importance, which is evident from the factthat important passive measures like wearinga helmet by the motorcycle riders and use ofseat belt in the vehicles are rarely observed.
7) Above all, the law enforcing agencies are notperforming their role effectively. Corruptionand malpractices are rampant among the rel-evant government departments.
4 Conclusion
In Pakistan, one of the major concerning issues istraffic management. From the detailed literature re-view, the main causes of road accident were found tobe unskilled drivers, lack of training institutes, badroad condition, use of cell phones during driving, haz-ards of alcohol/drugs, and overloading. In Pakistan,issuance of driving license is not well regulated andmonitored. Road safety audits must be conducted onregular basis before and after the completion of a road.The black spots, where accidents occur repeatedly,must be repaired on priority basis. The traffic rulesand legislation must be enforced by introducing heavypenalties to the offenders.
AcknowledgementThe authors are grateful to Quaid-E-Awam Universityof Engineering, Science & Technology, Nawabshah forproviding the facilities to conduct this research.
References[1] B. B. Pillai, J. Kurian, “Causes and consequences of road
accidents in Kerala”, International Journal of Research inIT & Management, Vol. 1, No. 5, pp. 83–95, 2011.
[2] B. B. Pillai, G. D. Singh, “Scenario of Road Accidents inKerala and its Ill Effects”, International Journal in Man-agement and Social Science, Vol. 3, No. 3, pp.559–567, 2015.
[3] P. Daigavane, P. Bajaj, “Analysis of selective parameterscontributing to road accidents on highways for establishingsuggestive precautionary strategies”, Second InternationalConference on Emerging Trends in Engineering and Tech-nology, ICETET–09, pp. 576–580, 2009.
[4] L. Isen, A. Shibu, M. S. Saran, “Identification and Analy-sis of Black spots using Geographic Information System”,International Journal of Innovative Research in Science,Engineering & Technology, Vol. 2, No. 1, pp. 131–139, 2013.
[5] M. M Ruikar, “National Statistics on Road Traffic Acci-dents in India”, Journal of Orthopaedics, Traumatology andRehabilitation, Vol. 6, No. 1, pp. 1–6, 2013.
[6] B. V Sreekumar, V. Sreedevi, “Impact of Road Accidents inKerala During 2001 to 2011-A Case Study”, InternationalJournal of Business Research and Management, Vol. 6, No.1, pp. 51–57, 2014.
[7] P. Despande, “Road Safety and Accident Prevention inIndia”International Journal of Advanced Engineering Tech-nology, Vol. 5, No. 2, pp. 64–68, 2014.
[8] B. B Pillai, G. D Singh, “Scenario of Road Accidents inKerala and its Ill Effects”, International Journal in Manage-ment and Social Science, Vol. 3, No. 3, pp. 559–567, 2015.
[9] Khan, Abdul Manan, and Ansa Tehreem. “Causes of roadaccidents in Pakistan.”Journal of Asian Development Stud-ies 1, no. 1, pp.22–29, 2012.
[10] B. M. Yang and J. Kim, “Causes of Road Accidents inPaki-stan”, Injury Control and Safety Promotion, Vol. 10,No. 1âĂŞ2, pp. 89âĂŞ94, 2003
[11] T. Hussain, L.Y. Shu, T. Sosorburam, A. S. Adji, A. H.Khan, A. F. Raja, “Road traffic accidents; An observationaland analytical study exploring the hidden truths in Pakistanand South East-Asian Countries“, Vol. 2, No. 1, pp. 52–57,2011.
[12] A. A. Khan and Z. Fatmi, “Strategies for Prevention ofRoad Traffic Injuries (RTIs) in Pakistan: Situational Anal-ysis”, Journal of the College of Physicians and SurgeonsPakistan, Vol. 24, No. 5, pp. 356–360, 2014.
[13] S. Gulzar, F. Yahya, Z. Mir, R. Zafar, “Provincial Analysisof Traffic Accidents in Pakistan ”Journal of Social Sciencesand Humanities, Vol. 3, No. 3, pp. 365–374, 2012.
[14] M. M. Rafi, , A. H. Lodi and M. A. Effendi,“Mitigation ofroad traffic crash hazard in Pakistan”, Disaster Preventionand Management, Vol. 23, No. 5, pp. 567–585, 2014.
[15] P. A. Koushki, M. A. Bustan, and N. Kartam, “Impact ofsafety belt use on road accident injury and injury type inKuwait”, Accident Analysis and Prevention, Vol. 35, No. 2,pp. 237–241, 2003.
[16] M. N. Isa and P. Siyan, “Analyzing Factors Responsiblefor Road Traffic Accidents along Kano-Kaduna-Abuja DualCarriageway Nigeria”, Accident Analysis and Prevention,Vol. 7, No. 12, pp. 156–163, 2016.

QUEST RESEARCH JOURNAL, VOL. 17, NO. 1, PP. 34–40, JAN–JUN, 2019 40
[17] M. H. Khan, I. Ahmed, N. Zia, T. S. Babar, K. S. Babar,“Road traffic accidents; Study of risk factors”, ProfessionalMed, Vol. 14, No. 2, pp. 323–327, 2007.
[18] U. B. Ghaffar, S. M. Ahmed, “A Review of Road trafficaccident in Saudi Arabia: the neglected epidemic”, IndianJournal of Forensic and Community Medicine, Vol. 2, No. 4,pp. 242–246, 2015.
[19] F. Chang, M. M. Sahito, M. S. Pirzado, S. Baloch, I.Mughal, R. Sahito, “Profile of RTA cases attended in ter-tiary care hospital District Shaheed Benazir Abad, SindhPakistan”, New York Science Journal, Vol. 7, No. 11, pp.82–85, 2014.
[20] A. B. Meresa, J. Xu, S. Yiming, “Improvement of TrafficAccident Investigation Process: A Case Study in MekelleCity, Ethiopia”, International Journal of Traffic and Trans-portation Engineering, Vol. 5, No. 4, pp. 91–95, 2016.
[21] Atubi, A. O, “Urban Transportation: An Appraisal of Fea-tures and Problems in the Nigerian Society”, InternationalJournal of Geography and Regional Planning, Vol. 1, No. 1,pp. 58–62, 2012.
[22] A. Chand, “A Case Study of Road Accidents in Keraladuring 2010 to 2016”, International Journal of InnovativeResearch in Science, Engineering and Technology, Vol. 6,No. 4, pp. 199–203, 2017.
[23] S. Zubair and S. J. H. Kazmi, “Spatial Framework for theAssessment of Road Traffic Accidents in Karachi”, Journalof Basic & Applied Sciences, Vol. 9, pp. 525–532, 2013.
[24] S. G. S. Shah, K. Khoumbati, B. Soomro, “The pattern ofdeaths in road traffic crashes in Sindh, Pakistan”, Interna-tional Journal of Injury Control and Safety Promotion, Vol.14, No. 4, pp. 231–239, 2007.
[25] B. K. Banik, M. A. I. Chowdhury, E. Hossain, B. Mojum-dar, “Road accident and safety study in sylhet region ofbangla-desh”, Journal of Engineering Science and Technol-ogy, Vol. 6, No. 4 pp. 493âĂŞ-505, 2011.
[26] A. Detho, S. R. Samo, K. C. Mukwana, K. A. Samo, A.A. Siyal, “Evaluation of Road Traffic Accidents (RTAs) onHyderabad Karachi M-9 Motorway Section”, Engineering,Technology & Applied Science Research, Vol. 8, No. 3, pp.2875–2878, 2018.
[27] M. Arif, M. Ahmed, S. H. Rasool, “Road Traffic Accidents;Autopsy Based Study in Multan”, Professional Med J, Vol.22, No. 5, pp. 621–626, 2015.
[28] K. S. Jadaan, “The Epidemiology of Road Traffic Acci-dents in Jordan”, The Journal of the Royal Society for thePromotion of Health, Vol. 109, No. 4, pp. 141–144, 1989.
[29] Anastasopoulos P.C and Mannering, F. L, “An empiricalassessment of fixed and random parameter logit modelsusing crash and non-crash-specific injury data”Accident;Analysis and Prevention, Vol. 43, pp. 1140âĂŞ-1147, 2011.
[30] K Sandhu, “Mobility Hazard on Indian Roads: A Conse-quence of Inept Traffic Management”, Prabandhan: IndianJournal of Management, pp. 39–44., 2012.
[31] S Shah, S. G., Khoumbati, K., & Soomro, B. “Thepattern of deaths in road traffic crashes in Sindh, Pak-istan.”International journal of injury control and safetypromotion, Vol. 14, No.4, pp. 231–239, 2007.
[32] Peden, M. World report on road traffic injury prevention,2004.
[33] Banik, B. K., Chowdhury, M. A. I., Hossain, E., & Mojum-dar, B. “Road accident and safety study in Sylhet Region ofBangladesh”. Journal of Engineering Science and Technol-ogy, Vol. 6, No. 4, pp. 493–505, 2011.
[34] Government of Pakistan, Ministry of Finance,Pakistan Economic Survey 2015–16, available at:http://www.finance.gov.pk/survey 1516.html
