edison research fellows and the executive actions 1 december 9, 2014
TRANSCRIPT
Edison Research Fellows and the Executive Actions
1
December 9, 2014

Edison Scholar Program
• Bring distinguished academic researchers to the USPTO to study intellectual property (IP) issues that further the agency’s mission and the public interest
• The White House Task Force on High-Tech Patent Issues:“expansion of the PTO Edison Scholars Program, which will bring distinguished academic experts to the PTO to develop — and make available to the public — more robust data and research on the issues bearing on abusive litigation”
• Edison Research Fellows
2

What Issues Bear on Patent Litigation?
3
Patent “quality”Examination quality control
Managerial and legal guidance and trainingExaminers’ search tools
Appeals and post-grant procedures
Market structureCompetitive landscape and Business models
Markets for technologyEase of entry and exit
Complex manufacturing and standards
Other factorsMacro-economic conditions
Technological changeLiquidity and access to capital
DisputesClaim construction challengesCosts of litigationStandards of review and legal presumptions
Patent Litigation

Edison Research Fellows
• 3 fellows started in Summer 2014 to research issues related to abusive patent litigation with a focus on high-tech patents
– Joseph Bailey, University of Maryland, Smith School of Business
– Jonas Anderson, American University, Washington College of Law
– Deepak Hegde, New York University, Stern School of Business
• http://www.uspto.gov/ip/init_events/edisonscholar.jsp4
Machine Learning for Prior Art Retrieval
Joe Bailey, PhD
Edison Research Fellow

6
Research Question
• How can machine learning best be used to uncover prior art during patent examination?

7
Proposed Algorithm
1. Each application and reference is clustered based on its classification; classification vectors are used to find nearest neighbors
2. Stemming and lemmatization are done within each category for subsequent analysis
3. K-NN is used to look at the nearest neighbors
4. Results may be filtered to look within as well as across clusters
5. Art may be added and subtracted from clusters
6. Clusters may be created or retired
8
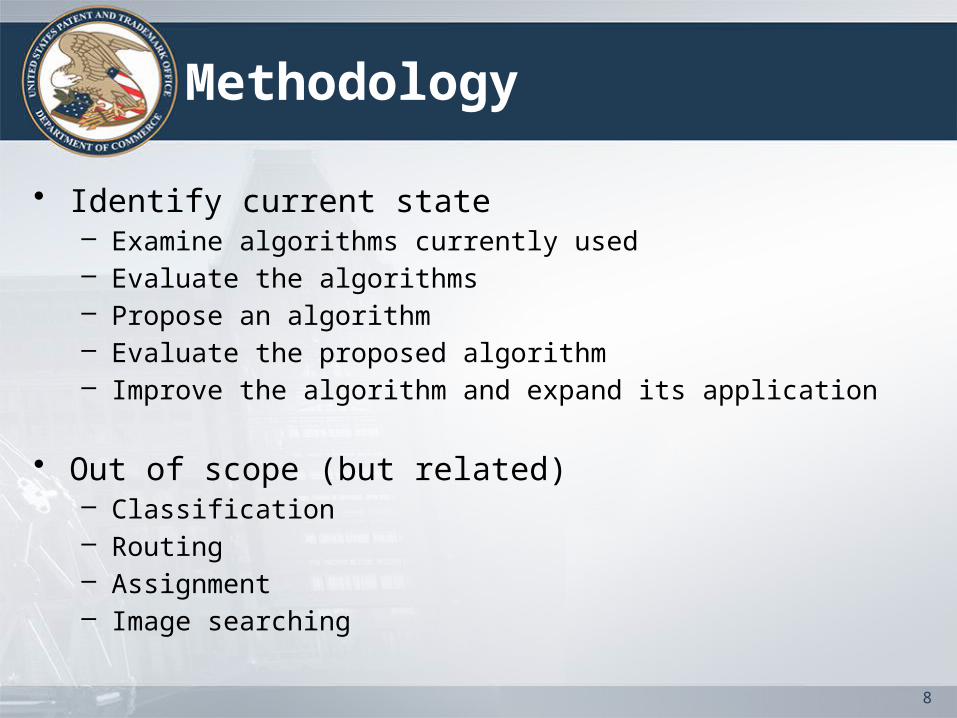
Methodology
• Identify current state– Examine algorithms currently used– Evaluate the algorithms– Propose an algorithm– Evaluate the proposed algorithm– Improve the algorithm and expand its application
• Out of scope (but related)– Classification– Routing– Assignment– Image searching

9
Example Search in EAST
Seq. Words Hits
S1 (website “web site” webpage “web page” internet interactive server online “online”) with (purchase customer buyer consumer user)
520,887
S2 ((data near (mine mining)) ((statistical purchase history) near (analyz$3 analys$3)) ((past history future) near (purchase)))
91,143
S3 (discount coupon (reduc$5 near (fee price cost))) with (bulk group ((many multiple two more number) near2 (user consumer customer purchaser buyer)))
11,023
S4 S1 & S2 & S3 1,036

10
Analysis of Current Tools
Pros Cons
Google • Fast response time• Some algorithm transparency
and filtering
• Lack of algorithm transparency
• Concerns about use of search data
IP.com • Some filtering of results • Lack of algorithm transparency
PLUS • Internal to the USPTO• USPTO controls the system
• Relatively slow response time• Lack of algorithm
transparency• Lack of filtering of results• Issues related to scalability of
platform

11
User Centered Design Council (UCDC)
• Working group of 12 examiners from 2100, 2400, and 3600
• Co-Chaired with Examiner Jamie Kucab
• Evaluation of language processing engines:– 1: §102 reference or §103 base reference– 2: secondary §103 reference– 3: not applicable
• Three applications, one in each area

12
UCDC Evaluations
One application in each Technology Center4 references for each tool
(surprisingly, there was little overlap of references)N = 48

13
Proposed Algorithm
1. Each application and reference is clustered based on its classification; classification vectors are used to find nearest neighbors
2. Stemming and lemmatization are done within each category for subsequent analysis
3. K-NN is used to look at the nearest neighbors
4. Results may be filtered to look within as well as across clusters
5. Art may be added and subtracted from clusters
6. Clusters may be created or retired
14
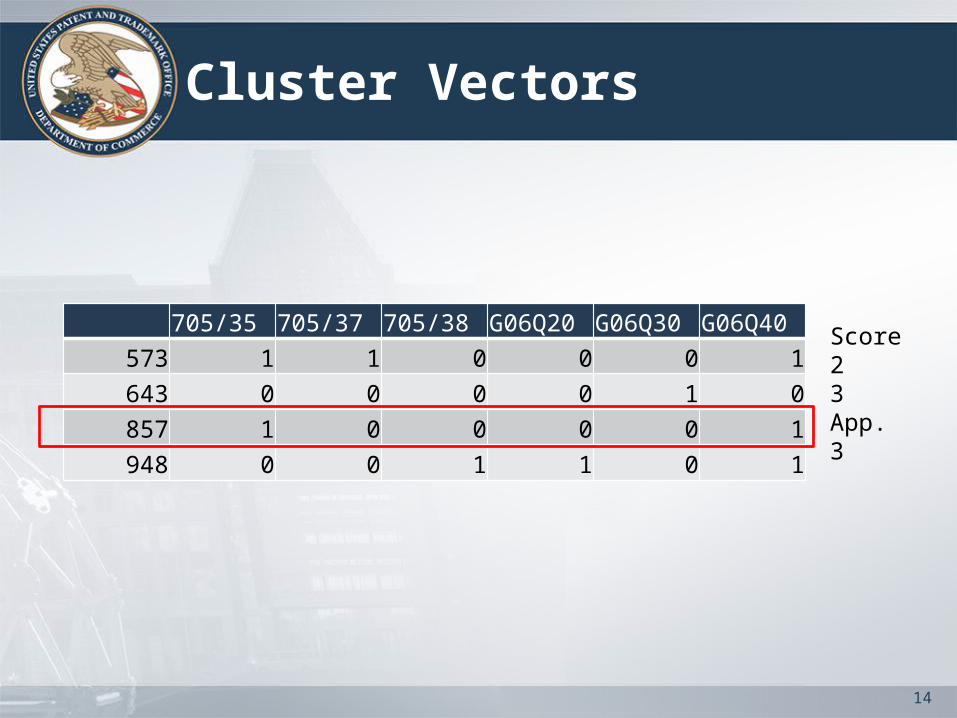
Cluster Vectors
705/35 705/37 705/38 G06Q20 G06Q30 G06Q40573 1 1 0 0 0 1643 0 0 0 0 1 0857 1 0 0 0 0 1948 0 0 1 1 0 1
Score23App.3

15
2. Stemming and Lemmatization
Word Frequency Count for U.S. Cl. 705/35857 (app - claim) 573 (prior art) stem match? lemmatization match?
aggregating aggregator yes yes
aggregating pooled no yes
bulk sale sale no no
catalogue catalog yes yes
encryption encryption yes yes
online interent no yes
threshold number limit no yes
web site web server no yes

16
3. Clustering and 4. Filtering
Example clusters

17
5. Add/Subtract
• Add– When new prior art is cited by the courts, examiners– When examiners (or the crowd?) thinks it belongs
• Subtract– When a reference becomes too old– When a reference is reclassified– When examiners (or the crowd?) thinks it doesn’t
belong
18
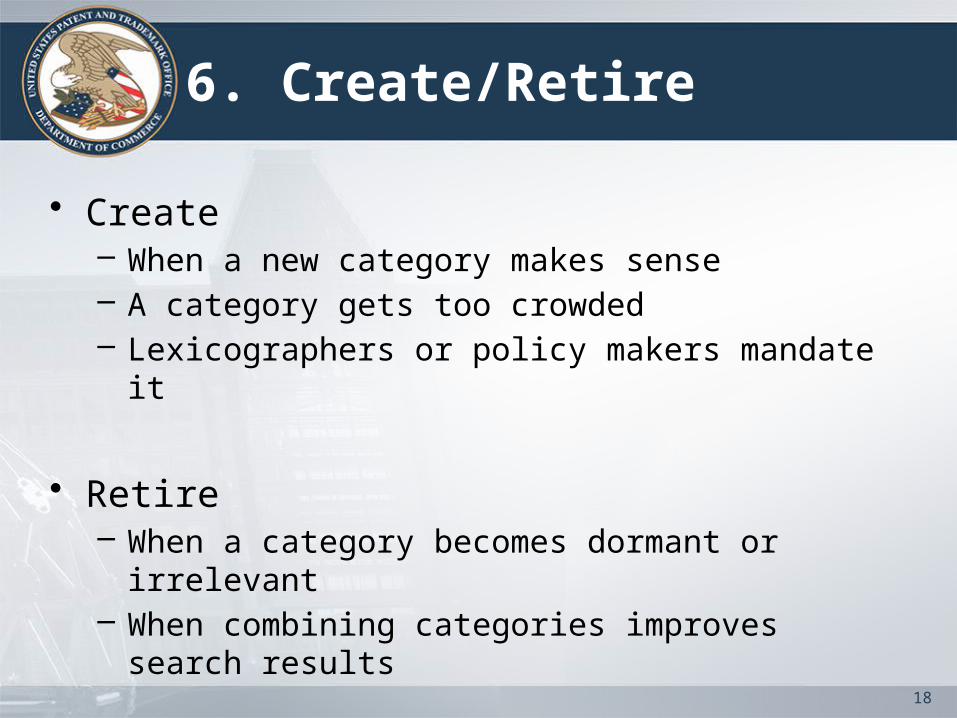
6. Create/Retire
• Create– When a new category makes sense– A category gets too crowded– Lexicographers or policy makers mandate it
• Retire– When a category becomes dormant or irrelevant– When combining categories improves search results

19
Prototype Design: Requirements
• Input– Intuitive– Easy– Claim search vs. QBE
• System– Low latency– Transparent Algorithm– Learning Algorithm
• Output– Filtering– Connection to EAST

20
Algorithm Evaluation
Submit PLUS
request
Current Algorithm
Results
Prototype Algorithm
Prototype Results
Art areas 2100/ 2400/ 3600?
no
yes
This is what we will build
Comparisondone byexaminerfocus group

21
Potential Next Steps
• Art may be annotated by humans
• Additional art may be ingested
• Examiners and the “crowd” may participate in these processes as well as 5) add/subtract and 6) create/retire

22
Conclusions
• Commercial platforms are helpful but may never be sufficient
• PLUS has a place at the PTO
• Greater investment in PLUS algorithms may improve their success
• Greater transparency, lower latency, a more scalable architecture, and improved training may improve PLUS
• Feedback loops that build on the collective knowledge of the Patent Corps may continually improve a PLUS successor

Claim Clarity at the USPTO
23
Jonas AndersonEdison Research Fellow

Fundamental Question
Can the federal court’s experience with claim construction be leveraged to improve claim clarity during examination at the PTO?
24

Claim Clarity
• For a system of property rights to function, the boundaries of those rights must be reasonably clear
• Unfortunately, boundaries for patents and other intangibles are much more difficult to identify than the boundaries of tangible objects
• Despite this limitation, there are ways to improve clarity
25

Claim Clarity at the PTO: Current Initiatives
• Examiner training for functional claiming
• Identifying PTAB decisions involving functional claiming
• Glossary pilot program
• Stakeholder engagement sessions
• Revising the quality review process26
Claim Clarity: An Overview of Academic Approaches
I. Comparative Approach
II. Doctrinal Approach
III. Administrative Approach
IV. Incentive Approach
27
28
Claim Construction Appeals
Informal Deference: A Historical, Empirical, and Normative Analysis of Patent Claim Construction, 108 Nw. U. L. Rev. 1 (2014) (with Peter S. Menell)

Claim Construction Reversal Rates: 2000-2010
29

Claim Construction Reversal Rates: 2000-2010
30
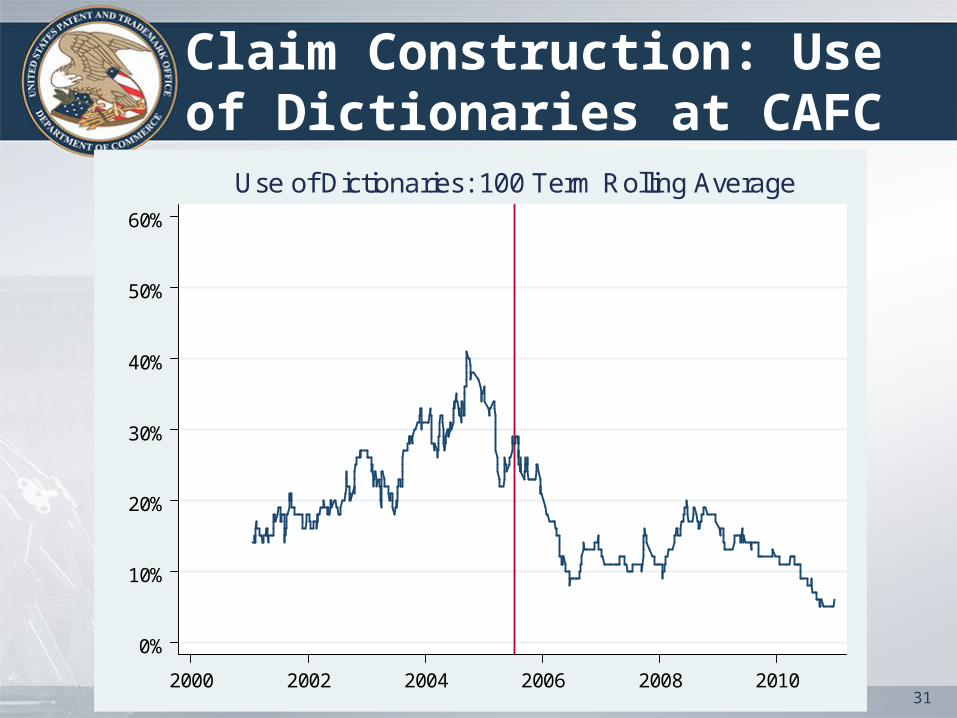
Claim Construction: Use of Dictionaries at CAFC
31
0%
10%
20%
30%
40%
50%
60%
2000 2002 2004 2006 2008 2010
Use of Dictionaries: 100 Term Rolling Average

Step 1: Quantifying the Clarity Problem in Litigation
32
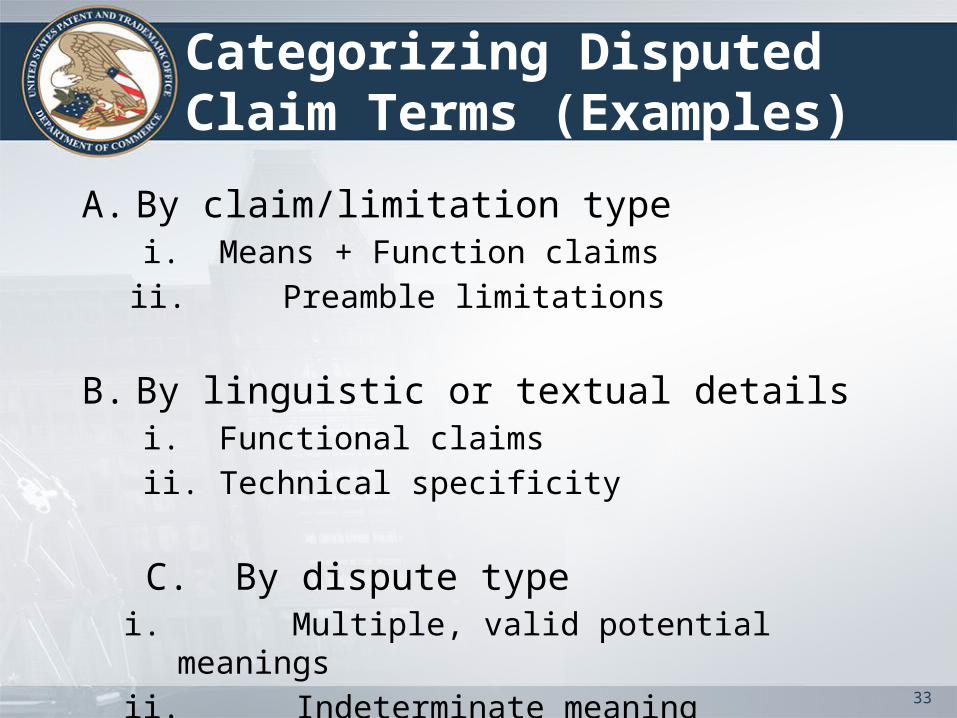
Categorizing Disputed Claim Terms (Examples)
33
A. By claim/limitation type i. Means + Function claims
ii. Preamble limitations
B. By linguistic or textual details i. Functional claims
ii. Technical specificity
C. By dispute typei. Multiple, valid potential meanings
ii. Indeterminate meaning

Disputed Claim Terms (2013 Sample)
34
“substantially isothermal process”
Patent No. 5,265,562: Internal combustion engine with limited temperature cycle

Disputed Claim Terms (2013 Sample)
35
Patent No. 6,275,821: Method and system for executing a guided parametric search
“resubmission to server”
“displaying”

Step 2: Comparing Claim Construction to Application Data
36
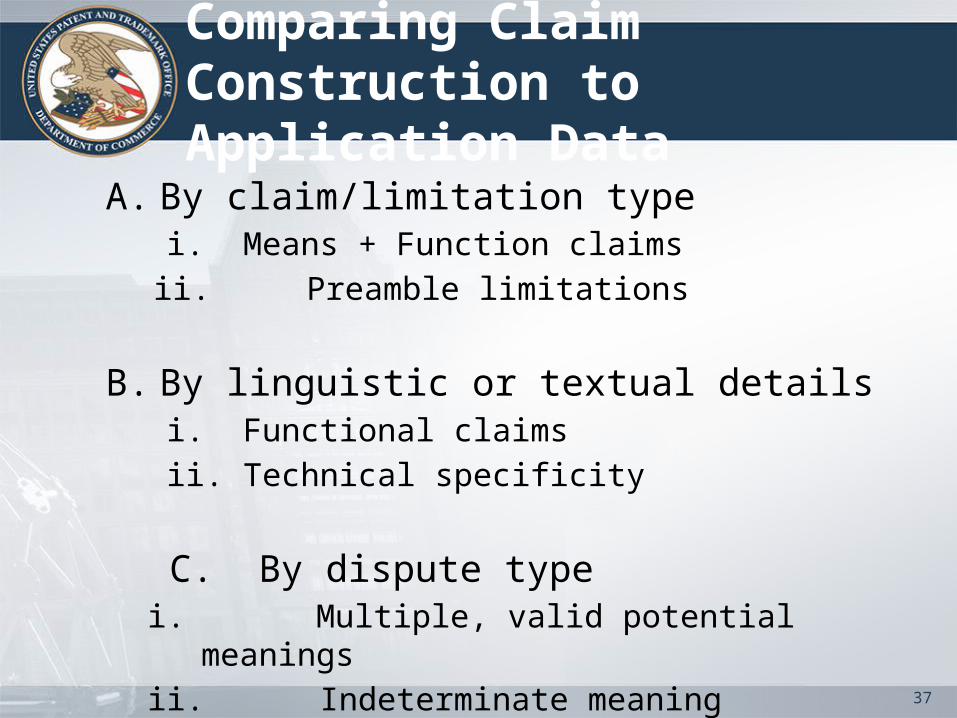
Comparing Claim Construction to Application Data
37
A. By claim/limitation type i. Means + Function claims
ii. Preamble limitations
B. By linguistic or textual details i. Functional claims
ii. Technical specificity
C. By dispute typei. Multiple, valid potential meanings
ii. Indeterminate meaning
Next Steps
1. Examining prosecution history for clarity disputes
2. Comparing prosecution database with litigation database
3. Using natural language processing to identify the frequency of patent applications that exhibit the sorts of problematic claims observed in litigation
38

Conclusions
• Claim construction litigation provides a window into the claim terms that are the most difficult to understand
• Leveraging the data from litigation can shed light on the value of claim clarity projects currently under way at the PTO
• Additionally, it may provide avenues of further study and examination
39

Patent Allowance Rates and Examination Quality
40
Deepak HegdeEdison Research Fellow

Research Questions
I. What are patent allowance rates at the USPTO?
II. How are allowance rates and examination quality related?
III. What factors affect allowance rates and examination quality?
41

Why Study Allowance Rates and Examination Quality?
42
“the problem of patent trolls is a function in part of the promiscuity with which the patent office has issued patents..” (Becker & Posner 2013)

I. What Are Patent Allowance Rates at the USPTO?
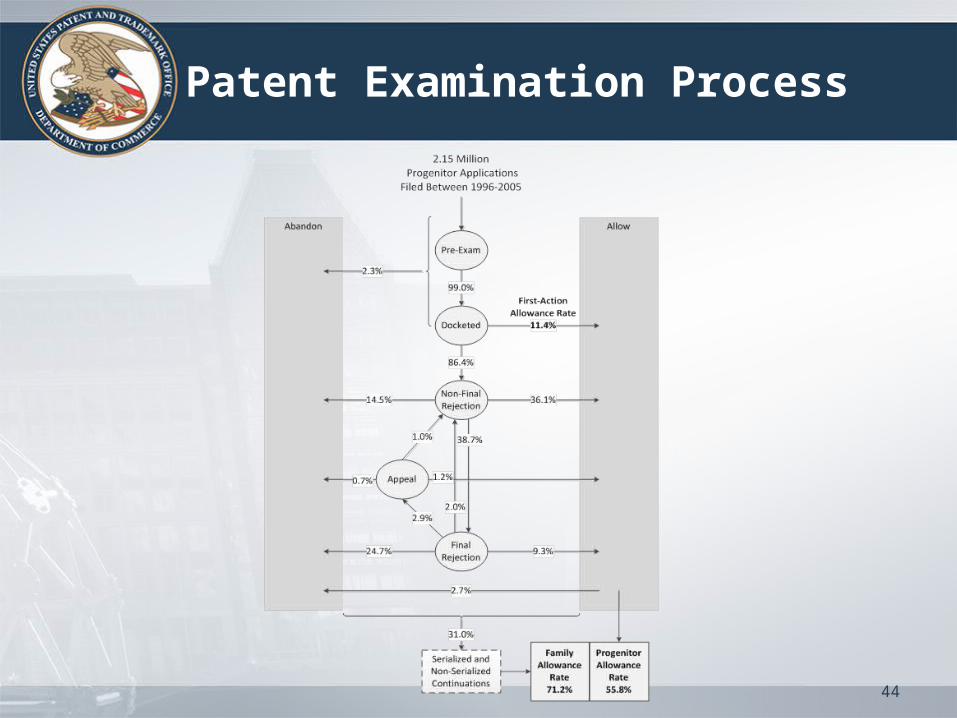
• Analyzed data on each of the 2.15 million original applications (applications unrelated to any previous application) filed between 1995 and 2005
• Each application tracked through July 31, 2013 (98.5 percent of the original applications were either granted or abandoned)
• Tracked “continuations,” many of which are docketed as new applications
43
44
Patent Examination Process
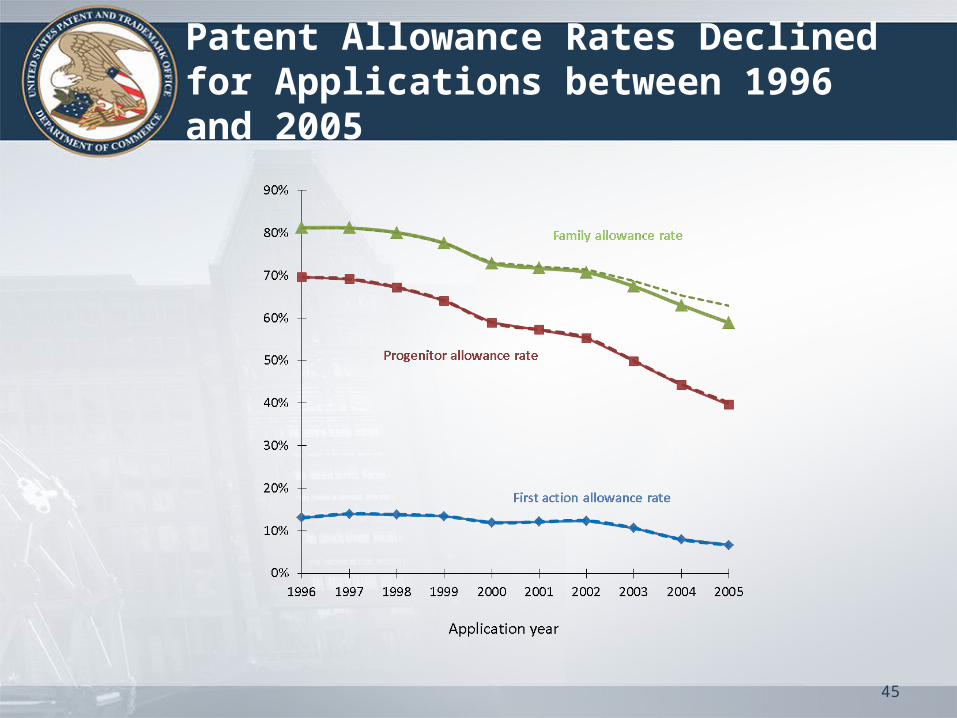
45
Patent Allowance Rates Declined for Applications between 1996 and 2005
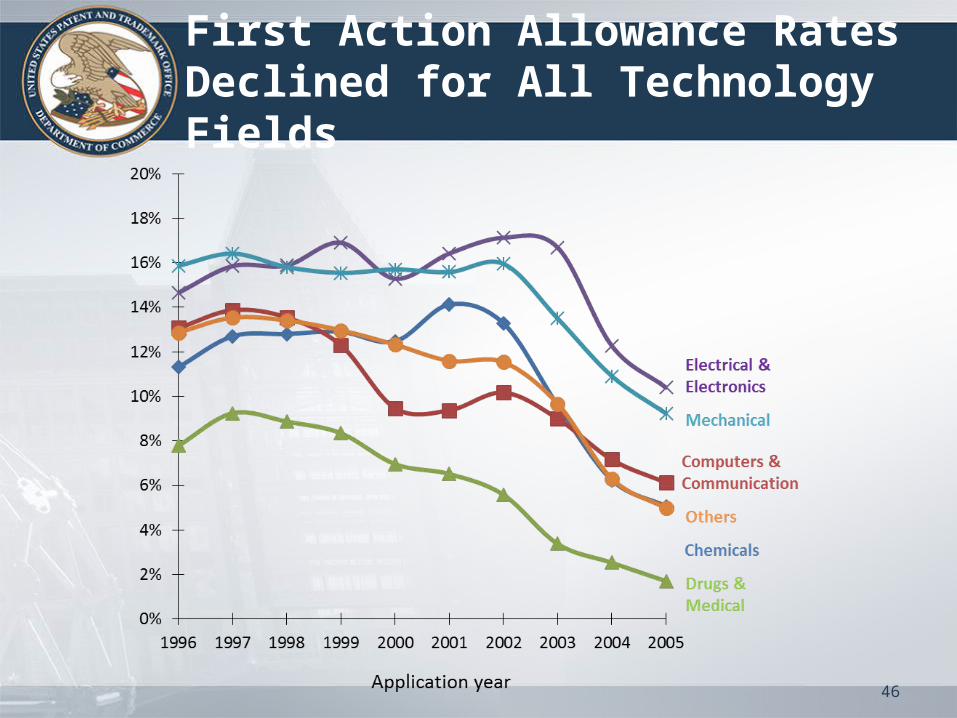
46
First Action Allowance Rates Declined for All Technology Fields

47
Progenitor Allowance Rates Declined for All Technology Fields
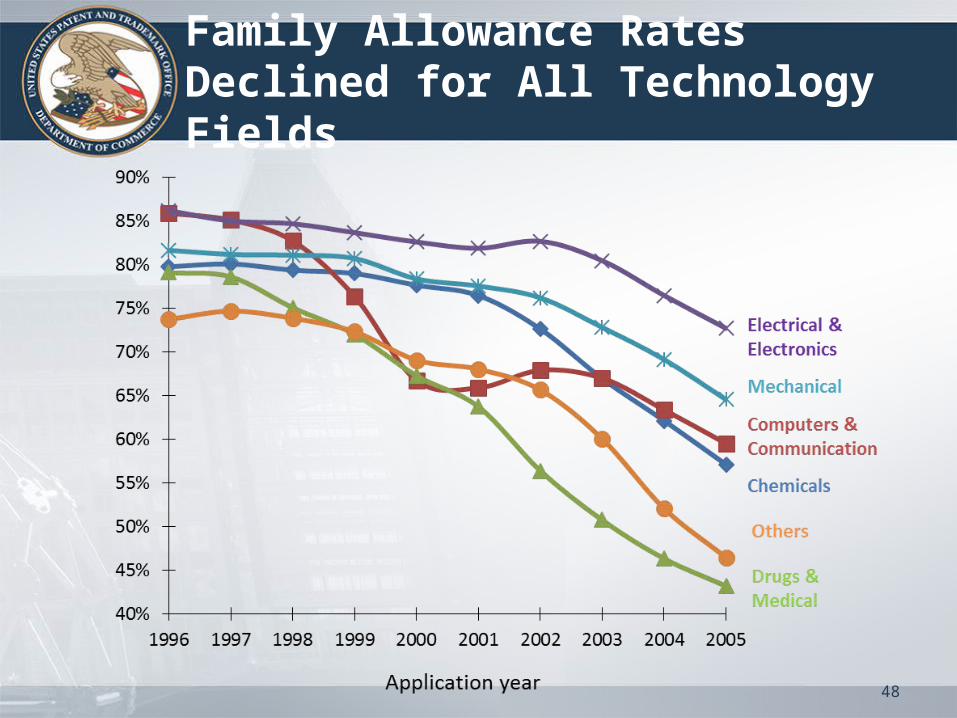
48
Family Allowance Rates Declined for All Technology Fields

What are Patent Allowance Rates at the USPTO?
Carley, M., Hegde, D., and Marco, A., What is the Probability of Receiving a US Patent?, forthcoming, Yale Journal of Law and Technology http://ssrn.com/abstract=2367149
49

Next Steps
• How are patent allowance rates related to examination quality?– How to measure examination quality?
• What factors affect patent allowance rates and examination quality?– Study the effects of examination related policies at the
USPTO
50
51
Questions/Comments

Thank You
52