edinburgh research explorer€¦ · edinburgh research explorer ... anthony di fiore, todd...
TRANSCRIPT
Edinburgh Research Explorer
Seasonal drought limits tree species across the NeotropicsCitation for published version:Muelbert, AE, Baker, TR, Dexter, K, Lewis, SL, Steege, HT, Lopez-gonzalez, G, Mendoza, AM, Brienen, R,Feldpausch, TR, Pitman, N, Alonso, A, Van Der Heijden, G, Peña-claros, M, Ahuite, M, Alexiaides, M,Dávila, EÁ, Murakami, AA, Arroyo, L, Aulestia, M, Balslev, H, Barroso, J, Boot, R, Cano, A, Moscoso, VC,Comiskey, J, Dallmeier, F, Daly, D, Dávila, N, Duivenvoorden, J, Montoya, AJD, Erwin, T, Fiore, AD,Fredericksen, T, Fuentes, A, García-villacorta, R, Gonzales, T, Guevara, JEA, Coronado, ENH,Huamantupa-chuquimaco, I, Killeen, T, Malhi, Y, Mendoza, C, Mogollón, H, Jørgensen, PM, Montero, JC,Mostacedo, B, Nauray, W, Neill, D, Vargas, PN, Palacios, S, Cuenca, WP, Camacho, NCP, Peacock, J,Phillips, JF, Pickavance, G, Quesada, CA, Ramírez-angulo, H, Restrepo, Z, Rodriguez, CR, Paredes, MR,Sierra, R, Silveira, M, Stevenson, P, Stropp, J, Terborgh, J, Tirado, M, Toledo, M, Torres-lezama, A,Umaña, MN, Urrego, LE, Martinez, RV, Gamarra, LV, Vela, C, Torre, EV, Vos, V, Von Hildebrand, P,Vriesendorp, C, Wang, O, Young, KR, Zartman, CE, Phillips, OL & Cornejo, F 2016, 'Seasonal droughtlimits tree species across the Neotropics' Ecography. DOI: 10.1111/ecog.01904
Digital Object Identifier (DOI):10.1111/ecog.01904
Link:Link to publication record in Edinburgh Research Explorer
Document Version:Peer reviewed version
Published In:Ecography
Publisher Rights Statement:© Ecography. Published by John Wiley & Sons Ltd
General rightsCopyright for the publications made accessible via the Edinburgh Research Explorer is retained by the author(s)and / or other copyright owners and it is a condition of accessing these publications that users recognise andabide by the legal requirements associated with these rights.
Take down policyThe University of Edinburgh has made every reasonable effort to ensure that Edinburgh Research Explorercontent complies with UK legislation. If you believe that the public display of this file breaches copyright pleasecontact [email protected] providing details, and we will remove access to the work immediately andinvestigate your claim.
Download date: 23. Sep. 2018

1
Seasonal drought limits tree species across the Neotropics 1
Adriane Esquivel Muelbert, Timothy R. Baker, Kyle Dexter, Simon L. Lewis, Hans ter Steege, 2
Gabriela Lopez-Gonzalez, Abel Monteagudo Mendoza, Roel Brienen, Ted R. Feldpausch, Nigel 3
Pitman, Alfonso Alonso, Geertje van der Heijden, Marielos Peña-Claros, Manuel Ahuite, Miguel 4
Alexiaides, Esteban Álvarez Dávila, Alejandro Araujo Murakami, Luzmila Arroyo, Milton Aulestia, 5
Henrik Balslev, Jorcely Barroso, Rene Boot, Angela Cano, Victor Chama Moscoso, Jim Comiskey, 6
Francisco Dallmeier, Doug Daly, Nallarett Dávila, Joost Duivenvoorden, Alvaro Javier Duque 7
Montoya, Terry Erwin, Anthony Di Fiore, Todd Fredericksen, Alfredo Fuentes, Roosevelt García-8
Villacorta, Therany Gonzales, Juan Ernesto Andino Guevara, Euridice N. Honorio Coronado, Isau 9
Huamantupa-Chuquimaco, Timothy Killeen, Yadvinder Malhi, Casimiro Mendoza, Hugo Mogollón, 10
Peter Møller Jørgensen, Juan Carlos Montero, Bonifacio Mostacedo, William Nauray, David Neill, 11
Percy Núñez Vargas, Sonia Palacios, Walter Palacios Cuenca, Nadir Carolina Pallqui Camacho, Julie 12
Peacock, Juan Fernando Phillips, Georgia Pickavance, Carlos Alberto Quesada, Hirma Ramírez-13
Angulo, Zorayda Restrepo, Carlos Reynel Rodriguez, Marcos Ríos Paredes, Rodrigo Sierra, Marcos 14
Silveira, Pablo Stevenson, Juliana Stropp, John Terborgh, Milton Tirado, Marisol Toledo, Armando 15
Torres-Lezama, María Natalia Umaña, Ligia Estela Urrego, Rodolfo Vasquez Martinez, Luis 16
Valenzuela Gamarra, César Vela, Emilio Vilanova Torre, Vincent Vos, Patricio von Hildebrand, 17
Corine Vriesendorp, Ophelia Wang, Kenneth R. Young, Charles Eugene Zartman, Oliver L. Phillips 18
19 A Esquivel Muelbert ([email protected]), T. R. Baker, S. L. Lewis, G. Lopez Gonzales, R. Brienen, J. 20
Peacock , G. Pickavance and O. L. Phillips, School of Geography, University of Leeds, Leeds, LS2 9JT, UK. 21
SLL also at: Department of Geography, University College London, London, UK - K. Dexter and R. García-22
Villacorta, Royal Botanic Garden of Edinburgh, EH3 5LR, Edinburgh, UK. KD also at School of Geosciences, 23
University of Edinburgh, Edinburgh, UK. RGV also at Institute of Molecular Plant Sciences, University of 24
Edinburgh, UK – H. ter Steege, Naturalis Biodiversity Center, PO Box, 2300 RA, Leiden, The Netherlands - A. 25
Monteagudo, V. Chama Moscoso and R. Vasquez Martinez and L. V. Gamarra, Jardín Botánico de Missouri, 26
Oxapampa, Perú – T. R. Feldpausch, Geography, College of Life and Environmental Sciences, University of 27
Exeter, EX4 4RJ, UK – N. Pitman and C. Vriesendorp, The Field Museum, 1400 S. Lake Shore Drive, Chicago, 28
IL 60605-2496, US. NP and J. Terborgh, Center for Tropical Conservation, Nicholas School of the 29
Environment, Duke University, Durham, North Carolina 27705, USA – A. Alonso and F. Dallmeier, 30
Smithsonian Conservation Biology Institute, National Zoological Park MRC 0705, Washington, DC – G. van 31
der Heijden, School of Geography, University of Nottingham, Univeristy Park, Nottingham, NG7 2RD, UK – M. 32
Peña-Claros, T. Fredericksen and M. Toledo, Instituto Boliviano de Investigacion Forestal, Santa Cruz, Bolivia, 33
and MP also at Forest Ecology and Forest Management Group, Wageningen University, PO Box 47, 6700 AA 34
Wageningen, The Netherlands – M. Ahuite , Universidad Nacional de la Amazonía Peruana, Iquitos, Perú – M. 35
Alexiaides, School of Anthropology and Conservation, University of Kent, Canterbury, Kent, UK – F. – E. 36
Álvarez Dávila, Jardín Botánico de Medellín, Medellín, Colombia - A. A. Murakami and L. Arroyo, Museo de 37
Historia Natural Noel Kempff Mercado, Santa Cruz, Bolivia – M. Aulestia, Herbario Nacional del Ecuador, 38
Quito, Ecuador -H. Balslev, University of Aarhus, Aarhus, Denmark – J. Barroso and M. Silveira, Universidade 39
Federal do Acre, Rio Branco, Brazil – R. Boot, Tropenbos International, Lawickse Allee 11, 6701 AN 40
Wageningen, The Netherlands – A. Cano and P. Stevenson, Laboratorio de Ecología de Bosques Tropicales y 41
Primatología, Universidad de Los Andes, Bogota DF, Colombia – J. Comiskey, National Park, Service, 42
Fredericksburg, VA, USA – F. Cornejo, Andes to Amazon Biodiversity Program, Madre de Dios, Perú – D. 43
Daly, New York Botanical Garden, Bronx New York, NY - N. Dávila, Universidade de Campinas, São Paulo, 44
Brazil – J. Duivenvoorden, Institute of Biodiversity and Ecosystem Dynamics, University of Amsterdam, 45
Amsterdam, the Netherlands – A. J. Duque Montoya and L. E. Urrego, Universidad Nacional de Colombia, 46
Medellin, Colombia – T. Erwin, Smithsonian Institute, Washington DC, USA – A. Di Fiore, Department of 47
Anthropology, University of Texas at Austin, Austin, TX 78712, USA – A. Fuentes and P. M. Jørgensen, 48
Missouri Botanical Garden, P.O. Box 299, St. Louis, MO63166-0299, USA – T. Gonzales, ACEER Fundation, 49
Jiron Cusco N° 370, Puerto Maldonado, Perú – J. E. A. Guevara - Department of Integrative Biology, 50
University of California, Berkeley, CA 94720-3140, USA – E. N. Honorio Coronado, Instituto de 51
Investigaciones de la Amazonia Peruana, Iquitos, Peru – I. Huamantupa-Chuquimaco, Herbario CUZ, 52
2
Universidad Nacional San Antonio Abad del Cusco, Perú – T. Killeen, World Wildlife Fund, Washington, DC, 53
USA - Y. Malhi, Environmental Change Institute, Oxford University Centre for the Environment, South Parks 54
Road, Oxford, UK – C. Mendoza, Forest Management in Bolivia, Sacta, Bolivia - Endangered Species 55
Coalition, , Silver Spring, MD, USA – J. C. Montero, Institute of Silviculture, University of Freiburg, Freiburg, 56
Germany – B. Mostacedo, Universidad Autónoma Gabriel René Moreno, Facultad de Ciencias Agrícolas, Santa 57
Cruz, Bolivia – W. Nauray, P. Núñez Vargas and N. C. Pallqui Camacho, Universidad de San Antonio Abad del 58
Cusco, Perú - D. Neill, Universidad Estatal Amazónica, Puyo, Pastaza, Ecuador – S. Palacios, Herbario de la 59
Facultad de Ciencias Forestales, Universidad Nacional Agraria La Molina, Lima, Perú – W. Palacios Cuenca, 60
Escuela de Ingeniería Forestal, Universidad Técnica del Norte, Ecuador – J. F. Phillips and P. von Hildebrand, 61
Fundacion Puerto Rastrojo, Cra 10 No. 24-76 Oficina 1201, Bogota, Colombia – C. A. Quesada and C. E. 62
Zartman, Instituto Nacional de Pesquisas da Amazônia, Av. André Araújo 2936, Petrópolis, 69060-001, 63
Manaus , AM, Brazil – H. Ramírez-Angulo, A. Torres-Lezama and E. Vilanova Torre, Universidad de Los 64
Andes, Merida, Venezuela – Z. Restrepo, Grupo de Servicios Ecosistemicos y Cambio Climático, Jardín 65
Botánico de Medellín, Medellín, Colombia - C. Reynel Rodriguez, Universidad Nacional Agraria La Molina 66
(UNALM), Perú– J. Stropp, Institute of Biological and Health Sciences, Federal University of Alagoas, Maceió, 67
AL, Brazil – M. Tirado, Geoinformática y Sistemas, Cia. Ltda. (GeoIS), Quito, Ecuador - M. N. Umaña, 68
Department of Biology, University of Maryland, College Park, Maryland 20742 USA – C. Vela, Facultad de 69
Ciencias Forestales y Medio Ambiente, Universidad Nacional de San Antonio Abad del Cusco, Jr. San Martín 70
451, Puerto Maldonado, Madre de Dios, Perú –V. Vos, Universidad Autónoma del Beni Riberalta, Beni, Bolivia 71
– O. Wang, Northern Arizona University, S San Francisco St, Flagstaff, AZ 86011, USA – K. R. Young, 72
Geography and the Environment, University of Texas, Austin, Texas, US. 73
74
3
ABSTRACT 75
Within the tropics, the species richness of tree communities is strongly and positively 76
associated with precipitation. Previous research has suggested that this macroecological pattern 77
is driven by the negative effect of water-stress on the physiological processes of most tree 78
species. This process implies that the range limits of taxa are defined by their ability to occur 79
under dry conditions, and thus in terms of species distributions it predicts a nested pattern of 80
taxa distribution from wet to dry areas. However, this ‘dry-tolerance’ hypothesis has yet to be 81
adequately tested at large spatial and taxonomic scales. Here, using a dataset of 531 inventory 82
plots of closed canopy forest distributed across the Western Neotropics we investigated how 83
precipitation, evaluated both as mean annual precipitation and as the maximum climatological 84
water deficit, influences the distribution of tropical tree species, genera and families. We find 85
that the distributions of tree taxa are indeed nested along precipitation gradients in the western 86
Neotropics. Taxa tolerant to seasonal drought are disproportionally widespread across the 87
precipitation gradient, with most reaching even the wettest climates sampled; however, most 88
taxa analysed are restricted to wet areas. Our results suggest that the ‘dry tolerance’ hypothesis 89
has broad applicability in the world’s most species-rich forests. In addition, the large number 90
of species restricted to wetter conditions strongly indicates that an increased frequency of 91
drought could severely threaten biodiversity in this region. Overall, this study establishes a 92
baseline for exploring how tropical forest tree composition may change in response to current 93
and future environmental changes in this region. 94
95
4
Introduction 96
A central challenge for ecologists and biogeographers is to understand how climate 97
controls large-scale patterns of diversity and species composition. Climate-related gradients in 98
diversity observed by some of the earliest tropical biogeographers, including the global 99
latitudinal diversity gradient itself (e.g. von Humboldt 1808, Wallace 1878), are often 100
attributed to the physiological limitations of taxa imposed by climate conditions (e.g. 101
Dobzhansky 1950). This idea is expressed in the ‘physiological tolerance hypothesis’ (Currie 102
et al. 2004, Janzen 1967), which posits that species richness varies according to the tolerances 103
of individual species to different climatic conditions. Thus, species able to withstand extreme 104
conditions are expected to be widely distributed over climatic gradients, while intolerant 105
species would be constrained to less physiologically challenging locations and have narrower 106
geographical ranges. An implicit assumption of this hypothesis is that species’ realized niches 107
tend to reflect their fundamental niches, and a key implication of the hypothesis is that past, 108
present, and future distributions of species will tend to track changes in climate (Boucher-109
Lalonde et al. 2014). 110
Within the tropics tree diversity varies considerably, possibly as a consequence of 111
variation in water supply (e.g. ter Steege et al. 2003). Water-stress is indeed one of the most 112
important physiological challenges for tropical tree species (Brenes-Arguedas et al. 2011, 113
Engelbrecht et al. 2007), and precipitation gradients correlate with patterns of species richness 114
at macroecological scales (Clinebell et al. 1995, ter Steege et al. 2003). In particular, tree 115
communities in wetter tropical forests tend to have a greater number of species than in drier 116
forests (Clinebell et al. 1995, Gentry 1988, ter Steege et al. 2003). If this pattern were driven 117
by variation among species in the degree of physiological tolerance to dry conditions, then we 118
would predict that all tropical tree species could occur in wet areas whilst communities at the 119
5
dry extremes would be made up of a less diverse, drought-tolerant subset. Thus, we would 120
expect a nested pattern of species’ occurrences over precipitation gradients, characterised by 121
widespread dry-tolerant species and small-ranged species restricted to wet environments. In 122
this paper we refer to this scenario as the dry tolerance hypothesis (Fig. 1 a). 123
Alternatively, nestedness may not be the predominant pattern for tropical tree 124
metacommunities over precipitation gradients. Multiple studies have documented substantial 125
turnover in floristic composition over precipitation gradients in tropical forests (Condit et al. 126
2013, Engelbrecht et al. 2007, Pitman et al. 2002, Quesada et al. 2012). This pattern could be 127
driven by a trade-off between shade-tolerance and drought-tolerance (e.g. Brenes-Arguedas et 128
al. 2013, Markesteijn et al. 2011). Whilst drought-tolerant species tend to have a higher 129
capacity for water conductance and CO2 assimilation under water-limiting conditions, they 130
grow more slowly in the scarce understory light of wet forests where shade-tolerant species 131
have a competitive advantage (Brenes-Arguedas et al. 2011, Brenes-Arguedas et al. 2013, 132
Gaviria and Engelbrecht 2015). Drought-tolerant species are also apparently more vulnerable 133
to pest damage in moist areas (Baltzer and Davies 2012, Spear et al. 2015). Thus, in less 134
physiologically stressful environments, tropical tree species’ occurrences could be limited by 135
stronger biotic interactions, both with competitors and natural enemies (MacArthur 1972, 136
Normand et al. 2009). In a scenario in which both wet and dry limitations to species 137
distributions are equally important, we would expect progressive turnover of species’ identities 138
along precipitation gradients (cf. Fig. 1b), rather than the nested pattern described above. 139
Both nested and turnover patterns have to some extent been documented in the tropics. 140
A nested pattern has been detected in the Thai-Malay peninsula where widespread species, 141
occurring across both seasonal and aseasonal regions, are more resistant to drought than species 142
restricted to aseasonal areas (Baltzer et al. 2008). Across the Isthmus of Panama, Engelbrecht 143
et al. (2007) found a direct influence of drought sensitivity on species’ distributions, whilst 144

6
light requirements did not significantly limit where species occur, which is consistent with the 145
mechanisms underlying a nested pattern of species distributions. Also in Panama, another 146
experimental study found that pest pressure was similar for species regardless of their 147
distribution along a precipitation gradient (Brenes-Arguedas et al. 2009), indicating that the 148
distributions of taxa that occur in drier forests may not be constrained by pest pressure. 149
However, recent data from the same area show that drought-tolerant species are more likely to 150
die than drought-intolerant taxa when attacked by herbivores or pathogens (Spear et al. 2015). 151
Furthermore, when comparing two sites, an aseasonal (Yasuní; ca. 3200 mm y-1 rainfall) and 152
seasonal (Manu; ca. 2300 ca. mm y-1) forest in lowland western Amazonia, Pitman et al. (2002) 153
reported that similar proportion of species were unique to each (Yasuní, 300 exclusive species 154
out of 1017; Manu, 200 out of 693). The presence of a similar and large proportion of species 155
restricted to each site is consistent with species distributions showing a pattern of turnover 156
among sites. While there is thus evidence of both nestedness and turnover in tropical tree 157
species distributions, a comprehensive investigation at large scale is lacking. 158
There are various approaches to estimate the tolerance of taxa to water-stress. For 159
example, experimental studies of drought imposed on trees provide the clearest indicator of 160
sensitivity to water-stress and provide insight into the ecophysiological mechanisms involved. 161
Yet in the tropics, these are inevitably constrained to a minor proportion of tropical diversity, 162
limited by tiny sample sizes (e.g. da Costa et al. 2010, Nepstad et al. 2007) and practical 163
challenges of achieving any spatial replication and of integrating effects across multiple life 164
stages (e.g. Brenes-Arguedas et al. 2013). By contrast, observational approaches, which consist 165
of mapping species’ distributions across precipitation gradients, could potentially indicate the 166
sensitivity of thousands of species to dry or wet conditions (e.g. Slatyer et al. 2013). Fixed-area 167
inventories of local communities from many locations, offer a particular advantage for this 168
kind of study as they avoid the bias towards more charismatic or accessible taxa that affects ad 169
7
hoc plant collection records (Nelson et al. 1990, Sastre and Lobo 2009). Inventory-based 170
attempts to classify tropical tree taxa by their affiliations to precipitation regimes have already 171
advanced the understanding of species precipitation niches (e.g. Butt et al. 2008, Condit et al. 172
2013, Fauset et al. 2012), but have been fairly limited in terms of spatial scale, number of 173
sample sites and taxa. In this paper we apply this inventory-based approach to investigate the 174
macroecological patterns of trees across the world’s most species-rich tropical forests, those of 175
the Western Neotropics, an area of 3.5 million km2 that encompasses Central America and 176
western South America. Because species richness in this region is so high, meaning that 177
individual species’ identifications are often challenging, we also explore whether analyses at 178
the genus - or family - level offers a practical alternative for assessing the impacts of water-179
stress on floristic composition. 180
We selected the Western Neotropics as our study area for two reasons. First, there is 181
substantial variability in climate at small spatial scales relative to that of the entire region, 182
meaning that associations between precipitation and floristic composition are less likely to be 183
the result of dispersal limitation and potential concomitant spatial autocorrelation in species’ 184
distributions. The Andean Cordilleras block atmospheric moisture flow locally, maintaining 185
some areas with very low precipitation levels, whilst enhancing orographic rainfall in adjacent 186
localities (Lenters and Cook 1995). As a result, there are wetter patches surrounded by drier 187
areas across the region, such as the wet zones in central Bolivia and in South East Peru (Fig. 188
2). The inverse is also observed, such as the patches of drier forests south of Tarapoto in central 189
Peru. There is also a general tendency for precipitation to decline away from the equator in 190
both northward and southward directions (Fig. 2). Secondly, the western Neotropics is a 191
cohesive phylogeographic unit. Western Amazonian forests are floristically more similar to 192
forests in Central America than to those in the Eastern Amazon, despite the greater distances 193
involved and the presence of the world's second highest mountain range dividing Central 194

8
America from southern Peru (Gentry 1990). This floristic similarity between the western 195
Amazon and Central American forests is thought to be because: (1) the Andes are young 196
(~25Ma) so represent a recent phytogeographic barrier (Gentry 1982, Gentry 1990), and (2) 197
the soils of moist forests in western Amazonia and Central America are similar, being young, 198
relatively fertile, and often poorly structured, largely as a consequence of the Andean uplift 199
and associated Central American orogeny (Gentry 1982, Quesada et al. 2010). 200
Here, we use a unique, extensive forest plot dataset to investigate how precipitation 201
influences the distribution of tree taxa, at different taxonomic levels, across the Western 202
Neotropics. Using 531 tree plots that include 2570 species, we examine the climatic 203
macroecology of the region’s tropical trees. Specifically, we 1) test the dry tolerance 204
hypothesis, which posits that tolerance to dry extremes explains taxa geographic ranges within 205
closed-canopy forests (Fig. 1a); and 2) quantify the affiliations of taxa to precipitation using 206
available data, in order to assess individual taxon-climate sensitivities and predict how tropical 207
trees may respond to potential future climatic changes. 208
209
Methods 210
Precipitation in the Western Neotropics 211
To investigate the effects of water-stress on the distribution of tropical forest taxa we 212
used the maximum climatological water deficit (CWD) (Chave et al. 2014). This metric 213
represents the sum of water deficit values (i.e. the difference between precipitation and 214
evapotranspiration) over consecutive months when evapotranspiration is greater than 215
precipitation. CWD values were extracted at a 2.5 arc-second resolution layer, based on 216
interpolations of precipitation measurements from weather stations between 1960 and 1990 217
and evapotranspiration calculated using the same data (New et al. 2002) (Supplementary 218
9
material Appendix 1). Additionally, we used mean annual precipitation (MAP) from the 219
WorldClim database (Hijmans et al. 2005) to quantify total annual precipitation. MAP values 220
are derived from interpolations of weather station data with monthly records between ca. 1950 221
and 2000 at a resolution equivalent to ca. 1 km2. Although these datasets have different grain 222
sizes, the underlying data used in both interpolations have the same spatial scale (Chave et al. 223
2014, Hijmans et al. 2005). 224
Vegetation data set 225
We used data from 531 floristic inventories from three plot networks: ATDN (ter Steege 226
et al. 2013, ter Steege et al. 2003), RAINFOR (Malhi et al. 2002) and Gentry and Phillips plots 227
(Gentry 1988, Phillips and Miller 2002, Phillips et al. 2003), distributed throughout the Western 228
Neotropics (see Supplementary material Appendix 2). Plot areas varied from 0.1 to 5.0 ha. We 229
included all trees with a diameter (D) ≥ 10 cm. Our analysis was restricted to lowland terra 230
firme forests below 1000 m.a.s.l., excluding all lianas. The RAINFOR and Gentry / Phillips 231
datasets were downloaded from ForestPlots.net (Lopez-Gonzalez et al. 2009, Lopez-Gonzalez 232
et al. 2011). 233
The plots in our dataset provide a largely representative sample of actual precipitation 234
values across all western neotropical lowland forests (see Supplementary material Appendix 235
3). However, the dataset only includes 18 plots in very wet environments (above 3500 mm y-236
1, Fig. A3.2), which are largely confined to small pockets on both flanks of the Andes. Because 237
this sampling (3% of all plots) is insufficient to accurately determine species’ occurrences and 238
ranges in the wettest forests, we restricted our precipitation and taxa distribution analyses (see 239
below) to the 513 plots with MAP ≤ 3500 mm y-1. 240
Analyses 241

10
Precipitation and diversity 242
If water supply broadly limits species’ distributions, then community-level diversity 243
should also be controlled by precipitation regime. However, variation in local diversity is 244
nevertheless expected as a consequence of other factors (ter Steege et al. 2003). For example, 245
even under wet precipitation regimes, local edaphic conditions such as extremely porous soils 246
could lead to water stress and lower diversity. Therefore, we fitted a quantile regression 247
(Koenker and Bassett 1978), describing the role of precipitation in controlling the upper bound 248
of diversity. Diversity was quantified using Fisher’s α because this metric is relatively 249
insensitive to variable stem numbers among plots. In addition, to assess whether the correlation 250
between diversity and precipitation is robust to the potential influence of spatial autocorrelation 251
we applied a Partial Mantel test (Fortin and Payette 2002), computing the relationship between 252
the Euclidian distances of diversity and precipitation, whilst controlling for the effect of 253
geographic distances. Lastly, we also used Kendal’s τ non-parametric correlation coefficient to 254
assess the relationship between diversity and precipitation. We restricted all diversity analyses 255
to the 116 1-ha plots that had at least 80% of trees identified to species level. 256
Metacommunity structure 257
We used the approach of Leibold and Mikkelson (2002) to test whether the distribution 258
of taxa along the precipitation gradient follows a turnover or nested pattern. Our analysis was 259
performed by first sorting the plots within the community matrix by their precipitation regimes. 260
Then we assessed turnover by counting the number of times a taxon replaces another between 261
two climatologically adjacent sites and comparing this value to the average number of 262
replacements found when randomly sorting the matrix 1000 times. More replacements than 263
expected by chance indicate a turnover structure, whilst fewer imply that the metacommunity 264
follows a nested pattern (Presley et al. 2010) as predicted by the dry tolerance hypothesis. This 265
11
analysis was conducted applying the function Turnover from the R package metacom (Dallas 266
2014). 267
Precipitation and taxa distribution 268
To explore the influence of precipitation on taxa distributions firstly, we simply plotted taxa 269
precipitation ranges, i.e. the range of precipitation conditions in which each taxon occurs, to 270
visually inspect the variation of precipitation ranges among taxa. According to the dry tolerance 271
hypothesis, for each taxon the precipitation range size should be positively associated with the 272
driest condition at which it is found, i.e. the more tolerant to dry conditions the taxon is, the 273
larger its climatic span should be. However, the predicted pattern could also arise artefactually 274
if taxa that occur under extreme regimes have on average bigger ranges regardless of whether 275
they are associated to dry or wet conditions. We therefore, secondly, used Kendall’s τ 276
coefficient of correlation to explore analytically the relationship between taxon precipitation 277
range and both the driest and wettest CWD values at which each taxon occurs. If the dry 278
tolerance hypothesis holds we expect precipitation range size to be negatively correlated with 279
the driest precipitation condition where each taxon occurs and not correlated with wettest 280
precipitation where each taxon is found. 281
Thirdly, we compared taxa discovery curves, which represent the cumulative 282
percentage of taxa from the whole metacommunity that occur in each plot when following 283
opposite environmental sampling directions, i.e. from wet to dry and from dry to wet. The dry 284
tolerance hypothesis predicts that wet to dry discovery curves should be steeper initially than 285
dry to wet curves, as wet areas are expected to have more narrow-ranged taxa. 286
Finally, we examined the loss of taxa from extremely wet and from extremely dry plots 287
over the precipitation gradient. We tested whether tree taxa found at the driest conditions within 288
our sample can tolerate a larger range of precipitation conditions than taxa in the wettest plots. 289
12
We thus generated taxa loss curves to describe the decay of taxa along the precipitation gradient 290
within the 10% driest plots and the 10% wettest plots. 291
We compared discovery and loss curves in different directions of the precipitation 292
gradient (i.e. from wet to dry and from dry to wet) against each other and against null models 293
of no influence of precipitation on taxa discovery or loss. These null models represented the 294
mean and confidence intervals from 1000 taxa discovery and loss curves produced by randomly 295
shuffling the precipitation values attributed to each plot. Taxa recorded in 10 plots or fewer are 296
likely to be under-sampled within the metacommunity and were excluded from the analyses 297
regarding metacommunity structure and taxa distribution. 298
Taxa precipitation affiliation 299
To describe the preferred precipitation conditions for each taxon we generated an index 300
of precipitation affiliation, or precipitation centre of gravity (PCG). We adopted a similar 301
approach to that used to estimate the elevation centre of gravity by Chen et al. (2009) (see also 302
Feeley et al. 2011), which consisted of calculating the mean of precipitation of locations where 303
each taxon occurs in, weighted by the taxon’s relative abundance in each community (Equation 304
1). 305
PCG = ∑ 𝑃×𝑛1 𝑅𝑎
∑ 𝑅𝑎𝑛1
(1) 306
Where: n = number of plots 307
P = precipitation 308
Ra = relative abundance based on number of individuals 309
The resulting taxon-level PCG values are in units of millimetres per year, the same 310
scale as the precipitation variables: CWD or MAP. We tested the null hypothesis of no 311
influence of precipitation on the distribution of each taxon by calculating the probability of an 312
13
observed PCG value being higher than a PCG generated by randomly shuffling the 313
precipitation records among the communities, following Manly (1997) (Supplementary 314
material Appendix 4). We also generated an alternative estimator of precipitation affiliation for 315
each taxon by correlating its plot-specific relative abundance and precipitation values using 316
Kendall’s τ coefficient of correlation (following Butt et al. 2008). Here, a negative correlation 317
indicates affiliation to dry conditions, whilst a positive correlation indicates affiliation to wet 318
conditions (Supplementary material Appendix 6). 319
PCG values were calculated for each taxon recorded in at least three localities (1818 320
species, 544 genera and 104 families), and Kendall’s τ values were calculated for each taxon 321
recorded in at least 20 localities (525 species, 327 genera and 78 families). We also calculated 322
the proportions of significantly dry- and wet-affiliated taxa. To verify that these proportions 323
were not merely a consequence of the number of taxa assessed, we compared our observed 324
proportions to 999 proportions calculated from random metacommunity structures where taxa 325
abundances were shuffled among plots (Supplementary material Appendix 5). 326
Each analysis was repeated at family, genus and species levels. All analyses were 327
performed for CWD, and precipitation affiliations were also calculated for MAP. Analyses 328
were carried out in R version 3.1.1 (R Core Team 2014). 329
Results 330
In the Western Neotropics, diversity was negatively related to water-stress at all 331
taxonomic levels, being strongly limited by more extreme negative values of maximum 332
climatological water deficit (CWD) (Fig. 3). This result remained after accounting for possible 333
spatial autocorrelation (Partial Mantel test significant at α = 0.05 for all taxonomic levels: r = 334
0.31 for species; r = 0.38 for genera; r = 0.37 for families). The large increase in diversity 335

14
towards the wettest areas was most evident at the species level (around 200-fold), but was also 336
strong at genus (ca. 70-fold) and family levels (ca. 16-fold) (Fig. 3). 337
For all our analyses of taxa distributions it was evident that they follow a nested pattern 338
along the water-deficit gradient, as predicted by the dry tolerance hypothesis. Thus, firstly, 339
when investigating metacommunity structure, among any given pair of sites, the number of 340
times a taxon replaced another was significantly lower than expected by chance at all 341
taxonomic levels (Table 1). Secondly, compared to all taxa, those able to tolerate the dry 342
extremes were clearly distributed over a wider range of precipitation regimes (Fig. 4 a-c). This 343
was confirmed by precipitation ranges being very strongly and negatively correlated to the 344
driest condition where each taxon occurs (Kendall’s τ = -0.93 for species, -0.96 for genera and 345
-0.99 for families, one-tailed P values < 0.001) and not correlated to the wettest condition of 346
occurrence (Kendall’s τ = 0.01 for species, 0.05 for genera and -0.01 for families, P-values > 347
0.05). 348
Thirdly, nested patterns were evident in most taxa discovery curves, with the floristic 349
composition of dry plots being a subset of wet plots (Fig. 4 d-f). At species and genus levels, 350
the wet-dry cumulative discovery curves were steeper than the dry-wet curves, indicating more 351
taxa restricted to wet conditions. However, this distinction in the shape of the discovery curves 352
between the directions of the precipitation gradient (wet-dry vs. dry-wet) was much less evident 353
at the family level (Fig. 4 f). Finally, the loss curve analysis also showed that plots at the wet 354
extremes of the precipitation gradient have many more taxa restricted to wet conditions than 355
expected by chance (Fig. 4 g-i). Extreme dry plots also had a much greater proportion of species 356
with wide precipitation ranges than the wettest plots, with at least 80% of their species 357
persisting until all but the very wettest forests are reached (Fig. 4 g – red curve). Again, these 358
patterns were most clearly evident for species and genera. 359

15
For the 1818 species, 544 genera and 104 families assessed across the Western 360
Neotropics, we found a large proportion of taxa with significant values for rainfall affiliation 361
(Table 2 a, Supplementary Material, Appendix 9, tables A9.1, A9.2 and A9.3). Affiliations to 362
wet conditions were substantially more common than affiliations to dry conditions at all 363
taxonomic levels (Table 2 b) (see Supplementary material Appendix 5). Anacardiaceae and 364
Rutaceae are examples of the 10 most dry-affiliated families registered in 10 or more localities 365
and Lecythidaceae, Myrsinaceae and Solanaceae are amongst the most wet affiliated families 366
(see Supplementary material Appendix 7, Tables A7.1 and A7.2 for the most wet and dry 367
affiliated taxa). Lastly, the observed patterns persisted when repeating the analyses excluding 368
those species possibly affiliated to locally enhanced water supply (Supplementary material 369
Appendix 8). 370
Discussion 371
Our results demonstrate the influence of precipitation gradients on the patterns of 372
diversity and composition for families, genera and species of Neotropical trees. We confirm 373
that community diversity is much higher in wet than in drier forests, being as much as 200-fold 374
greater at the species level (Fig. 3). Additionally, our analyses indicate that the diversity decline 375
towards more seasonal forests is a consequence of increasingly drier conditions limiting species 376
distributions. To our knowledge this is the first time that the influence of precipitation 377
affiliation has been quantified at the level of individual Amazon tree species. 378
Water-stress during the dry season, represented here by the climatological water-deficit 379
(CWD), limits tree species distributions across the Western Neotropics (Fig. 4). In areas with 380
a very negative CWD, forest composition is a subset of those communities that do not suffer 381
water-stress (Fig. 4). These findings are consistent with results from studies at much smaller 382
scales (Baltzer et al. 2008, Engelbrecht et al. 2007). The physiological challenges in dry areas 383

16
require species to have specific characteristics in order to recruit and persist. For example, 384
certain species have the capacity to maintain turgor pressure and living tissues under more 385
negative water potentials at the seedling stage, which allow them to obtain water from dry soils 386
(Baltzer et al. 2008, Brenes-Arguedas et al. 2013). At the wet extreme of the gradient, more 387
favourable conditions may allow a wider range of functional strategies to coexist (Spasojevic 388
et al. 2014). Consistent with this, most taxa in our data set occur in the wet areas, with only a 389
small proportion restricted to dry conditions (Fig. 4). Furthermore, our results indicate that 390
other factors such as pests and pathogens (Spear et al. 2015) or tolerance to shaded 391
environments (Brenes-Arguedas et al. 2013), are much less important in determining the 392
distribution of taxa. In some cases these may restrict the abundance of dry affiliated taxa but 393
generally appear not to limit their occurrence. Geomorphology and dispersal limitation can 394
impact species’ distributions, and these drivers likely account for some of the unexplained 395
variation in the relationship between diversity and precipitation shown here (Dexter et al. 2012, 396
Higgins et al. 2011). The scarcity of plots from the very wettest forests (Supplementary 397
material Appendix 3, Fig. A3.2) may also have limited our ability to fully document patterns 398
of species turnover. Nevertheless, our analysis shows that more than 90% of the species 399
occurring in the driest 10% of the neotropical forest samples are also registered in at least one 400
forest with zero mean annual CWD (Fig. 4 g). It could be argued that such widespread taxa 401
may not necessarily tolerate dry conditions, but instead be sustained by locally enhanced water 402
supply due to particular conditions such as the presence of streams. However, our results were 403
robust even after excluding taxa potentially affiliated to such local water availability 404
(Supplementary material Appendix 8). Thus, our findings, together with those from Asian and 405
Central American tropical forests (Baltzer et al. 2008, Brenes-Arguedas et al. 2009), suggest 406
that the limitation of most tree species’ distributions by water-stress may represent a general 407
macroecological rule across the tropics. This has obvious parallels to the well-known pattern 408

17
for temperate forest tree species, for which frost tolerance substantially governs species’ 409
geographical ranges (e.g. Morin and Lechowicz 2013, Pither 2003). 410
Affiliations to specific precipitation regimes are strongest at the species level, but 411
climate sensitivity can still be clearly detected with genus-level analyses (Fig. 4 d-i). The 412
stronger relationship between species and precipitation when compared to other taxonomic 413
levels could be a consequence of a relatively stronger influence of climate on recent 414
diversification. In particular, massive changes in precipitation regimes took place in the 415
Neogene and Quaternary due to Andean uplift and glacial cycles (Hoorn et al. 2010). During 416
this period, global fluctuations in climate and atmospheric CO2 concentrations, which affect 417
water-use efficiency (Brienen et al. 2011), are thought to have influenced speciation (cf. Erkens 418
et al. 2007, Richardson et al. 2001 although see Hoorn et al. 2010). Climate sensitivity was also 419
clearly evident at the genus level (Fig. 4), which has relevant practical implications for tropical 420
community and ecosystem ecology. Because of the challenges of achieving sufficient sample 421
size and accurate identification in hyperdiverse tropical forests (Martinez and Phillips 2000), 422
ecosystem process and community ecological studies in this ecosystem often rely on the 423
simplifying assumption that the genus-level represents a sufficiently functionally-coherent unit 424
to address the question at hand (e.g. Butt et al. 2014, Harley et al. 2004, Laurance et al. 2004). 425
Our results suggests that analysis at the genus-level could be used to assess, for instance, the 426
impacts of climate change on diversity, but that nevertheless such impacts would be 427
underestimated without a species-level analysis. 428
In addition to the physiological tolerance to dry conditions, other, underlying 429
geographical and evolutionary processes could conceivably drive the patterns we observe in 430
this study. These are, notably, (1) a greater extent of wet areas (Fine 2001, Terborgh 1973), (2) 431
greater stability of wet areas through time leading to lower extinction rates (Jablonski et al. 432

18
2006, Jansson 2003, Klopfer 1959), and (3) faster rates of speciation in wet forests (Allen et 433
al. 2002, Jablonski et al. 2006, Rohde 1992). The first alternative (Rosenzweig 1992) requires 434
that species-area relationships govern the climate-diversity associations that we find. Within 435
our region, the areas that do not suffer water-stress (i.e. CWD = 0) are where the great majority 436
of the species (90%) can be found (Fig. 4), yet they occupy a relatively small area (25% of the 437
Western Neotropics and 31% of plots). Thus, the area hypothesis appears unlikely to be driving 438
the precipitation-diversity relationship. 439
The other two alternative hypotheses could more plausibly be contributing to the 440
patterns observed here. Climate stability is indeed associated with diversity throughout the 441
Neotropics (Morueta-Holme et al. 2013). In contrast with most of the Amazon basin, the 442
lowland forests close to the Andes and in Central America apparently had relatively stable 443
climates, with only moderate changes during the Quaternary/Neogene (Hoorn et al. 2010), 444
which could have reduced extinction rates (Jablonski et al. 2006, Klopfer 1959). The diversity 445
gradient may also be a consequence of more diverse areas having higher diversification rates 446
(Jablonski et al. 2006, Jansson 2003, Rohde 1992). While both lower extinction rates and 447
higher speciation rates in wet forest might contribute to explaining the climate-diversity 448
gradient, their influence does not invalidate the idea that wet-affiliated species are drought-449
intolerant. Indeed, the mechanisms that might have favoured lower extinction rates in wetter 450
forests are related to the inability of many taxa to survive environmental fluctuations such as 451
droughts. Experiments showing that seedlings of species from wet tropical environments have 452
higher mortality under water-stress than dry-distributed taxa (Baltzer et al. 2008, Engelbrecht 453
et al. 2007, Poorter and Markesteijn 2008) indicate that water stress can have direct impacts on 454
species survival and distribution. As ever, untangling ecological and historical explanations of 455
patterns of diversity is difficult with data solely on species distributions (Ricklefs 2004). 456
19
Implications for climate change responses 457
Understanding how floristic composition is distributed along precipitation gradients is 458
critical to better predict outcomes for the rich biodiversity of the region in the face of climatic 459
changes. The observed small precipitation ranges of wet-affiliated taxa (Fig. 4 a-c) together 460
with the rareness of extremely wet areas (Fig. A3.2) indicate high potential vulnerability to 461
changes in climate. So far, while total precipitation has recently increased in Amazonia (Gloor 462
et al. 2013), much of Amazonia and Central America have also seen an increase in drought 463
frequency, and more generally in the frequency of extreme dry and wet events (Aguilar et al. 464
2005, Li et al. 2008, Malhi and Wright 2004, Marengo et al. 2011). These neotropical trends 465
toward similar or greater annual precipitation, but a greater frequency and intensity of dry 466
events, are expected to continue, albeit with important regional differences (IPCC 2013). While 467
elevated atmospheric CO2 concentrations may alleviate physiological impacts of water-stress 468
on plants by increasing water-use efficiency (Brienen et al. 2011, van der Sleen et al. 2015), 469
warming will have the opposite impact. Temperatures have increased markedly in Amazonia 470
since 1970 (Jiménez-Muñoz et al. 2013) and this trend is highly likely to continue (IPCC 2013) 471
so that plants will experience increased water-stress throughout Amazonia (Malhi et al. 2009) 472
with thermally-enhanced dry season water-stress challenging trees even in wetter 473
environments. The restriction of most tree taxa in the Western Neotropics to wetter areas 474
indicates widespread low tolerance to dry conditions and low capacity to acclimate to them. 475
Together with the anticipated climate changes this suggests that floristic composition may 476
change substantially, potentially with the loss of many wet forest specialists and compensatory 477
gains by the fewer, more climatologically-generalist dry tolerant species. While research is 478
clearly needed to track and analyse ecological monitoring sites to examine where and how 479
tropical forest composition responds to anthropogenic climate changes, protecting the 480

20
remaining ever-wet forests and coherent up-slope migration routes will be essential if most 481
neotropical diversity is to survive into the next century. 482
Acknowledgements 483
This paper is a product of the RAINFOR and ATDN networks and of ForestPlots.net 484
researchers (http://www.forestplots.net). RAINFOR and ForestPlots have been supported by 485
a Gordon and Betty Moore Foundation grant, the European Union’s Seventh Framework 486
Programme (283080, ‘GEOCARBON’; 282664, ‘AMAZALERT’); European Research 487
Council (ERC) grant ‘Tropical Forests in the Changing Earth System’ (T-FORCES), and 488
Natural Environment Research Council (NERC) Urgency Grant and NERC Consortium 489
Grants ‘AMAZONICA’ (NE/F005806/1) and ‘TROBIT’ (NE/D005590/1). Additional 490
funding for fieldwork was provided by Tropical Ecology Assessment and Monitoring 491
(TEAM) Network, a collaboration among Conservation International, the Missouri Botanical 492
Garden, the Smithsonian Institution, and the Wildlife Conservation Society. A.E.M. receives 493
a PhD scholarship from the T-FORCES ERC grant. O.L.P. is supported by an ERC Advanced 494
Grant and a Royal Society Wolfson Research Merit Award. We thank Jon J. Lloyd, Chronis 495
Tzedakis, David Galbraith, and two anonymous reviewers for helpful comments and Dylan 496
Young for helping with the analyses. This study would not be possible without the extensive 497
contributions of numerous field assistants and rural communities in the Neotropical forests. 498
Alfredo Alarcón, Patricia Alvarez Loayza, Plínio Barbosa Camargo, Juan Carlos Licona, 499
Alvaro Cogollo, Massiel Corrales Medina, Jose Daniel Soto, Gloria Gutierrez, Nestor 500
Jaramillo Jarama, Laura Jessica Viscarra, Irina Mendoza Polo, Alexander Parada Gutierrez, 501
Guido Pardo, Lourens Poorter, Adriana Prieto, Freddy Ramirez Arevalo, Agustín Rudas, 502
Rebeca Sibler and Javier Silva Espejo additionally contributed data to this study though their 503
RAINFOR participations. We further thank those colleagues no longer with us, Jean Pierre 504
Veillon, Samuel Almeida, Sandra Patiño and Raimundo Saraiva. Many data come from 505
Alwyn Gentry, whose example has inspired new generations to investigate the diversity of 506
the Neotropics. 507
References 508
Aguilar, E. et al. 2005. Changes in precipitation and temperature extremes in Central America and 509
northern South America, 1961–2003. — Journal of Geophysical Research: Atmospheres 110: 510
n/a-n/a. 511
Allen, A. P. et al. 2002. Global biodiversity, biochemical kinetics, and the energetic-equivalence rule. 512
— Science 297: 1545-1548. 513
Baltzer, J. L. and Davies, S. J. 2012. Rainfall seasonality and pest pressure as determinants of tropical 514
tree species' distributions. — Ecology and Evolution 2: 2682-2694. 515
Baltzer, J. L. et al. 2008. The role of desiccation tolerance in determining tree species distributions 516
along the Malay-Thai Peninsula. — Funct. Ecol. 22: 221-231. 517
Boucher-Lalonde, V. et al. 2014. Does climate limit species richness by limiting individual species' 518
ranges? — Proc. R. Soc. B-Biol. Sci. 281: 519

21
Brenes-Arguedas, T. et al. 2009. Pests vs. drought as determinants of plant distribution along a 520
tropical rainfall gradient. — Ecology 90: 1751-1761. 521
Brenes-Arguedas, T. et al. 2011. Do differences in understory light contribute to species distributions 522
along a tropical rainfall gradient? — Oecologia 166: 443-456. 523
Brenes-Arguedas, T. et al. 2013. Plant traits in relation to the performance and distribution of woody 524
species in wet and dry tropical forest types in Panama. — Funct. Ecol. 27: 392-402. 525
Brienen, R. J. W. et al. 2011. Stable carbon isotopes in tree rings indicate improved water use 526
efficiency and drought responses of a tropical dry forest tree species. — Trees-Structure and 527
Function 25: 103-113. 528
Butt, N. et al. 2014. Shifting dynamics of climate-functional groups in old-growth Amazonian forests. 529
— Plant Ecology & Diversity 7: 267-279. 530
Butt, N. et al. 2008. Floristic and functional affiliations of woody plants with climate in western 531
Amazonia. — Journal of Biogeography 35: 939-950. 532
Chave, J. et al. 2014. Improved allometric models to estimate the aboveground biomass of tropical 533
trees. — Global Change Biology 20: 3177-3190. 534
Chen, I. C. et al. 2009. Elevation increases in moth assemblages over 42 years on a tropical mountain. 535
— Proc. Natl. Acad. Sci. U. S. A. 106: 1479-1483. 536
Clinebell, R. R. et al. 1995. Prediction of neotropical tree and liana species richness from soil and 537
climatic data. — Biodiversity and Conservation 4: 56-90. 538
Condit, R. et al. 2013. Species distributions in response to individual soil nutrients and seasonal 539
drought across a community of tropical trees. — Proc. Natl. Acad. Sci. U. S. A. 110: 5064-540
5068. 541
Currie, D. J. et al. 2004. Predictions and tests of climate-based hypotheses of broad-scale variation in 542
taxonomic richness. — Ecology Letters 7: 1121-1134. 543
da Costa, A. C. L. et al. 2010. Effect of 7 yr of experimental drought on vegetation dynamics and 544
biomass storage of an eastern Amazonian rainforest. — New Phytol. 187: 579-591. 545
Dallas, T. 2014. metacom: an R package for the analysis of metacommunity structure. — Ecography 546
37: 402-405. 547
Dexter, K. G. et al. 2012. Historical effects on beta diversity and community assembly in Amazonian 548
trees. — Proc. Natl. Acad. Sci. U. S. A. 109: 7787-7792. 549
Dobzhansky, T. 1950. Evolution in the Tropics. — American Scientist 38: 209-221. 550
Engelbrecht, B. M. J. et al. 2007. Drought sensitivity shapes species distribution patterns in tropical 551
forests. — Nature 447: 80-U2. 552
Erkens, R. H. J. et al. 2007. A rapid diversification of rainforest trees (Guatteria; Annonaceae) 553
following dispersal from Central into South America. — Molecular Phylogenetics and 554
Evolution 44: 399-411. 555
Fauset, S. et al. 2012. Drought-induced shifts in the floristic and functional composition of tropical 556
forests in Ghana. — Ecology Letters 15: 1120-1129. 557
Feeley, K. J. et al. 2011. Directional changes in the species composition of a tropical forest. — 558
Ecology 92: 871-882. 559
Fine, P. V. A. 2001. An evaluation of the geographic area hypothesis using the latitudinal gradient in 560
North American tree diversity. — Evolutionary Ecology Research 3: 413-428. 561
Fortin, M. J. and Payette, S. 2002. How to test the significance of the relation between spatially 562
autocorrelated data at the landscape scale: A case study using fire and forest maps. — 563
Ecoscience 9: 213-218. 564
Gaviria, J. and Engelbrecht, B. M. J. 2015. Effects of drought, pest pressure and light availability on 565
seedling establishment and growth: their role for distribution of tree species across a tropical 566
rainfall gradient. — PLoS One 10: e0143955. 567
Gentry, A. H. 1982. Neotropical floristic diversity: phytogeographical connections between central 568
and Southamerica, pleistocene climatic fluctuations, or an accident of the Andean orogeny? 569
— Annals of the Missouri Botanical Garden 69: 557-593. 570
Gentry, A. H. 1988. Changes in plant community diversity and floristic composition on environmental 571
and geographical gradients. — Annals of the Missouri Botanical Garden 75: 1-34. 572

22
Gentry, A. H. 1990. Floristic similarities and differences between southern Central America and upper 573
and central Amazonia. — In: Gentry, A. H. (ed), Four neotropical rainforests Yale University 574
Press, pp. 141-157. 575
Harley, P. et al. 2004. Variation in potential for isoprene emissions among Neotropical forest sites. — 576
Global Change Biology 10: 630-650. 577
Higgins, M. A. et al. 2011. Geological control of floristic composition in Amazonian forests. — 578
Journal of Biogeography 38: 2136-2149. 579
Hijmans, R. J. et al. 2005. Very high resolution interpolated climate surfaces for global land areas. — 580
International Journal of Climatology 25: 1965-1978. 581
Hoorn, C. et al. 2010. Amazonia through time: Andean uplift, climate change, landscape evolution, 582
and biodiversity. — Science 330: 927-931. 583
IPCC 2013. Climate change 2013: the physical science basis. Contribution of working group I to the 584
fifth assessment report of the Intergovernmental Panel on Climate Change. — Cambridge 585
University Press. 586
Jablonski, D. et al. 2006. Out of the tropics: evolutionary dynamics of the latitudinal diversity 587
gradient. — Science 314: 102-106. 588
Jansson, R. 2003. Global patterns in endemism explained by past climatic change. — Proceedings of 589
the Royal Society of London B: Biological Sciences 270: 583-590. 590
Janzen, D. H. 1967. Why mountain passes are higher in the tropics. — The American Naturalist 101: 591
233-249. 592
Jiménez-Muñoz, J. C. et al. 2013. Spatial and temporal patterns of the recent warming of the Amazon 593
forest. — Journal of Geophysical Research: Atmospheres 118: 5204-5215. 594
Klopfer, P. H. 1959. Environmental determinants of faunal diversity. — The American Naturalist 93: 595
337-342. 596
Koenker, R. and Bassett, G. 1978. Regression quantiles. — Econometrica 46: 33-50. 597
Laurance, W. F. et al. 2004. Pervasive alteration of tree communities in undisturbed Amazonian 598
forests. — Nature 428: 171-175. 599
Leibold, M. A. and Mikkelson, G. M. 2002. Coherence, species turnover, and boundary clumping: 600
elements of meta-community structure. — Oikos 97: 237-250. 601
Lenters, J. D. and Cook, K. H. 1995. Simulation and diagnosis of the regional summertime 602
precipitation climatology of South America. — Journal of Climate 8: 2988-3005. 603
Li, W. H. et al. 2008. Observed change of the standardized precipitation index, its potential cause and 604
implications to future climate change in the Amazon region. — Philosophical Transactions of 605
the Royal Society B-Biological Sciences 363: 1767-1772. 606
Lopez-Gonzalez, G. et al. 2009. ForestPlots.net Database. 607
Lopez-Gonzalez, G. et al. 2011. ForestPlots.net: a web application and research tool to manage and 608
analyse tropical forest plot data. — J. Veg. Sci. 22: 610-613. 609
MacArthur, R. H. 1972. Geographical Ecology: patterns in the distribution of species. — Princeton 610
University Press. 611
Malhi, Y. et al. 2009. Exploring the likelihood and mechanism of a climate-change-induced dieback 612
of the Amazon rainforest. — Proc. Natl. Acad. Sci. U. S. A. 106: 20610-20615. 613
Malhi, Y. et al. 2002. An international network to monitor the structure, composition and dynamics of 614
Amazonian forests (RAINFOR). — J. Veg. Sci. 13: 439-450. 615
Malhi, Y. and Wright, J. 2004. Spatial patterns and recent trends in the climate of tropical rainforest 616
regions. — Philos. Trans. R. Soc. Lond. Ser. B-Biol. Sci. 359: 311-329. 617
Manly, B. F. J. 1997. Randomization, bootstrap and Monte Carlo methods in Biology. — Chapman & 618
Hall. 619
Marengo, J. A. et al. 2011. The drought of 2010 in the context of historical droughts in the Amazon 620
region. — Geophysical Research Letters 38: 621
Markesteijn, L. et al. 2011. Hydraulics and life history of tropical dry forest tree species: coordination 622
of species’ drought and shade tolerance. — New Phytol. 191: 480-495. 623
Martinez, R. V. and Phillips, O. L. 2000. Allpahuayo: floristics, structure, and dynamics of a high-624
diversity forest in amazonian Peru. — Annals of the Missouri Botanical Garden 87: 499-527. 625
Morin, X. and Lechowicz, M. J. 2013. Niche breadth and range area in North American trees. — 626
Ecography 36: 300-312. 627

23
Morueta-Holme, N. et al. 2013. Habitat area and climate stability determine geographical variation in 628
plant species range sizes. — Ecology Letters 16: 1446-1454. 629
Nelson, B. W. et al. 1990. Endemism centres, refugia and botanical collection density in Brazilian 630
Amazonia. — Nature 345: 714-716. 631
Nepstad, D. C. et al. 2007. Mortality of large trees and lianas following experimental drought in an 632
amazon forest. — Ecology 88: 2259-2269. 633
New, M. et al. 2002. A high-resolution data set of surface climate over global land areas. — Climate 634
Research 21: 1-25. 635
Normand, S. et al. 2009. Importance of abiotic stress as a range-limit determinant for European plants: 636
insights from species responses to climatic gradients. — Glob. Ecol. Biogeogr. 18: 437-449. 637
Phillips, O. and Miller, J. S. 2002. Global patterns of plant diversity: Alwyn H. Gentry's forest 638
transect data set. — Missouri Botanical Press. 639
Phillips, O. L. et al. 2003. Efficient plot-based floristic assessment of tropical forests. — J. Trop. Ecol. 640
19: 629-645. 641
Pither, J. 2003. Climate tolerance and interspecific variation in geographic range size. — Proc. R. 642
Soc. B-Biol. Sci. 270: 475-481. 643
Pitman, N. C. A. et al. 2002. A comparison of tree species diversity in two upper Amazonian forests. 644
— Ecology 83: 3210-3224. 645
Poorter, L. and Markesteijn, L. 2008. Seedling traits determine drought tolerance of tropical tree 646
species. — Biotropica 40: 321-331. 647
Presley, S. J. et al. 2010. A comprehensive framework for the evaluation of metacommunity structure. 648
— Oikos 119: 908-917. 649
Quesada, C. A. et al. 2010. Variations in chemical and physical properties of Amazon forest soils in 650
relation to their genesis. — Biogeosciences 7: 1515-1541. 651
Quesada, C. A. et al. 2012. Basin-wide variations in Amazon forest structure and function are 652
mediated by both soils and climate. — Biogeosciences 9: 2203-2246. 653
R Core Team 2014. R: A language and environment for statistical computing. R Foundation for 654
Statistical Computing. 655
Richardson, J. E. et al. 2001. Rapid diversification of a species-rich genus of neotropical rain forest 656
trees. — Science 293: 2242-2245. 657
Ricklefs, R. E. 2004. A comprehensive framework for global patterns in biodiversity. — Ecology 658
Letters 7: 1-15. 659
Rohde, K. 1992. Latitudinal gradients in species-diversity - the search for the primary cause. — Oikos 660
65: 514-527. 661
Rosenzweig, M. L. 1992. Species diversity gradients: we know more and less than we thought. — 662
Journal of Mammalogy 73: 715-730. 663
Sastre, P. and Lobo, J. M. 2009. Taxonomist survey biases and the unveiling of biodiversity patterns. 664
— Biol. Conserv. 142: 462-467. 665
Slatyer, R. A. et al. 2013. Niche breadth predicts geographical range size: a general ecological pattern. 666
— Ecology Letters 16: 1104-1114. 667
Spasojevic, M. J. et al. 2014. Functional diversity supports the physiological tolerance hypothesis for 668
plant species richness along climatic gradients. — J. Ecol. 102: 447-455. 669
Spear, E. R. et al. 2015. Do pathogens limit the distributions of tropical trees across a rainfall 670
gradient? — J. Ecol. 103: 165-174. 671
ter Steege, H. et al. 2013. Hyperdominance in the amazonian tree flora. — Science 342: 325-+. 672
ter Steege, H. et al. 2003. A spatial model of tree α-diversity and tree density for the Amazon. — 673
Biodivers Conserv 12: 2255-2277. 674
Terborgh, J. 1973. On the notion of favorableness in plant ecology. — The American Naturalist 107: 675
481-501. 676
van der Sleen, P. et al. 2015. No growth stimulation of tropical trees by 150 years of CO2 fertilization 677
but water-use efficiency increased. — Nature Geosci 8: 24-28. 678
von Humboldt, A. 1808. Ansichten der Natur. — Cotta. 679
Wallace, A. R. 1878. Tropical nature, and other essays. By Alfred R. Wallace. — Macmillan and co. 680
681
682

24
Supplementary material (Appendix EXXXXX at <www.oikosoffice.lu.se/appendix>). Appendix 683
1–9 684

25
Figure Legends 685
Figure 1 Two conceptual models of how species’ distributions may be arrayed along a 686
precipitation gradient, with presence/absence matrices where rows represent taxa and columns 687
represent communities, ordered from wet to dry. A. Nested pattern expected by the dry 688
tolerance hypothesis. Nestedness (sensu Leibold and Mikkelson 2002) is represented by 689
gradual disappearance of taxa along the precipitation gradient from wet to dry. B. Turnover of 690
taxa along the precipitation gradient. This pattern is characterized by the substitution of taxa 691
from site to site, resulting in communities at opposite sides of the precipitation gradient being 692
completely different in composition (Leibold and Mikkelson 2002). 693
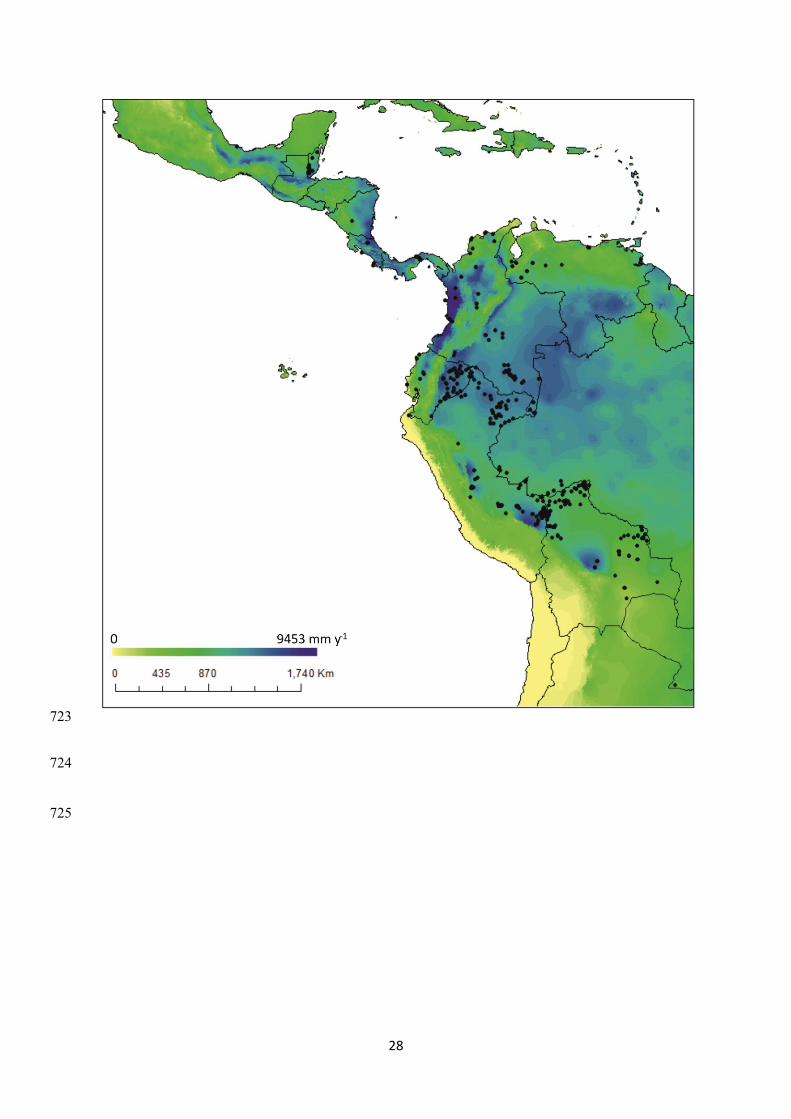
Figure 2 Mean annual precipitation in the Western Neotropics and distribution of the 531 694
forest inventory plots (black dots) analysed in this study. Precipitation data come from 695
WorldClim (Hijmans et al., 2005). Note the spatial complexity of precipitation patterns within 696
the study area. 697
Figure 3 Tree alpha diversity (evaluated with Fisher’s alpha parameter) as a function of 698
precipitation, represented by maximum climatological water-deficit (CWD) for 1 ha plots 699
across the Western Neotropics. Solid curves represent the 90% upper quantile regression. Note 700
that more negative values of CWD limit alpha diversity and that the diversity vs. CWD 701
correlation is stronger for finer taxonomic levels – Kendall’s τ = 0.66 for species, 0.60 for 702
genus and 0.51 for family level, P values < 0.001. 703
Figure 4 The influence of precipitation on the distribution of taxa in Western neotropics. a-c 704
Range of water-deficit conditions (black horizontal lines) over which each (a) species, (b) 705
genus, and (c) family occurs. The x-axes express the water-deficit gradient in mm of maximum 706
climatological water-deficit (CWD) from dry (red) to wet (blue), while taxa are stacked and 707
ordered along y-axes by the most negative value of CWD of occurrence. d-f Discovery curves 708

26
showing the cumulative percentage (y-axes) of (d) species, (e) genera, and (f) families from 709
the whole region found in each plot when moving along the CWD gradient (x-axes). g-i Loss 710
curves giving the percentage of (g) species, (h) genera, and (i) families from the 10% of plots 711
under the most extreme precipitation regimes that drop out when moving to the opposite 712
extreme of the gradient. In d-i x-axes show the number of plots, ordered from wet to dry (blue 713
axis labels and blue curves) and from dry to wet (red axis labels and red curves). Black and 714
grey curves represent respectively, the mean and 95% confidence limits of loss and discovery 715
curves generated by shuffling values of precipitation within the plots 1000 times. Taxa 716
restricted to 10 or fewer localities were excluded from analyses. Note that of the taxa from the 717
10% driest communities, 86% of species, 91% of genera and 96% of families are also recorded 718
in plots with zero CWD. 719
720

27
721
722
28
723
724
725

29
726
727

30
Tables 728
Table 1 Observed and expected turnover of taxa along the precipitation gradient. Turnover was 729
measured by the number of times a taxon replaces another between two sites. Expected values 730
represent the average turnover when randomly sorting the matrix 1000 times. P-values test the 731
null hypothesis that replacement of taxa along the precipitation gradient does not differ from 732
random expectations considering α = 0.05. Note that observed taxa turnover is significantly 733
lower than the expected, which indicates that the distributions of taxa follows a nested pattern 734
along the precipitation gradient (Leibold & Mikkelson 2002, Presley et al. 2010). 735
Observed
turnover
Expected
turnover P
Families 0 755,226 0.01
Genera 2,061 3,529,527 < 0.01
Species 0 25,592,113 < 0.01
736
737

31
Table 2a. Number of taxa significantly affiliated to wet or dry precipitation regimes, based on 738
their precipitation centre of gravity (PCG) and Kendall’s τ coefficient of correlation between 739
relative abundance and precipitation. Taxa with significant PCG are more dry or wet-affiliated 740
than expected by chance, at α < 0.05. Significant values of Kendall’s τ indicate that the 741
probability of observing a correlation between relative abundance and precipitation by chance 742
is lower than 5%. Affiliations calculated for two precipitation variables: maximum 743
climatological water deficit (CWD) and mean annual precipitation (MAP). Values in brackets 744
show the proportions of significant values of precipitation affiliations in relation to the total 745
number of taxa in the analyses. We tested the influence of the sample size on the proportion of 746
significant values by comparing the observed proportion against 1000 random proportions 747
generated by shuffling precipitation values across communities. The null hypothesis that 748
proportions are an artefact of the number of taxa analysed was rejected considering α = 0.001 749
in all cases (see Supplementary material Appendix 5 for details). 750
Total Significant PCG Total Significant Kendall’s τ
CWD MAP CWD MAP
Species 1818 1065 (58%) 615 (34%) 525 426 (81%) 398 (76%)
Genera 544 291 (53%) 236 (43%) 327 259 (79%) 242 (74%)
Families 104 60 (58%) 46 (44%) 78 60 (77%) 59 (76%)
751

32
Table 2b. As in Table 2a, but giving a breakdown by affiliations to wet and dry conditions. As 752
for table 2a the influence of the sample size on the proportion of significant values was assessed 753
by comparing the observed proportion against 1000 random proportions generated by shuffling 754
precipitation values across communities (see Supplementary material Appendix 5 for details). 755
P-values test the null hypothesis that proportions are an artefact of the number of taxa. 756
Maximum climatological
water deficit (mm) (CWD)
Mean annual precipitation (mm)
(MAP)
dry wet dry wet
Significant
PCG
Species 112 (6%)* 953 (52%)* 153 (8%)* 462 (25%)*
Genera 67 (12%)* 224 (41%)* 94 (17%)* 142 (26%)*
Families 13 (12%)* 47 (45%)* 18 (17%)* 28 (27%)*
Significant
Kendall’s τ
Species 59 (11%)* 367 (70%)* 52 (10%)* 346 (66%)*
Genera 49 (15%)* 210 (64%)* 48 (15%)* 194 (59%)*
Families 6 (8%) 54 (69%)* 8 (10%)* 51 (65%)*
* P< 0.05 757