edinburgh research explorer · detailed process flowsheet including key equipment for artemisinin...
TRANSCRIPT

Edinburgh Research Explorer
Plantwide design and economic evaluation of two ContinuousPharmaceutical Manufacturing (CPM) Cases: ibuprofen andartemisinin
Citation for published version:Jolliffe, HG & Gerogiorgis, D 2016, 'Plantwide design and economic evaluation of two ContinuousPharmaceutical Manufacturing (CPM) Cases: ibuprofen and artemisinin' Computers and ChemicalEngineering. DOI: 10.1016/j.compchemeng.2016.04.005
Digital Object Identifier (DOI):10.1016/j.compchemeng.2016.04.005
Link:Link to publication record in Edinburgh Research Explorer
Document Version:Peer reviewed version
Published In:Computers and Chemical Engineering
General rightsCopyright for the publications made accessible via the Edinburgh Research Explorer is retained by the author(s)and / or other copyright owners and it is a condition of accessing these publications that users recognise andabide by the legal requirements associated with these rights.
Take down policyThe University of Edinburgh has made every reasonable effort to ensure that Edinburgh Research Explorercontent complies with UK legislation. If you believe that the public display of this file breaches copyright pleasecontact [email protected] providing details, and we will remove access to the work immediately andinvestigate your claim.
Download date: 21. Aug. 2018
Plantwide design and economic evaluation of two Continuous Pharmaceutical Manufacturing (CPM) cases: Ibuprofen and
Artemisinin
Hikaru G. Jolliffe and Dimitrios I. Gerogiorgis* Institute for Materials and Processes (IMP), School of Engineering, University of Edinburgh,
The King’s Buildings, Edinburgh, EH9 3JL, United Kingdom
*Corresponding author: [email protected] (+44 131 6517072)
ABSTRACT Increasing Research and Development (R&D) costs, growing competition from generic manufacturers and dwindling rates of novel drug products reaching the market are giving impetus to the efforts of pharmaceutical firms to secure competitiveness by investigating Continuous Pharmaceutical Manufacturing (CPM). The present paper explores the CPM of two key Active Pharmaceutical Ingredients (APIs), ibuprofen and artemisinin: cost savings and material efficiency benefits are evaluated for CPM vs. batch processing, with two continuous options for each API. Capital Expenditure (CapEx) savings of up to 57.0% and 19.6% and corresponding Operating Expenditure (OpEx) savings of up to 51.6% and 29.3% for ibuprofen and artemisinin, respectively. Total projected cost savings for a 20-year plant lifetime can reach 54.5% and 20.1%, respectively. Environmental (E)-factors (mass of waste generated per unit mass of product) of 43.4 (for ibuprofen) and 12.2 (for artemisinin) have been computed, indicating quite acceptable material efficiencies for these conceptual continuous pharmaceutical processes.

1
1 INTRODUCTION Due to the increasing cost of pharmaceutical product R&D and competition from generic manufacturers, current research focuses on more efficient, cost-saving production methods which are superior is several aspects compared to batch production, the current paradigm in the pharmaceutical industry (Behr et al., 2004; Ashe, 2012). Batch production processes have multiple advantages including equipment flexibility, the ability to buy vessels ‘off-the-shelf’, efficient high-fidelity quality control and the ability to recall specific batches. However, improvements in batch production are rare, as this is a mature technology: its limitations include large storage volume requirements, poor heat and mass transfer scaling, and inefficient solvent and energy use (Anderson, 2012; Gernaey et al., 2012). Attention is turned to Continuous Pharmaceutical Manufacturing (CPM) which has the potential to revolutionise drug production quality, safety, yields, efficiency (of equipment, energy and material) and cost (Plumb, 2005; Roberge et al., 2008; Mascia et al., 2013). However, as pharmaceutical firms have significant investments in batch plants, and as production licenses are often legally tied to the specific (batch) production method, research conclusively elucidating the benefits of CPM is required in order to facilitate this paradigm shift in drug production (Lee et al., 2015).
Two rapid and low-cost methodologies for evaluating the benefits of continuous processing for the production of pharmaceuticals include investigating the viability and feasibility of CPM processes via process modelling and simulation (Gerogiorgis and Barton, 2009; Teoh et al., 2015). Additionally, extensions to cost estimation allow economic benefits of CPM processes to quantified (Schaber et al., 2011).
In previous work we systematically identified promising candidates for CPM and performed an initial comparative techno-economic assessment of two of these: ibuprofen and artemisinin (Jolliffe and Gerogiorgis, 2015a, 2015b).
Ibuprofen (2-(4-isobutylphenyl) propanoic acid) is a widely used analgaesic considered an essential drug by the World Health Organisation. It is significant market presence in many different commercial formulations. First synthesised in the 1960s, the first industrial six-step Boots synthesis method has been largely replaced by a more efficient, less complex route (Adams, 1992). In a recent landmark study, the continuous synthesis of ibuprofen was performed using novel reaction routes, producing ibuprofen in high yield using three reactors (Bogdan et al., 2009).
Artemisinin has been used medicinally for a long time, especially in traditional Chinese remedies, as its source plant sweet wormwood; it was identified and isolated as the API only relatively recently in the 20th century (Tu, 2011). As is frequently the case, the current production method is batch extraction of artemisinin using solvents. Taking into account cultivation times, this results in a long lead time from seed planting to final dosage formulation, and together with unpredictable demand results in highly fluctuating prices (Hommel, 2008; Cutler, 2013). There have been attempts to produce synthetic and semi-synthetic artemisinin in recent years (Zhu and Cook, 2012; Peplow, 2013; Paddon and Keasling, 2014; Turconi et al., 2014). Biotechnology has also been explored in this regard (Wang et al., 2014; Abdin and Alam, 2015; Corsello and Garg, 2015). Of particular interest is recent work concerning the semi-synthesis of artemisinin from the waste of current batch production methods (Lévesque and Seeberger, 2012; Kopetzki et al., 2013; Gilmore et al., 2014; Horváth et al., 2015). In this process dihydroartemisinic acid (DHAA), which is normally discarded as waste, undergoes photo-oxidation with the subsequent use of an acid catalyst to transform it via several intermediates to artemisinin.
Here, we present a more detailed extended study analysing the economic benefits, in terms of cost savings, of performing product separation and recovery via continuous processing as opposed to batch for ibuprofen and artemisinin, with the process models based on published continuous synthesis routes (Bogdan et al., 2009; Kopetzki et al., 2013). Two continuous separation alternatives are studied for each API (totaling six with the inclusion of a batch reference case for each) and through using systematic cost estimation methods Capital Expenditure (CapEx), Operating Expenditure (OpEx) and total cost savings over a typical plant lifetime are calculated. In addition, material efficiency of each process is evaluated using the Environmental (E) factor (Sheldon, 2012). To further elucidate the potential cost savings, a simplified ‘lean’ modification of the batch processes are studied in comparison to the continuous schemes, as well as a process scale-up from 100 kg/yr annual API production to 1,000 kg/yr to investigate whether cost advantages remain in these cases.
2
This paper is organized in the following manner: process descriptions, reaction schemes and synthesis sections of the two flowsheets first presented; also presented are the separation schemes, for which batch and continuous versions are studied. More detailed flowsheets giving individual process equipment are also presented. Subsequently, the cost analysis methods are thoroughly covered along with a discussion of how equipment and process vessels were sized. The results cover potential cost savings between the various process options and detail how Capital Expenditure (CapEx), Operating Expenditure (OpEx), total cost savings, and material efficiency (in terms of E-factor) vary, for two production scales and two levels of reference batch case complexity. The results are then discussed in the wider context of this emerging field of research.
2 PROCESS DESCRIPTION
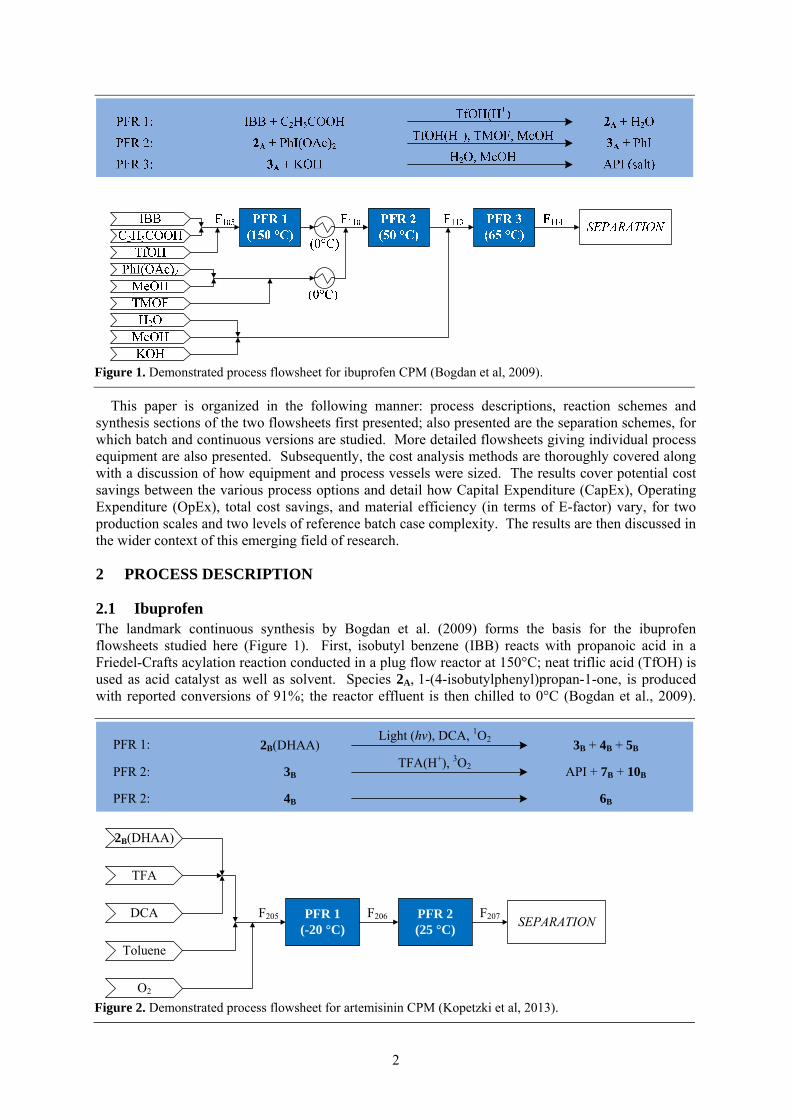
2.1 Ibuprofen The landmark continuous synthesis by Bogdan et al. (2009) forms the basis for the ibuprofen flowsheets studied here (Figure 1). First, isobutyl benzene (IBB) reacts with propanoic acid in a Friedel-Crafts acylation reaction conducted in a plug flow reactor at 150°C; neat triflic acid (TfOH) is used as acid catalyst as well as solvent. Species 2A, 1-(4-isobutylphenyl)propan-1-one, is produced with reported conversions of 91%; the reactor effluent is then chilled to 0°C (Bogdan et al., 2009).
Figure 1. Demonstrated process flowsheet for ibuprofen CPM (Bogdan et al, 2009).
Figure 2. Demonstrated process flowsheet for artemisinin CPM (Kopetzki et al, 2013).
2B(DHAA) 3B + 4B + 5BLight (hv), DCA, 1O2
3B API + 7B + 10B
4B 6B
PFR 1:
PFR 2:
PFR 2:
TFA(H+), 3O2
PFR 1(-20 °C)
PFR 2(25 °C)
2B(DHAA)
TFA
DCA
Toluene
F207 SEPARATION
O2
F206F205

3
The effluent is mixed with additional reagents and solvents that have also been chilled to 0°C. In the second reactor (50°C) a diacetoxyiodobenzene-mediated 1,2-aryl migration converts 2A to
3A, 2-(4-isobutylphenyl)propanoate, with 98% conversion. The reactor products are combined with a water-methanol stream containing potassium hydroxide, and the resulting mixture enters the last reactor.
The third reactor, operating at 65°C, causes the saponification of 3A into the potassium salt form of the ibuprofen. This is acidified with strong acid – reverting ibuprofen to its normal carboxylic acid form – during product recovery and separation (Bogdan et al., 2009). 2.1.1 Full ibuprofen batch separation (IbuprofenBX,F) In the experimental demonstration, a comprehensive batch process was used to recover ibuprofen (Bogdan et al., 2009). While it achieves ibuprofen in high purity, such a process can take time and require large quantities of material (Andraos, 2011); the overall API product recovery is 57.8. To estimate the capital costs required for such a process, a scheme where some batch vessels perform multiple functions of the Bogdan et al. (2009) scheme was devised (Figure 5). Batch vessel IB-BX-T1 is a mixing vessel which quenches the product of the last PFR; methanol is then evaporated by IB-BX-EV1. Vessel IB-BX-T2 performs an organic wash with diethyl ether and acidification with
Figure 3. Detailed process flowsheet including key equipment for ibuprofen CPM (Bogdan et al, 2009).
Figure 4. Detailed process flowsheet including key equipment for artemisinin CPM (Kopetzki et al, 2013).
F206
2(DHAA)
TFA
DCA
O2F204
F207
Toluene
F201
F203
F202
AR-P201
AR-P202
AR-R201 AR-R202
(-20 °C)
(25 °C)
F205
hv
Separation and API recovery
Batch, BX Continuous, CPM(1/2)

4
concentrated hydrochloric acid. In the next vessel, IB-BX-T3, three operations are performed discarding the aqueous phase in each case: extraction with diethyl ether, washing with water, and a wash with brine. The material is then dried with sodium sulphate, mixed in IB-BX-T4 and filtered out by IB-BX-F1. The organic filtrate is concentrated and then dried in IB-BX-DR1, and subsequently solubilised in IB-BX-T5 with diethyl ether, with activated carbon also added; the latter is filtered out with IB-BX-F2. The filtrate is concentrated by IBI-BX-DR2 prior to crystallisation in IB-BX-CR1. The crystals are filtered by IB-BX-F3 before being dried by IB-BX-DR2. 2.1.2 Ibuprofen continuous separation (IbuprofenCPM1, IbuprofenCPM2) Continuous separation alternatives have significant promise in delivering cost and sustainability benefits, and here we also economically evaluate two continuous liquid-liquid extraction options we previously reported (Jolliffe and Gerogiorgis, 2015a, 2015b). The first option (Ibuprofen CPM1) uses toluene as a waste-extracting solvent, operating at 65°C at a mass rate 75% that of incoming reactor effluent mass. The second (Ibuprofen CPM2) uses instead n-hexane, also at 65°C, but at a mass rate of 50% incoming mass. The former option (Ibuprofen CPM1) has the advantages of lower environmental impact (toluene is less toxic and damaging than n-hexane), while n-hexane use requires less solvent for similar product recovery (Ibuprofen CPM1 can recover 89.2% of API, while CPM2 can recover 89.5%). Toluene use is normally recommended here; nevertheless, n-hexane use is analysed in order to determine the difference in potential cost savings. An example flowsheet of the above process is given in Figure 5. In continuous contacting tank IB-CPMX-T101, the incoming reactor product stream is acidified. The resulting acidified stream then proceeds to liquid-liquid
Figure 5. Ibuprofen product recovery. Top: batch purification, method of Bogdan et al (2009). Middle: simplified batch separation. Bottom: potential continuous ibuprofen purification; CPM1 uses toluene as solvent, CPM2 uses hexane (Jolliffe and Gerogiorgis, 2015a).
IB-BX-DR1
IB-BX-T5IB-BX-F2
IB-BX-DR2IB-BX-F3
IB-BX-DR3
IB-BX-CR1
Waste Et2O,Carbon
WasteWaste Heptane
WasteWaste
API
IB-BX-T1
IB-BX-EV1
IB-BX-T2 IB-BX-T3 IB-BX-T4
IB-BX-F1
WaterWaste Et2O,
HCl 30%
Et2O,Water,Brine
Waste Waste
Na2SO4
Waste
From F114
(Fig. 3)

5
extraction in IB-CPMX-T102, where either toluene (X = 1) or hexane (X = 2) are used. Given the low quantities of solvent used in this extraction stage relative the feed, long residence times will likely be required to ensure adequate inter-phase contact and mass transfer. 2.1.3 Lean ibuprofen batch separation (IbuprofenBX,L) A more equal basis for comparison to continuous separations is provided by considering a simplified batch separation scheme, based on the process used by Bogdan et al. (2009). In this simplified scheme (Fig. 5), the major unit operations – those which perform quenches, solvent swaps, acid neutralisation, and extraction – have been kept while those which remove trace impurities or produce the API in solid form have been removed. A yield of 68% can be estimated for such a process, based on yields achieved after similar steps (Bogdan et al., 2009); this corresponds to a product recovery of 77%. The vessel tags and purposes are as for the full ibuprofen batch separation.
2.2 Artemisinin The second flowsheet studied here is based on work done by Kopetzki et al (2013). Dihydroartemisinic acid (DHAA, species 2B) is a waste substance from the normal (batch) extraction of artemisinin from the plant A. annua. It is mixed with trifluoro acetic acid (acting as acid catalyst), 9,10-dicyanoanthracene (DCA, a photosensitizing dye), oxygen, and toluene solvent. The dye takes no direct part in the reaction, but promotes singlet oxygen (1O2) generation under a light source; a high intensity monochromatic light was used by Kopetzki et al. (2013), and it is assumed that a similar device is available here. In the first plug flow reactor, chilled to –20°C, 2B undergoes photooxidation producing key organic intermediate 3B and by-products. The conversion attained in this reactor is 98% (Kopetzki et al., 2013; Seeberger et al., 2014).
In the second reactor, several reactions take place. The key ones are a Hock rearrangement and oxidation with triplet oxygen (3O2), producing artemisinin (species 1B); as previously, a variety of by-products are also produced. The conversion attained in the second reactor is estimated to be 83.5% (Jolliffe and Gerogiorgis, 2015c). 2.2.1 Full artemisinin batch separation (ArtemisininBX) As with ibuprofen, an extensive batch process was used to recover artemisinin in the experimental demonstration consisting of washes, drying, crystallisations, evaporations and filtrations; an overall product recovery of 70.8% is achieved with this method (Seeberger et al., 2014). A potential scheme with multi-role batch equipment was devised to allow capital cost estimations (Figure 6). The first vessel, AR-BX-T1 extracts and removes acid with sodium bicarbonate, washes the organic phase with water and brine, and then dries it with sodium sulphate. The organic stream is then concentrated via reduced pressure evaporation with AR-BX-EV1. The resulting material is then dissolved in acetonitrile in AR-BX-T2 before all solvent is evaporated with AR-BX-DR1; this removes any remaining toluene (Seeberger et al., 2014). Acetonitrile is again added along with activated carbon, with the resulting mixture refluxed, in AR-BX-T3; the carbon is removed by filter AR-BX-F1. The filtrate is evaporated and dried with AR-BX-DR2 with the solids then recrystallized in AR-BX-CR1. The mother liquor (filtrate from AR-BX-FR2) is washed, dried (AR-BX-DR3) and recrystallised again (AR-BX-CR2). The solids from the first crystalliser and the mother liquor are each washed (in AR-BX-T4 and AR-BX-T5, respectively) before they are alternately dried by AR-BX-DR4. They are then combined and recrystallised again in AR-BX-CR3. The solids are filtered by AR-BX-F3 and finally washed with AR-BX-T5. 2.2.2 Artemisinin continuous separation (ArtemisininCPM1, ArtemisininCPM2) Here, we expand on previous work (Jolliffe and Gerogiorgis, 2015b) and evaluate the cost saving potential of continuous crystallisation for API recovery (Figure 6). Using the reported product recovery achieved using the batch scheme outlined above as a reference case for comparison, two continuous crystallisation alternatives were studied, the first (ArtemisininCPM1) using published solubility data for the use of 30:70 toluene : ethanol antisolvent by weight, and the second (ArtemisininCPM2) using solubility data for the use of 30:70 toluene : ethyl acetate by weight, estimated using the UNIFAC method. Ethyl acetate was identified from among 8 possible antisolvents as being a good potential candidate for this process (Jolliffe and Gerogiorgis, 2015c). An agitated tank AR-CPMX-T201) neutralises the acid; the residence time must here be sufficient to allow adequate mass transfer between the two immiscible phases (toluene and an aqueous phase) (Jolliffe

6
Figure 6. Artemisinin product recovery. Top: batch purification, method of Kopetzki et al (2013). Bottom: potential continuous ibuprofen purification; CPM1 uses ethanol as anti-solvent, CPM2 uses ethyl acetate (Jolliffe and Gerogiorgis, 2015c).
AR-P203
From F207 (Fig. 4)
Antisolvent(CPM1 = EtOH,CPM2 = EtOAc)
API (crystals)
AR-CPMX-T201
NaHCO3(aq)
WasteWaste
IB-CPMX-CR201
AR-CPMX-HX202
AR-CPMX-FC201
AR-CPMX-HX201
IB-P204
Waste

7
and Gerogiorgis, 2015c). The now neutralised organic phase is heated with AR-CPMX-HX201 and some solvent is removed via evaporation in AR-CPMX-FL201 to sufficiently concentrate the stream for crystallisation. The stream is cooled to the required temperature with AR-CPMX-HX202 before proceeding to the crystalliser (AR-CPMX-CR201) where either ethanol or ethyl acetate is used as antisolvent. 2.2.3 Lean artemisinin batch separation (ArtemisininBX) By removing unit operations not directly related to recovering artemisinin or producing it in dry solid form, a batch separation scheme or more equal comparative basis to the continuous separation is devised. In this modified batch scheme (Fig. 6), the unit operations for swapping toluene for acetonitrile, and the removal of DCA with activated carbon, are not included. The process proceeds from the quenching and washing of the incoming reactor effluent and subsequent removal of toluene to the crystallisation operations. The expected product recovery is as before, at 70.8%.
2.3 Higher production scale (1,000 kg/yr) The processes studied in this work, for both APIs, produce 100 kg/yr, which is higher than the lab scale, but generally smaller than industrial implementations. The potential cost savings at 1,000 kg/yr have also been evaluated. The same cost estimation methods were used as for the 100 kg/yr cases.
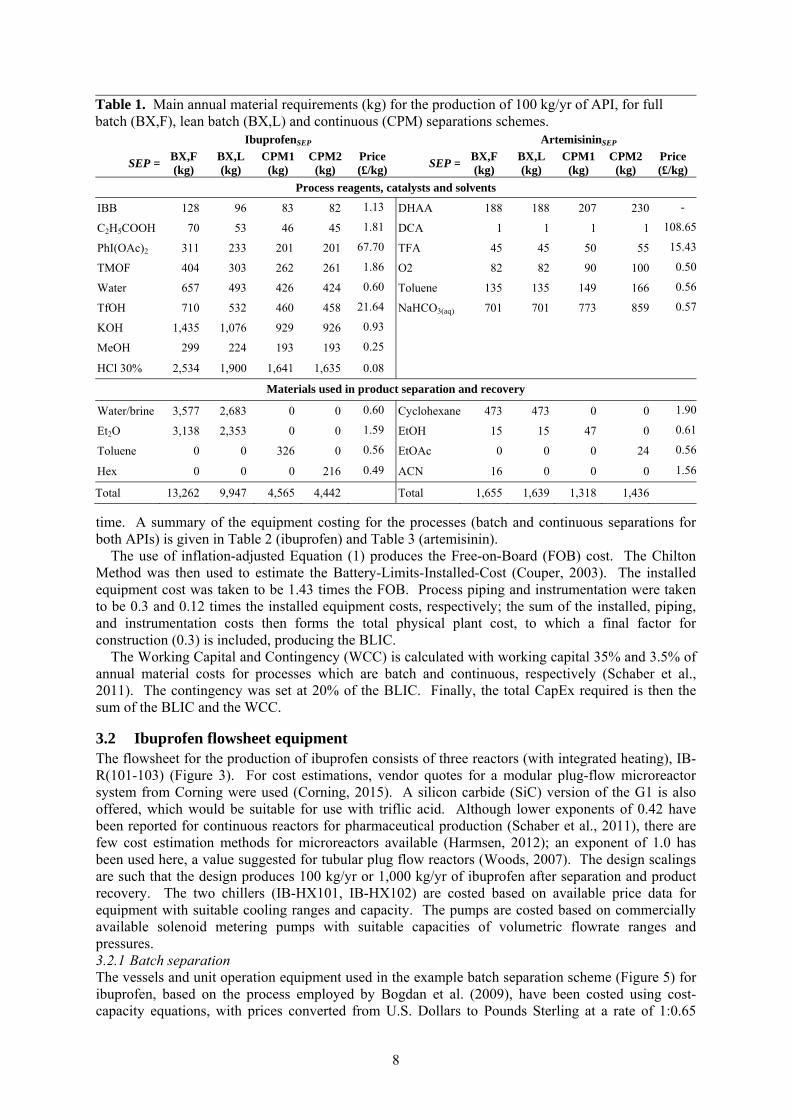
2.4 Material requirements A table summarizing the annual material input requirements for reagents, catalysts, solvents and other substances is given in Table 1. The material requirements for the higher process scale of 1,000 kg/yr API are similar, but an order of magnitude higher. Solvents and anti-solvents used in the process and in product separation are assumed to be recovered at a rate of 90%, a common assumption (Boodhoo and Harvey, 2013); input requirements and associated costs for these materials (ibuprofen: methanol, water/brine, ethyl acetate, toluene, hexane; artemisinin: toluene, cyclohexane, ethanol, ethyl acetate, acetonitrile) have been adjusted accordingly.
3 COST ESTIMATION The designs studied here have been assumed constructed at an existing pharmaceutical manufacturing site, with much of the infrastructure already in place. An 8040-hour working year (335 days) was studied. A variety of sourced vendor data and established economic prediction methods were used to estimate both Capital Expenditure (CapEx) and Operating Expenditure (OpEx).
3.1 Capital Expenditure (CapEx) Vendor prices were sourced where possible for process vessels and equipment of suitable capacity. Where this was unavailable, cost-capacity correlations were used (Woods, 2007). The correlations take the form of a power function:
fS
SCC
n
A
BAB
(1)
Here, CB and CA are the costs of two identical pieces of equipment (B and A) which are at different scales, or capacities, given by SB and SA. These capacities are of a dimension inherent to the equipment: examples include tank volume and filter area. The exponent n is particular to a type of equipment, and typically ranges between 0.0-1.0. In addition, other factors, summarised above as f can be applied to take into account design options such as construction material or design operating conditions. Where there is a significant surplus in the applicable capacity range to the required capacity, these additional factors were not used. To account for the greater cost of continuous equipment with regards to batch equipment of the same capacity, a factor of 0.9 was applied to continuous equipment when there was no suitable batch equivalent cost-capacity relation available. In addition, where the determined price corresponds to the past, the Chemical Engineering Plant Cost Index (CEPCI) was used to calculate the inflation to allow appropriate cost adjustments to the present
8
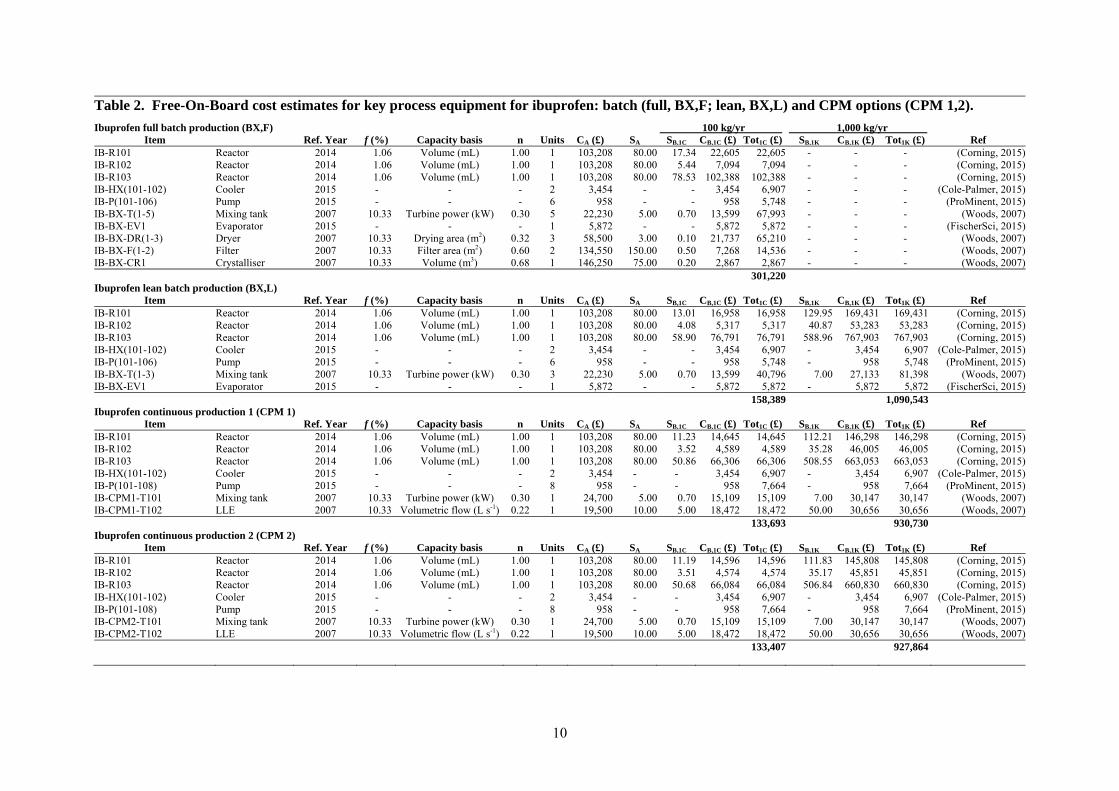
time. A summary of the equipment costing for the processes (batch and continuous separations for both APIs) is given in Table 2 (ibuprofen) and Table 3 (artemisinin).
The use of inflation-adjusted Equation (1) produces the Free-on-Board (FOB) cost. The Chilton Method was then used to estimate the Battery-Limits-Installed-Cost (Couper, 2003). The installed equipment cost was taken to be 1.43 times the FOB. Process piping and instrumentation were taken to be 0.3 and 0.12 times the installed equipment costs, respectively; the sum of the installed, piping, and instrumentation costs then forms the total physical plant cost, to which a final factor for construction (0.3) is included, producing the BLIC.
The Working Capital and Contingency (WCC) is calculated with working capital 35% and 3.5% of annual material costs for processes which are batch and continuous, respectively (Schaber et al., 2011). The contingency was set at 20% of the BLIC. Finally, the total CapEx required is then the sum of the BLIC and the WCC.
3.2 Ibuprofen flowsheet equipment The flowsheet for the production of ibuprofen consists of three reactors (with integrated heating), IB-R(101-103) (Figure 3). For cost estimations, vendor quotes for a modular plug-flow microreactor system from Corning were used (Corning, 2015). A silicon carbide (SiC) version of the G1 is also offered, which would be suitable for use with triflic acid. Although lower exponents of 0.42 have been reported for continuous reactors for pharmaceutical production (Schaber et al., 2011), there are few cost estimation methods for microreactors available (Harmsen, 2012); an exponent of 1.0 has been used here, a value suggested for tubular plug flow reactors (Woods, 2007). The design scalings are such that the design produces 100 kg/yr or 1,000 kg/yr of ibuprofen after separation and product recovery. The two chillers (IB-HX101, IB-HX102) are costed based on available price data for equipment with suitable cooling ranges and capacity. The pumps are costed based on commercially available solenoid metering pumps with suitable capacities of volumetric flowrate ranges and pressures. 3.2.1 Batch separation The vessels and unit operation equipment used in the example batch separation scheme (Figure 5) for ibuprofen, based on the process employed by Bogdan et al. (2009), have been costed using cost-capacity equations, with prices converted from U.S. Dollars to Pounds Sterling at a rate of 1:0.65
Table 1. Main annual material requirements (kg) for the production of 100 kg/yr of API, for full batch (BX,F), lean batch (BX,L) and continuous (CPM) separations schemes.
IbuprofenSEP ArtemisininSEP
SEP = BX,F (kg)
BX,L (kg)
CPM1 (kg)
CPM2 (kg)
Price (£/kg)
SEP =BX,F (kg)
BX,L (kg)
CPM1 (kg)
CPM2 (kg)
Price (£/kg)
Process reagents, catalysts and solvents
IBB 128 96 83 82 1.13 DHAA 188 188 207 230 -
C2H5COOH 70 53 46 45 1.81 DCA 1 1 1 1 108.65
PhI(OAc)2 311 233 201 201 67.70 TFA 45 45 50 55 15.43
TMOF 404 303 262 261 1.86 O2 82 82 90 100 0.50
Water 657 493 426 424 0.60 Toluene 135 135 149 166 0.56
TfOH 710 532 460 458 21.64 NaHCO3(aq) 701 701 773 859 0.57
KOH 1,435 1,076 929 926 0.93
MeOH 299 224 193 193 0.25
HCl 30% 2,534 1,900 1,641 1,635 0.08
Materials used in product separation and recovery
Water/brine 3,577 2,683 0 0 0.60 Cyclohexane 473 473 0 0 1.90
Et2O 3,138 2,353 0 0 1.59 EtOH 15 15 47 0 0.61
Toluene 0 0 326 0 0.56 EtOAc 0 0 0 24 0.56
Hex 0 0 0 216 0.49 ACN 16 0 0 0 1.56
Total 13,262 9,947 4,565 4,442 Total 1,655 1,639 1,318 1,436

9
(Woods, 2007). The mixing tanks IB-BX-T(1-5) are taken to be closed vessels with a single-turbine shaft (0.7 kW) operating at 50-100 rpm, with an alloy factor of 1.9 applied due to the use of corrosive substances (HCl 30%) brine, and a 0.9 factor for the cheaper relative cost of batch equipment. The evaporator IB-BX-EV1 was costed based on commercial rotary evaporators of suitable capacity. Dryers IB-BX-DR(1-3) are costed as batch agitated pan dryers under vacuum with heating via conduction. The filters IB-BX-F(1-3) are costed as vacuum leaf filters; a batch factor of 0.9 was also applied. Finally, the crystalliser IB-BX-CR1 is costed as a batch cooling crystalliser including mixer, scaled by internal volume; a batch factor of 0.9 was again applied. 3.2.2 Continuous separation As an alternative to complex and lengthy batch separation process, a continuous alternative was envisaged and evaluated. The equipment here does not have batch cost-adjustment factors applied. The mixing tanks IB-CPMX-T101 (toluene, X = 1, or hexane X = 2) are costed as closed vessels with a turbine, as for the batch mixing tanks. The liquid-liquid extractor IB-CPMX-T102 is costed as a mixer with a separate gravity phase separator, including drives and pumps.
3.3 Artemisinin flowsheet equipment The reactors for artemisinin synthesis are costed similarly to ibuprofen: they are costed based on a commercial modular flow reactor concept by Corning, which in addition is also offered as a photoreactor; a 10% price premium has been assumed to account for the photoreactor version. The pumps are solenoid metering pumps (commercially sourced prices), and the photoreactors have heat exchange functionality. 3.3.1 Batch separation The batch separation scheme employed by Kopetzki et al. (2013) has been used as a basis to allow a comparison between batch and continuous operation. The mixing vessels AR-BX-T(1-6) are closed turbine vessels, similar to the ones used for ibuprofen (single turbine, 50-100 rpm, alloy factor, and batch cost factor taken into account). A commercial rotary evaporator was used to cost AR-BX-EV1, and vacuum agitated pan dryers with a cost-capacity relationship used for AR-BX-DR(1-4); a cost-capacity relationship was also used for AR-BX-F(1-3), costing them as vacuum leaf filters, with a 0.9 batch factor applied. As with the crystalliser used in batch ibuprofen separation, batch cooling crystallisers (with batch factor 0.9) have been used as the cost-capacity basis for AR-BX-CR(1-3). 3.3.2 Continuous separation The continuous separation of artemisinin studied here (Figure 6) consist of three main process units, with two heat exchangers and pumps. The acid neutralisation tank AR-CPMX-T201 is costed as a single turbine mixing tank, as for other mixing tanks studied. Flash column AR-CPMX-FC201 was costed as a vertical pressure vessel that can operate at up to 1 MPa, and including access holes and nozzles. The heater AR-CPMX-HX201 and cooler AR-CPMX-HX202 were costed as shell and tube heat exchangers with fixed heads.
3.4 Operating Expenditure (OpEx) The cost of material purchase (including reagents, catalysts and solvents) forms a significant portion of the OpEx. The prices have been sourced from vendors as well as official records of imports and exports to and from countries including but not limited to France, Spain, Germany, Iran, Saudi Arabia, China, Bangladesh and India.
A subset of the established heuristics employed by Schaber et al. (2011) have been used to estimate the balance of the OpEx, which is utilities and waste disposal costs. Utilities costs have been estimated based on the total amount of material input: a figure of £0.96/kg has been used. Waste disposal costs have been estimated at £0.35/L for solvents, which constitute a significant majority of the waste.
10
Table 2. Free-On-Board cost estimates for key process equipment for ibuprofen: batch (full, BX,F; lean, BX,L) and CPM options (CPM 1,2).
Ibuprofen full batch production (BX,F) 100 kg/yr a 1,000 kg/yr a
Item Ref. Year f (%) Capacity basis n Units CA (£) SA SB,1C CB,1C (£) Tot1C (£) SB,1K CB,1K (£) Tot1K (£) Ref IB-R101 Reactor 2014 1.06 Volume (mL) 1.00 1 103,208 80.00 17.34 22,605 22,605 - - - (Corning, 2015)IB-R102 Reactor 2014 1.06 Volume (mL) 1.00 1 103,208 80.00 5.44 7,094 7,094 - - - (Corning, 2015)IB-R103 Reactor 2014 1.06 Volume (mL) 1.00 1 103,208 80.00 78.53 102,388 102,388 - - - (Corning, 2015)IB-HX(101-102) Cooler 2015 - - - 2 3,454 - - 3,454 6,907 - - - (Cole-Palmer, 2015)IB-P(101-106) Pump 2015 - - - 6 958 - - 958 5,748 - - - (ProMinent, 2015)IB-BX-T(1-5) Mixing tank 2007 10.33 Turbine power (kW) 0.30 5 22,230 5.00 0.70 13,599 67,993 - - - (Woods, 2007)IB-BX-EV1 Evaporator 2015 - - - 1 5,872 - - 5,872 5,872 - - - (FischerSci, 2015)IB-BX-DR(1-3) Dryer 2007 10.33 Drying area (m2) 0.32 3 58,500 3.00 0.10 21,737 65,210 - - - (Woods, 2007)IB-BX-F(1-2) Filter 2007 10.33 Filter area (m2) 0.60 2 134,550 150.00 0.50 7,268 14,536 - - - (Woods, 2007)IB-BX-CR1 Crystalliser 2007 10.33 Volume (m3) 0.68 1 146,250 75.00 0.20 2,867 2,867 - - - (Woods, 2007)
301,220 Ibuprofen lean batch production (BX,L)
Item Ref. Year f (%) Capacity basis n Units CA (£) SA SB,1C CB,1C (£) Tot1C (£) SB,1K CB,1K (£) Tot1K (£) Ref IB-R101 Reactor 2014 1.06 Volume (mL) 1.00 1 103,208 80.00 13.01 16,958 16,958 129.95 169,431 169,431 (Corning, 2015)IB-R102 Reactor 2014 1.06 Volume (mL) 1.00 1 103,208 80.00 4.08 5,317 5,317 40.87 53,283 53,283 (Corning, 2015)IB-R103 Reactor 2014 1.06 Volume (mL) 1.00 1 103,208 80.00 58.90 76,791 76,791 588.96 767,903 767,903 (Corning, 2015)IB-HX(101-102) Cooler 2015 - - - 2 3,454 - - 3,454 6,907 - 3,454 6,907 (Cole-Palmer, 2015)IB-P(101-106) Pump 2015 - - - 6 958 - - 958 5,748 - 958 5,748 (ProMinent, 2015)IB-BX-T(1-3) Mixing tank 2007 10.33 Turbine power (kW) 0.30 3 22,230 5.00 0.70 13,599 40,796 7.00 27,133 81,398 (Woods, 2007)IB-BX-EV1 Evaporator 2015 - - - 1 5,872 - - 5,872 5,872 - 5,872 5,872 (FischerSci, 2015) 158,389 1,090,543 Ibuprofen continuous production 1 (CPM 1)
Item Ref. Year f (%) Capacity basis n Units CA (£) SA SB,1C CB,1C (£) Tot1C (£) SB,1K CB,1K (£) Tot1K (£) Ref IB-R101 Reactor 2014 1.06 Volume (mL) 1.00 1 103,208 80.00 11.23 14,645 14,645 112.21 146,298 146,298 (Corning, 2015)IB-R102 Reactor 2014 1.06 Volume (mL) 1.00 1 103,208 80.00 3.52 4,589 4,589 35.28 46,005 46,005 (Corning, 2015)IB-R103 Reactor 2014 1.06 Volume (mL) 1.00 1 103,208 80.00 50.86 66,306 66,306 508.55 663,053 663,053 (Corning, 2015)IB-HX(101-102) Cooler 2015 - - - 2 3,454 - - 3,454 6,907 - 3,454 6,907 (Cole-Palmer, 2015)IB-P(101-108) Pump 2015 - - - 8 958 - - 958 7,664 - 958 7,664 (ProMinent, 2015)IB-CPM1-T101 Mixing tank 2007 10.33 Turbine power (kW) 0.30 1 24,700 5.00 0.70 15,109 15,109 7.00 30,147 30,147 (Woods, 2007)IB-CPM1-T102 LLE 2007 10.33 Volumetric flow (L s-1) 0.22 1 19,500 10.00 5.00 18,472 18,472 50.00 30,656 30,656 (Woods, 2007)
133,693 930,730 Ibuprofen continuous production 2 (CPM 2)
Item Ref. Year f (%) Capacity basis n Units CA (£) SA SB,1C CB,1C (£) Tot1C (£) SB,1K CB,1K (£) Tot1K (£) Ref IB-R101 Reactor 2014 1.06 Volume (mL) 1.00 1 103,208 80.00 11.19 14,596 14,596 111.83 145,808 145,808 (Corning, 2015)IB-R102 Reactor 2014 1.06 Volume (mL) 1.00 1 103,208 80.00 3.51 4,574 4,574 35.17 45,851 45,851 (Corning, 2015)IB-R103 Reactor 2014 1.06 Volume (mL) 1.00 1 103,208 80.00 50.68 66,084 66,084 506.84 660,830 660,830 (Corning, 2015)IB-HX(101-102) Cooler 2015 - - - 2 3,454 - - 3,454 6,907 - 3,454 6,907 (Cole-Palmer, 2015)IB-P(101-108) Pump 2015 - - - 8 958 - - 958 7,664 - 958 7,664 (ProMinent, 2015)IB-CPM2-T101 Mixing tank 2007 10.33 Turbine power (kW) 0.30 1 24,700 5.00 0.70 15,109 15,109 7.00 30,147 30,147 (Woods, 2007)IB-CPM2-T102 LLE 2007 10.33 Volumetric flow (L s-1) 0.22 1 19,500 10.00 5.00 18,472 18,472 50.00 30,656 30,656 (Woods, 2007) 133,407 927,864

11
Table 3. Free-On-Board cost estimates for key process equipment for artemisinin: batch (full, BX,F; lean, BX,L) and CPM options (CPM 1,2)
Ibuprofen full batch production (BX,F) 100 kg/yr a 1,000 kg/yr a
Item Ref. Year f (%) Capacity basis n Units CA (£) SA SB,1C CB,1C (£) Tot1C (£) SB,1K CB,1K (£) Tot1K (£) Ref AR-R201 Reactor 2014 1.06 Volume (mL) 1.00 1 113,529 80.00 19.72 28,286 28,286 - - - (Corning, 2015) AR-R202 Reactor 2014 1.06 Volume (mL) 1.00 1 113,529 80.00 78.92 113,191 113,191 - - - (Corning, 2015) AR-P(201-202) Pump 2015 - - - 2 958 - - 958 1,916 - - - (ProMinent, 2015) AR-BX-T(1-6) Mixing tank 2007 10.33 Turbine power (kW) 0.30 6 22,230 5.00 0.70 13,599 81,591 - - - (Woods, 2007) AR-BX-EV1 Evaporator 2015 - - - 1 5,872 - - 5,872 5,872 - - - (FischerSci, 2015) AR-BX-DR(1-4) Dryer 2007 10.33 Drying area (m2) 0.32 4 58,500 3.00 0.10 21,737 86,946 - - - (Woods, 2007) AR-BX-F(1-3) Filter 2007 10.33 Filter area (m2) 0.60 3 134,550 150.00 0.50 4,845 14,536 - - - (Woods, 2007) AR-BX-CR(1-3) Crystalliser 2007 10.33 Volume (m3) 0.68 3 146,250 75.00 0.20 2,867 8,602 - - - (Woods, 2007) 340,940 - Artemisinin lean batch production 1 (BX,L)
Item Ref. Year f (%) Capacity basis n Units CA (£) SA SB CB (£) Total (£) SB,1K CB,1K (£) Tot1K (£) Ref AR-R201 Reactor 2014 1.06 Volume (mL) 1.00 1 113,529 80.00 19.72 28,286 28,286 196.24 281,448 281,448 (Corning, 2015) AR-R202 Reactor 2014 1.06 Volume (mL) 1.00 1 113,529 80.00 78.92 113,191 113,191 785.30 1,126,282 1,126,282 (Corning, 2015) AR-P(201-202) Pump 2015 - - - 2 958 - - 958 1,916 - 958 1,916 (ProMinent, 2015) AR-BX-T(1-3) Mixing tank 2007 10.33 Turbine power (kW) 0.30 3 22,230 5.00 0.70 13,599 40,796 7.00 27,133 81,398 (Woods, 2007) AR-BX-EV1 Evaporator 2015 - - - 1 5,872 - - 5,872 5,872 - 5,872 5,872 (FischerSci, 2015) AR-BX-DR(1-2) Dryer 2007 10.33 Drying area (m2) 0.32 2 58,500 3.00 0.10 21,737 43,473 1.00 45,414 90,828 (Woods, 2007) AR-BX-F(1-3) Filter 2007 10.33 Filter area (m2) 0.60 3 134,550 150.00 0.50 4,845 14,536 5.00 19,290 19,290 (Woods, 2007) AR-BX-CR(1-3) Crystalliser 2007 10.33 Volume (m3) 0.68 3 146,250 75.00 0.20 2,867 8,602 2.00 13,724 41,171 (Woods, 2007) 246,981 1,648,204 Artemisinin continuous production 1 (CPM 1)
Item Ref. Year f (%) Capacity basis n Units CA (£) SA SB,1C CB,1C (£) Tot1C (£) SB,1K CB,1K (£) Tot1K (£) Ref AR-R201 Reactor 2014 1.06 Volume (mL) 1.00 1 113,529 80.00 21.76 31,208 31,208 217.62 312,109 312,109 (Corning, 2015) AR-R202 Reactor 2014 1.06 Volume (mL) 1.00 1 113,529 80.00 87.08 124,884 124,884 870.84 1,248,966 1,248,966 (Corning, 2015) AR-P(201-204) Pump 2015 - - - 4 958 - - 958 3,832 - 958 3,832 (ProMinent, 2015) AR-CPM1-T201 Mixing tank 2007 10.33 Volume (m3) 0.30 1 24,700 10.00 0.70 15,109 15,109 7.00 30,147 30,147 (Woods, 2007) AR-CPM1-EX201 LLE 2007 10.33 Volumetric flow (L s-1) 0.22 1 19,500 10.00 5.00 18,472 18,472 50.00 30,656 30,656 (Woods, 2007) AR-CPM1-HX(201-202) Heat exchangers 2007 10.33 Heat transfer area (m2) 0.71 2 45,500 100.00 20.00 16,012 32,025 200.00 82,121 164,243 (Woods, 2007) AR-CPM1-FC201 Flash column 2007 10.33 Volume (m3) 0.52 1 65,000 20.00 1.00 37,760 37,760 10.00 125,035 125,035 (Woods, 2007) AR-CPM1-CR201 Crystalliser 2007 10.33 Volume (m3) 0.68 1 162,500 75.00 0.20 3,186 3,186 2.00 15,248 15,248 (Woods, 2007) 266,476 1,930,236 Artemisinin continuous production 2 (CPM 2)
Item Ref. Year f (%) Capacity basis n Units CA (£) SA SB,1C CB,1C (£) Tot1C (£) SB,1K CB,1K (£) Tot1K (£) Ref AR-R201 Reactor 2014 1.06 Volume (mL) 1.00 1 113,529 80.00 24.17 34,671 34,671 241.77 346,752 346,752 (Corning, 2015) AR-R202 Reactor 2014 1.06 Volume (mL) 1.00 1 113,529 80.00 96.74 138,741 138,741 967.50 1,387,596 1,387,596 (Corning, 2015) AR-P(201-204) Pump 2015 - - - 4 958 - - 958 3,832 - 9,580 38,320 (ProMinent, 2015) AR-CPM2-T201 Mixing tank 2007 10.33 Volume (m3) 0.30 1 24,700 10.00 0.70 15,109 15,109 7.00 30,147 30,147 (Woods, 2007) AR-CPM2-EX201 LLE 2007 10.33 Volumetric flow (L s-1) 0.22 1 19,500 10.00 5.00 18,472 18,472 50.00 30,656 30,656 (Woods, 2007) AR-CPM2-HX(201-202) Heat exchangers 2007 10.33 Heat transfer area (m2) 0.71 2 45,500 100.00 20.00 16,012 32,025 200.00 82,121 164,243 (Woods, 2007) AR-CPM2-FC201 Flash column 2007 10.33 Volume (m3) 0.52 1 65,000 20.00 1.00 37,760 37,760 10.00 125,035 125,035 (Woods, 2007) AR-CPM2-CR201 Crystalliser 2007 10.33 Volume (m3) 0.68 1 162,500 75.00 0.20 3,186 3,186 2.00 15,248 15,248 (Woods, 2007) 283,796 2,137,998

12
These values represent the best estimates at the current time. Labour costs have not been included as these processes are not at the highest of production scales, and the batch separation schemes employed in each experimental demonstration did not take processing time as a consideration; some operations were left overnight (Bogdan et al., 2009; Seeberger et al., 2014). Batch processes however require significant manual intervention (Plumb, 2005), and with the number of operations employed, labour costs are likely to be high. Optimisation of the batch separations (with regards to batch sizes, number of vessels, and scheduling) will help lower operating costs, but it is unlikely that they will be on par with continuous alternatives.
The sensitivity of the cost savings to changes to key ingredient (KI) price and solvent recovery (SR) have been studied in comparison to the base conditions. The base KI cost conditions are: £1.13/kg isobutyl benzene (ibuprofen KI), a representative market price, and for the artemisinin processes no KI (DHAA) purchase cost has been assumed given the benefits of installing the artemisinin process alongside an existing traditional batch production plant (to make use of waste DHAA as feed); the base conditions for solvent recovery are 90% (including process solvents and solvents used in product separation). Sensitivity of the cost savings to KI prices of £5/kg and £10/kg (KI5 and KI10, respectively) has been studied, while for the effects of poorer solvent recovery on cost savings recovery rates of 70% and 50% (SR70 and SR50, respectively) have been studied.
3.5 Total Costs To quantify the combined impact of both the CapEx and OpEx, a 20-year plant lifetime was imagined and the total cost of operation – as Net Present Value (NPV) – has been calculated:
1i ir1
OpExCapExNPV (2)
Here, τ is the plant lifetime, r is the discount rate (the taken to be the annual interest rate; a value of 5% has been used). Equation (2) calculates the total cost, in present-day terms, of running a given process for the designated timespan, 20 years in this case.
Table 4. CapEx costs (£) and savings for batch (full) and continuous API separation and recovery (102 kg/yr API production).
Ibuprofen Artemisinin
BX,F CPM 1 (savings) CPM 2 (savings) BX,F CPM 1 (savings) CPM 2 (savings)
Base case BLIC 733,989 325,773 (–55.6%) 320,406 (–56.3%) 807,162 649,326 (–19.6%) 691,532 (–14.3%)
WCC 163,093 66,055 (–59.5%) 64,976 (–60.2%) 162,218 129,917 (–19.9%) 138,363 (–14.7%)
Total 897,082 391,828 (–56.3%) 385,381 (–57.0%) 969,380 779,243 (–19.6%) 829,895 (–14.4%)
KI5 BLIC 733,989 325,773 (–55.6%) 320,406 (–56.3%) 807,162 649,326 (–19.6%) 691,532 (–14.3%)
WCC 164,503 66,066 (–59.8%) 64,987 (–60.5%) 162,547 129,953 (–20.1%) 138,404 (–14.9%)
Total 898,491 391,839 (–56.4%) 385,393 (–57.1%) 969,709 779,280 (–19.6%) 829,935 (–14.4%)
KI10 BLIC 733,989 325,773 (–55.6%) 320,406 (–56.3%) 807,162 649,326 (–19.6%) 691,532 (–14.3%)
WCC 164,726 66,080 (–59.9%) 65,001 (–60.5%) 162,875 129,990 (–20.2%) 138,444 (–15.0%)
Total 898,715 391,854 (–56.4%) 385,407 (–57.1%) 970,038 779,316 (–19.7%) 829,975 (–14.4%)
SR70 BLIC 733,989 325,773 (–55.6%) 320,406 (–56.3%) 807,162 649,326 (–19.6%) 691,532 (–14.3%)
WCC 171,847 66,071 (–61.6%) 64,986 (–62.2%) 162,923 129,925 (–20.3%) 138,371 (–15.1%)
Total 905,835 391,844 (–56.7%) 385,392 (–57.5%) 970,085 779,251 (–19.7%) 829,903 (–14.5%)
SR50 BLIC 733,989 325,773 (–55.6%) 320,406 (–56.3%) 807,162 649,326 (–19.6%) 691,532 (–14.3%)
WCC 179,363 66,087 (–63.2%) 64,997 (–63.8%) 163,629 129,933 (–20.6%) 138,379 (–15.4%)
Total 913,352 391,860 (–57.1%) 385,403 (–57.8%) 970,791 779,259 (–19.7%) 829,911 (–14.5%)

13
4 RESULTS A graphical summary to the cost savings is given in Figure 7, Figure 8 and Figure 9.
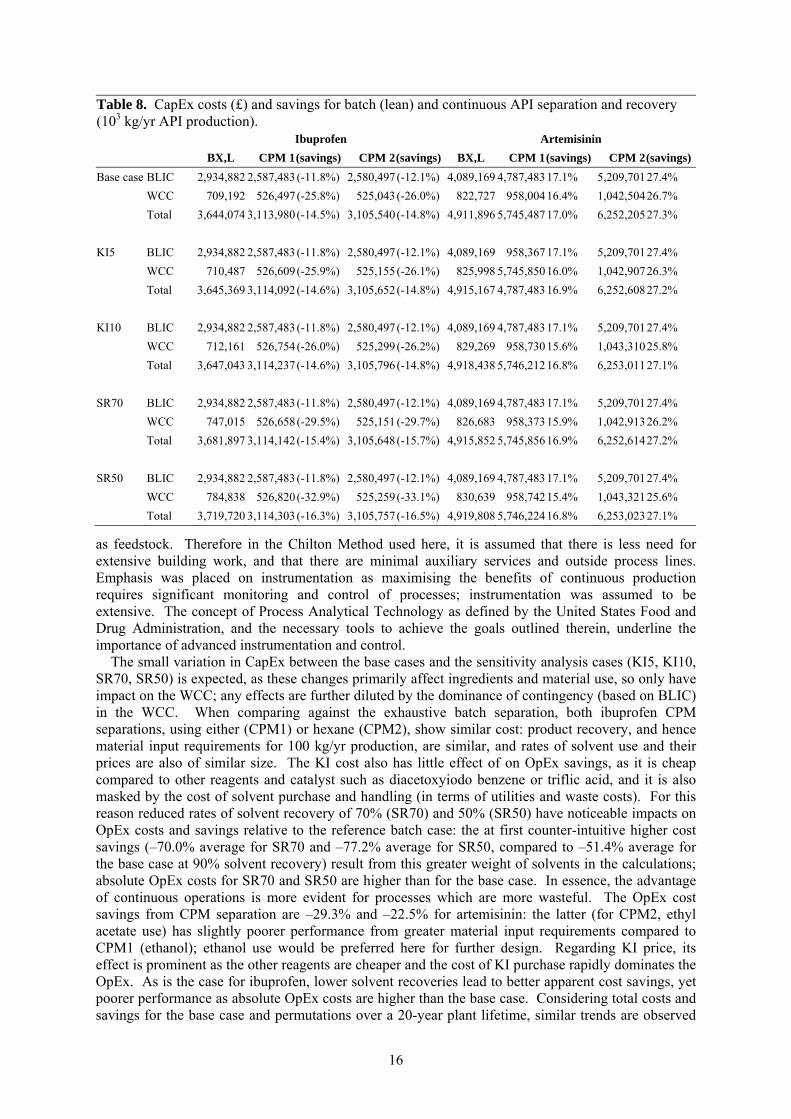
4.1 Capital Expenditure Ibuprofen shows CapEx savings at between –56.3% and –57.8% with respect to the full batch separation, and between –17.6% and –19.0% with respect to the lean batch separation. For artemisinin savings of between –14.4% and –19.7% are attainable with respect to the full batch separation, while the CapEx, for the continuous separations, is in fact between 7.5% and 14.8% greater than the lean batch separation. There is little variation across the sensitivity options KI5, KI10, SR70 and SR50, which is expected as these concern material prices and waste rather than equipment directly; there is some variation from the different levels working capital required. A summary of these values is given in Table 4 and Table 5. At higher the process scale of 1,000 kg/yr API production, the CapEx savings (Table 8) for ibuprofen are broadly similar to the 100 kg/yr scale. However, for artemisinin, as for the lower scale, performing product separation using continuous operations is again more costly in terms of CapEx (Table 8).
4.2 Operating Expenditure In contrast with CapEx, there is greater variation in OpEx savings, and solvent recovery rates have a larger impact than KI prices (Table 6, Table 7). For ibuprofen OpEx savings are between –51.2% and –54.0% for 90% solvent recovery, increasing to over –76% in the case of SR50, when continuous separation is compared to the full batch separation. When compared to the lean batch separation of ibuprofen, OpEx savings are between –34.5% and –65.0%. Both KI prices and solvent recovery rates have significant effects on OpEx for artemisinin, with savings varying between –8.9% and –44.9% compared to the full batch separation, and a similar range for the lean batch case. At the higher process scale, OpEx savings for ibuprofen are similar as for the lower scale. For artemisinin, greater OpEx is required for continuous separation relative to the lean batch case when at a 1,000 kg/yr scale (Table 9).
Table 5. CapEx costs (£) and savings for batch (lean) and continuous API separation and recovery (102 kg/yr API production).
Ibuprofen Artemisinin
BX,L CPM 1 (savings) CPM 2 (savings) BX,L CPM 1 (savings) CPM 2 (savings)
Base case BLIC 385,950 325,773 (-15.6%) 320,406 (-15.8%) 601,823 649,326 7.9% 691,532 14.9%
WCC 89,412 66,055 (-26.1%) 64,976 (-26.3%) 121,141 129,917 7.2% 138,363 14.2%
Total 475,362 391,828 (-17.6%) 385,381 (-17.8%) 722,965 779,243 7.8% 829,895 14.8%
KI5 BLIC 385,950 325,773 (-15.6%) 320,406 (-15.8%) 601,823 649,326 7.9% 691,532 14.9%
WCC 89,541 66,066 (-26.2%) 64,987 (-26.4%) 121,470 129,953 7.0% 138,404 13.9%
Total 475,492 391,839 (-17.6%) 385,393 (-17.8%) 723,294 779,280 7.7% 829,935 14.7%
KI10 BLIC 385,950 325,773 (-15.6%) 320,406 (-15.8%) 601,823 649,326 7.9% 691,532 14.9%
WCC 89,709 66,080 (-26.3%) 65,001 (-26.5%) 121,799 129,990 6.7% 138,444 13.7%
Total 475,659 391,854 (-17.6%) 385,407 (-17.8%) 723,622 779,316 7.7% 829,975 14.7%
SR70 BLIC 385,950 325,773 (-15.6%) 320,406 (-15.8%) 601,823 649,326 7.9% 691,532 14.9%
WCC 93,194 66,071 (-29.1%) 64,986 (-29.3%) 122,109 129,925 6.4% 138,371 13.3%
Total 479,144 391,844 (-18.2%) 385,392 (-18.4%) 723,932 779,251 7.6% 829,903 14.6%
SR50 BLIC 385,950 325,773 (-15.6%) 320,406 (-15.8%) 601,823 649,326 7.9% 691,532 14.9%
WCC 96,976 66,087 (-31.9%) 64,997 (-32.0%) 123,076 129,933 5.6% 138,379 12.5%
Total 482,927 391,860 (-18.9%) 385,403 (-19.0%) 724,900 779,259 7.5% 829,911 14.5%
14
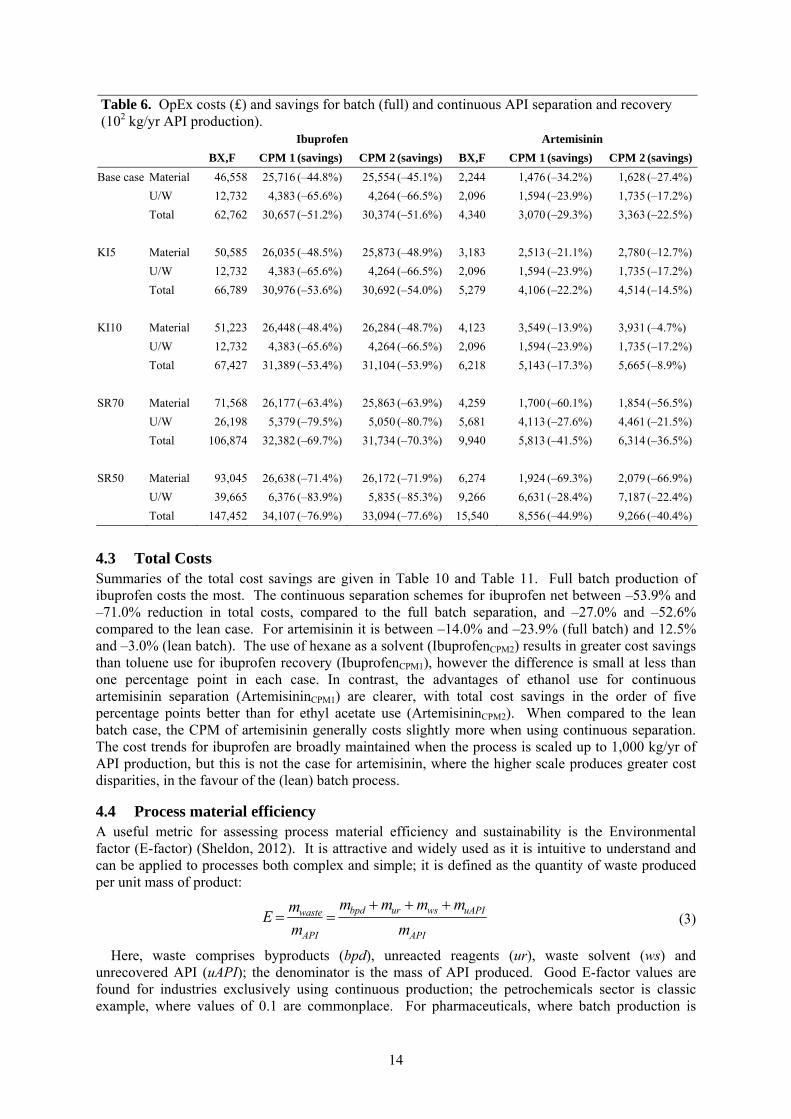
4.3 Total Costs Summaries of the total cost savings are given in Table 10 and Table 11. Full batch production of ibuprofen costs the most. The continuous separation schemes for ibuprofen net between –53.9% and –71.0% reduction in total costs, compared to the full batch separation, and –27.0% and –52.6% compared to the lean case. For artemisinin it is between –14.0% and –23.9% (full batch) and 12.5% and –3.0% (lean batch). The use of hexane as a solvent (IbuprofenCPM2) results in greater cost savings than toluene use for ibuprofen recovery (IbuprofenCPM1), however the difference is small at less than one percentage point in each case. In contrast, the advantages of ethanol use for continuous artemisinin separation (ArtemisininCPM1) are clearer, with total cost savings in the order of five percentage points better than for ethyl acetate use (ArtemisininCPM2). When compared to the lean batch case, the CPM of artemisinin generally costs slightly more when using continuous separation. The cost trends for ibuprofen are broadly maintained when the process is scaled up to 1,000 kg/yr of API production, but this is not the case for artemisinin, where the higher scale produces greater cost disparities, in the favour of the (lean) batch process.
4.4 Process material efficiency A useful metric for assessing process material efficiency and sustainability is the Environmental factor (E-factor) (Sheldon, 2012). It is attractive and widely used as it is intuitive to understand and can be applied to processes both complex and simple; it is defined as the quantity of waste produced per unit mass of product:
API
uAPIwsurbpd
API
waste
m
mmmm
m
mE
(3)
Here, waste comprises byproducts (bpd), unreacted reagents (ur), waste solvent (ws) and unrecovered API (uAPI); the denominator is the mass of API produced. Good E-factor values are found for industries exclusively using continuous production; the petrochemicals sector is classic example, where values of 0.1 are commonplace. For pharmaceuticals, where batch production is
Table 6. OpEx costs (£) and savings for batch (full) and continuous API separation and recovery (102 kg/yr API production).
Ibuprofen Artemisinin
BX,F CPM 1 (savings) CPM 2 (savings) BX,F CPM 1 (savings) CPM 2 (savings)
Base case Material 46,558 25,716 (–44.8%) 25,554 (–45.1%) 2,244 1,476 (–34.2%) 1,628 (–27.4%)
U/W 12,732 4,383 (–65.6%) 4,264 (–66.5%) 2,096 1,594 (–23.9%) 1,735 (–17.2%)
Total 62,762 30,657 (–51.2%) 30,374 (–51.6%) 4,340 3,070 (–29.3%) 3,363 (–22.5%)
KI5 Material 50,585 26,035 (–48.5%) 25,873 (–48.9%) 3,183 2,513 (–21.1%) 2,780 (–12.7%)
U/W 12,732 4,383 (–65.6%) 4,264 (–66.5%) 2,096 1,594 (–23.9%) 1,735 (–17.2%)
Total 66,789 30,976 (–53.6%) 30,692 (–54.0%) 5,279 4,106 (–22.2%) 4,514 (–14.5%)
KI10 Material 51,223 26,448 (–48.4%) 26,284 (–48.7%) 4,123 3,549 (–13.9%) 3,931 (–4.7%)
U/W 12,732 4,383 (–65.6%) 4,264 (–66.5%) 2,096 1,594 (–23.9%) 1,735 (–17.2%)
Total 67,427 31,389 (–53.4%) 31,104 (–53.9%) 6,218 5,143 (–17.3%) 5,665 (–8.9%)
SR70 Material 71,568 26,177 (–63.4%) 25,863 (–63.9%) 4,259 1,700 (–60.1%) 1,854 (–56.5%)
U/W 26,198 5,379 (–79.5%) 5,050 (–80.7%) 5,681 4,113 (–27.6%) 4,461 (–21.5%)
Total 106,874 32,382 (–69.7%) 31,734 (–70.3%) 9,940 5,813 (–41.5%) 6,314 (–36.5%)
SR50 Material 93,045 26,638 (–71.4%) 26,172 (–71.9%) 6,274 1,924 (–69.3%) 2,079 (–66.9%)
U/W 39,665 6,376 (–83.9%) 5,835 (–85.3%) 9,266 6,631 (–28.4%) 7,187 (–22.4%)
Total 147,452 34,107 (–76.9%) 33,094 (–77.6%) 15,540 8,556 (–44.9%) 9,266 (–40.4%)

15
almost universal, values of 200 are not uncommon (Ritter, 2013). Here, E-factor values have been computed to give an indication of the material efficiencies of the processes studied (Table 10, Table 11). For both process scales continuous separation has a clear advantage with superior E-factor values. Naturally, poorer solvent recovery (SR70, SR50) results in worse material efficiency (higher E-factor values), and there is no effect on material efficiency from KI cost. The leaner batch processes show improved E-factors, however they are still worse than the continuous alternatives. An increase in process scale from 100 to 1,000 kg/yr API production did not discernably impact E-factor values.
5 DISCUSSION
The process units and auxiliary equipment have been costed by finding prices for items of suitable capacity where possible; remaining items were costed using cost-capacity relationships with typical reference cost for the given type of equipment. In general, the required design capacities used studied here are at the low end of the application range for the relationships, and so some degree of cost overestimation is assumed. The key pieces of equipment which constitute the bulk of the capital expenditure are the plug flow reactors. They are based on a commercial microreactor system. As an emerging field of research, it is recognized that there are few established cost estimation methods available for microreactors (Harmsen, 2012), and while it is expected that there is a greater margin of uncertainty in this unit operation compared to others, this is the best approximation of the cost that can be made at this time. There are many heuristics that have been developed to estimate battery-limits installed costs, and the Chilton Method has been used here. There were two key considerations while applying this method. The first was that at 100 kg/yr and 1,000 kg/yr API production, these processes remain relatively small, and construction of dedicated facilities is unlikely. The second is that in the case of artemisinin the key ingredient DHAA is a waste product from the normal process of artemisinin extraction (from plants), and it is reported that waste mother liquor in this latter process can be used directly without any pretreatment as feedstock in the continuous synthesis described by Kopetzki et al. (2013) and studied here. There would value-adding benefits to installing CPM processes at existing plants for artemisinin production to capitalize on this ability to use waste directly
Table 7. OpEx costs (£) and savings for batch (lean) and continuous API separation and recovery (102 kg/yr API production).
Ibuprofen Artemisinin
BX,L CPM 1 (savings) CPM 2 (savings) BX,L CPM 1 (savings) CPM 2 (savings)
Base case Material 34,919 25,716 (-26.4%) 25,554 (-26.8%) 2,219 1,476 (-33.5%) 1,628 (-26.6%)
U/W 9,549 4,383 (-54.1%) 4,264 (-55.3%) 2,073 1,594 (-23.1%) 1,735 (-16.3%)
Total 47,072 30,657 (-34.9%) 30,374 (-35.5%) 4,293 3,070 (-28.5%) 3,363 (-21.7%)
KI5 Material 35,289 26,035 (-26.2%) 25,873 (-26.7%) 3,159 2,513 (-20.5%) 2,780 (-12.0%)
U/W 9,549 4,383 (-54.1%) 4,264 (-55.3%) 2,073 1,594 (-23.1%) 1,735 (-16.3%)
Total 47,442 30,976 (-34.7%) 30,692 (-35.3%) 5,232 4,106 (-21.5%) 4,514 (-13.7%)
KI10 Material 35,767 26,448 (-26.1%) 26,284 (-26.5%) 4,098 3,549 (-13.4%) 3,931 (-4.1%)
U/W 9,549 4,383 (-54.1%) 4,264 (-55.3%) 2,073 1,594 (-23.1%) 1,735 (-16.3%)
Total 47,920 31,389 (-34.5%) 31,104 (-35.1%) 6,171 5,143 (-16.7%) 5,665 (-8.2%)
SR70 Material 45,725 26,177 (-42.8%) 25,863 (-43.4%) 4,984 1,700 (-48.2%) 1,854 (-43.2%)
U/W 19,649 5,379 (-72.6%) 5,050 (-74.3%) 5,614 4,113 (-26.7%) 4,461 (-20.5%)
Total 72,204 32,382 (-55.2%) 31,734 (-56.1%) 10,597 5,813 (-36.8%) 6,314 (-31.2%)
SR50 Material 56,532 26,638 (-52.9%) 26,172 (-53.7%) 7,748 1,924 (-52.4%) 2,079 (-47.9%)
U/W 29,749 6,376 (-78.6%) 5,835 (-80.4%) 9,154 6,631 (-27.6%) 7,187 (-21.5%)
Total 97,337 34,107 (-65.0%) 33,094 (-66.0%) 16,902 8,556 (-39.0%) 9,266 (-33.6%)
16
as feedstock. Therefore in the Chilton Method used here, it is assumed that there is less need for extensive building work, and that there are minimal auxiliary services and outside process lines. Emphasis was placed on instrumentation as maximising the benefits of continuous production requires significant monitoring and control of processes; instrumentation was assumed to be extensive. The concept of Process Analytical Technology as defined by the United States Food and Drug Administration, and the necessary tools to achieve the goals outlined therein, underline the importance of advanced instrumentation and control.
The small variation in CapEx between the base cases and the sensitivity analysis cases (KI5, KI10, SR70, SR50) is expected, as these changes primarily affect ingredients and material use, so only have impact on the WCC; any effects are further diluted by the dominance of contingency (based on BLIC) in the WCC. When comparing against the exhaustive batch separation, both ibuprofen CPM separations, using either (CPM1) or hexane (CPM2), show similar cost: product recovery, and hence material input requirements for 100 kg/yr production, are similar, and rates of solvent use and their prices are also of similar size. The KI cost also has little effect of on OpEx savings, as it is cheap compared to other reagents and catalyst such as diacetoxyiodo benzene or triflic acid, and it is also masked by the cost of solvent purchase and handling (in terms of utilities and waste costs). For this reason reduced rates of solvent recovery of 70% (SR70) and 50% (SR50) have noticeable impacts on OpEx costs and savings relative to the reference batch case: the at first counter-intuitive higher cost savings (–70.0% average for SR70 and –77.2% average for SR50, compared to –51.4% average for the base case at 90% solvent recovery) result from this greater weight of solvents in the calculations; absolute OpEx costs for SR70 and SR50 are higher than for the base case. In essence, the advantage of continuous operations is more evident for processes which are more wasteful. The OpEx cost savings from CPM separation are –29.3% and –22.5% for artemisinin: the latter (for CPM2, ethyl acetate use) has slightly poorer performance from greater material input requirements compared to CPM1 (ethanol); ethanol use would be preferred here for further design. Regarding KI price, its effect is prominent as the other reagents are cheaper and the cost of KI purchase rapidly dominates the OpEx. As is the case for ibuprofen, lower solvent recoveries lead to better apparent cost savings, yet poorer performance as absolute OpEx costs are higher than the base case. Considering total costs and savings for the base case and permutations over a 20-year plant lifetime, similar trends are observed
Table 8. CapEx costs (£) and savings for batch (lean) and continuous API separation and recovery (103 kg/yr API production).
Ibuprofen Artemisinin
BX,L CPM 1 (savings) CPM 2 (savings) BX,L CPM 1 (savings) CPM 2 (savings)
Base case BLIC 2,934,882 2,587,483 (-11.8%) 2,580,497(-12.1%) 4,089,169 4,787,48317.1% 5,209,701 27.4%
WCC 709,192 526,497 (-25.8%) 525,043(-26.0%) 822,727 958,00416.4% 1,042,504 26.7%
Total 3,644,074 3,113,980 (-14.5%) 3,105,540(-14.8%) 4,911,896 5,745,48717.0% 6,252,205 27.3%
KI5 BLIC 2,934,882 2,587,483 (-11.8%) 2,580,497(-12.1%) 4,089,169 958,36717.1% 5,209,701 27.4%
WCC 710,487 526,609 (-25.9%) 525,155(-26.1%) 825,998 5,745,85016.0% 1,042,907 26.3%
Total 3,645,369 3,114,092 (-14.6%) 3,105,652(-14.8%) 4,915,167 4,787,48316.9% 6,252,608 27.2%
KI10 BLIC 2,934,882 2,587,483 (-11.8%) 2,580,497(-12.1%) 4,089,169 4,787,48317.1% 5,209,701 27.4%
WCC 712,161 526,754 (-26.0%) 525,299(-26.2%) 829,269 958,73015.6% 1,043,310 25.8%
Total 3,647,043 3,114,237 (-14.6%) 3,105,796(-14.8%) 4,918,438 5,746,21216.8% 6,253,011 27.1%
SR70 BLIC 2,934,882 2,587,483 (-11.8%) 2,580,497(-12.1%) 4,089,169 4,787,48317.1% 5,209,701 27.4%
WCC 747,015 526,658 (-29.5%) 525,151(-29.7%) 826,683 958,37315.9% 1,042,913 26.2%
Total 3,681,897 3,114,142 (-15.4%) 3,105,648(-15.7%) 4,915,852 5,745,85616.9% 6,252,614 27.2%
SR50 BLIC 2,934,882 2,587,483 (-11.8%) 2,580,497(-12.1%) 4,089,169 4,787,48317.1% 5,209,701 27.4%
WCC 784,838 526,820 (-32.9%) 525,259(-33.1%) 830,639 958,74215.4% 1,043,321 25.6%
Total 3,719,720 3,114,303 (-16.3%) 3,105,757(-16.5%) 4,919,808 5,746,22416.8% 6,253,023 27.1%

17
(Table 11). For both APIs, continuous separation costs less than batch, and KI price has relatively little impact, being dominated by CapEx costs. Poorer solvent recoveries do however reduce performance: while costs are lower than the reference batch cases, and there are higher percentage savings (particularly for ibuprofen), absolute costs are nevertheless higher than the base case with goodsolvent recovery rates. This is further underlined by the worse material efficiency for SR70 and SR50. Base case E-factor values are 44.0 for ibuprofen (average CPM1 and CPM2) and 12.8 for artemisinin (average), which are improved over the reference batch separation values of 131.6 and 15.6 for ibuprofen and artemisinin, respectively, which worsen poorer solvent recovery. The CPM case E-factors calculated here are acceptable for a pharmaceutical process, considering typical values for (Ritter, 2013); other syntheses of ibuprofen over the years are reported to have E-factors between 50 to over 10,000 (Andraos, 2011).
When the continuous separations (CPM1 and CPM2) for each API are compared against the modified, leaner batch separation, the spectrum of cost savings changes. The potential CapEx savings are reduced, which is not unexpected as there are fewer plant items in the batch separation flowsheets. Indeed, while there are still CapEx savings in the case of ibuprofen, for artemisinin the continuous separations cost more. This is chiefly due to the lower estimated product recoveries in the continuous crystallisation operations, which in turn require greater material input and larger reactors, which significantly contribute to CapEx costs. However, it should be noted that the time required to complete the batch separation process is not fully elucidated in the literature, and so the overall material processing rate may be lower than assumed here, which could lead to higher CapEx for the batch case, and so more favourable cost comparisons for continuous separation cases. The potential OpEx savings, while still generally good, are diminished in the ibuprofen cases. For artemisinin, OpEx savings are relatively unchanged between comparisons to lean and exhaustive batch separations. This is chiefly due to the difference in unit operations omitted in the simplification of the batch separations, with those omitted from the ibuprofen flowsheets requiring more auxiliary material, and from the increased material input requirements for the ibuprofen cases (which leads to increased costs for material purchase, handling and waste treatment). The diminished cost advantages for artemisinin continuous separation, arising from higher CapEx costs, carry over into total costs: for the
Table 9. OpEx costs (£) and savings for batch (lean) and continuous API separation and recovery (103 kg/yr API production).
Ibuprofen Artemisinin
BX,L CPM 1 (savings) CPM 2 (savings) BX,L CPM 1 (savings) CPM 2 (savings)
Base case Material 349,187 257,158 (-26.4%) 255,542 (-26.8%) 13,982 14,504 (3.7%) 16,102 (15.2%)
U/W 95,489 43,828 (-54.1%) 42,643 (-55.3%) 18,713 15,750 (-15.8%) 17,218 (-8.0%)
Total 470,717 306,510 (-34.9%) 303,690 (-35.5%) 32,695 30,254 (-7.5%) 33,320 (1.9%)
KI5 Material 352,886 260,353 (-26.2%) 258,726 (-26.7%) 23,327 24,866 (6.6%) 27,614 (18.4%)
U/W 95,489 43,828 (-54.1%) 42,643 (-55.3%) 18,713 15,750 (-15.8%) 17,218 (-8.0%)
Total 474,416 309,704 (-34.7%) 306,873 (-35.3%) 42,040 40,616 (-3.4%) 44,832 (6.6%)
KI10 Material 357,670 264,483 (-26.1%) 262,843 (-26.5%) 32,672 35,228 (7.8%) 39,126 (19.8%)
U/W 95,489 43,828 (-54.1%) 42,643 (-55.3%) 18,713 15,750 (-15.8%) 17,218 (-8.0%)
Total 479,200 313,835 (-34.5%) 310,990 (-35.1%) 51,385 50,978 (-0.8%) 56,344 (9.7%)
SR70 Material 457,252 261,768 (-42.8%) 258,629 (-43.4%) 25,285 25,038 (-1.0%) 27,781 (9.9%)
U/W 196,488 53,792 (-72.6%) 50,497 (-74.3%) 50,106 40,560 (-19.1%) 44,224 (-11.7%)
Total 722,043 323,651 (-55.2%) 317,188 (-56.1%) 75,390 65,598 (-13.0%) 72,005 (-4.5%)
SR50 Material 565,318 266,378 (-52.9%) 261,716 (-53.7%) 36,588 35,572 (-2.8%) 39,461 (7.9%)
U/W 297,487 63,756 (-78.6%) 58,352 (-80.4%) 81,498 65,370 (-19.8%) 71,229 (-12.6%)
Total 973,370 340,792 (-65.0%) 330,686 (-66.0%) 118,086 100,942 (-14.5%) 110,690 (-6.3%)

18
majority of cases, total costs for continuous separation cases are marginally higher than the lean batch case.
Evaluating the processes (lean batch vs continuous separation) at the higher process scale of 1,000 kg/yr underlined a diverging trend between the ibuprofen and artemisinin processes. At the higher scale, cost savings are not readily apparent for artemisinin, while all cases studied for ibuprofen continuous separation yield total cost reductions. This highlights the great variability between different processes, their chemistries and their operation. As has been done by many groups, case-by-case investigations of candidate APIs is required. Nevertheless, the artemisinin synthesis route studied here does show significant promise, and with further optimisation and exhaustive design, the apparent cost of continuous separations could potentially be lowered. Indeed, there are plans to commercialise this process (Extance, 2012).
In recent years, although there have been many publications in the field of CPM, there have only been a handful of studies including direct comparisons of batch and continuous production for the same API. In one of the first such examples, an extensive comparison was made for a full end-to-end synthesis of an API and in some cases up to 76% capital expenditure or 40% total cost savings could be made by switching from batch production (Schaber et al., 2011). In a similar study comparing five continuous schemes to a reference batch case for the 100 kg/yr production of typical high-value, low-volume API found capital expenditure reductions of up to 72% and total cost savings between 31% and 35% (Denčić et al., 2014).
With the exception of the reactors and some auxiliary items such as pumps, chillers and evaporators, the unit operations have been costed as standard types of continuous equipment (Woods, 2007). There is a need for research into unit operations specifically for use with CPM and at the microscale (Schaber et al., 2011). While some areas such as microreactors (Kockmann et al., 2008; Kockmann and Roberge, 2009; Hartman, 2012) and tablet manufacturing and granulation (Fonteyne et al., 2014; Rogers et al., 2014; Järvinen et al., 2015) are frequently researched, areas such as continuous crystallisation have only recently begun to see an increase in publications. In particular, , recent research into plug flow crystallisers and oscillatory baffled crystallisers has shown promise, with some designs achieving over 98% yield or a 97.9% reduction of required operating times (Lawton et al., 2009; Wong et al., 2012; Ferguson et al., 2014; Besenhard et al., 2015; Majumder and Nagy, 2015).
Rapid comparative economic analyses are invaluable tools for evaluating process potential. Given the costly reagents used in the ibuprofen synthesis shown here, commercialisation is not envisaged without further development and modification, however the artemisinin design developed by Kopetzki et al. (2013) shows great promise and there are plans for industrial-scale versions (Extance,
Table 10. Total costs (£) and savings (percent difference) for batch (full) and continuous API separation and recovery (102 kg/yr API production).
Ibuprofen Artemisinin
BX,F CPM 1 (savings) CPM 2 (savings) BX,F CPM 1 (savings) CPM 2 (savings)
Base case Total 1,679,238 773,877(–53.9%) 763,908(–54.5%) 1,023,465 817,505(-20.1%) 871,805(-14.8%)
E-factor 131.6 44.7 43.4 15.6 12.2 13.4
KI5 Total 1,730,834 777,869(–55.1%) 767,887(–55.6%) 1,035,498 830,455(-19.8%) 886,192(-14.4%)
E-factor 131.6 44.7 43.4 15.6 12.2 13.4
KI10 Total 1,739,006 783,032(–55.0%) 773,032(–55.5%) 1,047,531 843,405(-19.5%) 900,579(-14.0%)
E-factor 131.6 44.7 43.4 15.6 12.2 13.4
SR70 Total 2,237,720 795,396(–64.5%) 780,865(–65.1%) 1,093,961 851,693(-22.1%) 908,593(-16.9%)
E-factor 271.9 55.0 51.6 42.3 31.6 34.3
SR50 Total 2,750,926 816,915(–70.3%) 797,822(–71.0%) 1,164,458 885,881(-23.9%) 945,381(-18.8%)
E-factor 412.2 65.4 59.8 69.1 51.0 55.3

19
2012); the use of photoreactors for efficient artemisinin semi-synthesis has been explored by other groups also (Amara et al., 2015). This is a trend seen with a few other APIs also: while it will be some time before CPM becomes commonplace, there has been recent FDA approval for a new drug produced exclusively via continuous production, and there are other CPM plants being constructed or awaiting approval (Armental and Burton, 2015; Palmer, 2015).
6 CONCLUSIONS
With continuous processing offering various advantages over batch processing – the dominant method in pharmaceutical production – extensive evaluation of potential benefits for drug products is paramount. The potential cost savings from employing continuous product separation over batch were studied for two important Active Pharmaceutical Ingredients (APIs), ibuprofen and artemisinin. As drugs of critical importance (ibuprofen is listed as an essential drug by the World Health Organisation, as are many formulations of artemisinin derivatives), they are among those substances for which the use of CPM could add great societal as well as economic value (other examples include novel substances for which the chemistry can be developed from the start with continuous production in mind). Continuous Pharmaceutical Manufacturing (CPM) offers a novel path to securing competitiveness for pharmaceutical firms challenged by the current economic and market environment. Preliminary studies estimating process efficiencies and economics are valuable tools for identifying and evaluating promising candidate APIs and processes for CPM.
Four processes have been evaluated for each API (eight total) with continuous upstream production: the full batch product recovery reference case, lean reference batch case, and two continuous separation cases which employ similar processes but different solvents, anti-solvents or operating conditions. Two production scales were studied: one to produce 100 kg per year after product recovery, and the other to produce 1,000 kg per year, with requisite material balances and reactor dimensions calculated for all. A combination of vendor quotes, market data and cost estimation methods have been employed to calculate Capital Expenditure (CapEx), Operating Expenditure (OpEx), and total costs, along with the percent cost savings the continuous schemes offer over the given reference batch case. Material efficiencies in the form of E-factors (mass of waste per
Table 11. Total costs (£) and savings (percent difference) for batch (lean) and continuous API separation and recovery, for both 102 and 103 kg/yr API production scales.
API Ibuprofen Artemisinin
(kg/yr) BX,L CPM 1 (savings) CPM 2(savings) BX,L CPM 1(savings) CPM 2 (savings)
Base case 102 1,061,979 773,877 (-27.1%) 769,511(-27.5%) 776,460 817,5055.3% 871,805 12.3%
103 9,510,245 6,933,768 (-27.1%) 6,890,184(-27.5%) 5,319,345 6,122,51615.1% 6,667,449 25.3%
E-factor 98.5 44.7 43.4 15.4 12.2 13.4
KI5 102 1,066,719 777,869 (-27.1%) 773,489(-27.5%) 788,493 830,4555.3% 886,192 12.4%
103 9,557,643 6,973,688 (-27.0%) 6,929,970(-27.5%) 5,439,079 6,252,01414.9% 6,811,316 25.2%
E-factor 98.5 44.7 43.4 15.4 12.2 13.4
KI10 102 1,072,848 783,032 (-27.0%) 778,634(-27.4%) 800,527 843,4055.4% 900,579 12.5%
103 9,618,938 7,025,313 (-27.0%) 6,981,422(-27.4%) 5,558,812 6,381,51214.8% 6,955,184 25.1%
E-factor 98.5 44.7 43.4 15.4 12.2 13.4
SR70 102 1,378,970 795,396 (-42.3%) 786,468(-43.0%) 855,995 862,7070.8% 920,829 7.6%
103 12,680,155 7,147,544 (-43.6%) 7,058,509(-44.3%) 5,855,382 6,563,35012.1% 7,149,955 22.1%
E-factor 203.7 55.0 51.6 41.9 31.6 34.3
SR50 102 1,695,961 816,915 (-51.8%) 803,425(-52.6%) 935,530 907,910(-3.0%) 969,854 3.7%
103 15,850,064 7,361,320 (-53.6%) 7,226,834(-54.4%) 6,391,419 7,004,1859.6% 7,632,462 19.4%
E-factor 308.9 65.4 59.8 68.3 51.0 55.3

20
unit mass of product) were also calculated. CapEx savings were greater for ibuprofen, with savings attainable in all cases studied, while for artemisinin, CapEx savings were lessened at higher production scales. In contrast, OpEx savings were broadly similar for the two APIs except at the higher process scale, where artemisinin OpEx savings were diminished. Finally, over a 20-year plant lifetime CPM use for ibuprofen attains total cost savings in all cases studied, but artemisinin shows varied savings, with lower process scales performing better. The CPM processes are also more materially efficient with improved E-factor values compared to the batch cases.

Figure 7. recovery fBattery-limwaste man
CapEx
Capital expendfor ibuprofen anmits installed cnagement (U/W
x
diture (CapEx)nd artemisinin, ost (BLIC), wo
W); production i
, operating expewith respect to
orking capital ans 100 kg/yr of A
21
OpEx Base case
KI5
KI10
SR70
SR50
enditure (OpExo the full referennd contingencyAPI.
x) and total costnce batch separa (WCC), raw m
T
t differences foration in each ca
material requirem
Total cost
r continuous prase. Data showments, and utili
oduct wn include ities and

Figure 8. recovery fBattery-limwaste man
CapEx
Capital expendfor ibuprofen anmits installed cnagement (U/W
x
diture (CapEx)nd artemisinin, ost (BLIC), wo
W); production i
, operating expewith respect to
orking capital ans 100 kg/yr of A
22
OpEx Base case
KI5
KI10
SR70
SR50
enditure (OpExo the lean referend contingencyAPI.
x) and total costnce batch separ (WCC), raw m
T
t differences forration in each c
material requirem
Total cost
r continuous prcase. Data showments, and utili
oduct wn include ities and

Figure 9. recovery fBattery-limwaste man
CapEx
Capital expendfor ibuprofen anmits installed cnagement (U/W
x
diture (CapEx)nd artemisinin, ost (BLIC), wo
W); production i
, operating expewith respect to
orking capital ans 1,000 kg/yr o
23
OpEx Base case
KI5
KI10
SR70
SR50
enditure (OpExo the lean referend contingency
of API.
x) and total costnce batch separ (WCC), raw m
T
t differences forration in each c
material requirem
Total cost
r continuous prcase. Data showments, and utili
oduct wn include ities and

24
ACKNOWLEDGEMENT
The authors gratefully acknowledge the financial support of the Engineering and Physical Sciences Research Council (EPSRC) via a Doctoral Training Partnership (DTP) studentship to Mr H.G. Joliffe.
NOMENCLATURE AND ABBREVIATIONS
API Active Pharmaceutical Ingredient BLIC Battery-Limits-Installed-Cost of all equipment in a process, part of CapEx, £ BX Batch CA Cost of reference item A, £ CapEx Capital expenditure, £ CB,1C Calculated cost of design item B at 100 kg/yr API production scale, £ CB,1K Calculated cost of design item B at 1,000 kg/yr API production scale, £ CPM Continuous pharmaceutical manufacturing E-factor Environmental factor, a measure of material efficiency, kg (waste)/kg (product API) f Product of adjustment factors, used in cost-capacity power equation (1) KI Key ingredient KI5 Sensitivity case with KI at £5/kg KI10 Sensitivity case with KI at £10/kg mAPI Mass of API produced after separation, kg/yr mbpd Mass of by-product waste, kg/yr muAPI Mass of unrecovered API, kg/yr mur Mass of unreacted reagent waste, kg/yr mwaste Total mass of waste, kg/yr mws Mass of solvent waste, kg/yr n Dimensionless exponent used in cost-capacity equation (1) NPV Net Present Value, the total costs over a certain plant lifetime, adjusted to the present OpEx Operating expenditure, £ r Discount rate, the correction factor for adjusting costs to the present SA Capacity of reference item A, units vary with item type SB,1C Required capacity of design item B at 100 kg/yr API production scale, units vary with
item type SB,1K Required capacity of design item B at 1,000 kg/yr API production scale, units vary
with item type SR Solvent recovery SR50 Sensitivity case with SR at 50% SR70 Sensitivity case with SR at 70% τ Plant lifetime, years U/W Utilities and waste handling costs, part of OpEx, £ WCC Sum of Working Capital and Contingency, part of CapEx, £
LITERATURE REFERENCES
1. Abdin, M.Z., Alam, P., 2015. Genetic engineering of artemisinin biosynthesis: prospects to improve its production. Acta Physiol. Plant. 37(2): 1–12.
2. Adams, S.S., 1992. The propionic acids: a personal perspective. J. Clin. Pharmacol. 32(4): 317–323. 3. Amara, Z., Bellamy, J.F.B., Horvath, R. et al., 2015. Applying green chemistry to the photochemical route to
artemisinin. Nat. Chem. 7(6): 489–495. 4. Anderson, N.G., 2012. Using continuous processes to increase production. Org. Process Res. Dev. 16(5):
852–869. 5. Andraos, J., 2011. The Algebra of Organic Synthesis: Green Metrics, Design Strategy, Route Selection, and
Optimization. CRC Press. 6. Armental, M., Burton, T., 2015. Vertex’s $259,000 cystic fibrosis drug gets FDA approval. Wall Str. J.
URL: http://www.wsj.com/articles/vertex-gets-fda-ok-for-cystic-fibrosis-drug-1435861189. [28/09/2015].
25
7. Ashe, R., 2012. From batch to continuous processing. Chem. Eng.-New York 119(10): 34–40. 8. Behr, A., Brehme, V. A., Ewers, C.L.J., Grön, H., Kimmel, T. et al., 2004. New developments in chemical
engineering for the production of drug substances. Eng. Life Sci. 4(1): 15–24. 9. Besenhard, M.O., Neugebauer, P., Ho, C.-D., Khinast, J.G., 2015. Crystal size control in a continuous
tubular crystallizer. Cryst. Growth Des. 15(4): 1683–1691. 10. Bogdan, A.R., Poe, S.L., Kubis, D.C. et al., 2009. The continuous-flow synthesis of ibuprofen. Angew.
Chem. Int. Ed. 48(45): 8547–8550. 11. Boodhoo, K., Harvey, A., 2013. Process Intensification Technologies for Green Chemistry: Engineering
Solutions for Sustainable Chemical Processing. John Wiley & Sons. 12. Cole-Palmer, 2015. Cole-Parmer Polystat Advanced 15L Heat/Cool. URL:
http://www.coleparmer.co.uk/Product/Cole_Parmer_Polystat_Advanced_15L_Heat_Cool_Bath_35_to_200C_230VAC/WZ-12122-58. [28/09/2015].
13. Corning, 2015. Advanced-FlowTM Reactors. URL: https://www.corning.com/in/en/innovation/corning-emerging-innovations/advanced-flow-reactors.html. [28/09/2015].
14. Corsello, M.A., Garg, N.K., 2015. Synthetic chemistry fuels interdisciplinary approaches to the production of artemisinin. Nat. Prod. Rep. 32(3): 359–366.
15. Couper, J.R., 2003. Process Engineering Economics. Marcel Dekker, Inc. 16. Cutler, M., 2013. Artemisinin Conference 2013, Nairobi, Kenya, 14–16th January 2013. 17. Denčić, I., Ott, D., Kralisch, D. et al., 2014. Eco-efficiency Analysis for intensified production of an Active
Pharmaceutical Ingredient: a case study. Org. Process Res. Dev. 18(11): 1326–1338. 18. Douglas, J.M., 1988. Conceptual Design of Chemical Processes. McGraw-Hill, New York. 19. Extance, A., 2012. Tube-wrapped lamp makes malaria drug. Royal Society of Chemistry: Chemistry World.
URL: http://www.rsc.org/chemistryworld/News/2012/January/malaria-flow-reactors-artemisinin-Seeberger.asp. [28/09/2015].
20. Ferguson, S., Ortner, F., Quon, J. et al., 2014. Use of continuous MSMPR crystallization with integrated nanofiltration membrane recycle for enhanced yield and purity in API crystallization. Cryst. Growth Des. 14(2): 617–627.
21. FischerSci, 2015. HeidolphTM Hei-VapTM Rotary Evaporators. URL: https://www.fishersci.com/shop/products/heidolph-hei-vap-rotary-evaporators-precision-61/13878482. [28/09/2015].
22. Fonteyne, M., Gildemyn, D., Peeters, E. et al., 2014. Moisture and drug solid-state monitoring during a continuous drying process using empirical and mass balance models. Eur. J. Pharm. Biopharm. 87(3), 616–628.
23. Gernaey, K.V., Cervera-Padrell, A.E., Woodley, J.M., 2012. Development of continuous pharmaceutical production processes supported by process systems engineering methods and tools. Future Med. Chem. 4(11): 1371–1374.
24. Gerogiorgis, D.I., Barton, P.I., 2009. Steady-state optimization of a continuous pharmaceutical process. Comp. Aid. Ch. 27(A): 927–932.
25. Gilmore, K., Kopetzki, D., Lee, J.W. et al., 2014. Continuous synthesis of artemisinin-derived medicines. Chem. Commun. 50(84): 12652–12655.
26. Harmsen, J., 2012. Rapid low cost innovation methods of industrial micro reactor applications. Presented at the PRES 2012: 15th Conference on Process Integration, Modelling and Optimisation for Energy Saving and Pollution Reduction, Elsevier, Prague, Czech Republic.
27. Hartman, R.L., 2012. Managing solids in microreactors for the upstream continuous processing of fine chemicals. Org. Process Res. Dev. 16(5): 870–887.
28. Hommel, M., 2008. The future of artemisinins: natural, synthetic or recombinant? J. Biol. 7(10): 38. 29. Horváth, Z., Horosanskaia, E., Lee, J.W. et al., 2015. Recovery of artemisinin from a complex reaction
mixture using continuous chromatography and crystallization. Org. Process Res. Dev. 19(6): 624–634. 30. Järvinen, M.A., Paavola, M., Poutiainen, S. et al., 2015. Comparison of a continuous ring layer wet
granulation process with batch high shear and fluidized bed granulation processes. Powder Technol. 275: 113–120.
31. Jolliffe, H.G., Gerogiorgis, D.I., 2015a. Process modelling and simulation for continuous pharmaceutical manufacturing of ibuprofen. Chem. Eng. Res. Des. 97: 175–191.
32. Jolliffe, H.G., Gerogiorgis, D.I., 2015b. Plantwide design and economic evaluation of two continuous pharmaceutical manufacturing (CPM) cases: ibuprofen and artemisinin. Presented at the PSE2015/ESCAPE25 Joint International Conference on Computer-Aided Process Engineering, Elsevier, Copenhagen, Denmark.
33. Jolliffe, H.G., Gerogiorgis, D.I., 2015c. Process modelling and simulation for continuous pharmaceutical manufacturing of artemisinin. Chem. Eng. Res. Des. Submitted.
26
34. Kockmann, N., Gottsponer, M., Zimmermann, B., Roberge, D.M., 2008. Enabling continuous-flow chemistry in microstructured devices for pharmaceutical and fine-chemical production. Chem.-Eur. J. 14(25): 7470–7477.
35. Kockmann, N., Roberge, D.M., 2009. Harsh reaction conditions in continuous-flow microreactors for pharmaceutical production. Chem. Eng. Technol. 32(11): 1682–1694.
36. Kopetzki, D., Lévesque, F., Seeberger, P.H., 2013. A continuous-flow process for the synthesis of artemisinin. Chem.-Eur. J. 19(17): 5450–5456.
37. Lawton, S., Steele, G., Shering, P. et al., 2009. Continuous crystallization of pharmaceuticals using a continuous oscillatory baffled crystallizer. Org. Process Res. Dev. 13(6): 1357–1363.
38. Lee, S.L., O’Connor, T.F., Yang, X. et al., 2015. Modernizing pharmaceutical manufacturing: from batch to continuous production. J. Pharm. Innov. 10(3): 191–199.
39. Lévesque, F., Seeberger, P.H., 2012. Continuous-flow synthesis of the anti-malaria drug artemisinin. Angew. Chem. Int. Ed. 51(7): 1706–1709.
40. Majumder, A., Nagy, Z.K., 2015. Dynamic modeling of encrust formation and mitigation strategy in a continuous plug flow crystallizer. Cryst. Growth Des. 15(3): 1129–1140.
41. Mascia, S., Heider, P.L., Zhang, H. et al., 2013. End-to-end continuous manufacturing of pharmaceuticals: integrated synthesis, purification, and final dosage formation. Angew. Chem. Int. Ed. 52(47):12359–12363.
42. Paddon, C.J., Keasling, J.D., 2014. Semi-synthetic artemisinin: a model for the use of synthetic biology in pharmaceutical development. Nat. Rev. Microbiol. 12(5): 355–367.
43. Palmer, E., 2015. Vertex, J&J, GSK, Novartis all working on continuous manufacturing. FiercePharmaManufacturing. URL: http://www.fiercepharmamanufacturing.com/story/vertex-jj-gsk-novartis-all-working-continuous-manufacturing-facilities/2015-02-09. [28/09/2015].
44. Peplow, M., 2013. Sanofi launches malaria drug production. Royal Society of Chemistry: Chemistry World. URL: http://www.rsc.org/chemistryworld/2013/04/sanofi-launches-malaria-drug-production. [27/7/2018].
45. Plumb, K., 2005. Continuous processing in the pharmaceutical industry – changing the mind set. Chem. Eng. Res. Des. 83(A6): 730–738.
46. ProMinent, 2015. Solenoid Driven Metering Pump gamma/ X. URL: http://www.prominent.co.uk/desktopdefault.aspx/tabid-9819/1029_read-69682/. [28/09/2015].
47. Ritter, S.K., 2013. Reducing environmental impact of organic synthesis. Chem. Eng. News. 91(15): 22-23. 48. Roberge, D.M., Zimmermann, B., Rainone, F. et al., 2008. Microreactor technology and continuous
processes in the fine chemical and pharmaceutical industry: is the revolution underway? Org. Process Res. Dev. 12(5): 905–910.
49. Rogers, A.J., Inamdar, C., Ierapetritou, M.G., 2014. An integrated approach to simulation of pharmaceutical processes for solid drug manufacture. Ind. Eng. Chem. Res. 53(13): 5128–5147.
50. Schaber, S.D., Gerogiorgis, D.I., Ramachandran, R. et al., 2011. Economic analysis of integrated continuous and batch pharmaceutical manufacturing: a case study. Ind. Eng. Chem. Res. 50(17): 10083–10092.
51. Seeberger, P.H., Kopetzki, D., Levesque, F., 2014. Method and device for the synthesis of artemisinin. US Patent Application US20140364630 A1.
52. Sheldon, R.A., 2012. Fundamentals of green chemistry: efficiency in reaction design. Chem. Soc. Rev. 41(4): 1437-1451.
53. Teoh, S.K., Rathi, C., Sharratt, P., 2015. Practical assessment methodology for converting fine chemicals processes from batch to continuous. Org. Process Res. Dev., Article ASAP.
54. Tu, Y., 2011. The discovery of artemisinin (qinghaosu) and gifts from Chinese medicine. Nat. Med. 17(10): 1217–1220.
55. Turconi, J., Griolet, F., Guevel, R. et al., 2014. Semisynthetic artemisinin, the chemical path to industrial production. Org. Process Res. Dev. 18(3): 417–422.
56. Wang, Z., Yang, L., Yang, X. et al., 2014. Advances in the chemical synthesis of artemisinin. Synth. Commun. 44(14): 1987–2003.
57. Wong, S.Y., Tatusko, A.P., Trout, B.L. et al., 2012. Development of continuous crystallization processes using a single-stage mixed-suspension, mixed-product removal crystallizer with recycle. Cryst. Growth Des. 12(11): 5701–5707.
58. Woods, D.R., 2007. Rules of Thumb in Engineering Practice. Wiley-VCH. 59. Zhu, C., Cook, S.P., 2012. A concise synthesis of (+)-artemisinin. J. Am. Chem. Soc. 134(33): 13577–13579.