edcm consultation demand workshop - ofgem · edcm consultation demand workshop 6 june 2011. 2 the...
TRANSCRIPT
EDCM Consultation Demand Workshop
6 June 2011
2
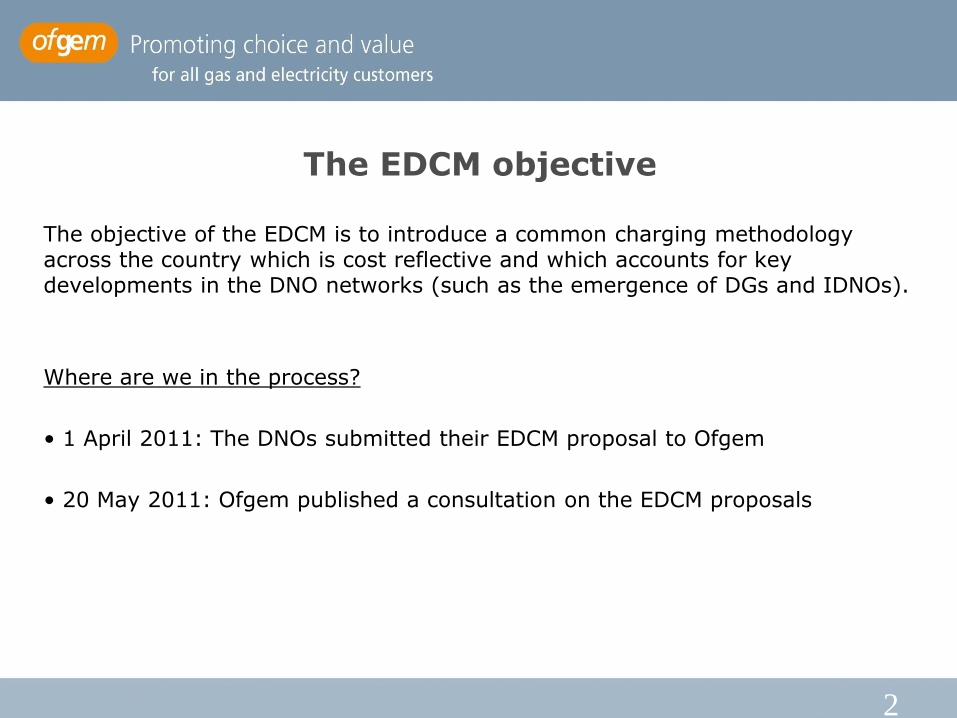
The EDCM objective
The objective of the EDCM is to introduce a common charging methodology across the country which is cost reflective and which accounts for key developments in the DNO networks (such as the emergence of DGs and IDNOs).
Where are we in the process?
• 1 April 2011: The DNOs submitted their EDCM proposal to Ofgem
• 20 May 2011: Ofgem published a consultation on the EDCM proposals
3
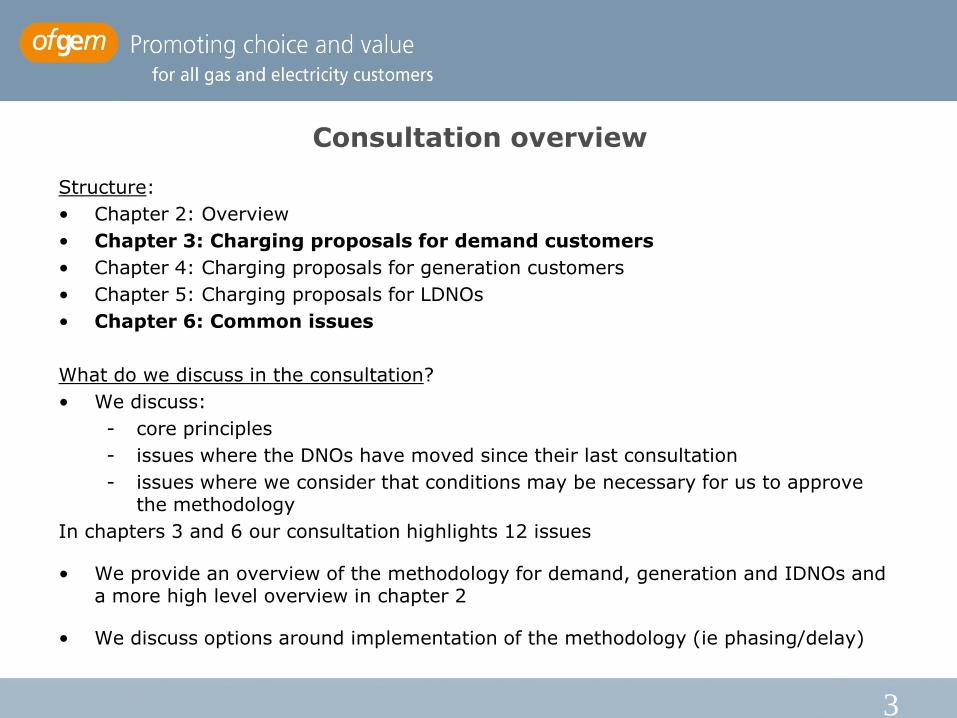
Consultation overview
Structure:
• Chapter 2: Overview
• Chapter 3: Charging proposals for demand customers
• Chapter 4: Charging proposals for generation customers
• Chapter 5: Charging proposals for LDNOs
• Chapter 6: Common issues
What do we discuss in the consultation?
• We discuss:
- core principles
- issues where the DNOs have moved since their last consultation
- issues where we consider that conditions may be necessary for us to approve the methodology
In chapters 3 and 6 our consultation highlights 12 issues
• We provide an overview of the methodology for demand, generation and IDNOs and a more high level overview in chapter 2
• We discuss options around implementation of the methodology (ie phasing/delay)
4
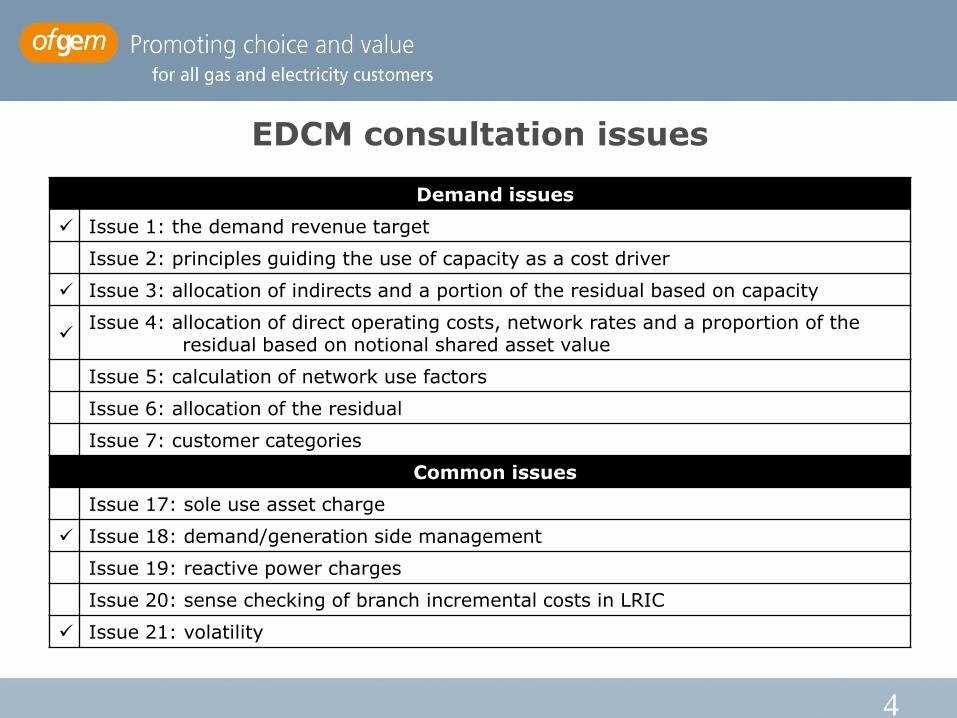
Demand issues
Issue 1: the demand revenue target
Issue 2: principles guiding the use of capacity as a cost driver
Issue 3: allocation of indirects and a portion of the residual based on capacity
Issue 4: allocation of direct operating costs, network rates and a proportion of the
residual based on notional shared asset value
Issue 5: calculation of network use factors
Issue 6: allocation of the residual
Issue 7: customer categories
Common issues
Issue 17: sole use asset charge
Issue 18: demand/generation side management
Issue 19: reactive power charges
Issue 20: sense checking of branch incremental costs in LRIC
Issue 21: volatility
EDCM consultation issues
5
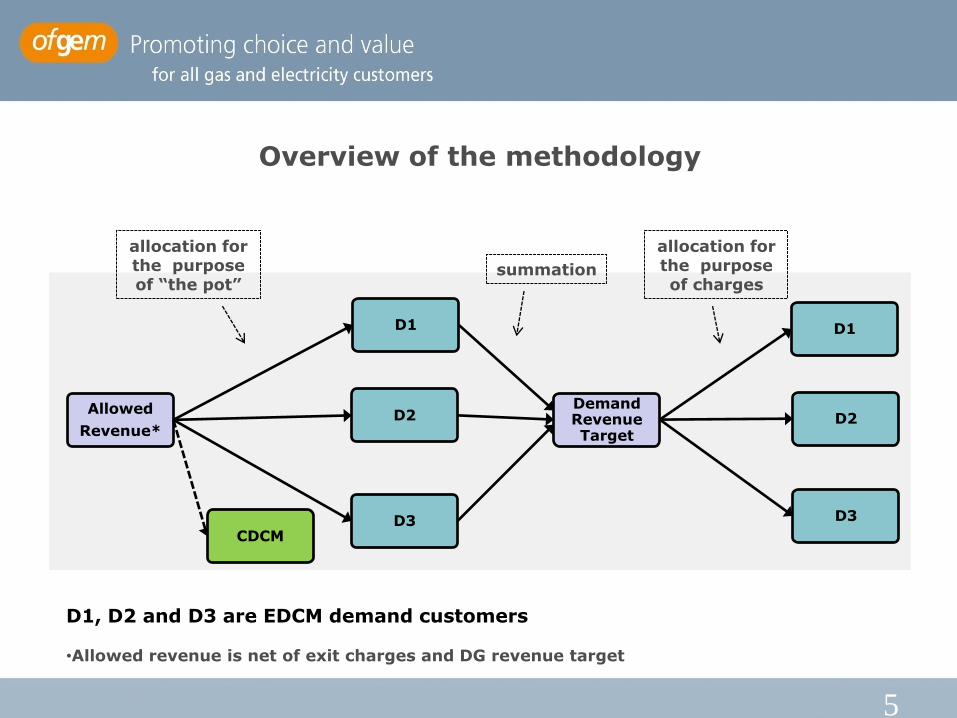
Overview of the methodology
Allowed
Revenue*
D1
D2Demand Revenue Target
D1
D2
D3D3CDCM
D1, D2 and D3 are EDCM demand customers
•Allowed revenue is net of exit charges and DG revenue target
allocation for the purpose of “the pot”
summation
allocation for the purpose of charges
6
Overview of the methodology
Allocation for the purpose of “the pot”
Each customer is notionally allocated a proportion equal to its proportion of asset value out of total asset value in the DNO area.
Allocation for the purpose of charges
Each customer is allocated its LRIC/FCP charge. The rest of the pot is allocated as a “fixed adder” or as above (ie based on the proportion of asset value), depending on the source.

7
The tariff structure
DUoS charge (£) = [Fixed charge (£)]
+ [Capacity charge rate (£/kVA)] * [kVA agreed capacity]
+ [Super-red unit rate (£/kWh)]*[kWh import at “super-red”]
For sole use assets
For agreed capacityFor units consumed at “super-red”
DUoS charge (£/year)
=Fixed charge (£/year)
+Capacity charge (£/year)
+Unit charge (£/year)
Average: 9%Std Dev: 14.5%
Average: 86.5%Std Dev: 15.3%
Average: 4.5%Std Dev: 8.4%Max: 57%

8
The tariff structure
Source: Figure 3.2 of Ofgem‟s consultation on EDCM proposals, 20 May 2011
Recovery from EDCM demand by tariff component (£m)

9
Issue 1: the demand revenue target
The demand revenue target is a sum of money that each DNO sets out to recover from its EDCM demand customers as a whole through use of system charges.
Total direct costs
Total indirectcosts
Total network rates
Allowed revenueresidual
CDCM D1 D2 D3
EDCM demand revenue target
CDCM D1 D2 D3 CDCM D1 D2 D3 CDCM D1 D2 D3

10
Issue 1: the demand revenue target
Allocation of costs and allowed revenue residual to individual EDCMdemand customers
Source: Table 3.4 of Ofgem‟s consultation on EDCM proposals, 20 May 2011
11
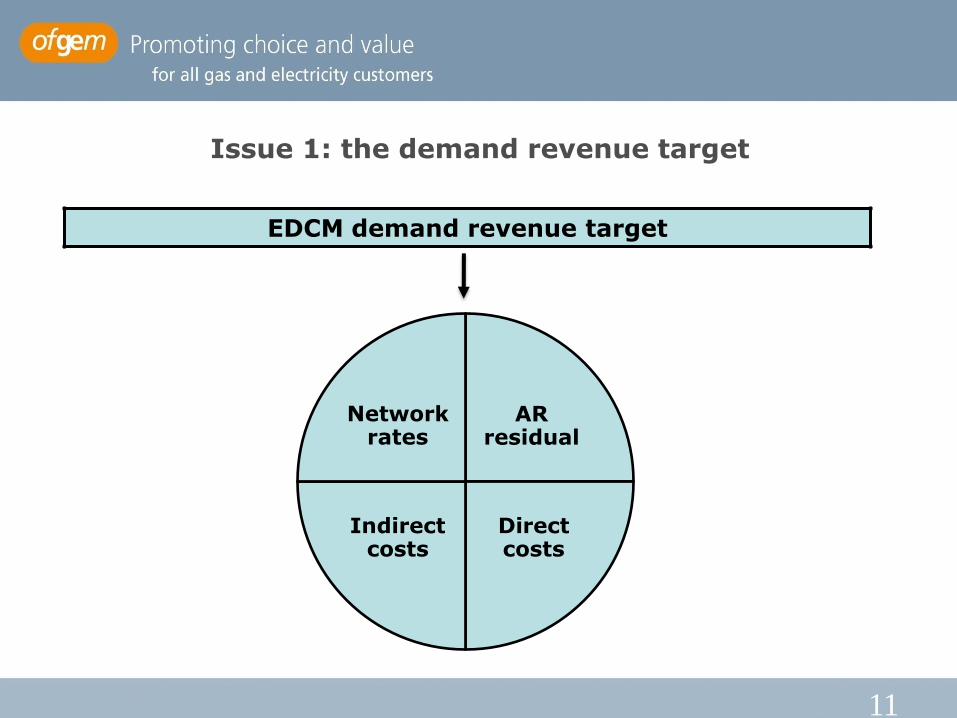
Issue 1: the demand revenue target
EDCM demand revenue target
AR residual
Direct costs
Indirect costs
Network rates

12
Issue 3: allocation of indirects and a portion of the residual based on capacity
EDCM demand revenue target by source
EDCM demand revenue target by recovery
Network
rates
Indirect costs
AR residual
Network
rates
Indirect costs
LRIC/FCP
20% of
residual
80% of
residual

13
Issue 3: allocation of indirects and a portion of the residual based on capacity
Customer = EDCM demand customers
Capacities = 50% * [Agreed capacity] + [Capacity at system peak]
Indirect costs within the revenue target (£)
+ 20% of the residual (£)
Sum of customer capacities (kVA)= £/kVA fixed adder

14
Issue 4: allocation of direct operating costs, network rates and a proportion of the residual based on notional shared asset value
EDCM demand revenue target by source
EDCM demand revenue target by recovery
Network
rates
Indirect costs
AR residual
Network
rates
Indirect costs
LRIC/FCP
Residual
(20%)
Residual
(80%)
15
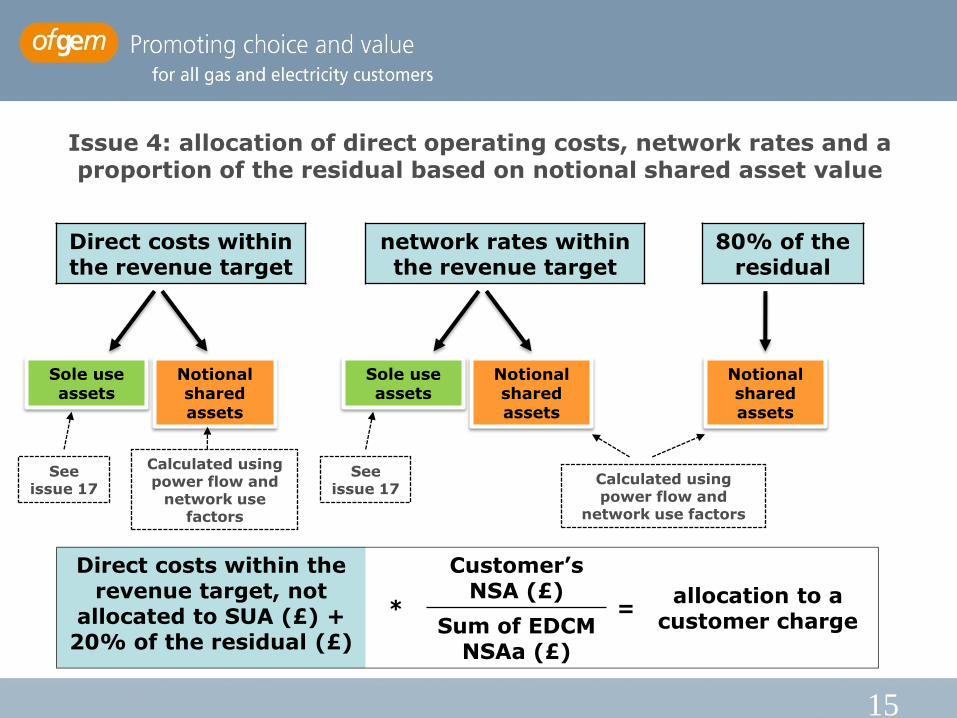
Issue 4: allocation of direct operating costs, network rates and a proportion of the residual based on notional shared asset value
Direct costs within the revenue target
network rates within the revenue target
80% of the residual
Notional shared assets
Notional shared assets
Notional shared assets
Sole use assets
Sole use assets
See issue 17
See issue 17
Direct costs within the revenue target, not
allocated to SUA (£) +20% of the residual (£)
*
Customer‟s NSA (£)
=allocation to a
customer chargeSum of EDCM NSAa (£)
Calculated using power flow and
network use factors
Calculated using power flow and
network use factors

16
Issue 18: demand side management
Firm capacity: not constrained by the agreement
Interruptible capacity: constrained by the agreement
Proposals: for the application of LRIC/FCP components,
only the firm capacity will be taken into consideration
Example: “Fixed time-band agreement” of 10 MW firm capacity and 5 MW interruptible capacity
DUoS Charge = Fixed charge + 10MW*LRIC/FCP „local‟ +15MW*[capacity charge rate – „local‟] + (10MW/15MW)*[kWh in super red] * [unit rate]
Agreed import capacity =10 MW at peak
15 MW at off-peak

17
Issue 18: demand side management
„Local‟ LRIC/FCP(p/kW/day)
Annual per 1 MW
Annual per 5 mW
1p £3,650 £18,250
2p £7,300 £36,500
4p £14,600 £73,000
„Remote‟ LRIC/FCP(p/kW/day)
Annual saving per example (CF=.25)
1p £3,750
2p £7,500
4p £15,000
Savings per interruptible
MW

18
Q&A on demand issues

19
Coffee Break

20
Implementation
Source: Figure 3.1 of Ofgem‟s consultation on EDCM proposals, 20 May 2011
Total revenue (£m) from EDCM demand customers under current charging arrangements and under the EDCM
3.2
9.4 10.2
5.2
7.7
11.1
3.6
6.0
5.6
11.0
2.8
23.5
1.7
12.7
4.0
9.4
14.0
4.7
14.0
14.2
3.8
8.2
11.3 1
3.5
10.6
28.4
5.3
13.6
Under EDCM
Under current methodologies
21
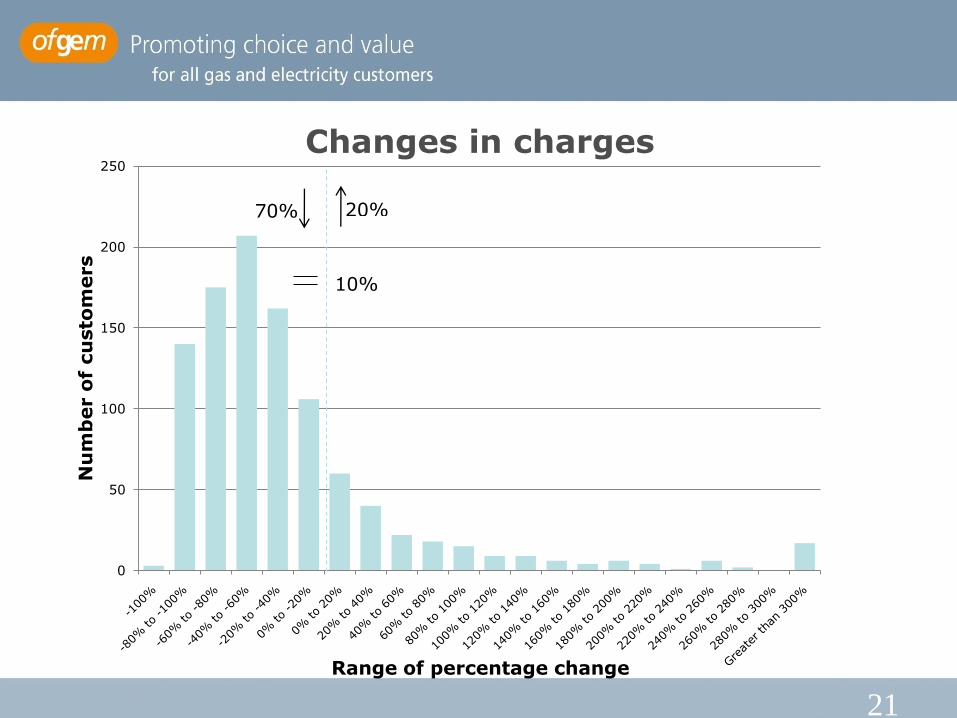
Changes in charges
0
50
100
150
200
250
Nu
mb
er o
f cu
sto
mers
Range of percentage change
20%70%
10%

22
Management of charge changes
• Previous chart is based on current behaviour
• EDCM offers opportunities to manage charge
– demand side management agreement
– reduce consumption during super-red hours
– reduce agreed import capacity
– employ on-site generation (may be partially offset by GDUos)
• We expect some customers will adjust their behaviour in response
• We are considering placing requirement on DNOs to provide specific assistance to most affected customers

23
Managing charges over time (Issue 21)
• Beyond one-off change, there may be ongoing volatility in charges
– internal volatility, eg super red consumption
– external volatility, eg allowed revenue, NUFs
• Measures to manage volatility
– five year projections of potential variances
– long term products
– modification to model inputs, eg NUFs
• Role of Workstream C
What measures would be most useful in helping you manage your charge over time?
24
Implementation of new charges – as planned
Default option – new charges start 1 April 2012 as planned
Pros
• benefits of methodology realised asap
• significant notice charges will change
Cons
• significant impact on some customers, could affect viability
• may not give sufficient time to adjust behaviour where possible

25
Implementation of new charges
Delay – new charges start 2013, 2014 or at RIIO-ED1 (2015)
Pros
• „cleaner‟ method than phasing
• time to mitigate/adjust to increase where possible
Cons
• EDCM benefits deferred, especially more cost reflective charges
• customers with charges reducing are disadvantaged
26
Implementation of new charges - PhasingPros
• time to mitigate/adjust to increase where possible
Cons
• benefits of methodology deferred, including cost-reflectivity
• makes mods difficult
• difficulty adjusting tariffs and licence
Phasing for some or all?
For all customers:
• delays benefits to those with reductions
For those with significant increases:
• targets those most affected, minimising impact on others
• but, arbitrary decision on who to phase

27
Questions on implementation
Question 2.2
• Should we approve the methodology, do you agree with our proposal to implement it in full from 1 April 2012?
• If not, why is phasing-in charges or delaying implementation appropriate?
Appreciate responses to this question by 24 June 2011
- although we will still consider responses submitted after
Are there any other implementation issues we should consider?

28
Q&A session and feedback

29
Next steps
Consultation responses………………………………………………………… 4 July 2011
Responses on phasing……………………………………………… 24 June 2011
Ofgem‟s decision…………………………………………………………………… Aug/Sep 2011
Indicative charges for 2012/13 …………………………………………… December 2011
Final charges for 2012/13 …………………………………………………… February 2012
EDCM implementation (if approved) …………………………………… 1 April 2012

30
Contact
Geoffrey Randall 020 7901 7106
Ynon Gablinger 020 7901 7051
Guy Donald 020 7901 7430

31