edc performance versus tx specifications and its ... 1 edc performance versus tx specifications and...
TRANSCRIPT

Page 1
EDC Performance versus EDC Performance versus TxTxSpecifications Specifications
andandIts implications for TP2 testingIts implications for TP2 testing
Jesper HanbergJesper Hanberg
Martin LobelMartin LobelDivisional Technology OfficeDivisional Technology Office
Optical Networking Components Division (OND)Optical Networking Components Division (OND)Intel Communications Infrastructure GroupIntel Communications Infrastructure Group
Intel CorporationIntel Corporation
Sep. 2004Sep. 2004IEEE 802.3aq meeting IEEE 802.3aq meeting –– OttawaOttawa
[email protected]@intel.com

Page 2
Objective of presentationObjective of presentation
Establish an understanding of how the Establish an understanding of how the characteristics of a transmitter influence the link characteristics of a transmitter influence the link penalty and the performance of EDC penalty and the performance of EDC
How do we evaluate the characteristics of the How do we evaluate the characteristics of the transmitter in a EDC link? transmitter in a EDC link?
–– TP2 testing: How can EDC performances be predicted?TP2 testing: How can EDC performances be predicted?

Page 3
EDC simulation pathEDC simulation path
Random data Laser Rate equations
Convolute on random data
sequence
Calculate optimal tap coefficients
using mmse
Apply EDC filter to data sequence Do BER estimate save
BER vs. SNR
add noise
fiber impulse response
laser diode parameters
Package/driverLow Pass filter
Receiver 7.5 GHzLow Pass filter
4, 8 and 20 GHzbandwidth considered
4 different lasersconsidered
CamMMF1p0f42o20iCamMMF1p0f42o20iCamMMF1p0f48o17iCamMMF1p0f48o17iCamMMF1p0f18o17iCamMMF1p0f18o17i
Version 1Version 1
* For plot of impulse response see:http://www.ieee802.org/3/aq/public/upload/channel_tp3.040914.pdf
*

Page 4
Laser Rate equationsLaser Rate equations
Solve rateSolve rate--equations using equations using matlabmatlabInitial input data from Initial input data from CartledgeCartledge, , J. Lightwave tech. vol 15, no. 5 J. Lightwave tech. vol 15, no. 5 1997 p 8521997 p 852laser with threshold current of laser with threshold current of 16.6 mA 16.6 mA Parameters modified to give 4 Parameters modified to give 4 other lasers with approx. same Iother lasers with approx. same Iththand and 8, 13, 17 and 32 GHz 8, 13, 17 and 32 GHz Relax. Relax. freq. freq. IIbiasbias= 70 = 70 mAmA; ; IImodmod = 100 = 100 mAppmApp
[ ]
−−=
−−=
⋅−−=
−+⋅=
pNc
NLN
c
p
NNGdtd
NNGG
PGNqI
dtdN
PRspPGdtdP
τβφ
ετ
τ
)(21
)1)((
0
0
Laser Rate equations
laser diode parameters

Page 5
EyediagramsEyediagrams –– 20 GHz package 20 GHz package -- BtBBtB
8 GHz8 GHz
17 GHz17 GHz
13 GHz13 GHz
32 GHz32 GHz
laseroutput
filteredoutput
laseroutput
filteredoutput
IbiasIbias= 70 = 70 mAmA; ; ImodImod = 100 = 100 mAppmApp

Page 6
Relative PenaltyRelative PenaltyBack to Back Back to Back –– no EDCno EDC
2.42.43.13.15.85.8GoodGood(BW 13 GHz)(BW 13 GHz)
0 0 (reference)(reference)0.50.52.22.2PerfectPerfect(BW 32 GHz)(BW 32 GHz)
0.90.91.21.23.13.1BetterBetter(BW 17 GHz)(BW 17 GHz)
3.03.03.63.67.17.1BadBad(BW 8 GHz)(BW 8 GHz)
PerfectPerfect(20 GHz BW)(20 GHz BW)
GoodGood(8 GHz BW)(8 GHz BW)
BadBad(4 GHz BW)(4 GHz BW)
PackagePackageLaserLaser
Penalty at BER=10^Penalty at BER=10^--99
all numbers in all numbers in dBodBo
IbiasIbias= 70 = 70 mAmA; ; ImodImod = 100 = 100 mAppmApp
Table 1

Page 7
0.60.60.80.81.71.7GoodGood(BW 13 GHz)(BW 13 GHz)
< < 00~0~00.50.5PerfectPerfect(BW 32 GHz)(BW 32 GHz)
~0~00.30.30.90.9BetterBetter(BW 17 GHz)(BW 17 GHz)
0.80.81.01.01.91.9BadBad(BW 8 GHz)(BW 8 GHz)
PerfectPerfect(20 GHz BW)(20 GHz BW)
GoodGood(8 GHz BW)(8 GHz BW)
BadBad(4 GHz BW)(4 GHz BW)
PackagePackageLaserLaser
Penalty at BER=10^Penalty at BER=10^--99
Relative PenaltyRelative PenaltyBack to Back Back to Back –– with EDCwith EDCDFE: 5DFE: 5-- taps FFE + 2taps FFE + 2--taps FBtaps FB
all numbers in all numbers in dBodBo
IbiasIbias= 70 = 70 mAmA; ; ImodImod = 100 = 100 mAppmApp
Table 2

Page 8
3.43.43.63.64.54.5GoodGood(BW 13 GHz)(BW 13 GHz)
2.52.58.2 8.2 (no EDC)(no EDC)
2.62.69.7 9.7 (no EDC)(no EDC)
3.23.2PerfectPerfect(BW 32 GHz)(BW 32 GHz)
2.92.93.03.03.73.7BetterBetter(BW 17 GHz)(BW 17 GHz)
3.63.63.83.84.74.7BadBad(BW 8 GHz)(BW 8 GHz)
PerfectPerfect(20 GHz BW)(20 GHz BW)
GoodGood(8 GHz BW)(8 GHz BW)
BadBad(4 GHz BW)(4 GHz BW)
PackagePackageLaserLaser
Penalty at BER=10^Penalty at BER=10^--99 CamMMF1p0f42020iCamMMF1p0f42020i
Relative PenaltyRelative Penaltyafter 300m fiber after 300m fiber –– with EDCwith EDCDFE: 5DFE: 5--taps FFE + 2taps FFE + 2--taps FB taps FB
all numbers in all numbers in dBodBoIbiasIbias= 70 = 70 mAmA; ; ImodImod = 100 = 100 mAppmApp
Table 3

Page 9
Conclusions from Conclusions from ‘‘EDC performance EDC performance vsvs relaxed transmitter specsrelaxed transmitter specs’’****
A DecisionA Decision--Feedback Equalizer seems to be able to Feedback Equalizer seems to be able to compensate for both bandwidth limiting effects and noncompensate for both bandwidth limiting effects and non--linearitieslinearities originating from the laser source and packageoriginating from the laser source and packageA FeedA Feed--Forward Equalizer seems to be able to Forward Equalizer seems to be able to compensate for bandwidth limiting effects (in package)compensate for bandwidth limiting effects (in package)
The penalty of the fiber and of the laser seems to add up: The penalty of the fiber and of the laser seems to add up: –– With a DFE the penalty difference between BTB (w/EDC) and With a DFE the penalty difference between BTB (w/EDC) and
fiber (w/EDC) is approx. 2.8 dB (fiber penalty) for all fiber (w/EDC) is approx. 2.8 dB (fiber penalty) for all package+laserpackage+laser combinations combinations
–– This is not the case for a FeedThis is not the case for a Feed--Forward EqualizerForward Equalizer
**http://www.ieee802.org/3/aq/public/upload/lobel_1_0804.pdf
This is not correct in
thegeneral
case

Page 10
In In thethe searchsearch ofof TheThe General CaseGeneral Case

Page 11
Reference Reference TxTx –– BackBack--toto--backback
1,6
-0,5
-0,3
0,4
0,8
5+2 taps DFE
-0,5-0,6-0,60Bessel Thomson 20 GHz filter
1,62,72,84,7Low-speed laser w/ 4GHz filter
Na-0,4-0,40,4Bessel Thomson 8 GHz filter
Na0,60,92,2Bessel Thomson 4 GHz filter
0,71,31,83,3Bessel Thomson 3.4 GHz filter
9+2 taps DFE
9-taps FFE
5-taps FFEno EDC
Filter complexityFilter complexityTxTx
pattern BT filterTx RxBT filter7.5 GHz EDC
Rx bandwidth of 7.5GHz remains fixed for all cases
pattern BT filterTx Laserall numbers in all numbers in dBodBo
Table A

Page 12
44--order order BesselBessel ThomsonThomson TxTx
0 20 40 60 80 100 120 140 160 180 2000
0.2
0.4
0.6
0.8
1
Time [pS]
Sym
bol S
treng
th []
Txcutoff 20 GHz - Bessel-Thomson filter
0 20 40 60 80 100 120 140 160 180 2000
0.2
0.4
0.6
0.8
1
Time [pS]
Sym
bol S
treng
th []
0 20 40 60 80 100 120 140 160 180 2000
0.2
0.4
0.6
0.8
1
Time [pS]
Sym
bol S
treng
th []
Txcutoff 3.4 GHz - Bessel-Thomson filter
0 20 40 60 80 100 120 140 160 180 2000
0.2
0.4
0.6
0.8
1
Time [pS]
Sym
bol S
treng
th []
Reference: 20GHz 3.4 GHz

Page 13
LowLow speed laser speed laser –– TxTx charateristicscharateristics -- BtBBtB
0 20 40 60 80 100 120 140 160 180 2000
0.5
1
1.5
2
Time [pS]
Sym
bol S
treng
th []
Txcutoff 4 GHz - Ib=20mA Im=60mA Low speed: Ith= 16.8 mA; Relax osc freq= 6.35 GHz
0 20 40 60 80 100 120 140 160 180 2000
0.2
0.4
0.6
0.8
1
Time [pS]
Sym
bol S
treng
th []
Low-speed laser = ’good’ 8 GHz fres (see table in back-up)
The penalty is less than 3 dB (Eye mask spec) if EDC is applied
IbiasIbias= 50 = 50 mAmA; ; ImodImod = 60 = 60 mAppmApp (4(4--order 4GHz BT applied before laser)order 4GHz BT applied before laser)

Page 14
Full link Full link –– fiber penalty estimationfiber penalty estimation
4,7
2,6
2,7
3,4
3,7
5+2-taps DFE9+2-taps
DFE9-taps FFE5-taps FFENo EDC
4,29,8--low speed 4 GHz BW
limitation
2,24,77,98,2Bessel Thomson 20 GHz
filter
tcb5,38,58,7Bessel Thomson 8 GHz
filter
tbc7,211,0-Bessel Thomson 4 GHz
filter
3,27,711,9-Bessel Thomson 3.4 GHz
filter
Tx: 20 GHz BT - Estimation of penalty of fiber alone
(reference is still ’no EDC’ Back-to-back)
all numbers in all numbers in dBodBo
pattern BT filterTx RxBT filter7.5 GHz EDCfiber
Table B CamMMF1p0f42o20i.txt
Page 15
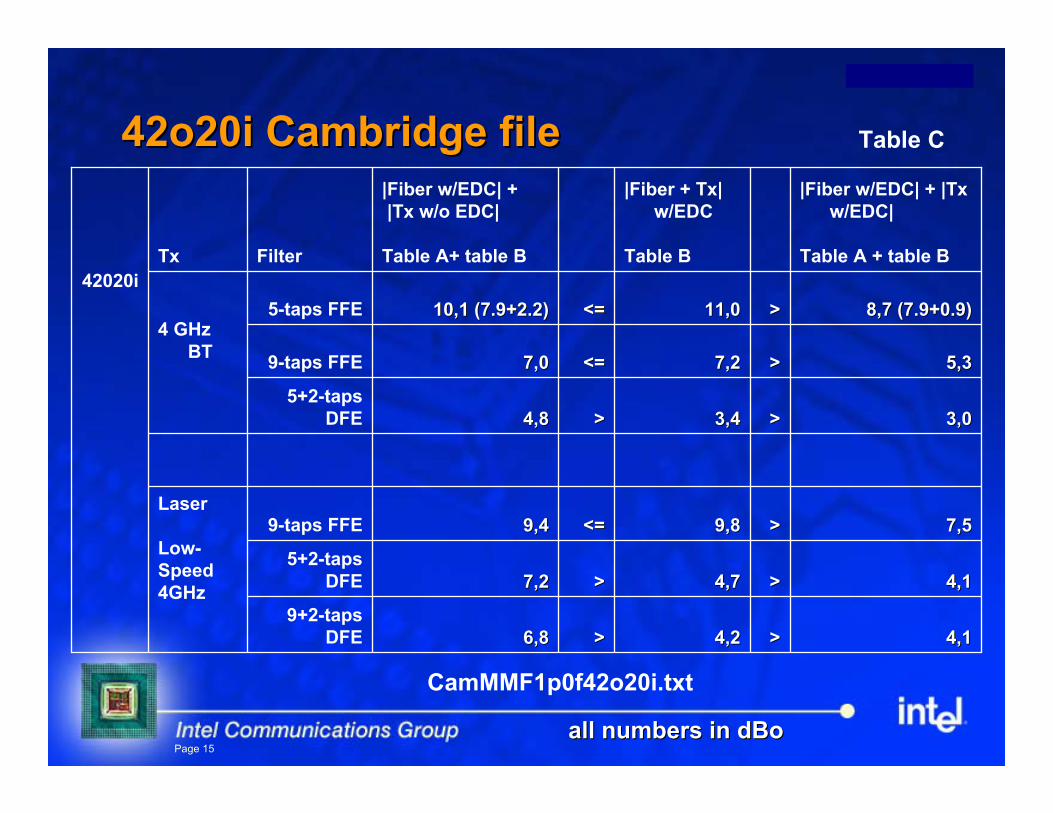
42o20i Cambridge file42o20i Cambridge file
4,14,1>>4,24,2>>6,86,89+2-taps
DFE
4,14,1>>4,74,7>>7,27,25+2-taps
DFE
7,57,5>>9,89,8<=<=9,49,49-taps FFELaser
Low-Speed4GHz
3,03,0>>3,43,4>>4,84,85+2-taps
DFE
5,35,3>>7,27,2<=<=7,07,09-taps FFE
8,7 (7.9+0.9)8,7 (7.9+0.9)>>11,011,0<=<=10,1 (7.9+2.2)10,1 (7.9+2.2)5-taps FFE4 GHz
BT
|Fiber w/EDC| + |Txw/EDC|
Table A + table B
|Fiber + Tx| w/EDC
Table B
|Fiber w/EDC| +|Tx w/o EDC|
Table A+ table BFilterTx42020i
CamMMF1p0f42o20i.txt
all numbers in all numbers in dBodBo
Table C

Page 16
18o17i Cambridge file18o17i Cambridge file
4,84,8>>5,35,3>>7,57,59+2-taps
DFE
4,84,8>>6,96,9>>7,97,95+2-taps
DFE
5,65,6>>6,96,9>>7,67,69-taps FFELaser Low-speed4 GHzBT
3,73,7>>5,15,1>>5,75,75+2-taps
DFE
3,53,5>>4,54,5>>5,15,19-taps FFE
4,34,3>>5,25,2>>5,75,75-taps FFE4 GHz
BT
|Fiber w/EDC| + |Tx w/EDC|
|Fiber + Tx| w/EDC
|Fiber w/EDC| +|Tx w/o EDC|FilterTx
18017i
CamMMF1p0f18o17i.txt
all numbers in all numbers in dBodBo
Table D

Page 17
48o17i Cambridge file48o17i Cambridge file
5.45.4>>5.55.5>>8.28.29+29+2--taps taps
DFEDFE
5.35.3>>5.95.9>>8.38.35+25+2--taps taps
DFEDFE
6.56.5>>7.77.7>>8.48.499--taps FFEtaps FFELaser Laser LowLow--speedspeed4 4 GHzGHzBTBT
4.14.1>>5.45.4>>5.95.95+25+2--taps taps
DFEDFE
4.34.3>>5.45.4>>5.95.999--taps FFEtaps FFE
5.65.6>>6.06.0>>7.07.055--taps FFEtaps FFE4 GHz 4 GHz
BTBT
|Fiber w/EDC| + |Fiber w/EDC| + ||TxTx w/EDC|w/EDC|
|Fiber + |Fiber + TxTx| | w/EDCw/EDC
|Fiber w/EDC| +|Fiber w/EDC| +||TxTx w/o EDC|w/o EDC|FilterFilterTxTx
48017i48017i
CamMMF1p0f48o17i.txt
all numbers in all numbers in dBodBo
Table E

Page 18
ObservationsObservations
The combined solution (fiber +The combined solution (fiber +TxTx) has always ) has always higher penalty than the individual contributions.higher penalty than the individual contributions.
–– In some cases using a DFE they are close to equalIn some cases using a DFE they are close to equal
The addition of the fiber suppresses the ability The addition of the fiber suppresses the ability of the EDC to correct for of the EDC to correct for TxTx impairmentsimpairments
–– In some cases for a FFE the fiber enhances the penalty In some cases for a FFE the fiber enhances the penalty of the of the TxTx !!
-The above observations have been confirmed using the ’good’ laser with a 4GHz and 8GHz package.
- Preliminary simulations using a laser that is less damped (ringing) seems to confirm the observations also.

Page 19
SummarySummary
FFE can correct FFE can correct TxTx impairments in impairments in BtBBtBconfigurationconfiguration
–– The observed/measured FFE correction in The observed/measured FFE correction in BtBBtB will be will be reduced significantly when fiber is added (amount is reduced significantly when fiber is added (amount is fiber and EDC filter dependent and may be negative) fiber and EDC filter dependent and may be negative)
DFE corrects laser impairments even after fiberDFE corrects laser impairments even after fiber–– The observed/measured DFE correction in The observed/measured DFE correction in BtBBtB will will
only be slightly reduced when fiber is added (amount only be slightly reduced when fiber is added (amount is fiber dependent)is fiber dependent)
–– The correction can be significantly reduced if FFE The correction can be significantly reduced if FFE section in DFE is too small to handle the impulse section in DFE is too small to handle the impulse responseresponse

Page 20
Conclusions of relevance for TP2 testingConclusions of relevance for TP2 testing
The The ’’trace approachtrace approach’’ can establish a clear link can establish a clear link between the between the TxTx impairment and its penalty. impairment and its penalty.
–– the burden falls directly on the source of the impairment the burden falls directly on the source of the impairment
A clear link can only be established if a A clear link can only be established if a ’’fiber modelfiber model’’is included in the math of the is included in the math of the ’’trace approachtrace approach’’
–– May complicate math significantlyMay complicate math significantlyA clear link is highly dependent on complexity of A clear link is highly dependent on complexity of EDC filterEDC filter
–– It seems that math must use finite EDC filter complexity It seems that math must use finite EDC filter complexity –– Requirement of minimum filter complexity (# taps) will need Requirement of minimum filter complexity (# taps) will need
to be specifiedto be specified

Page 21
Closing remarksClosing remarksRelaxation of Relaxation of TxTx specs worse than LR eye mask specs worse than LR eye mask requires a DFE solutionrequires a DFE solution
–– DFE can effectively correct DFE can effectively correct TxTx impairment impairment
In the case of a DFE, the In the case of a DFE, the ’’Trace approachTrace approach’’ allows allows a closer specification of the a closer specification of the TxTx characteristicscharacteristicsIn the case of a FFE, the In the case of a FFE, the ‘‘Trace approachTrace approach’’ offers offers limited advantages over limited advantages over ‘‘eye maskeye mask’’

Page 22
Backup Backup

Page 23
Laser parametersLaser parameters
Mirror loss [cm-1]
internal loss [cm-1]
Auger recombination coefficient [cm^6/s]
Radiative recombination rate [cm^3/s]
Nonradiative recombination rate [1/s]
Carrier density of transparancy [1/cm^3]
Gain compression coefficient []
gain compression factor [cm^3]
Diffential gain coeffienct [cm^2]
Group Velocity [cm/s]
group refractive index []
effective refractive index []
gain slope constant [cm^3/s)
Confinement factor []
active layer thickness [cm]
active layer width [cm]
cavity length [cm]
Spontanous emission factor []
3e+93e+9
1.33e1.33e--1515
1e1e--55
32 GHz32 GHz17 GHz17 GHz13 GHz13 GHz8 GHz8 GHzparameterparameter
1551552020
3e3e--29291e1e--10101e+81e+8
1.07e+181.07e+187.4e7.4e--77
1.48e1.48e--17172.13e2.13e--1616
7.5e+97.5e+944
3.43.41.6e1.6e--66
0.240.248e8e--66
0.00010.00010.0250.025
1.71.7
1.27e+91.27e+9
4e4e--1616
3e3e--66
48482525
4e+84e+8
2.96e2.96e--77
1e1e--550.00020.0002
a_mira_mira_inta_intC_AugerC_AugerBrrBrrAnrAnrNTNTeps_nleps_nlepsilonepsilonsig_gsig_gvgvgnnneffneffg0g0GammaGammaddwwLLnspnsp
Cartledge laser
values not shown are common for all lasers

Page 24
EyediagramsEyediagrams –– 4 GHz package 4 GHz package -- BtBBtB
8 GHz8 GHz
17 GHz17 GHz
13 GHz13 GHz
1t GHz1t GHz
laseroutput
filteredoutput
laseroutput
filteredoutput

Page 25
EyediagramsEyediagrams –– 8 GHz package 8 GHz package -- BtBBtB
8 GHz8 GHz
17 GHz17 GHz
13 GHz13 GHz
32 GHz32 GHz
laseroutput
filteredoutput
laseroutput
filteredoutput

Page 26
EyediagramsEyediagrams –– 20 GHz package20 GHz package
6 GHz6 GHz
14 GHz14 GHz
11 GHz11 GHz
18 GHz18 GHz
laseroutput
filteredoutput
laseroutput
filteredoutput