ed 329 589 author byrne, barbara m. title … · document resume ed 329 589 tm 016 245 author...
TRANSCRIPT

DOCUMENT RESUME
ED 329 589 TM 016 245
AUTHOR Byrne, Barbara M.TITLE Reexamining the Factorial Structure of the Maslach
Burnout Inventory for Elementary, Intermediate, andSecondary Teachers: A Cross-Validated ConfirmatoryFactor Analytic Study.
SPONS AGENCY Social Sciences and Humanities Research Council ofCanada, Ottawa (Ontario).
PUB DATE Apr 91NOTE 47p.; Paper presented at the Annual Meeting of the
American Educational Research Association (Chicago,IL, April 3-6, 1991).
PUB TYPE Reports - Research/Technica_ (143)Speeches/Conference Papers (150)
EDRS PRICE MF01/PCO2 Plus Postage.DESCRIPTORS *Elementary School Teachers; Elementary Secondary
Education; *Factor Structure; Fo7eign Countries;Goodness of Fit; Interm-liate Grades; JobSatisfaction; Mail Surveys; Models; PsychologicalTesting; Questionnaires; *Secondary School Teachers;*Teacher Burnout; *Test Validity
IDENTIFIERS Canada; *Confirmatory Factor Analysis; CrossValidation; Exploratory Factor Analysis; *MaslachEttrnout Inventory; Teacher Surveys
ABSTRACT
The factorial validity of the Maslach BurnoutInventory (MBI) was studied for 2,931 Canadian teachers (48.2% malesand 51.8% females) as a single professional group and for subsamplesof this group (1,159 elementary school teachers, 388 intermediateschool teachers, and 1,384 secondary school teachers). Studyparticipants were full-time teachers from two large metropolitanareas in central Canada. Tho Lubjects represented about 42% of asample originally sent the study questionnaire. The best-fittingfactorial model was cross-validated for samples made by splitting theoriginal group. Exploratory factor analysis and confirmatory factoranalysis (CFA) were used to validate the hypothesized three-factorstructure. CFA was subsequently used to: (1) identify aberrant scaleitems; (2) determine, via double cross-validation procedures, themodel having the greatest predictive validity; and (3) test for theinvariance of measurement and structural relations across calibrationand validation samples. Although findings strongly support athree-factor structure, the deletion of four ittms (numbers 2, 11,12, and 16) yielded a remarkably improved and psychologically soundinstrument. Compared with data for the elementary school andsecondary school teachers, model fit for intermediate school teacherswas more problematic, although consistent with past research. A57-item list of references is included, and an appendix gives abreakdown of MBI items on factors of burnout (emotional exhatLition,depersonalization, and personal accomplishment). Four tables presentstudy data. (SLD)
U. oamirrasorr Of EDUCATIONDace tO Eduestsondol Re Perth enO Improvement
EDUCATIONAL RESOURCES INFORMATIONCENTER (ERIC/
Ceche document hp PP rePrOducco asrectmed from the prson Cif orgenashononemetinci ft
LI Aloof chentaes Pee been made to tmogovereproducloon tioafft/
MBI Cross-validation
"PERMISSION TO REPRODUCE THISMATERAL HAS SEEN GRANTED BY
iguotheht /14)///06-
ConRana Jheteti oprovons 141004m ttios4oct&- TO THE EDUCATIONAL RESOURCESnfr4 00 rfØ necinaar4V f:rewow' oettc.i
AIINFORMATION CENTER (ERIC) "
t coeftpon poitcy
c-T4
1
Reexamining the Factorial Structure of the Maslach Burnout
Inventory for FlementEry, Intermediate, and Secondary Teachers:
A Cross-validated Confirmatory Factor Analytic Study
Barbara M. Byrne
University of Ottawa
Paper presented at the American Educational Research
Association Annual Meeting, Chicago, 1991
The author gratefully acknowledges funding support from the
Social Science and Humanities Research Council of Canada.
Sincere appreciation is also extended to those Metropolitan
Toronto and Ottawa teachers who gave so freely of their time in
order to participate in this study.
"c) BEST COPY AVAILABLE9A./

MB1 Cross-validation
Abstract
2
Purposes of the study were: (a) to test for the factorial
validity of the Maslach Burnout Inventory (MBI), for teachers as
a single professional group (n=2,931), and for subsamples of
elementary (n=1,159), intermediate (n=388), and secondary
(n=1,384) teachers, and (b) to cross-validate the best-fitting
factorial model for a second independent sample. Exploratory, as
well as confirmatory factor analyses (CFAs) were used to validate
the hypothesized 3-factor structure; CFA was subsequently used to
(a) identify aberrant scale items, (b) determine, via double
cross-validation procedures the model having the greatest
predictive validity, and (c) test for the invariance of
measurement and structural relations across calibration and
validation samples. Although findings strongly supported a
3-factor structure, the deletion of four items (#2, #11, #12,
#16) yielded a remarkably improved and psychometrically sound
instrument. Compared with the elementary and secondary levels,
model fit for intermediate teachers was more problematic, albeit
consistent with past research. This study is the most rigorous to
date in testing the factorial validity of the Milt; findings are
expected to contribute importantly to futuire honing of the
instrument for use with educators.

MBI Cross-validation
3
The Maslach Burnout Inventory: A Cross-validated Reassessment
of Factorial Validity for Elementary, Intermediate, and
Secondary Teachers
The Maslach Burnout Inventory (MBI; Maslach & Jackson,
1981a, 1986) is undoubtedly the most widely used measure of
occupational burnout, the inability to function effectively in
. one's job as a consequence of prolonged and extensive
job-related stress. To date, however, assessment of the MBI's
factorial validity has been limited to exploratory techniques
that have included both factor and principal components
analyses; these procedures, however, lack the statistical rigor
to directly te, hypotheses related to factorial structure.
Moreover, validity studies of the MBI, as it bears on the
teaching profession, have most often been conducted on samples
that combined teachers representing different levels of the
educational system (e.g., Gold, 1984; Iwanicki & Schwab, 1981).
Finally, cross-validation of the MBI has not been tested
statistically in a rigorous simultaneous analysis of data. The
primary purposes of the present study, then, were twofold: (a)
to test the factorial validity of the MBI both for teachers as
a single professional group, and for elementary, intermediate,
and secondary teachers as separate professional groups, and (b)
to cross-validate the factorial structure of the MBI across a
I

MBI Cross-validation
4
second independent sample for each of these groups; both sets
of analyses used a confirmatory factor analytic approach to the
data based on the analysis of covariance steuctures.
The seminal research of Maslach and colleagues was the
first of an empirical nature to investigate the phenomenon of
burnout (for an historical summary, see Maslach, 1981a; Maslach
& Jackson, 1984). Their findings were consistent in supporting
a multidimensional construct comprising three related, yet
independent components: (a) emotional exhaustion -- feelings of
fatigue that develop as one's emotional energies become
drained, (b) depersonalization -- the development of negative
and uncaring attitudes toward others, and (c) reduced personal
accomplishment -- a deterioration of self-competence, and
dissatisfaction with one's achievements.
These three elements of burnout have been empirically
validated for elementary, intermediate, and secondary school
teachers (Beck & Gargiulo, 1983; Belcastro, Gold, & Hays, 1983;
Byrne, 1990a; Fimian & Blanton, 1987; Friesen & Sarros, 1989;
Gold, 1984; Green & Walkey, 1988; Iwanicki & Schwab, 1981;
Jackson, Schwab, & Schuler, 1986; Schwab & Iwanicki, 1982a,
1982b), as well as for administrative educators (Friesen &
Sarros, 1989) and teacher trainees (Fimian & Blanton, 1987).
Teachers exhibit signs of emotir ial exhaustion when they
perceive themselves as unable to give of themselves to
students, as they did earlier in their careers.

MBI Cross-validation
5
Depersonalization is evidenced when teachers develop negative,
cynical and sometimes callous attitudes towards students,
parents and colleagues. Finally, teachers reflect feelings of
reduced personal accomplishment when they perceive themselves
as ineffective in helping students to learn, and in fulfilling
other school responsibilities. Overall, teachers who fall
victim to burnout are likely to be less sympathetic toward
students, have a lower tolerance for classroom disruption, be
less apt to prepare adequately for class, and feel less
committed and dedicated to their work (Farber & Miller, 1981).
The development of the
from a wide range
nurses, teachers,
of human
MBI was
service
police officers,
based on samples of workers
organizations, including
physicians, social workers,
psychologists, psychiatrists, and lawyers (Maslach & Jackson,
1981a, 1986). The instrument comprises 22 items designed to
measure both the frequency and intensity of burnout as
represented by three components -- emotional exhaustion (EE),
depersonalization (DP), and personal accomplishment (PA).
Findings of high correlations between the frequency and
intensity dimensions of burnout for teachers have led to
recommendations that only the former be used with this
professional group (Gold, 1984; Iwanicki &
suggestion, however, has been followed for
well; see e.g., Firth, McIntee, McKeown, &
Golembiewski, Munzenrider, & Carter, 1983;
Schwab, 1981). (The
other occupations as
Britton, 1985;
Green & Walkey,

MBI Cross-validation
6
1988.)
As a consequence, in large part, of Schwab and Iwanicki's
(1982a, 1982b; Iwanicki & Schwab, 1981) work related to burnout
among teachers, Maslach and Jackson (1986), in collaboration
with Schwab, developed the Educators' Survey (MBI Form Ed), a
version of the MBI specifically designed for use viLh teachers.
The MBI Form Ed measures the same three factors of burnout as
the original version of the MBI; the only difference between
the two versions lies in the modified wording of certain items
to make them more appropriate to a teacher's work environment.
Specifically, the generic term "recipient", used in the MBI to
refer to clients, has been replaced by the term "students".
Most EFAs of the MBI have yielded three moderately to
well-defined burnout factors representing EE, DP, and PA for
various human service professionals in general (see Green &
Walkey, 1988; Maslach & Jackson, 1981b), and for teachers in
particular (Beck & Gargiulo, 1983; Belcastro et al., 1983;
Byrne, 1990; Gold, 1984). Some researchers, however, have
concluded a 2-factor (Brookings, Bolton, Brown, & McEvoy,
1985), or a 4-factor (Firth et al., 1985; Powers & Gose, 1986)
structure for human service workers, and a 4-factor structure
for educators (Iwanicki & Schwab, 1981). In an EFA study of
intermediate, secondary, and postsecondary educators, Byrne
(1990a) critically examined data within the framework of 2-,
3-, and 4-factor solutions. Although results partially
7

MB1 Cross-validation
7
replicated those supporting alternate factorial structu:es,
they were inconsistent across the three groups, and yielded 2-
and 4-factor solutions that were exemplary of under- and
overfactoring, respectively (see Gorsuch, 1983; Walkey, 1983,
1985). Byrne therefore concluded a 3-factor solution to be
optimal both statistically and substantively.
Based on a substantial amount of evidence, it now seems
abundantly clear that the MBI is most adequately defined by a
3-factor solution. A review of construct validity research,
however, suggests the need for possible improvement to item
content, at least PS it relates to teachers. In this regard, a
number of researchers have noted problematic loading patterns
for five particular items (#6, #11, #12, #16, #20). Items 6,
16, and 20, designed to measure EE, have been found either to
load incorrectly or to cross-load onto the DP factor (Belcastro
et al., 1983; Byrne, 1990a; Fimian & Blanton, 1987;
Golembiewski et al., 1983; Green & Walkey, 1988), and Items 11
and 12, measuring DP and PA, respectively, to cross-load onto
the EE factor (Byrne, 1990a; Golembiewski et al., 1983; Green &
Walkey, 1988; Powers & Gose, 1986). Interestingly, these same
factor loading patterns are consistent with those tabled by
Maslach and Jackson (1986) and Gold (1984), albeit the issue of
cross-loadings was not addressed. In a further confirmatory
factor analytic (CFA) study of her data, Byrne (1990a)
substantiated the problematic fit of these five items for

MBI Cross-validation
8
intermediate, secondary, and university educators; a more
adequate 3-factor solution was attained by deleting Items 12,
16 and 20, and by permitting Items 6 and 11 to cross-load for
the intermediate and university groups, respectively.
Additional psychometric analyses, have shown the EE, DP,
and PA subscales of the MBI to demonstrate strong evidence of
(a) internal consistency reliability, with alpha coefficients
ranging from .52 to .91 (mean a . .77) (Beck & 1.;argiulo, 1981;
Belcastro et al., 1983; Fimian & Blanton, 1987; Golembiewski et
al., 1983; Iwanicki & Schwab, 1981; Leiter & Maslach, 1988;
Maslach & Jackson, 1981b), (b) test-retest reliability, with
coefficients based on a 2 to 4-week interval ranging from .60
to .82 (mean r . .74) (Maslach & Jackson, 1981b), (c)
convergent validity with external criteria including personal
experience (observations), dimensions of job experience, and
personal outcomes (Maslach & Jackson, 1981b, 1986), and (d)
discriminant validity as evidenced by low and nonsignificant
correlations between MBI scores, and job satisfaction and
social desirability (Jackson et al., 1986; Maslach & Jackson,
1981b, 1986).
Taken together, these findings provide good support for the
MBI as a potentially reliable and valid measure of teacher
burnout. However, given numerous replicated findings related to
five possibly aberrant items (#6, #11, #12, #16, #20), it seems
apparent that still further construct validity research is
r,J

MBI Cross-validation
9
needed in order to more fully establish the psychometric
soundness of the instrument. To this end, It is important to
note several limitations in previous validity work bearing on
the MBI. First, except for one study (Byrne, 1990a), the MBI
has not been validated separately for elementary, intermediate,
or secondary teachers; studies, to date, have sampled teachers
from different teaching levels and assumed representation from
a single population. However, given that the work environments
of elementary, middle (i.e., junior high), and secondary
schools can differ substantially in terms of both academic and
nonacademic responsibilities imposed, the possibility of
differential perceptions of item content and/or relations among
burnout facets seems worthy of investigation. Second, despite
known correlations among the three dimensions of burnout, all
but two factor analytic studies (Brookings et al., 1985; Byrne,
1990a) have used oblique rotational procedures in the search
for simple structure. Third, except for one study (Byrne,
1990a), factorial validity of the MBI has been examined using
only an exploratory approach, based for the most part, on
principle components analyses. Now well documented, however,
are several deficiencies associated with such exploratory
procedures in general (see e.g., Bollen, 1989; Fornell, 1983;
Long, 1983; Marsh & Hocevar, 1985), and components analysis in
particular (see e.g., Borgatta, Kercher, & Stull, 1986:
Gorsuch, 1990; Hubbard & Allen, 1987; Snook & Gorsuch, 1989);

MBI Cross-validation
10
the latter having been shown to yield highly inflated factor
loadings and, thus, misleadingly clear factor structures.
Indeed, CFA is now widely accepted as the more powerful test of
factorial validity. Finally, the factorial structure of the MBI
has not been cross-validated with an independent sample using
simultaneous data analyses.
The present study addressed these concerns by (a) testing
the factorial validity of the MBI for teachers, both as a
single professional group, and as separate elementary,
intermediate, and secondary teacher groups, (b) using a CFA
approach to the validation inquiry based on the analysis of
covariance structures, (c) conducting double cross-validation
procedures to determine the factorial model having the greatest
predictive power for both the single and separate groups of
teachers, and (d) based on findings determined in (c), testing
for the invariance of factorial measurement and structure
across validation samples in a simultaneous analysis of the
data.
Method
Sample and Procedure
Participants in the study were full-time elementary,
intermediate, and secondary school teachers from two large
metropolitan areas in Central Canada. Using stratified
proportional sampling procedures, a total of 7,000 elementary/
intermediate (n=3600) and cecondary (n.3400) teachers were

MBI Cross-validation
11
randomly selected from the membership roster of the Ontario
Teachers' Federation; this represented approximately 30% of the
teacher population across the two urban centers. A 467, response
rate resulted in quesionnaires being received from 3188
teachers. Listwise deletion of missing data ultimately yielded
a final sample of 2,931 teachers (elementary n=1159;
intermediate n=388; secondary n=1384).
The sample in its entirety comprised a total of 48.2% males
and 51.8% females, most of whom (50.9%) were 40-49 years of
age, married with children (59.3%), and had been teaching or
more than 13 years (77.8%); of the latter, 44.4% had over 21
years experience. The majority of respondents (70.0%) were
fulltime classroom teachers, 13.0% had combined classroom and
administrative duties, 8.5% were fulltime administrators
(principals, vice principals), the remainder were guidance
counselors. Finally, while most of these educators (70.1%)
taught students registered in the regular academic track, 17.2T
taught those in the low academic track; thc remainder taught
either special education (10.7%), or gifted (2.6%) students.
Sample composition by teaching level deviated only with
respect to gender, for the Intermediate level. Elementary
teachers were composed of 42% males and 58% females; most
(51.3%) were in the 40-49 age range, were married with childret,
(57.7%), had been teaching for more than 13 years (79.2%), were
fulltime classroom teachers (75.8%), and taught students in the

MBI Cross-validation
12
regular academic stream (77.3%). Intermediate teachers
comprised 67.6% males and 32.4% females. Again, most (55%) were
between the sges of 40 and 49, were married with children
(65.4%), had been teaching longer than 13 years (79.1%), were
fulltime classroom teachers (75.6%), and taught regular
academic students (74.2%). Finally, of the secondary school
teachers, 47.4% were male and 52.6% were female; 49.3% were
40-49 years of age, most were married with children (58.4%),
had been teaching more than 13 years (76.1%), were fulltime
classroom teachers (64.2%), and taught students in the regular
academic stream (63.7%). The high school sample differed
slightly from the number of teachers whose workload included
both classroom and administrative duties (17.6%), and who
taught low-track students (29.3%).
The present study was based on data drawn from a larger
study of teacher burnout (Byrne, 1990b) and, thus, the MBI was
only one of a battery of ten measuring instruments mailed to
randomly selected teachers; additional materials included a
demographic response sheet, and explanations regarding che
general purpose of the study, procedures for completing the
questionnaire, and guaranteed anonymity and confidentiality.
Fallowup reminder letters were sent to all teachers
approximately four weeks following the initial mailing.
Given mean univariate skewness and kurtosis values within
the approximate range from -1.0 to +1.0 (see Muth'en & Kaplan,
.3

MBI Cross-validatio
13
1985), the data were considered to approximate a normal
distribution. Skewness ranged from -2.015 to 2.036 (M=-.037)
for the total sample, from -2.228 to 2.722 (M=.075) for
elementary teachers, from -2.084 to 1.699 (M=-.123) for
intermediate teacher- and from -1.982 to 1.760 (M=.008) for
secondary teachers. Kurtosis ranged from -1.069 to 5.056
(M=.998) for the total sample, from -1.146 to 7.928 (M=1.560)
for elementary teachers, from -1.C68 to 5.119 (M=.809) for
intermediate teachers, and from -1.067 to 5.107 (M=.850) for
secondary teachers.
Instrumentation
The MBI (Form Ed; Maslach, Jackson, & Schwab, 1986) was
used to measure burnout for teachers at the elementary,
intermediate, and secondary levels. The 22-item instrument is
structured on a 7-point fully an.:hored scale ranging from 0
"feeling has never been experienced", to 6 "feeling is
experienced daily". The EE, DP, and PA subscales comprise nine,
five, and eight items, respectively; all items are listed in
the Appendix.
Analysis of the Data
For purposes of cross-validation, the total sample as well
as subsamples representing elementary, intermediate, and
secondary teachers were randomly split into two (see Bollen,
1989; Cudeck & Browne, 1983); for each of these four groups,
Sample A comdrised the calibration sample, and Sample B the

MBI Cross-validation
14
validat'on sample. Data were subsequently analyzed in five
stages. First, for each calibration sample, CFA procedures
using the LISREL VI computer program (Joreskog & Sorbom, 1985)
were conducted to test the hypoth 'ized 3-factor structure
underlying the MBI. Second, given findings of less than
adequate CFA model fit, analyses proceeded in an exploratory
mode using both EFA and post hoc CFA procedures in order to
identify parameters contributing to model misfit. Third,
alternative models were subsequently specified and tested for
their goodness-of-fit to a 3-factor structure. Fourth,
best-fitting models were tested across calibration and
validation samples using double cross-validation procedures to
determine the one yielding the highest degree of predictive
validity (see Cudeck & Browne, 1983; Bagozzi & Yi, 1988).
Finally, the MBI model yielding the highest predictive validity
was further cross-validated under a set of three increasingly
restrictive conditions; MBI equivalence across calibration and
validation samples was tested in a cumulative manner with
respect to (a) number of factors, (b) item measurements, and
(c) underlying theoretical structure.
Although, historically, the chi square ( X2
) likelihood
ratio has been used to judge the extent to which a proposed
covariance structure model fits the observed data, the
2,sensitivity of the A statistic to sample size is now well
known; several alternative nonstatistical (i.e., practical)

MBI Cross-validation
15
indices of fit have subsequently been proposed (for a recent
review, see Marsh, Balla, & McDonald, 1988). As recommended by
a number of researchers (e.g., Bagozzi & Xi, 1988; Fornell,
1983; Joreskog, 1982; Long, 1983; Marsh & Hocevar, 1985),
assessment of fit in the present study was based on multiple
criteria that reflected statistical, theoretical, and practical
considerations. Furthermore, parsimony, as well as degree of
fit were taken into account (see Bentler & Mooijaart, 1989;
Mulaik, James, Alstine, Benn tt, Lind, & Stilwell, 1989). As
such, evaluation of model fit was based on (a) the X2 likelihood
ratio, (b) the Bentler (1990) revised normed comparative fit
index (CFI), (c) the parsimonious normed comparative fit index
(PCFI; Mulaik et al., 1989), (d) the adjusted goodness-of-fit
index (AGFI), T-values (parameter estimates relative to their
standard errors), and modification indices (MIs), all provided
by the LISREL program, and (e) the substantive meaningfulness
of the model (see MacCallum, 1986; Suyapa, Silvia, & MacCallum,
1988; Walkey, 1983).
The CFI represents a modified version of the Bentler and
Bonett (1980) normed fit index that has been corrected for
sample size dependency (Bentler, 1990); it is included here
because of widespread use of the former index. Plausible models
yield CFI values >.90, indicating a reasonably adequate
approximation to the observed data. The PCFI is based on the
CFI; the originally proposed index (Mulaik et al., 1989) has
I f;

MBI Cross-validation
16
been adapted here for use with the CFI. Because this index
takes into account goodness-of-fit, as well as the parsimony of
the model, its value is often much lower than what is generally
perceived as "acceptable" on the basis of normed ind5ces of
fit. In fact, Mulaik and associates (1989) note that
goodness-of-fit indices in the .90's accompanied by
parsimonious fit indices in the .50's are not unexpected. For
purposes of the present study, however, PCFI values >.80 were
considered indicative of an adequately specified model (see
e.g., Mulaik et al., 1989).
Results and Discussion
Confirmatory Factor Analyses
The CFA model in the present study hypothesized a priori
that: (a) responses to the MBI could be explained by three
factors, (b) each item would have a non-zero loading on the
burnout factor it was designed to measure, and zero loadings on
all other factors, (c) the three factors would be correlated
and, (d) the uniqueness terms for the item variables would be
uncorrelated. (The term "uniqueness" is uscA here in the factor
analytic sense to mean a composite of specific and random
measurement error which, in cross-sectional studies, cannot be
separated; for an extended discussion, see Gerbing & Anderson,
1984). In testing for the factorial validity of the MBI, all
analyses were based on covariance matrices and conducted
separately for calibration and validation samples representing

MBI Cross-validation
1 7
teachers os a whole, and elementary, intermediate, and
secondary teachers as separate subsamples.
Somewhat surprisingly, given the present sample sizes, fit
of the hypothesized 3-factor model (Model 1) for both teachers
as a single group, and for elementary, intermediate, and
secondary teachers as separate groups, WaS poor from both a
statistical ( X2 values) and a practical (AGFI, CFI, PCFI
values) perspective; this model was therefore rejected. These
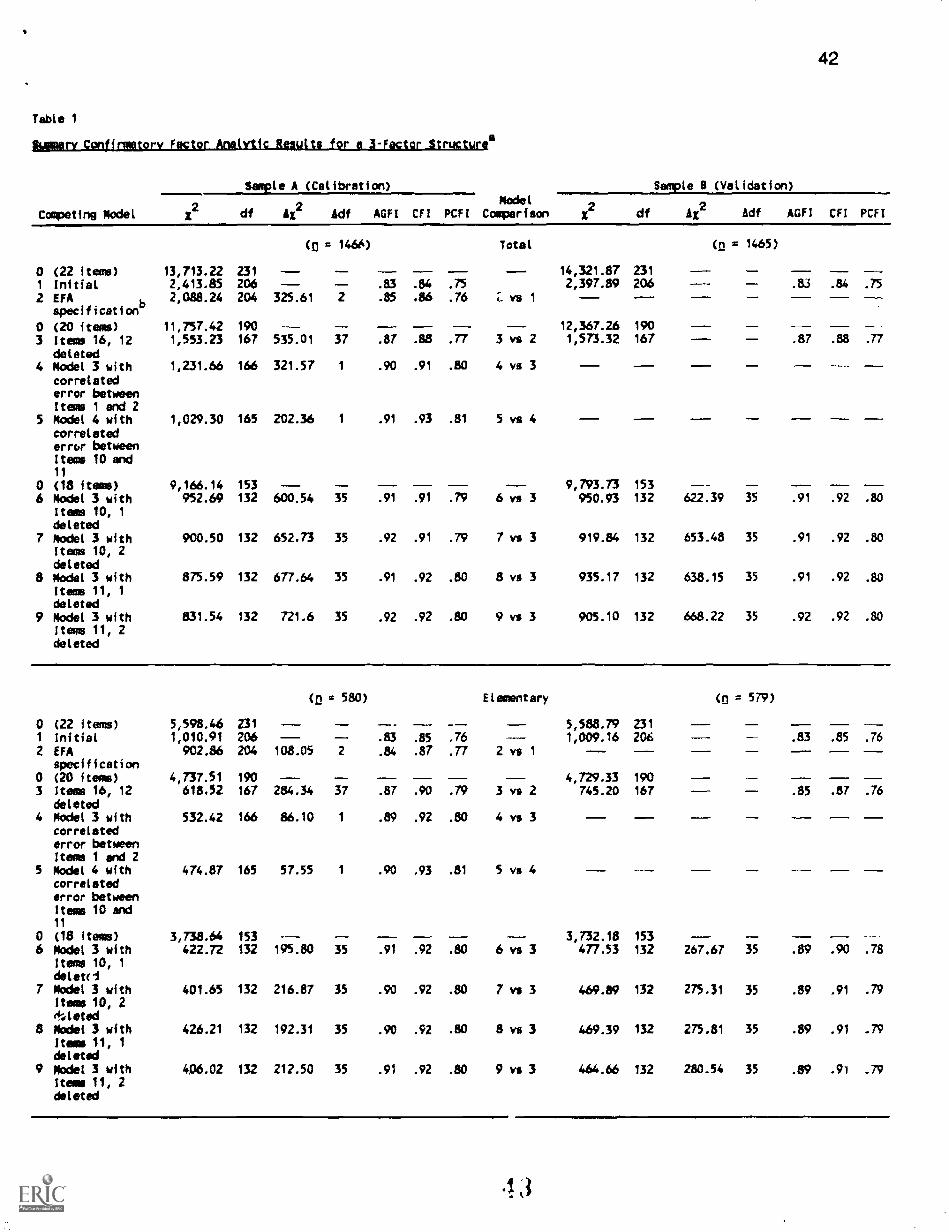
results are summarized in Table 1. (Model 0 argues that each
item represents a factor and therefore represents the 22-factor
null model that is needed to compute the CFI).
Insert Table 1 about here
Given rejection of the initially postulated model, the next
logical step was to take an exploratory approach to the
analyses in order to determine reasons for the ill-fitting
model. Of particular import was the question of (a) whether for
each teacher group, the data were best described by a 3-factor
structure, (b) whether across teacher groups, MBI items
exhibited the same pattern of loadings on all factors, and (c)
whether the deletion of aberrant items would lead to a more
adequately specified model. To answer these questions, the data
were reanalyzed using EFA and post hoc (i.e., respecified) CFA
procedures.

MBI Cross-validation
18
Exploratory Factor Analyses
EFAs using maximum likelihood estimation were conducted for
the entire sample of teachers, and for elementary,
intermediate, and secondary teachers separately. Based on
reported low to moderate correlations among the burnout
dimensions (see Maslach & Jackson 1986), and on preliminary
data analyses of the present data, direct oblimin oblique
rotation was used to achieve simple structure. Taking into
account sample size, and the case/variable ratio, 1 cutpoint of
.35 was used as the criterion for judging the saliency of
factor loadings (see Gorsuch, 1983).
As shown in Table 2, the data, for the most part, were well
described by a 3-factor solution both for teachers as a single
group, and for elementary and secondary teachers considered
separately; results for intermediate teachers were clearly less
than optimal and are discussed in more detail later. Adequacy
of model fit was based on statistical, as well as substantive
considerations. Statistically, several criteria supported
argument for a 3-factor solution. First, all but one target
factor loading was less than .35. Second, only two non-target
loadings were >.20, and most (total=75%; elementary=70%;
secondary=70%) were <.10. Third, the scree plot of eigenvalues
(Cattell, 1966) clearly delineated a 3-factor solution.
Finally, the three factors of :E, DP, and PA accounted for
44.5%, 44.6%, and 44.5% of the variance for teachers as a

MBI Cross-validation
whole, and for elementary, and secondary teachers,
respectively.
Insert Table 2 about here
19
EFA results for intermediate teachers leave this researcher
both frustrated and puzzled. Frustration derives from the fact
that followup factor analyses were clearly indicative of a
3-factor solution, although the pattern of salient loadings on
two of the three factors (EE, DP) did not represent good simple
structure; puzzlement arises from the similar pattern (albeit
much more pronounced) of incorrectly and cross-loaded items as
those reported by Byrne (1990a) for a smaller sample of the
same teacher population. Specifically, there appears to be less
differentiation between the EE and DP factors for intermediate
teachers; consistent across both studies were the incorrect
loading of Item 6, and the cross-loadings of Items 8, 13, 16,
and 20 on the DP factor. Psychometrically, it appears that
these items are more ambiguous for intermediate teachers and,
thus, are not tapping perceptions of emotional exhaustion and
depersonalization as they were intended to do. Nonetheless,
results for 2- and 4-factor solutions provided ample evidence
of under- and overfactoring, respectively (see Gorsuch, 1983;
Walkey, 1983).

MBI Cross-validation
20
An important finding reported in Table 2 was the consistent
problematic loading of Items 12 and 16 across the three groups
of teachers. In all cases, Item 12, designed to measure PA, and
Item 16, designed to measure EE, cross-loaded substantially
().20) on the EE and DP factors, respectively. These findings
were investigated further using the more stringent CFA
procedures. We turn now co the results of these analyses.
Post Hoc Confirmatory Factor Analyses
Although the EFA findings suggest that a 3-dimensional
burnout construct underlies the MBI, and as such, that two
items (#12, #16) are possibly problemati". when used with
elementary, intermediate, and secondary school teachers, the
true test must come from a CFA approach to the analyses.
Indeed, it is now widely accepted that EFA is limited in its
ability to: (a) yield unique factorial solutions, (b) define a
testable model, (c) assess the extent to which an hypothesized
model fits the data, and suggest alternative parameterization
for model improvement and, (d) adequately test factorial
invariance across groups (Bollen, 1989; Fornell, 1983; Long,
1983; Marsh & Hocevar, 1985). In contrast, CFA can yield this
information and is therefore a more powerful test of factorial
validity.
Maintaining an exploratory mode of inquiry (see Anderson &
Gerbing, 1988), a CFA model was specified for teachers as a
whole, and for elementary, intermediate, and secondary teachers
)1

M131 Cross-validation
21
separately, that reflected EFA results in common across these
groupings. As such, a 3-factor model was formulated that
allowed for the cross-loadings of Items 12 and 16 on the EE and
DP factors, respectively. For goodness-of-fit statistics
related to this model, we turn back to Table 1.
To compare the difference between the EFA-specified model
(Model 2) and the initially hypothesized model (Model 1), we
ANevaluate the difference in x2 (x2) between the two models.
Since this differential is itself x2-distributed, with degrees
of freedom equal to the difference in degrees of freedom (pdf),
it can be tested statistically, a significant Ax2 indicates a
substantial improvement in model fit. Reviewing the results in
Table 1, we see evidence of a highly significant improvement in
fit between Models 1 and 2 for the total sample, and for each
of the teacher subsamples. Although the fit of this model
remains somewhat less than adequate as indicated by the AGFI,
CFI, and PCFI, it nonetheless shows much improvement over the
initially hypothesized model. These findings fortify the
earlier EFA findings and suggest that Items 12 and 16 may be
inappropriate for use with educators. Having identified two
items that were consistently aberrant across teacher groups,
the task now was to work towards improving the MBI Educators
Survey by delineating a core set of items that could mcst
validly measure the three facets of burnout for teachers. Thus,
a third CFA model (Model 3) was specified in which Items 12 and
4) 9

MBI Cross-validation
22
16 were deleted (see Anderson & Gerbing). (The deletion of
items, of course, meant respecifying the correct null model for
calculation of the CFI and PCFI).
Although results reported in Table I demonstrated further
significant improvement in fit, AGFI and CFI values in the
.80's indicated that, for each teacher group, a certain degree
of model misfit still remained. Indeed, a review of the MIs
revealed two abnormally large values representing error
covariances between Items 1 and 2 (Total . 331.227; Elementary
. 89.55; Intermediate . 68.16; Secondary . 156. 38), and
between Items 10 and 11 (Total = 244.454; Elementary = 68.46;1
Intermediate m, 19.84; Secondary . 139.01). Such parameters most
often represent nonrandom measurement error due to method
effects associated with the response format of measuring
instruments and are therefore not unexpected in the CFA of a
single measuring instrument. Indeed, previous research with
psychological constructs in general (e.g., Byrne, Shavelson, &
Muthe.n, 1989; Joreskog, 1982; Newcomb & Bentler, 1986; Tanaka &
Huba, 1984), and with measuring instruments in particular
(Byrne, 1988a, 19881,; Byrne & Schneider, 1988) has demonstrated
the need to allow for correlated errors in order to attain a
well-fitting model. Thus, two additional models (Models 4, 5)
were specified in which these error terms were free to covary,
rather than contrained equal to zero. As shown in Table 1,
these estimated models resulted in a further substantial

MBI Cross-validation
23
improvement in fit for all groups.
Although Bentler and Chou (1987) have argued that the
specification of a model that forces such error terms to be
uncorrelated is rarely appropriate with real data, the
estimation of such parameters does nothing to improve the
validity of a measuring instrument. From a psychometric
perspective it would seem more appropriate to consider the
deletion of one item from each of the highly correlated pairs.
Thus, in an effort to improve the MBI for use with teachers,
four additional models were tested in which one item for each
highly correlated error pair was deleted. This decision was
guided by two important considerations. First, because the MIs
for these parameters were abnormally high compared with other
MIs in the same matrix, it seemed evident that responses to
these particular items were influenced by some overlap in item
content. Indeed, a review of the zero-oyder correlations
between these item-pairs revealed fairly strong evidence of
this for teachers in general (Items 1 & 2 r...75; Items 10 & 11
r..69), and for elementary (Items 1 & 2 r..74; Items 10 & 11
r..69), intermediate (Items 1 & 2 r=.79; Items 10 & 11 r..60),
and secondary (Items 1 & 2 r..75; Items 10 & 11 r..69) teachers
considered as separate groups. This information, coupled with
evidence of exceptionally similar item content (see Appendix),
seemed justification for the elimination of one item from each
pair. Second, the presence of extreme MIs associated with these

MBI Cross-validation
24
item pairs was not only consistent across groups in the present
study, but was also consistent with findings by Byrne (1990a)
with respect to the similar but smaller sample of teachers
noted earlier. Given this convergence of evidence, it seemed
apparent that the use of these items with teachers, elicited
responses that were masked by other irrelevant factors.
Thus, with a view to improving the psychometric soundness
of the Educators Survey, it now became important to determine
which items, when deletad, not only maximized model fit, but
also yielded the highest degree of predictive validity across
validation samples; to this end, Models 6 to 9 were specified
and tested. As indicated in Table 1, all four models led to a
highly significant improvement in fit over Model 3 for each of
the groups tested. It is important to note here that an
examination of MIs indicated that, for each group of teachers,
substantial improvement in model fit could be attained by
freeing up additional parameters. However, since these
parameters were group-specific, and since the intent of this
study was to work towards improving the MBI for use with
teachers as a professional group, there seemed little practical
rationale for pursuing this course; given fit statistics that
indicated a reasonable amount of the data was explained by
Models 6 through 9, no further deletions of items were made. On
the basis of these models, then, it appears that the deletion
of Items 11 and 2 leads to a better-fitting factorial model for

MB1 Cross-validotion
25
teachers. Important now, however, is to see if this observation
holds true when lodel 9 is cross-validated across the split
samples. We turn now to these cross-validation analyses.
Cross-validation Analyses
The proof of the pudding, so to speak, comes in the eating.
So too, the proof of a factorial model comes in its validation
across an independent sample. Having identified four sets of
items that have the potential to improve the MBI for use with
teachers, it was now appropriate to test the predictive
accuracy of their fitted models. As noted by Bagozzi and Yi
(1988), cross-validation is best regarded as a method for
comparing alternative models, with the selection of those that
most accurately approximate the underlying population
structure.
Of course, the most stringent assessment of competing
models is accomplished by means of double cross-validation
procedures (see Bagozzi & Yi, 1988; Cudeck & Browne, 1983);
this was the approach used in the present study. As such,
Models 3, 6, 7, 8, and 9 were estimated for the validation, as
well as for the calibration samples. Analyses then proceeded in
a 2-step manner. First, the parameters derived from the
calibration sample were used for prediction in the validation
sample, and the goodness-of-fit criteria derived. Second, these
analyses were repeated, but with the roles of the calibration
and validation samples reversed. For example, Model 3 was

MBI Cross-validation
26
estimated for the validation sample (Sample B) with the item
measurement and factor covariance parameter estimates from the
calibration sample (Sample A) fixed a priori; Model 3 was then
estimated f the calibration sample with these same parameters
fixed a priori to the values estimated for the validation
sample (Sample B).
With the introduction of their cross-validation index
(CVI), Cudeck and Browne (1983) provided a means to evaluating
cross-validation analyses within the framework of covariance
structure models with latent variables. The CVI represents the
discrepancy between the sample covariance matrix of one random
half of the sample (say the calibration sample), and the
restricted covariance matrix as imposed on the second random
half of the sample (the validation sample). The model that
exhibits the smallest CVI in each of the two sets of
cross-validation analyses, is considered the one(s) with the
highest degree of predi( ve validity for a given sample.
Results based on these procedures are presented in Table 3.
Insert Table 3 about here
These results indicated that Model 9, in general, had th.:±
greatest predictive validity across independent samples. As
such, they support earlier claims of best model fit, and argue
for the deletion of Items 2, 11, 12, and 16. Results for

MBT Cross-validation
27
intermediate teachers presented the only exception to these
findings; although results were consistent in showing the
deleterious effects of Item 11. the deletion of Item I appeared
to be more salient for intermediate teachers. Nonetheless,
given the somewhat large differences in CVI's for the
calibration and validation samples for intermediate teachers,
more validity work with teachers at this level of the
educational system is clearly warranted. The fact that, for
elementary teachers, the detrimental influence of Item 10
seemed equivalent to that of Item 11 again points to
group-specific differences that exist for educators at
different teaching levels. These cross-validation findings,
together with those related to model fit strongly support the
need for further investigation of MBI measurements and
structure across teaching levels.
Tests for Invariance Across Calibration and Validation Samples
In a final check of MBI factorial validity for teachers,
the items and underlying structure comprising Model 9 (i.e.,
the model exhibiting the greatest predictive validity) was
tested for their invariance across calibration and validation
samples. As such, three increasingly restrictive hypotheses
were tested; these bore on the equivalency of (a) number of
underlying factors, (b) item scaling units, and (c) latent
factor relations. Because each hypothesis was nested within the
preceding one, this cumulative testing procedure provided

MBI Cross-validation
28
another extremely powerful test of the MBT Educator's Survey.
Testing for invariance involved specifying a model in
which certain parameters were constrained equal across groups
and then comparing that model with a less restrictive model in
which these parameters were free to take on any value. As with
model-fitting, the AX2between competing models provided a basis
for determining the tenability i47f the hypothesized equality
constraints; a significant 6X2 indicating noninvariance. (For ,
more extensive discussion and application of this procedure,
see Byrne, 1989.) These results are reported in Table 4.
Insert Table 4 about here
Remarkably, these findings revealed all item scaling units
and factor covariances to be equivalent across calibration and
validation samples. Since measuring instruments can often be
group-specific in the way they operate (Byrne et al., 1989),
findings of noninvariance would have been more expected, than
unexpected. The fact that this was not the case, provides
additional support for the factorial validity of a modified MBI
instrument that does not include Items 2, 11, 12, and 16.
Conclusion
The present study investigated the factorial validity of
the MBI for teachers as a single professional group, and
separately, for elementary, intermediate, and secondary

MB1 Cross-validation
29
educators, the three teacher populations comprising the total
sample. Both CFA and EFA procedures were used to validate the
hypothesized 3-factor structure. Subsequently, CFA was used to
(a) identify scale items that deteriorated the psychometric
soundness of the instrument for each of these groups (b) to
determine which set of items yielded the highest degree of
predictive validity via double cross-validation procedures, and
(c) to test for the invariance of number of factors, item
scaling units, and factor relations across calibration and
validation samples based on the model yielding the greatest
predictive accuracy.
Although findings from the present study, in general, were
consistent with previous factor analytic research on the MBI in
validating a 3-factor structure, this structure was only
modestly well-defined. Additional exploratory work revealed
substantial improvement in model fit with the deletion of two
items measuring emotional exhaustion (#2, #16), one measuring
depersonalization (#11), and one measuring personal
accomplishment (#12). These findings substantiated previous
research that reported problematic factor loading patterns for
these items with respect to both teachers (Belcastro et al.,
1983; Byrne, 1990a; Fimian & Blanton, 1987; Green & Walkey,
1988), and other professional workers (Golembiewski et al.,
1983; Powers & Gose, 1986). Ambiguous item content is believed
attributable to the problematic fit for Items 12 and 16;

MBI Cross-validation
30
multicollinearity resulting from duplicated item content was
clearly the problem with respect to Items 2 and 11 (see Bagozzi
& Yi, 1988; Rindskoff, 1984). Indeed, deletion of these four
items led to a revised MBI instrument Cat yielded a
significantly improved 3-factor structure that withstood
extremely stringent tests of double cross-validation and
factorial invariance across independent samples.
The fact that the 3-factor MBI structure, as origi"ally
proposed by Maslach and Jackson (1986), fit less well for
intermediate teachers, and that this finding replicated those
reported in another study of the same population (Byrne, 1990a)
is both disconcerting and puzzling. Both studies determined a
3-factor, rather than either a 2-, or 4-factor solution to be
optimal, yet both studies also found a similar pattern of
several badly cross-loaded items. At first blush, based on the
present study, one might be quick to point to the relatively
small sample of intermediate teachers compared with that for
elementary and secondary teachers as a possible explanation;
this, however, would appear not to be the answer since in the
other study, all samples, albeit smaller, were approximately
equivalent in size.
While it seems clear that certain MBI items, particularly
those measuring emotional exhaustion and depersonalization, are
apparently being perceived differently by intermediate
teachers, the dilemma as to why this should be so, is an

MBI Cross-validation
31
intriguing one. Is it a question of personality type within the
Jungian typology as suggested by Carder. (1987), or does the
answer lie in the organizational structure and administration
of intermediate/ middle (i.e., junior high) schools? Given both
the number (5) and severity of EE items cross-loading onto the
DP factor (.65 to .53), Garden's (1987) argument that, for
certain personalities (i.e., "thinking", as opposed to
"feeling" types as defined within Jungian theory), and for
certain occupational settings, the Depersonalization factor
tends not to be salient, is certainly worthy of some
reflection, and future scientific inqu:;_ry. Garden notes that
within the educational profession, as with other human service
occupations, most teachers exhibit "feeling" type Jungian
personality characteristics. Thus, it seems unlikely that
teachers at the intermediate level should differ substantially
from their elementary and secondary school colleagues in this
regard. Indeed, a more reasonable explanation seems linked in
some way to sociological factors associated with the work
environment of intcrmediate teachers. The answer to this
perplexing problem, however, must remain the task of future
research.
The present study has imposed the most statistically
rigorous and powerful tests to date on the MBI in testing the
validity of its factorial structure. On the basis of these
findings, together with earlier studies noted above, it is
32

MBI Cross-validation
32
unquestionably clear that at least four items (#2, #11, #12,
#16) must either be deleted or altered in terms of item content
when the MBI is used with members of the teaching profession.
In light of the extremely stringent analyses performed, the
modified MBI that took these deletions into account proved
itself to be remarkably psychometrically sound. Although
researchers and practitioners should be cognizant of
differential item interpretation by elementary, intermediate,
and secondary teachers, these findings are not considered
serious enough to deter use of the suggested revised MBI with
educators as a single professional group, as long as the group
does not extend to the postsecondary level (see Byrne, 1990a).
Further construct validity research that includes testing for
the invariance of MBI measurement and structure across teaching
levels, however, is now needed in order to either confirm or
disconfirm this claim; this work is currently in progress by
the present author.

MBI Cross-validation33
References
Anderson, J.C. & Gerbing, D.W. (1988). Structural equation modeling in practice: A
review and recommended two-step approach. Psycholocical Bulletin, 10, 41
423.
Bagozzi, R.P., & Y1, Y. (1988). On the evaluation of structural equation models.
Academy of Marketing Science, j, 74-94.
Beck, C.L. & Gargiulo, R.M. (1983). Burnout in teachers of retarded and nonretarded
children. Journal of Educational Research, LQ, 169-173.
Belcastro, PA, Gold, RS., & Hays, LC. (1983). Maslach Burnout Inventory: Factor
structures for samples of teachers. Psychological Reports, 0, 364-366.
Bentler, P.M. (1990). Comparative fit indices in structural models. Psychological
Bulletin,107, 238-246.
Bentler, P.M. & Bonett, D.G. (1980). Significance tests and goodness-of-fit in the
analysis of covariance stn,felures. Psychological Bulletin,S.,. 588-606.
Benter, P.M. & Chou, C.P. (1987), Practical issues in structural modeling. Sociological
Methods & Research, if, 78-117.
Bentler, P.M. & Mooijaart, A. (1989). Choice of structural model via parsimony: A
rationale based on precision. Psychological Bulletin, 106, 315-317.
Bollen, KA. (1989). Structural equations with latent tEr4t1 )14mi. New York: Wiley.
Borgatta, E.F,, Kercher, K, & Stull, D.E. (1986). A cautionary note on the use of principal
components analysis. Sociological Methods & Research, 1,5, 160-168.

MBI Cross-validation34
Brookings, J.B., Bolton, B., Brown, C.E., & McEvoy, A. (1985). Self-reported job burnout
among female human service professionals. Journal of Occupational Behaviour,
§, 143-150.
Byrne, B.M. (1988a). Measuring adolescent self-concept: Factorial vaiidity and
equivalency of the SDO III across gender. fOultivariate 13ehaviorAl Research, 24,
361-375.
Byrne, B.M. (1988b). The Self Description Questionnaire III: Testing for equivalent
factorial validity across ability. Educational and Psychological Measurement, 4a,
397-406.
Byrne, B.M. (1989). A Primer of LISREL: Basic applications and programmina for
confirmatorv factor analvtic. New York: Springer-Verlag.
Byrne, B.M. (1990a). The Maslach Burnout Inventory: Validating factorial structure and
invariance across intermediate, secondary, and university educators. Manuscript
under review.
Byrne, B.M. (1990b). Perceived qualitv of worklife by elementary, intermediate, and
secondary teachers in metropolitan Toronto and Ottawa qchools: An investigation
of educalor burnout (Technical Report). Ontario Teachers' Federation.
Byrne, B.M. & Schneider, B.H. (1988). Perceived Competence Scale for Children:
Testing for factorial validity and invariance across age and ability. Applied
Measurement in education, j., 171-187.
:1 5

MBI Cross-validation35
Byrne, B.M., Shavelson, R.J., & Muthén. B. (1989). Testing for the equivalence of
factor covariance and mean structures: The issue of partial measurement
invariance. Psychological Bulletin, 105, 456-466.
Cattell, R.& (1966). The scree test for the number of factors. WItivariate Behavioral
Research, 1, 245-276.
Cudeck, R., & Browne, M.W. (1983). Cross-validation of covariance structures.
Multivariate Behavioral Research, LQ, 147-167.
Farber, B.A., & Miller, J. (1981). Teacher burnout: A psychoeducational perspective.
Teachers cgllege flecord, 11, 235-243.
Fimian, M.J., & Blanton, LP. (1987). Stress, burnout, and role problems among teacher
trainees ami first-year teachers. Journal of Occupational Behaviour, e, 157-165.
Firth, H., Mcircee, J., McKeown, & Britton, P.G. (1985). Maslach Burnout Inventory:
Factor structure and norms for British nursing staff. Psychological Reports, 57,
147-150.
Fornell, C. (1983). Issues in the application of covariance sti ucture analysis: A
comment. Journal of consumer Research, 2, 443-448.
Friesen, D., & Sarros, J.C. (1989). Sources of burnout among educators. Journal of
Organizational Behavior, 12, 179-188.
Garden, A.M. (1987). Depersonalization: A valid dimension of burnout? Human
ROations, 4Q, 545-560.
Gerbing, D.W., & Anderson, J.C. (1984). On the meaning of within-factor correlated
measurement errors. Journal of Qonsumer Research, 11, 572-580.
1 f;
MBI Cross-validation36
Gold, Y. (1984). The factorial validity of the Maslach Burnout Inventory in a sample of
California elementary and junior high school classroom teachers. Educational and
Psychological Mpasuremgint, M, 1009-1016.
Golembiewski, R.T., Munzenrider, R., & Carter, D. (1983). Phases of progressive burnout
and their work site covariants: Critical issues in 0 D research and proxies. 'Me
Jçurnal of Applied Behavioral Science, 12, 461-481.
Gorsuch, R.L (1983). Factof analysis. Hillsdale, N.J.: Erlbaum.
Gorsuch, R.L (1990). Common factor analysis versus component analysis: Some well
and little known facts. Muitivariate Behavioral Research, a, 33-39,
Green, D.E., & Walkey, F.H. (1988). A confirmation of the three-factor structure of the
Maslach Burnout Inventory. Educational and Psychological Measurement, Ag, 579-
585.
Hubbard, R., & Allen, S.J. (1987). A cautionary note on the use of principal components
analysis: Supportive empirical evidence. Socioloaical Methods & Research, LQ,
301-308.
lwanicki, E.F. & Schwab, R.L (1981). A cross validation study of the Maslach Burnout
Inventory. Educational and Psychological Measurement, 41, 1167-1174.
Jackson, S.E., Schwab, RI., & Schuler, R.S. (1986). Toward an understanding of the
burnout phenomenon. journal of Applied Psychology, 71_, 630-640.

MBI Cross-validation37
Joreskog, KG. (1982). Analysis of covariance structures. In C. Fornell (Ed.), g
second aeneration_ of multivariate analysis Vpl 1: Methods (pp. 200-242). New
York: Praeger.
Joreskog, KG. & Sorb Om, D. (1985). LISREL VI: Analysis of Linear Strugtyral
Relationships by the Method of Maximum Likelihood. Mooresville, Ind: Scientific
Software.
Leiter, M.P., & Maslach, C. (1988). The impact of interpersonal environment on burnout
and organizational commitment. Journal of Organizational Behavior, 2, 297-308.
Long, J.S. (1983). Confirmatory factor analysis. Beverly Hills, CA: Sage.
Mac Callum, R. (1986). Specification searches in covariance structure modeling.
Psychological Bulletin, 100, 107-120.
Marsh, H.W., Balla, J.R., & McDonald, R.P. (1988). Goodness-of-fit indexes in
confirmatory factor analysis: The effect of sample size. Psychological Bulletin,
103, 391-410.
Marsh, H.W. & Hocevar, D. (1985). Application of confirmatory factor analysis to the
study of setf-concept: First-and higher order factor models and their invariance
across groups. Psychological Bulletin, 2Z (3), 562-582.
Maslach, C. & Jackson, S.E. (1981a). Maslach Burnout Inventory Manual. Palo Alto,
CA: Consulting Psychologists Press.
Maslach, C. & Jackson, S.E. (1981b). The measurement of experienced burnout.
Journal of Occupatignal Behaviour, 2 99-113.

MB1 Cross-validation38
Maslach, C. & Jackson, S.E. (1984). Burnout in organizational settings. In S. Oskamp
(Ed.) Applied social osvcholoav in Qrcanizational settinas (pp. 133-153). Beverly
Hills, CA: Sage.
Maslach, C. & Jackson, S.E. (1986). Maslach Burnout Inventory Manual (2nd edition).
Palo Alto, CA: Consulting Psychologists Press.
Mulaik, S.A., James, LR., van Alstein, J., Bennett, N., Und, S., & Stilwell, C.D. (1989).
Evaluation of goodness-of-fit indices for structural equation models. Psychological
Bulletin, 105, 430-445.
Muthén, B. & Kaplan, D. (1985). A comparison of methodologies for the factor
analysis of non-normal Liked variables. flritish journal of Mathematical and
Statistical fsychology, 23, 171-189.
Newcomb, M.D. & Bent ler, P.M. (1988). Consequences of adolescent dryg use:
Impact on the lives of young adults. Newbury Park, CA: Sage.
Powers, S., & Gose, K.F. (1986). Reliability and construct validity of the Maslach Burnout
Inventory in a sample of university students. Educational and Psychological
Measurement, 4, 251-255.
Rindskoff, D. (1984). Structural equation models: Empirical identification, Heywood
cases, and related problems. Sociological Methods and Reearch, j, 109-119.
Schwab, R.L & lwanicki, E.F. (1982a). Who are our burned out teachers? Educational
Research Quarterly, 7, 5-16.
3:4

MBI Cross-validation39
Schwab, R.L. & lwanicki, E.F. (1982b). Perceived role conflict, role ambiguity, and
teacher burnout. Edgotrg_A ggtigatgaS2cAr, la 60-74.
Snook, S.C., & Gorsuch, RA_ (1989). Component analysis versus common factor
analysis: A Monte Carlo study. Psychological Bulletin, 1Q6, 148-154.
Suyapa, E., Silvia, M., & MacCallum, R.C. (1988). Some factors affecting the success
of specification searches in covariance structure modeling. Multivariate Behavioral
Fiessrarch, 23, 297-326.
Tanaka, J.S. & Huba, G.J. (1984). Confirmatory hierarchical factor analysis of
psychological distress measures. Journal of Personality and Social Psycholoay,
621-635.
Walkey, F.W. (1983). Simple versus complex factor analyses of responses to multiple
scale questionnaires. Multivariate Behavioral Research, 18, 401-421.

Appendix
MB1 Cross-validation40
Breakdown of MB1 Items on Factors of Burnout
Emotional Exhaustion
1. I feel emotionally drained from my work.2. I feel used up at the end of the workday.3. I feel fatigued when I get up in the morning and have to face another day on the
job.6. Working with people all day is really a strain for me.8. I feel burned out from my work.
13. I feel frustrated by my job.14. I feel I'm working too hard on my job.16. Working with people directly puts too much stress on me.20. I feel like I'm at the end of my rope.
Depersonalization
5. I feel I teat some students as if they were impersonal objects.10. I've become more callous toward people since I took this job.11. I worry that this job is hardening me emotionally.15. I don't care what happens to some students.22. I feel students blame me for some of their problems.
Personal Accomplishment
4. I can easily understand how my students feel about things.1. I deal very effectively with the problems of my students.9. I feel I'm positively influencing other people's lives through my work.
12. I feel very energetic.17. I can easily create a relaxed atmosphere with my students.18. I feel exhilarated after working closely with my students.19. I have accomplished many worthwhile things in this job.21. In my work, I deal with emotional problems very calmly.

MBI Cross-validation41
Footnote
1 An MI may be computed for each constrained parameter and indicates the
expected decrease ;n x2 if the parameter were to be relaxed; the decrease,
however, may actually be higher. MI values < 5.00 indicate little appreciable
improvement in model fit.
2
42
Table 1
SUMMMCY Confirmatory Factor Anelvlic Results 1or cl-Factor Structure
Coveting Model
Sample A (Calibration)Model
Comparison
Sample 8 (Validation)
X2
d/ As2
Adf AGFI CFI PCFI X2
df As2
Adf AGFI CFI PCFI
. 1466) Total - 1465)
0 (22 items) 13,713.22 231 14,321.87 231.83 .84 .75 .831 Initial 2,413.85 206 2,397.89 206 .84 .75
2 EFAspecification
b2,084.24 204 325.61 2 .85 .86 .76 ... vs 1
0 (20 items) 11,757.42 190 12,367.26 190
.87 .88 .77
---3 vs 2 .883 Items 16, 12
deleted1,553.23 167 535.01 37 1,573.32 167 .87 .77
4 Model 3 withcorrelatederror between
1,231.66 166 321.57 1 .90 .91 .80 4 vs 3
Items 1 and 25 Model 4 with
correlatederror between
1,029.30 165 202.36 1 .91 .93 .81 5 vs 4
Items 10 and11
0 (18 items) 9,166.14 153 -- 9,793.73 153---600.54 .91 .79 6 vs 3 .91 .92 .806 Model 3 with 952.69 132 35 .91 950.93 132 622.39 35
Items 10, 1
deleted7 Model 3 with 900.50 132 652.73 35 .92 .91 .79 7 vs 3 919.84 132 653.43 35 .91 .92 .80
Items 10, 2deleted
8 Model 3 with 875.59 132 677.64 35 .91 .92 .80 8 vs 3 935.17 132 638.15 35 .91 .92 .80
Items 11, 1
deleted9 Model 3 with 831.54 132 721.6 35 .92 .92 .80 9 vs 3 905.10 132 668.22 35 .92 .92 .80
Items 11, 2deleted
. 580) Elementary = 579)
0 (22 items) 5,598.46 231 5,588.79 231.83 .85 .761 Initial 1,010.91 206 .83 .85 .76 1,009.16 206
108.05 2 vs 12 EFAspecification
902.86 204 2 .84 .87 .77
0 (20 items) 4,737.51 190 -- 4,729.33 190284.34 .87 .90 .79 3 vs 2 .85 .873 Items 16, 12
deleted618.52 167 37 745.20 167 .76
4 Model 3 withcorrelatederror between
532.42 166 86.10 1 .89 .92 .80 4 vs 3
Items 1 and 25 Model 4 with
correlatederror between
474.87 165 57.55 1 .90 .93 .81 5 vs 4
Items 10 and11
0 (18 items) 3,738.64 153 3,732.18 153---195.80 .91 .92 .80 267.67 .89 .90 .786 Model 3 with 422.72 132 35 6 vs 3 477.53 132 35
Items 10, 1delet(1
7 Model 3 with 401.65 132 216.87 35 .50 .92 .80 7 vs 3 469.89 132 275.31 35 .89 .91 .79
Items 10, 2ellrleted
8 Model 3 with 426.21 132 192.31 35 .90 .92 .80 8 vs 3 469.39 132 275.81 35 .89 .91 .79
Items 11, 1
deleted9 Model 3 with 406.02 132 212.50 35 .91 .92 .80 9 vs 3 464.66 132 280.54 35 .89 .91 .79
Items 11, 2deleted

Table 1 (Cont'd)
Competing Model
0 (22 items)1 Initial2 EFA
specification0 (20 items)3 Items 16, 12
deleted4 Model 3 with
correlatederror betweenItems 1 and 2
5 Modet 4 withcorrelatederror betweenItems 10 and11
0 (18 items)6 Model 3 with
Items 10, 1
deleted7 Model 3 with
Items 10, 2deleted
8 Model 3 withItems 11, 1
deleted9 Model 3 with
Items 11, 2deleted
0 (22 items)1 Initial2 EFA
specification0 (20 items)3 Items 16, 12
deleted4 *del 3 with
correlatederror betweenItems 1 and 2
5 Model 4 withcorrelatederror betweenItems 10 and11
0 (18 items)6 Model 3 with
Items 10, 1
deleted7 Model 3 with
Items 10, 2deleted
8 Model 3 withitems 11, 1
deleted9 Model 3 with
Item4 11, 2deleted
43
sample A (Calibration) sample e (Validation)
X2
df £2 Adf AGFI CFI PCFIModel
Comparison X2
df Ax2
Adf AGFI CFI PCFI
(ft - 194) Intermediate (0 = 194)
1,985.61 231 2,206.57 231
.71 .69 .75 .82605.92 206 .77 559.63 206 .73
566.66 204 39.26 2 .72 .79 .70 2 vs 1
1,718.24 190 1,888.31 190
435.52 167 131.14 37 .74 .82 .72 3 vs 2 390.78 167 .79 .87 .76
367.73 166 67.79 1 .78 .87 .76 4 vs 3
350.90 165 16.83 1 .79 .88 .76 5 vs 4
1,369.50 153 1,475.27 153---298.93 132 136.59 35 .80 .56 .74 6 vs 3 277.24 132 113.54 35 .83 .89 .77
305.34 132 130.18 35 .79 .86 .74 7 vs 3 271.05 132 119.73 35 .83 .89 .77
307.71 132 127.81 35 .79 .86 .74 8 vs 3 248.05 132 142.73 35 .84 .91 .79
315.81 132 119.71 35 .79 .85 .73 9 vs 3 243.89 132 146.89 35 .85 .92 .80
(n . 692) Secondary (D = 692)
6,423.41 231 6,656.56 231---.81 .83 .74 .82 .751,281.20 206 -- 1,209.60 206 .84---
147.461,133.74 204 2 .83 .85 .75 3 vs 2
5,553.55 190 5,736.33 190
237.76 .86 .76 3 vs 2 .86 38895.98 167 37 .84 804.10 167 .89
741.83
626.67
166 154.15
115.16
1 .87 .89 .78 4 vs 3
5 4165 1 .89 .91 .79 vs ^
4,265.32 153 - 4,584.13 153 --- --337.92 .89 .78 6 vs 3 .90 .80558.06 132 35 .90 503.70 132 300.40 35 .92
525.52 132 370,46 35 .90 .90 .78 7 vs 3 503.73 132 300.37 35 .90 .92 .80
499.34 132 396.68 35 .90 .91 .79 8 vs 3 504.65 132 299.45 35 .90 .92 .80
472.64 132 423.34 .91 .97 .80 9 vs 3 505.16 132 298.94 .90 .92 .80
aAll ix
2values statistically significant at p < .001
Items 16 (EE) and 12 (PA) free to load on DP and EE, respectively
EE Emotional Exhaustion; DP . Depersonalization; PA Personal Accomplishment
4 4

MBI Cross-validation44
Table 2
aginmgyEattrit3-Factor StryctureTotal Elementary intermediate Secondary
(n = 2931) (n = 1159) (n = 388) (n --= 1384)
Target Loadings`(22 factor loadings)
High .87 .87 .87 .91
Low .30 .29 .34 .32Median .00 .59 .52 .60% z .35 95.45 95.45 68.18 95.45
Nontarget Loadingsb(44 factor loadings)
High .39 .36 .65 .42Low .00 .00 .00 .01
Median .06 .05 .12 .07% z .35 2.27 2.27 20.45 2.27
Factor Correlations(3 factor correlations)
High .50 .53 -.46 .45Low -.29 -.33 -.04 -.27Median -.47 -.49 -.41 -.43% z .35 66.67 66.67 66.67 66.67
Items withcross-loadings > .20
#12#16
(.39)(.23)
#12#16
(26)(.23)
#12 (.37)°,
(.26)
#12#16
(.42)(.21)
#16 (.64)
a
b
o
Target loadings are factor ioadings on the factor which the item was designed tomeasureNontarget loadings are all other loadingsAdditional cross-loaded items > .20 for intermediate teachers were: #20 (.65); #13(.63), (.24); #8 (.63), (.38); #3 (.44), (.46); #15 (.53); #19 (.37); #9 (.30); #18 (30);#14 (.26)
4 I 5

Table 3
Rouble Cross-velidatlan Results Acme Cslibrotion and Validation Semite
Sample A (Calibration)s
Competing Model
45
Semple 8 (Validetion)b
I2
df CVI X2
df CVI
3 Items 16, 12deleted
6 items 10, 1
deleted
7 Items 10, 2deleted
8 Items 11, 1
deleted
9 Items 11, 2deleted
3 Items 16, 12deleted
6 items 10, 1
deleted
7 Items 10, 2deleted
8 Items 11, 1
deleted
9 items 11, 2deleted
3 Items 16, 12deleted
6 Items 10, 1
deleted
7 Items 10, 2deleted
8 Items 11, 1
deleted
9 items 11, 2deleted
3 Items 16, 12deleted
6 Items 10, 1deleted
7 Items 10, 2deleted
8 Items 11, 1
deleted
9 Items 11, 2deleted
Total
1620.06 190 1.09 1597.59 190
996.98 153 .67 1000.01 153
966.81 153 .65 946_37 153
983.98 153 .66 922.01 153
953.85 153 .64 877.87 153
Elementary
789.85 190 1.36 663.10 190
527.34 153 .91 471.56 153
518.85 153 .90 449.82 153
516.24 153 .89 472.71 153
510.44 153 .88 451.63 153
Intermediate
445.50 190 2.31 483.51 190
314.99 153 1.63 335.15 153
322.37 153 1.67 342.84 153
500.06 153 1.55 i 356.93 153
353.49 153 1.83 366.51 153
Secondary
856.77 190 .89 948.01 190
561.32 153 .81 612.88 153
560.20 153 .81 579.22 153
560.17 153 .81 551.80 153
559.94 153 .81 524.46 153
1.07
. 67
. 63
. 62
.59
1.15
.81
1 .78 1
.82
2.51
1.74
1.78
1.85
1.90
.99
.89
.84
.so
.76
Model estimation based
correlation parameters
Model estimation besed
correlation parameters
on Sample 8 covariance metrix; medal specification constrainAd factor loading and
to be fixed a priori based on Sample A estimetes
on Sample A covariance matrix; model specification constrained factor loadings and
to be fixed a priori based on Swift 8 estimates
4 6

MBI Crow-validation46
Table 4
IgAsi for Eauivalent Measuresmr1 and Strgatura Across Catibration and Validation Sanbteg Gaged on Model 98
Ceepeting Model I2
df Az2
Adf
Total
1.
2.
3.
Equivalent number of factors (3)
Equivalent item measurements
Equivalent item measurements and
factorial structure
1736.65
1732.97
1760.40
264
279
285
NS
NS
16.32
7.43
---
15
6
Elementary
1. Equivalent number of factors (3) 870.68 264 ---
2. Equivalent item measurements 891.22 279 20.54 15 NS
3. Equivalent item measurements and
factorial structure893.65 285 2.43 6 NS
Intermediate
1. Equivalent number of factors (3) 559.70 264
2. Equivalent item measurements 573.93 279 14.23 15 NS
3. Equivalent item measurements and
factorial structure585.93 285 12.00 6 MS
Secondary
1. Equivalent number of factors (3) 977.80 264 ------
2. Equivalent item measurements 994.87 279 17.07 15 NS
3. Equivalent item neasurements and
factorial structure
1004.44 285 9.57 6 NS
NS m not significant
aItems 2, 11, 12, 16 deleted