ecr2 economic crisis: resilience of regions · the espon project economic crisis: resilience of...
TRANSCRIPT

ESPON 2013 1
ECR2 Economic Crisis: Resilience of
Regions
Applied Research 2013/124/2012
Revised Interim Report | Version 20/05/2013
ESPON 2013 2
This report presents a more detailed
overview of the analytical approach to be
applied by the project. This Applied
Research Project is conducted within the
framework of the ESPON 2013
Programme, partly financed by the
European Regional Development Fund.
The partnership behind the ESPON
Programme consists of the EU
Commission and the Member
States of the EU27, plus Iceland,
Liechtenstein, Norway and
Switzerland. Each partner is
represented in the ESPON
Monitoring Committee.
This report does not necessarily
reflect the opinion of the members
of the Monitoring Committee.
Information on the ESPON
Programme and projects can be
found on www.espon.eu
The web site provides the
possibility to download and
examine the most recent documents
produced by finalised and ongoing
ESPON projects.
This basic report exists only in an
electronic version.
© ESPON & Cardiff University,
2013.
Printing, reproduction or quotation
is authorised provided the source is
acknowledged and a copy is
forwarded to the ESPON
Coordination Unit in Luxembourg.

ESPON 2013 3

ESPON 2013 4
List of authors and principal contributors
Cardiff University:
Gillian Bristow
Adrian Healy
Laura Norris
FTZ-Leipzig
Rudiger Wink
Aristotle University
Grigoris Kafkalas
Christina Kakderi
Tartu University
Kerly Espenberg
Uku Varblane
Veiko Sepp
Gdansk University
Iwona Sagan
Grzegorz Masik
Manchester University:
Marianne Sensier
Alan Harding
Experian Plc:
Adam Swash
Heather Carey

ESPON 2013 5
CONTENTS
Executive Summary
1 Introduction 11
2 The Territorial Impact of the Economic Crisis 17
3 Identifying the Components of Economic Resilience 32
4 Territorial Resilience as a Policy Concept 41
5 Communication Activities of the Project 46
6 Towards the Draft Final Report 48
7 Emerging Policy Conclusions 50

ESPON 2013 6
Executive Summary
The ESPON project Economic Crisis: Resilience of Regions examines the geography
of the economic crisis across the ESPON territory, and explores why some regions are
more able to withstand an economic downturn than others, or are able to recover
faster. The project began in April 2012 and produced its Inception Report in August
2012.
This Revised Interim Report sets out progress since the Inception Report and updates
the Interim Report (submitted in January 2013) on the basis of comments received
from the ESPON CU and Sounding Board. The TPG is in the process of assessing the
economic resilience of regions in the face of economic shocks and crises. Project
progress is broadly on schedule. There has been an impressive effort across the TPG
to maintain the programme of research set out in the Inception Report. Partners have:
Completed the initial collection of comparable data across the ESPON
territory.
Made an assessment of the availability and value of wider datasets
Begun the process of analysing the data sets
Made good progress on the undertaking all the planned case studies
It is too early to report on the results of this other than in the most tentative manner.
However, there are some important insights already emerging. These tie in well to
the more generic literature, and to typologies of resilience developed for places such
as the US and more global indexes.
Most people have an intuitive notion of resilience - the capacity to sustain a shock,
recover, and continue to function and, more generally, cope with change. Within the
developing literature on regional economic resilience, a broad distinction can be made
between two different conceptions of the term, firstly the speed with which a system
returns to a pre-shock situation and, secondly, the manner in which a system adapts to
new circumstances. From this perspective Regional economic resilience embraces
not only recovery, but also resistance, or the ability of regions to resist disruptive
shocks in the first place; re-orientation, or the extent to which the region adapts its
economic structure; and finally, renewal, or the degree to which the region resumes
the growth path that characterised its economy prior to the shock (Martin, 2012).
As well as shaping the definition of resilience, this systems-based perspective also
extends to its measurement and analysis. Thus, from this perspective economically
resilient and non-resilient regions are identified by examining the system’s overall
economic performance over a period of time, with criteria for a negative economic
shock defined, and pre- and post-shock growth rates and trajectories of output and
employment measured.
ESPON 2013 7
Whilst valuable in highlighting the potential for resilience to illuminate how regional
economies respond to economic disruptions, this system and structure emphasis has
resulted in much less attention being paid to understanding the role of human agency
in the adaptation at the heart of regional economic resilience. Developing a fuller
understanding of the role that the different actors in regional economies - including
local and regional governments - can play in shaping their resilience to economic
shocks requires that the systems-oriented perspective outlined above be supplemented
with a people-oriented perspective. Resilience then is not simply an end point or
performance outcome: it is a process or an ongoing development capacity to adapt to
change and thrive.
At the EU level the recent economic crisis is regarded as an opportunity for change
rather than a one-off hit that allows the resumption of business as usual, emphasising
the potential for reorientation and renewal. Thus the emphasis is upon encouraging
sustainable recovery with the Europe 2020 strategy document explicitly stating ‘our
exit from the crisis must be the point of entry into a new economy’ (p. 10). At the
same time, European policy-makers are also aware that crisis induced austerity
measures are likely to present significant difficulties for some regions in terms of
finding resources to invest in appropriate innovation and regional development
policies.
More broadly, it is also acknowledged that different regions are affected by crises in
different ways. Regions are understood to be highly diverse and evolutionary entities.
Thus according to the Territorial Agenda 2020, ‘local endowments and territorial
characteristics have growing importance for regions in order to cope with and recover
from external shocks’ (p. 5). Furthermore, resilience is here conceived as a place-
based capacity shaped both by a territory’s inherited resources and structures, as well
as its people and the agency of its individuals, businesses and institutions. This
territorially-embedded approach introduces the final fundamental component of
resilience: the importance of place.
In recent years there have been a small number of studies which seek to measure the
economic resilience of particular territories. These provide interesting insights in
terms of methodological approach and their underlying hypotheses. Some are also
instructive in terms of their potential predictive power, particularly where they were
developed prior to the current economic crisis. Examining the various approaches to
date it is apparent that most of the indicators identified focus on innate characteristics
of resilience, rather than measures of the adaptive capacity of a region. Overall, there
is a degree of consistency in what is regarded as significant in determining resilience,
put broadly this relates to business characteristics, population characteristics and the
nature of society (or community). Place-based considerations are less prevalent. The
other area of variation is in the level of significance ascribed to macro-economic
conditions. Whilst this latter element may have less significance in assessing relative

ESPON 2013 8
resilience between geographical units within a national economy it might be expected
to play a stronger role in cross-national comparisons.
Across the European territory there is only one year since 1990 when no national
economy has experienced a decline in levels of gross employment. There is less
volatility in the number of economies experiencing a year-on-year decline in GDP,
but, even here, there have only been 4 years when no economy has experienced a
decline. Thus, it is clear that economic downturns are highly prevalent. Looking at
the wider picture though there appear to have been two European-wide downturns in
the period 1990-2012. One around the period 1992-93 and the other starting around
2008-09. For the purposes of this study’s terms of reference these are regarded as
‘economic crises’, with the latter representing the ‘last crisis’. In addition there have
two other identifiable periods of downturn affecting an important proportion of
national economies: one around 1997-99 and the other around 2003.
The complex temporal and physical geography of the last economic crisis is clearly
illustrated in available data. This demonstrates the significance of national patterns as
well as some strong regional variations. The data provides a rich resource through
which to explore patterns of resilience in the forthcoming stages of this study. The
perceptual geography of the crisis complements the available economic data, albeit
only at a national level at present. This provides a useful resource for further analysis.
Using the performance measures generated by recessionary analysis the study will
look to build a stronger understanding of the components of economic resilience at a
regional level. The study team has made good progress in collecting statistical
resources which will assist in informing this future workstream. Analysis of the
literature suggests the following:
That prevailing endowments of physical capital and human capital can all
positively influence levels of resilience
That the prevailing condition of the economy is influential, with stronger
economies more resilient than those that are weaker,
That the sectoral structure of an economy can play an important role in levels
of economic resilience, and that more diverse economies tend to exhibit
greater levels of resilience
That access to markets, and the size of these markets can positively affect the
resilience of an economy
That levels of social capital, informal institutions and network capital exert a
positive influence on levels of economic resilience
That governmental structures can influence levels of economic resilience, with
greater levels of fiscal or legislative autonomy supporting economic resilience
at a sub-national level
However, the literature also suggests that each of these factors, whilst broadly
supportive of economic resilience, can also act to weaken resilience. So, greater
ESPON 2013 9
market access can leave an economy vulnerable to increased levels of competition;
higher levels of human capital can reduce competitiveness through increasing wage
levels, and so on.
Economic resilience is also about the decisions that are taken by firms, residents and
governance bodies. In that respect measures that shed a light on these choices, such
as levels of entrepreneurship, or constraints on such choices, such as barriers to
starting a business, also provide insights into levels of economic resilience. Some
indicators of choices taken, which intuitively appear to form potential measures of
resilience, such as migration rates, prove on further analysis not to be so.
In examining potential indicators of components of resilience we are guided by the
four-fold classification identified in the Inception Report for this study; that is:
Business, People, Community, and Place. We have explored further the potential
offered by the indicators initially identified in the Inception Report together with
potential measures suggested by the Sounding Board. The main report provides a
summary of the indicators identified, the data available and their potential value to the
study.
The quantitative data will be supplemented by qualitative research undertaken in eight
case study regions. Good progress has been made on all eight case studies. Interim
reports have been produced by each of the teams responsible for the individual case
studies. These provide an important qualitative dimension to our work. They provide
an opportunity to explore the potential components of resilience in more detail,
together with the policy context in each of the selected regions. As the research in
each region is at an early stage it would be inappropriate to provide a detailed analysis
of each study. However, initial review of the material illustrates a number of
common features emerging that have influenced the observed resilience of each of our
study areas. These include:
Diverse economic base
Sectoral composition
Education and skills
Labour market flexibility
Urban structures and infrastructures
Entrepreneurship
Governance
One of the elements we have been asked to consider is the extent to which the crisis
has led to the adoption of new development paths, particularly green growth
strategies. The initial evidence of this from the case studies is mixed. Certainly
economic crisis provides opportunities for development paths that break with the past.
There are some signs of this occurring. There is also evidence of the development of
green-based strategies being developed in some instances. However, there is also

ESPON 2013 10
evidence of how tighter fiscal conditions are leading to concerns about the relative
cost of such approaches at a time when stimulating growth is a strong priority.
The TPG has not only been progressing its programme of research but has also been
actively involved in communication and dissemination activities. These include work
with the NCP in the UK and participating in workshops of practitioners in the UK and
Ireland. As the project continues it is anticipated that this aspect of our activities will
continue to increase.
It is rather early in the development of this project to be drawing strong policy
conclusions. However, there are some preliminary conclusions that emerge from the
study results to date. Clear indications are emerging of the importance of a flexible
and adaptive workforce and labour market; of the important role innovative firms can
play; of the complex nature of entrepreneurial development in stimulating resilience;
of the value of an open and diverse economy, and of the role of expectations of the
future in influencing behaviour. The presence of a critical mass of activities also
appears to be significant. The increasing integration of economic activity across
regional economies is exacerbating the difficulties faced by local policy makers, but
also suggests that the reduction in the ‘localisation’ of economies may offer
opportunities to build resilience over the longer-term. Evidence is also pointing to the
effects of economic downturn on the long-term prospects for economic resilience and
growth.
There is some evidence that public policies can make a difference to the economic
resilience of regions. These actions can be considered at three levels:
Anticipatory actions - that seek to build a stronger understanding of the
components of the local economy
Reactive policies - which seek to respond to economic downturn to mitigate
the effects in a region, generally a series of shorter-term actions
Transformative actions – that seek to bolster the resilience of an economy over
the medium to long-term
The TPG is also beginning to consider the form that useful tools might take to be of
assistance to sub-national actors. One of the key tools is likely to take the form of an
assessment grid, assisting policy actors to assess the potential resilience of their
region. This will consider elements developed and tested in the latter stages of this
study under the categories of business, people, community and place.

ESPON 2013 11
1 Introduction
1.1 Project status
The ESPON project Economic Crisis: Resilience of Regions examines the geography
of the economic crisis across the ESPON territory, and explores why some regions are
more able to withstand an economic downturn than others, or are able to recover
faster. It is a project with a high policy-relevance and also contributes to an emerging
theme of academic debate.
The project was initiated in April 2012. The Inception Report was provided in
August 2012 and agreed following discussion with the Sounding Board and the
ESPON CU at the end of September 2012. In the four months since the agreement of
the Inception Report the TPG have continued to progress the project to the schedule
agreed. This includes further refinements to our conceptual thinking including a
deeper analysis of available policy documentation; the collation of data for the
indicators identified in the Inception Report, together with some suggestions made by
the Sounding Board; undertaking a very preliminary analysis of available datasets,
and initiating the case study research programme.
We are now deeply immersed in the process of assessing the economic resilience of
regions in the face of economic shocks and crises. It is too early to report on the
results of this other than in the most tentative manner. However, there are some
important insights already emerging. These tie in well to the more generic literature,
and to typologies of resilience developed for places such as the US and more global
indexes.
The TPG submitted its Interim Report in January 2013, in line with the proposed
schedule. The current Revised Interim Report amends this work in line with the
response received from the ESPON CU and the Sounding Board. This response was
received in draft format on the 29th
March 2013 and formally on the 24th
April 2013.
We are grateful for the constructive advice, comments and assistance provided by
both the ESPON CU and the Sounding Board which serves to strengthen the project
overall. The principal modifications requested were as follows:
1. Providing a greater coherence in the report between analytical concepts and
findings in literature, data and case studies
2. Further reflection on and refinement of the hypothesis;
3. A more targeted focus on the sub-national/regional dimension of the crisis and
resilience:
4. Inclusion of defined project objectives/research questions and project scope in
the introduction;
5. Inclusion of a plan and draft table of content for the Draft Final Report;
6. Improvement of the map presentation; and

ESPON 2013 12
7. Address the issue of missing data for the 31 ESPON countries.
The revised Interim Report has been restructured to reflect the comments made but
has not been fully updated to reflect activities undertaken since February 2013. It
retains all those elements identified in the agreed Inception Report, namely:
The results of our recessionary analysis, together with maps and figures
illustrating these results
An initial hypothesis for a typology of regions
Preliminary findings on the analysis of the components of regional resilience
Report on data collection achieved
Preliminary results of the case study analysis
First indications of emerging conclusions and policy relevant
recommendations
We do not attempt to draw inferences from this material as to the absolute, or relative,
resilience of different territories. It is too early in the project for that. However, the
work does illustrate the rich resource that we are developing for further analysis and,
we hope, provides a valuable basis for debate and discussion.
We include updated material to contribute to the ESPON capitalization and
communication strategy as a separate deliverable.
In terms of the ‘missing data’, our partners, Experian, state that they have collected as
full as time series as possible from the raw source. The time series availability from
raw sources does, however, vary dramatically across indicators and across countries
and regions. They state that there will always be a lag between the reference period and the
publication date, and the length of the time lag varies from one month to multiple
years, according to: the source or the statistics. For example, the frequency with which surveys are
collected varies between different surveys and different countries.
the time dependency between different surveys or different statistics. For
instance, National Accounts or Short Term Statistics require for their
elaboration weights derived from Structural Business Survey data.
method changes: for example, change of base years, change in sampling
frames, coupling with other methodological changes.
Where data is not available for a certain indicator prior to/or after a certain year this
will reflect a lack of availability from the original data source, unless stated otherwise
in the metadata. Example issues - GDP data for Norway and Switzerland Looking specifically, at the issues raised for Norway and Switzerland (though this
often is the case for much of Europe) they argue that the lag in the data is due to the

ESPON 2013 13
industry classification changes. During 2012 many national statistics authorities
began publishing data only on NACE rev. 2 which is not comparable with the
previous classification (NACE rev 1.1). Due to the econometric forecasting
techniques used by the ERFS1 and the objectives of the ESPON Resilience project, we
require time-series data. At the time of the project, the national statistics offices were
only publishing the latest data on the new classification (e.g. 2008-2009) – this was
not sufficient for our purposes and so we were limited to using the dataset on the
older classification. (Full details of the industry changes and publishing timelines can
be found here:
http://epp.eurostat.ec.europa.eu/portal/page/portal/nace_rev2/introduction) For Norway the primary source of our data is Statistics Norway (www.ssbno). For
Switzerland the primary source of our data is Swiss Statistics (www.bfs.admin.ch). Due to the industry classification changes, we were only able to source:
1995-2007 data on the NACE rev 1.1 classification
2008-2009 data on the NACE rev 2 classification (2010 data has also now
available)
As the 2 datasets are not directly comparable, we were only able to use NACE rev
1.1.
1.2 Project progress
Project progress is broadly on schedule. There has been an impressive effort across
the TPG to maintain the programme of research set out in the Inception Report.
Partners have:
Completed the initial collection of comparable data across the ESPON
territory. The process of collecting this data has taken a little longer than
anticipated limiting the level of analysis that we have been able to complete
for inclusion in this Interim Report.
Made an assessment of the availability and value of wider datasets, based on
an initial assessment of the potential components of resilience. There remains
an ongoing debate as to how certain ‘gaps’ in the data series might best be
filled.
Begun the process of analysing the data sets, particularly in terms of
identifying the effects of asynchronous business cycles across the ESPON
space
Made good progress on the undertaking all the planned case studies. No
significant issues have arisen in initiating these case studies and good contacts
have been developed in all the regions involved. The case study work will
continue in the forthcoming phases of the project
1 European Regional Forecasting Service

ESPON 2013 14
A broad assessment of progress against the planned work schedule suggests the
following:
Activity Progress
Activity 2 Minor delays in compiling key data sets. Most data now collated
and primary evidence base now predominantly in place. There
remain some gaps in the data which Experian argue are not able to
be filled. Typology development work underway
Activity 3 Data for this Activity now available from Activity 2. Initial
analysis underway
Activity 4 Good progress made in delivering all case studies. On schedule.
Activity 5 Underway, based on initial analysis of materials and data
Communication
activities
Good progress. The TPG has been engaged in a variety of
communication activities, some in co-operation with NCPs, and has
a range of further activities already planned
The minor delay in accessing comparable data sets under Activity 2 has had a knock-
on effect in terms of Activity 3 and, to a lesser extent, Activity 5. This has limited
some of the analysis available at the time of this Interim Report. It is not believed
that this will have a significant impact on the delivery of the Draft Final Report. The
TPG is, however, pleased to be able to deliver on its commitments in terms of the
proposed content of this Revised Interim Report.
1.3 Project scope
The proposed study resonates strongly with the territorial challenges identified for
ESPON 2013 projects. What makes some regions more resilient in the face of
economic crises, and others less so, is a question which has strong traction in the
present economic circumstances. The overall aim of the project is:
“To expose territorial evidence that supports policy-makers at different
administrative levels in making the economic structure(s) in Europe and its
countries, regions and cities more resilient to economic crises and a sudden
economic downturn.”
In essence this leads us to three, inter-related, hypotheses:
1. That some territories exhibit greater levels of economic resilience in the face
of an economic crisis than others
2. That more (or less) resilient territories exhibit particular (sets of)
characteristics
3. That there are actions which policy-makers can take that lead to more (or less)
resilient outcomes.

ESPON 2013 15
In delivering this aim, and testing these hypotheses, our objectives for the project are
to deepen our understanding of:
The impact of the current economic crisis and other recent crises such as the
one in the early 1990s;
The resilience of economic structures;
The capacity (of regions and territories) to adapt to new socio-economic
realities.
The Brief for the study sets out a number of key policy questions and a related series
of research questions under three common headings. We group these questions
around the three broad objectives for the study, identifying a series of associated
subsidiary objectives. These are:
1. To identify the territorial impact of the last economic crisis
To identify indicators which present a robust measure of the territorial impact
of the economic crisis.
To measure the territorial impact of the economic crisis at different
geographical scales, to identify and map the distribution of these impacts
across the European territory and to identify whether specific types of region
have been more affected than others.
To identify whether particular economic activities/sectors were particularly
impacted by the economic crisis, and the location of these effects
To identify the spatial and temporal distribution of the territorial impact of
economic crises across the European territory.
2. To estimate the territorial resilience of regions
To identify what elements in economic structures and policy responses made a
difference to regions’ ability to recover from the economic crisis.
To identify the qualitative and quantitative factors which form territorial
characteristics enabling some regions to resist, or move out of, economic
downturn more effectively than others.
To identify which regions and which types of territories tend to be more
resilient and adaptive to economic crises in Europe.
3. To understand the role of territorial policy responses in promoting economic
resilience
To identify the potential role that territorial development policies can play,
and are playing, in promoting regional resilience and economic recovery.
To estimate the contribution that integrated and place-based actions can play
in complementing macro-economic measures aimed at stimulating economic
recovery.
To consider how policy-makers can enhance the resilience of regional
economies for future economic downturn.
ESPON 2013 16
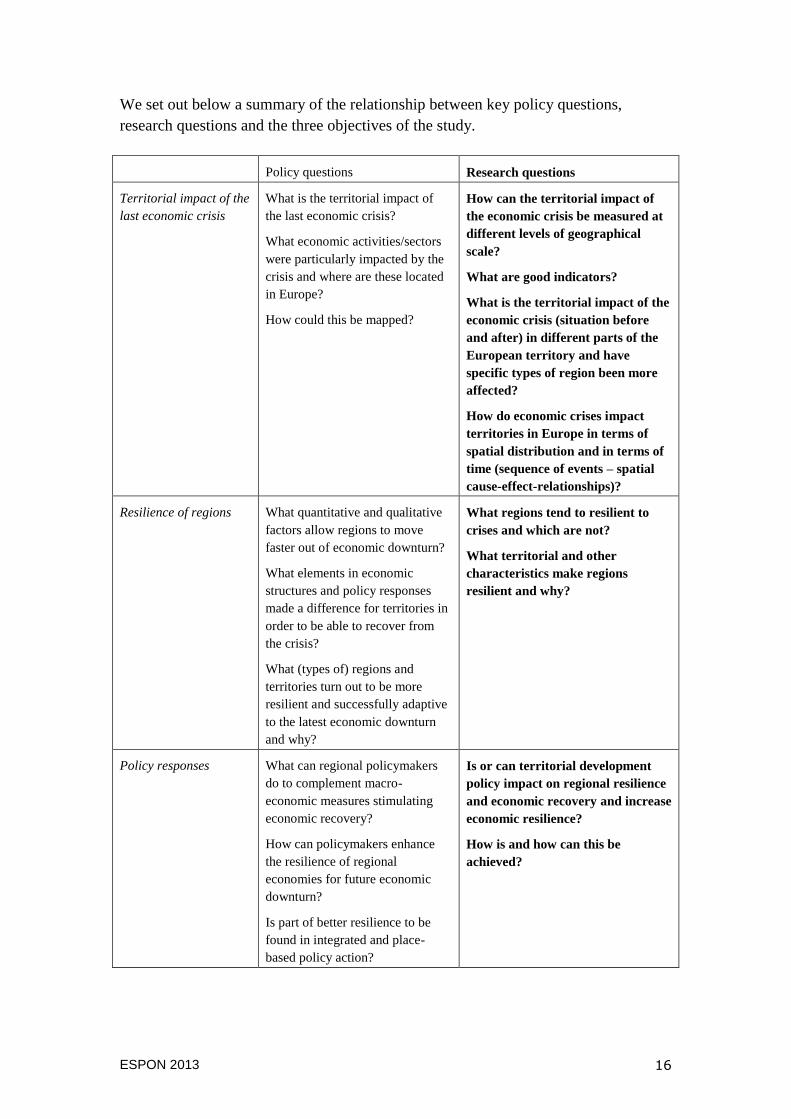
We set out below a summary of the relationship between key policy questions,
research questions and the three objectives of the study.
Policy questions Research questions
Territorial impact of the
last economic crisis
What is the territorial impact of
the last economic crisis?
What economic activities/sectors
were particularly impacted by the
crisis and where are these located
in Europe?
How could this be mapped?
How can the territorial impact of
the economic crisis be measured at
different levels of geographical
scale?
What are good indicators?
What is the territorial impact of the
economic crisis (situation before
and after) in different parts of the
European territory and have
specific types of region been more
affected?
How do economic crises impact
territories in Europe in terms of
spatial distribution and in terms of
time (sequence of events – spatial
cause-effect-relationships)?
Resilience of regions What quantitative and qualitative
factors allow regions to move
faster out of economic downturn?
What elements in economic
structures and policy responses
made a difference for territories in
order to be able to recover from
the crisis?
What (types of) regions and
territories turn out to be more
resilient and successfully adaptive
to the latest economic downturn
and why?
What regions tend to resilient to
crises and which are not?
What territorial and other
characteristics make regions
resilient and why?
Policy responses What can regional policymakers
do to complement macro-
economic measures stimulating
economic recovery?
How can policymakers enhance
the resilience of regional
economies for future economic
downturn?
Is part of better resilience to be
found in integrated and place-
based policy action?
Is or can territorial development
policy impact on regional resilience
and economic recovery and increase
economic resilience?
How is and how can this be
achieved?

ESPON 2013 17
2. The Territorial Impact of the Economic Crisis
One of the key questions facing policy-makers is why some regions are more strongly
affected by economic crisis than others, and why some are able to recover more
rapidly than others. This goes to the heart of our first hypothesis and so an initial
stage of our research has been to explore the geography of economic crises across the
ESPON territory. A first stage in this process is to identify what constitutes an
economic crisis, and when these have occurred across the European territory. We
then consider the last economic crisis, and begin to develop a picture of its territorial
implications. An important feature of this latter element is our consideration of
normative perspectives, in line with our wider consideration of the role of individual
decision-making (‘agency’), alongside objective economic data. In forthcoming work
we will include a stronger reflection on the effects of the crisis in particular regions,
drawing on case study material, but we restrict ourselves here to consideration of the
broad geography of the crisis.
2.1 Determining the incidence of economic crises
There is no standard definition of an economic crisis. Most definitions identify
economic crisis as a period, often long-term, of low or declining economic growth.
Some definitions also include increasing levels of unemployment and/or falling
prices. Most definitions are aspatial, or take a national economy as their territorial
unit.
The most accepted measure of economic growth is a change in the level of Gross
Domestic Product (GDP), which is also sometimes termed Gross Value Added
(GVA). Typically, a decline in this measure for two consecutive quarters (3 month
period) constitutes a recessionary event. Of course, GDP does not capture the full
operation of the economy. In particular increases in productivity can result in
increasing levels of output but declining levels of employment. Employment is also
the most visible indicator for a population as to whether their economy ‘feels’
resilient or not, and has a tangible impact on the absolute and relative well-being and
welfare of communities.
Thus, in developing our key indicators for geography of the last economic crisis we
consider the following (see also Box 2.1):
A fall in gross annual GDP/GVA – measured in domestic currency to avoid
the impact of currency fluctuations
A fall in levels of gross employment on an annualized basis
Alongside these economic indicators we also consider the breadth of any changes.
The proportion of States registering falls in economic performance in any one year

ESPON 2013 18
varies across the EU, and the number of regions even more so. Our third key
indicator is thus to examine the number of economies experiencing decline in any
single year.
Box 2.1 Defining economic crisis
We take two standard measures of economic performance as indicators of economic
growth or decline.
The first is economic output, measured in terms of GDP at constant prices. We have
used constant prices in the domestic currency rather than a purchasing parity standard
measure. GDP is the conventional indicator used to measure economic decline, with
a recession typically defined as two consecutive quarters of negative growth. For the
purposes of this work we amend this to a year-on-year decline in economic activity.
This provides a stronger measure of longer-term effects, which is more appropriate
when considering resilience, and where data availability is stronger.
The second is total employment. Here there are two standard measures: one based on
the location of the workplace, and the other on residence. Our preferred measure here
is workplace-based, although we test both measures to assess whether significant
differences occur. Again, we look to a year-on-year decline in in employment
numbers as a measure of economic decline in the territory concerned, partly to avoid
short-term fluctuations and partly for reasons of data availability.
The study examines the correlation between these two measures to examine whether
the two indicators may lag or lead each other in a consistent manner. At present,
however, we consider employment as our prime indicator of economic activity, owing
to the significance of this to residents within the territories concerned. We argue that
a territory that maintained levels of GDP but with rapidly declining levels of
employment is unlikely to be considered to be resilient by the local population.
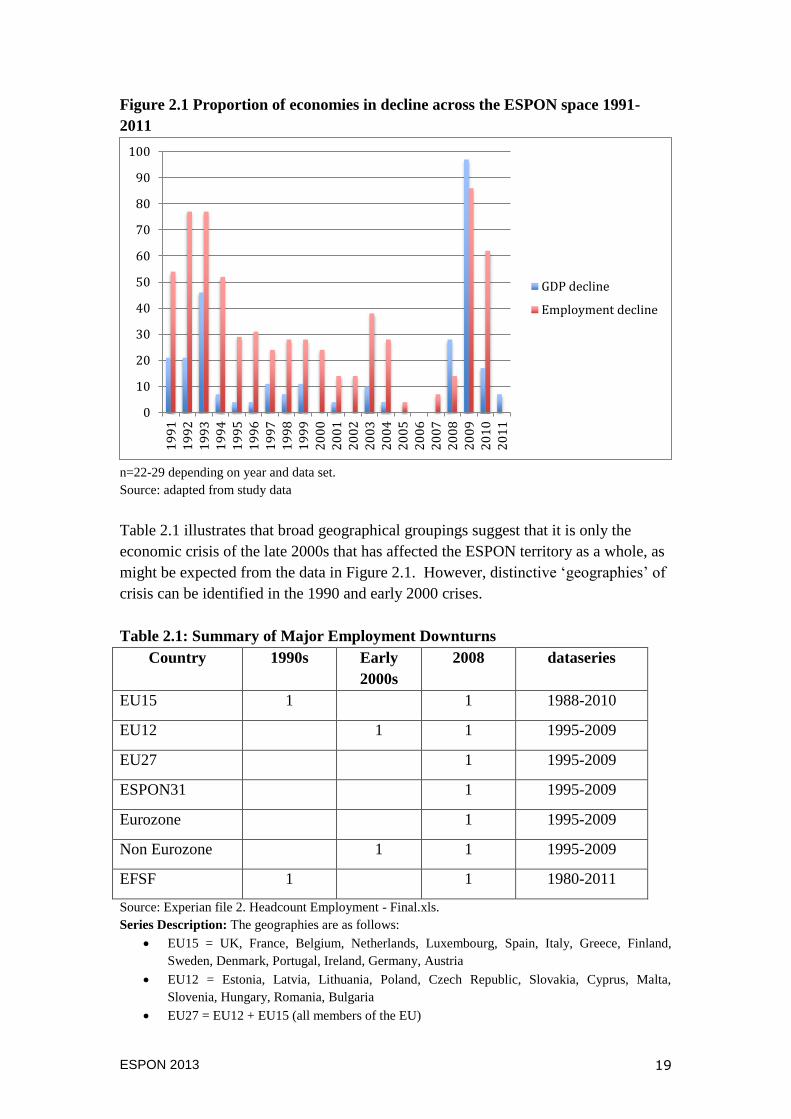
As Figure 2.1 illustrates, across the EU there is only one year since 1990 when no
national economy has experienced a decline in levels of gross employment. There is
less volatility in the number of economies experiencing a year-on-year decline in
GDP, but, even here, there have only been 4 years when no economy has experienced
a decline.
From Figure 2.1, certain patterns can be discerned and it appears that there are two
European-wide downturns within the period 1990-2012, one around the period 1992-
93 and the other starting around 2008-09. For the purposes of this study’s terms of
reference these are regarded as ‘economic crises’, with the latter representing the ‘last
crisis’. In addition there have two other identifiable periods of downturn affecting an
important proportion of national economies: one around 1997-99 and the other around
2003.
ESPON 2013 19
Figure 2.1 Proportion of economies in decline across the ESPON space 1991-
2011
n=22-29 depending on year and data set.
Source: adapted from study data
Table 2.1 illustrates that broad geographical groupings suggest that it is only the
economic crisis of the late 2000s that has affected the ESPON territory as a whole, as
might be expected from the data in Figure 2.1. However, distinctive ‘geographies’ of
crisis can be identified in the 1990 and early 2000 crises.
Table 2.1: Summary of Major Employment Downturns
Country 1990s Early
2000s
2008 dataseries
EU15 1 1 1988-2010
EU12 1 1 1995-2009
EU27 1 1995-2009
ESPON31 1 1995-2009
Eurozone 1 1995-2009
Non Eurozone 1 1 1995-2009
EFSF 1 1 1980-2011
Source: Experian file 2. Headcount Employment - Final.xls.
Series Description: The geographies are as follows:
EU15 = UK, France, Belgium, Netherlands, Luxembourg, Spain, Italy, Greece, Finland,
Sweden, Denmark, Portugal, Ireland, Germany, Austria
EU12 = Estonia, Latvia, Lithuania, Poland, Czech Republic, Slovakia, Cyprus, Malta,
Slovenia, Hungary, Romania, Bulgaria
EU27 = EU12 + EU15 (all members of the EU)
0
10
20
30
40
50
60
70
80
90
100
19
91
19
92
1
99
3
19
94
19
95
19
96
19
97
1
99
8
19
99
20
00
20
01
2
00
2
20
03
2
00
4
20
05
20
06
2
00
7
20
08
20
09
20
10
20
11
GDP decline
Employment decline

ESPON 2013 20
ESPON 31 = EU27 plus Norway, Switzerland, Iceland, Lichtenstein
Eurozone = Germany, Belgium, Netherlands, Luxembourg, Austria, France, Spain, Portugal,
Italy, Greece, Ireland, Cyprus, Malta, Slovenia, Finland, Slovakia (as Estonia joined in 2011
we are going to consider them as non-Eurozone for the purposes of this analysis).
non-Eurozone = EU27 minus Eurozone
EFSF = Greece, Ireland, Portugal, Spain (European Financial Stability Facility).
Extending this analysis to individual countries and NUTS2 regions suggests that the
effects of each crisis was not evenly distributed within countries, some regions did not
enter into decline (were resilient) and some declined less than the national average
(were relatively resilient). This is illustrated in Table 2.2, where the total number of
regions is identified by country in the first column, the denominator of each fraction is
the number of each regions that experienced a decline in overall employment and the
numerator is the number of regions that declined at a rate lower than the national
average.
Table 2.2: Summary of NUTS2 Employment Change Major Recessions
Country (X) 1990s Early
2000s
2008 Dataseries
Austria (9) 0/7 4/8 1988-2011
Belgium (11) 2/8 1/7 4/9 1980-2010
Bulgaria (6) 2/6 2/6 1996-2010
Czech R. (8) 3/8 0/7 2/7 1993-2010
Croatia (3) 1/3 2000-2011
Denmark (5) 1 2/5 2/5 1993-2011
Finland (5) 3/5 4/5 1980-2011
France (22) 11/22 6/22 1980-2011
Germany (39) 21/38 19/39 0/26 1991-2011
Greece (13) 2/13 7/13 1988-2011
Hungary (7) 3/7 1/6 2/7 1992-2011
Ireland (2) 1/2 1995-2011
Italy (21) 9/21 7/20 1982-2011
Netherlands (12) 6/11 5/12 1987-2011
Norway (7) 1/7 1 1990-2007
Poland (16) 6/16 1995-2011
Portugal (7) 4/7 1/6 2/7 1988-2011
Romania (8) 5/8 1/7 0/7 1985-2011

ESPON 2013 21
Slovakia (4) 2/4 0/3 1/4 1995-2011
Slovenia (2) 1/2 0/1 1/2 1995-2011
Spain (19) 7/19 10/19 1980-2011
Sweden (8) 3/8 4/8 2/8 1985-2011
Switzerland (7) 2/4 1995-2011
UK (37) 17/37 9/37 1982-2011
Source: Experian file 2. Headcount Employment - Final.xls.
Note: where X = total number of NUTS 2 regions. An empty cell indicates the national aggregate
employment did not experience a recession. The fraction shows how many of the regions experiencing
recession are resilient (so had a sensitivity index less than 1 which indicates the region had a smaller
percentage decrease in employment than national employment over that recession).
2.2 The territorial impact of the last economic crisis
2.2.1 Timeline to crisis
For many, the trigger for the last economic crisis was the ‘credit crunch’ that emerged
in the latter part of 2007, although this had its own origins in multiple events of the
preceding decade. As investors became wary of the exposure of banks to sub-prime
mortgages so levels of interbank lending dried up leading to an increase in the
interbank lending rates and precipitating the collapse of several major financial
institutions, and led to significant levels of intervention by national governments and
international institutions to secure the future of many others.
The tightening of the credit markets did not only impact on the financial institutions
but also on the availability of finance for domestic producers and led the World Bank
to predict that global economic growth would slow in 2008. However, the World
Bank also argued that the "resilience" of developing countries would cushion the
slowdown. As economic conditions within the European economy tightened, and
concerns for future income levels rose, demand for products also fell.
The final element to the crisis has been the fear of a sovereign debt crisis across large
parts of the European economy. This has arisen through two principal causes, firstly,
where the private debts emanating from the property-led credit crisis have been
transferred to the public sector, and, secondly, where public expenditure commitments
have raised fears of the ability of these governments to service levels of debt,
particularly in the face of falling fiscal receipts and increasing social obligations.
This has led to increases in the interest rates being charged for public debt and
significant reductions in public sector expenditure in order to rebalance public
finances, further exacerbating the economic crisis in some parts of the European
territory.
ESPON 2013 22
One of the crucial factors underpinning the economic crisis of 2007/2008 was the
interconnection of the global financial markets. Whilst the sub-prime mortgage crisis
was initiated in the US, the repercussions were felt rapidly throughout the whole
financial system, owing both to the exposure of non-US banks to sub-prime mortgage
risks, either due to their ownership of US subsidiaries or to their ownership of US
mortgage backed assets/liabilities, and to the fear of unknown levels of exposure to
this risk within banking portfolios. As the crisis spread and other economies ran into
their own debt-led crises so the effects of these were felt in non-domestic economies.
It is, for example, estimated that around a fifth of the funds invested by the UK
Government in the Royal Bank of Scotland and Lloyds Bank were transferred to
subsidiaries operating in Ireland2.
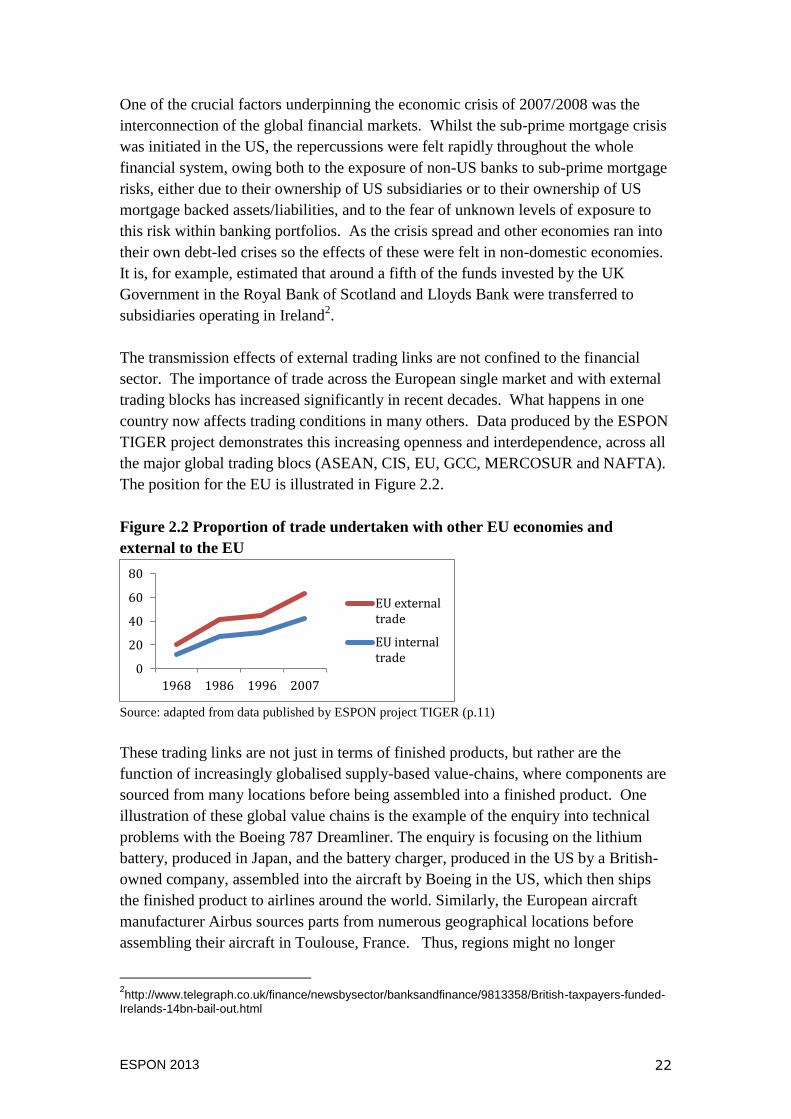
The transmission effects of external trading links are not confined to the financial
sector. The importance of trade across the European single market and with external
trading blocks has increased significantly in recent decades. What happens in one
country now affects trading conditions in many others. Data produced by the ESPON
TIGER project demonstrates this increasing openness and interdependence, across all
the major global trading blocs (ASEAN, CIS, EU, GCC, MERCOSUR and NAFTA).
The position for the EU is illustrated in Figure 2.2.
Figure 2.2 Proportion of trade undertaken with other EU economies and
external to the EU
Source: adapted from data published by ESPON project TIGER (p.11)
These trading links are not just in terms of finished products, but rather are the
function of increasingly globalised supply-based value-chains, where components are
sourced from many locations before being assembled into a finished product. One
illustration of these global value chains is the example of the enquiry into technical
problems with the Boeing 787 Dreamliner. The enquiry is focusing on the lithium
battery, produced in Japan, and the battery charger, produced in the US by a British-
owned company, assembled into the aircraft by Boeing in the US, which then ships
the finished product to airlines around the world. Similarly, the European aircraft
manufacturer Airbus sources parts from numerous geographical locations before
assembling their aircraft in Toulouse, France. Thus, regions might no longer
2http://www.telegraph.co.uk/finance/newsbysector/banksandfinance/9813358/British-taxpayers-funded-
Irelands-14bn-bail-out.html
0
20
40
60
80
1968 1986 1996 2007
EU external trade
EU internal trade

ESPON 2013 23
specialise in an industry but rather in a Key Enabling Technology (KETs), which can
be incorporated into a variety of finished products in a variety of export locations.
2.2.2 Impact on economic output
The economic crisis did not begin in all regions, or national economies, in a single
year. Economic decline was first experienced in NUTS 2 regions in 2007 in
Denmark, France and Finland (Figure 3.3). By 2008 this initial geography had
expanded to cover regions in 16 countries. Analysis by Cambridge Econometrics
(Figure 2.3) highlights that following a period of uniform growth in the early years of
the century, the period since the crisis has shown a marked divergence in
performance, with only 6 Member States achieving pre-crisis growth rates (Austria,
Belgium, Germany, Poland, Slovakia and Sweden). This is an indication of the
‘hysteresis’ referred to by Martin (2010) whereby economies may recover from an
economic decline but may not renew their pre-crisis growth rates.
Figure 2.3 GDP change in EU economies
Source: Reproduced by permission of Cambridge Econometrics (2013).
By 2009, the crisis was endemic and affected all economies across the ESPON
territory to some extent. Of the 21 countries for which comparable GDP figures were
available at the time of analysis, only four contained NUTS 2 regions which did not
experience economic decline in 2009. These were: the UK (North Eastern Scotland),
Sweden (Stockholm), the Slovak Republic (Bratislavsky Kraj) and, most
significantly, Poland (where 9 out of 15 regions still recorded GDP growth). In short,
of the 226 NUTS 2 regions for which data is currently available, just 12 had positive
economic growth between 2008 and 2009.

ESPON 2013 24
Figure 2.4 Proportion of NUTS 2 regions experiencing decline in GDP
Source: adapted from study data. Data not available for BU, RO, CH, NO, HU
National economic output data can be skewed by the over or under performance of a
particular regional economy. For the purposes of this study the following data is
based on the aggregate performance of each NUTS 2 region within a national
economy. At a national level, Poland was the only economy to record positive
economic growth in 2009. The economies that recorded the smallest fall in economic
growth were the small island economies of Malta and Cyprus. At the other extreme,
it was the small Baltic economies of Latvia, Lithuania and Estonia that recorded the
most extreme falls in output levels, as measured by GDP. The north Scandinavian
economies of Denmark and Sweden also registered strong levels of decline.
GDP data for 2010 was not available for most economies at the time of analysis. This
will be further developed in the later stages of this study. Where data is currently
available for 2010 most economies have recovered and recorded positive growth rates
(Figure 3.4). The exception to this is Latvia. However, those economies that are
supported by the European Financial Stability Facility and the European Stability
Mechanism are not well represented in this data and so no strong conclusions can be
drawn. This remains an area to be explored further in the next phase of this study.
0 20 40 60 80 100
Denmark
Ireland
Latvia
Estonia
UK
Italy
France
Finland
Portugal
Greece
Sweden
Germany
Czech Republic
Austria
Belgium
Netherlands
2007
2008

ESPON 2013 25
Figure 2.5 Average GDP growth across NUTS 2 regions (% change on previous
year)
Source: adapted from NUTS 2 data tables
At a regional level we have been able to access data which covers the start of the
economic crisis. Initial analysis of this data demonstrates between 2007 and 2009,
broadly the onset of the economic crisis, most regions experienced a fall in GDP.
Regions with the greatest decline in GDP were mainly, but not exclusively, to be
found in the Baltic States, Finland, UK and Italy (Map 2.1, see Annex A). In contrast
those few regions which recorded positive GDP growth (or only marginal decline)
were primarily located in Poland. There appears to be a strong national dimension to
regional performance, but this remains to be explored.
2.2.3 Impact on employment
At a national level, most European economies have experienced a decline in
employment alongside the decline in economic output. With more recent data
available for employment levels we are able to also identify the scale and duration of
the adverse impacts of the economic crisis more clearly.
As with economic output, the impacts of the 2008 financial crash began to resonate
across European economies in 2009, although Ireland, Lithuania and Spain all
-20 -15 -10 -5 0 5
Poland
Cyprus
Malta
Belgium
Portugal
France
Spain
Netherlands
Austria
UK
Germany
Italy
Slovak Republic
Czech Republic
Luxembourg
Denmark
Sweden
Slovenia
Estonia
Lithuania
Latvia
2009
2010

ESPON 2013 26
recorded falls in overall levels of employment in 2008 (Table 2.3). Unusually,
Hungary entered into a period of employment decline even prior to this, in 2007.
The average duration of the crisis has been two years (broadly 2009-2011) but six
economies remain in a situation of employment decline in 2011 (the date of latest data
availability). These economies are all experiencing the most significant effects of the
crisis, and it is likely that economies for which comparable data is not available in
2010 and 2011 (identified as na in Table 2.3) may also be in a similar situation. Three
economies have avoided decline in employment at a national level.
Table 2.3 Start of employment downturn and duration across national
economies
Year
decline
starts
Year
growth
starts
Duration
(years)
Ireland 2008
4
Spain 2008
4
Denmark 2009
3
Finland 2009
3
Hungary 2007 2010 3
Slovenia 2009
3
Bulgaria 2009
3
Italy 2009 2011 2
Netherlands 2009 2011 2
United Kingdom 2009 2011 2
Czech Republic 2009 2011 2
Slovakia 2009 2011 2
Latvia 2009 2011 2
Estonia 2009 2011 2
Romania 2009 2011 2
Norway 2009 2011 2
Austria 2009 2010 1
Belgium 2009 2010 1
Germany 2009 2010 1
France 2009 2010 1
Sweden 2009 2010 1
Cyprus 2009 2010 1
Luxembourg
0
Poland
0
Switzerland
0
Greece 2009 na na
Portugal 2009 na na
Lithuania 2008 na na
Malta na na na

ESPON 2013 27
Source; adapted from study data
Examination of the scale of the change in headline employment starkly illustrates the
significant falls which have occurred in the Baltic economies of Latvia, Lithuania and
Estonia, alongside Ireland Bulgaria and Spain (Figure 2.6). In contrast, modest
employment gains have been recorded in Poland, Malta, Luxembourg and, more
substantially, Switzerland. Comparable data is not yet available for Greece or
Portugal.
Figure 2.6 Employment change during crisis (%)
Source: adapted from study data
Coverage of data for levels of employment is more comprehensive than GDP.
Analysis of available data for NUTS 2 regions between 2007 and 2010 (broadly the
breadth of the crisis for most economies) illustrates some clear patterns (Map 2.2,
Annex A). Again, national patterns are significant. Employment effects of the
economic crisis have been greatest in Spain, Ireland, Portugal, the Baltic States and
Bulgaria. The employment effects have been least in Central Europe and Poland.
Analysis of the data since the peak of the crisis, illustrates strongly where the
employment effects of the crisis are ongoing, and which areas are recovering most
strongly (Map 2.3, Annex A). The rebound has been strongest in the Scandinavian
and Baltic economies and parts of Central Europe and weakest in more peripheral
economies, particularly Ireland, Spain, Portugal and South-eastern areas of Europe
including Greece and Bulgaria. In these areas employment decline is still occurring.
2.2.4 Perceptions of crisis
One of the under-reported elements of the economic crisis is individuals’ perceptions
of the economic climate they face. These perceptions can have an important
influence on individual and household consumption patterns, as people make
decisions on what they anticipate the duration and severity of an economic downturn

ESPON 2013 28
may be. Qualitative data can also provide insights into the effects of the crisis on the
incomes available to households.
Although data is not available at a regional (NUTS 2) scale across the ESPON
territory, Eurobarometer has undertaken a series of valuable surveys at a national
level across the EU. We report on some of these results here, with further material set
out in Annex B.
The onset of the crisis can be starkly seen in Figure 2.7. Taken from the Standard
Eurobarometer 78 (Autumn 2012), it clearly illustrates the gradual increase in public
confidence in the national economies of the EU from Autumn 2004 until a sudden
reversal of confidence in 2007. The peak of the public’s negative perceptions of the
EU economy was reached in Spring 2009, although the gap between those who feel
the current situation is good and those who feel it is bad has remained around 40%
since Autumn 2010.
Figure 2.7 Public perceptions of their national economy
Source: Eurobarometer (2012) Standard Eurobarometer 78 (Autumn 2012) p. 6
Looking forwards from the current time, most citizens of the EU believe the worst of
the crisis remains ahead of us. This is particularly the case in Spain, Greece, Portugal
and Cyprus, but also includes citizens of Sweden, Belgium and Luxembourg (Figure
2.8). Only in seven countries do most citizens believe that the worst is now past, and
even here it is, on the whole, a fairly slim majority.

ESPON 2013 29
Figure 2.8 Proportion of residents who believe worst of crisis is still to come (%)
Source: adapted from Standard Eurobarometer 78 (2012 Autumn)
2.3 Towards a typology of resilient regions
In considering the resilience of regions to economic shocks we are guided by the
conceptual work of Martin (2012) who identified four components to resilience:
resistance, recovery, renewal and re-orientation. In our work we consider resilience
to be comprised of the first three of these, namely:
Resistance – the ability to resist (or withstand) an economic shock
Recovery – the ability to recover (or bounce back) from an economic shock
Renewal- the ability to renew pre-shock growth rates
The notion of re-orientation is, we believe, more closely attuned to the ability of an
economy to adapt and so facilitate one of these three states.
The response of an economy to an economic shock can be broken down into various
components. These are illustrated in Figure 2.9 and 2.10. In Figure 2.9 we see the
stylized growth path of the economy over a period of time (typically a year) and
where e is a measure of the size of the economy (typically GDP or employment). The
scale of economic activity at any particular point in time is represented by the curve
V. The peak in economic activity occurs at P1, which is the point that the economy
reacts to the economic shock with a subsequent economic decline to a lowest point of
activity (T) before economic recovery begins culminating in a second peak in activity
at P2, followed by a subsequent second decline in economic activity.
0
50
100
SE
SK
BE
C
Y
FR
R
O
CZ
L
U
DE
D
K
PL
F
I SI
€ A
RE
A
LT
E
U2
7
ES
EE
N
L
EL
P
T
AT
N
ON€
AR
EA
H
U
LV
IT
B
G
IE
MT
U
K

ESPON 2013 30
Figure 2.9 Stylised Recessionary event
Figure 2.10 then illustrates the various variables involved in the response of the
economy to the economic shock. These can be considered as follows:
the amount by which economic activity changes between the peak of activity
(P1) the subsequent trough (T) and the following peak (P2). This is expressed
as a proportion of total value and measured as H1 and H2.
The time that it takes for the economy to reach the trough of activity and to
regain a new peak in activity (D1 and D2, with an overall duration of D).
The rate of economic growth prior to the crisis (Sa), post crisis (S1) and post
trough (S2).
Figure 2.10 Crisis response components
Four dimensions of regional responses to crisis tend to be of interest to policymakers,
residents and to have relevance to our notions of resilience, namely:

ESPON 2013 31
The scale of the impact (Resistance – measured by H1)
The duration of the impact (Recovery – measured by duration A to C1).
The comparative performance of the economy (measured by ß sensitivity
which is calculated as S1region divided by S1national)
The return to pre-crisis growth rates (Renewal – measured by S2/Sa)
It is from these elements that ECR2 will begin to build its typology of regional
resilience to the last economic crisis. In turn this will then be used to identify the
characteristics of regions that can explain the differences observed. In practice, we
expect to develop a typology that involves the following themes (illustrated in Figure
2.11):
A. Continued growth (highly resilient)
B. Reduced but non-negative growth (positive resilience)
C. Small negative growth rates before recovery (resilient)
D. High negative growth rates before recovery (rebound resilience)
E. Negative growth rates no recovery (non-resilient)
Figure 2.11 Stylised models of resilience response

ESPON 2013 32
3. Identifying the components of economic resilience
3.1 The conceptual foundations
The TPG has continued to develop the conceptual basis for the study and to refine the
methodology for analyzing the economic resilience of European regions. The
following section builds on the work developed for and presented in the Inception
Report, particularly the comprehensive review of available literatures. It sets out the
approach being taken to identifying what accounts for the patterns of economic
resilience as set out in Section 2, utilising both quantitative analysis and qualitative
assessments.
Most people have an intuitive notion of resilience - the capacity to sustain a shock,
recover, and continue to function and, more generally, cope with change (Walker et
al, 2004). In particular, the notion of resilience is being utilised by an increasing
number of authors keen to understand the dynamics of local and regional economies
and particularly how they deal with economic shocks and recessionary crises (see, for
example, Pendall et al, 2010; Hill et al, 2011).
One of the challenges of course is to assess what the counterfactual situation might
have been. An economy that has witnessed a significant slump may still be resilient,
in that it weathered a shock more positively than it might otherwise have done so. In
some ways the potential resilience of an economy may be a philosophical question,
but it is no less valid for that, and for policy makers it is clearly extremely pertinent.
Our approach is based upon distinguishing between three elements of economic
resilience. The first is the notion of resilience as a measure of the performance (or
outcome) of an economy. This underpins our consideration of the first hypothesis for
this study and our typology development (reported above in Section 2 and based
around business cycle analysis). It is the basis for much of the developing literature
on regional economic resilience, where a broad distinction can be made between two
different conceptions of the term (Pendall et al, 2010).
The first is based on the engineering conception of resilience which focuses on
the resistance of a system to shocks and the speed of its return or ‘bounce-
back’ to a pre-shock state or equilibrium. The faster the system returns to
equilibrium, the more resilient it is (Holling, 1996). This is deployed by Hill et
al (2011) in a study of regional economic resilience in the US which they
define as the ability of a regional or metropolitan economy to maintain or
return to a pre-existing state in the presence of some kind of externally
generated shock. Our analysis of the territorial impact of the last economic
crisis builds on this conceptualisation of resilience.

ESPON 2013 33
The second is based on an adaptive notion of resilience which derives from the
theory of complex adaptive systems. These are systems which are
characterised by complex non-linear dynamics and an adaptive capacity that
enables them to re-arrange their internal structure spontaneously whether in
response to an external shock or to some internal or ‘self-organised criticality’
(Martin and Sunley, 2007). Regional economic resilience from this
perspective is thus conceived as a multi-dimensional property embracing not
only recovery, but also resistance, or the ability of regions to resist disruptive
shocks in the first place; re-orientation, or the extent to which the region
adapts its economic structure; and finally, renewal, or the degree to which the
region resumes the growth path that characterised its economy prior to the
shock (Martin, 2012).
The second element that we explore is what characteristics influence the levels of
resilience to economic crisis observed across regions. This consideration of the
capacity for resilience lies at the heart of the second hypothesis of the study. This
informs our thinking in looking for the determinants, or components of, resilience.
This is also an area where our case study work provides an opportunity for achieving
greater depth and insight than has perhaps been available to date in much of the
literature. Again there are two key distinctions to be made here.
The first relates to the innate capacity of a region. This refers to the structural
or systemic conditions which influence the manner in which the regional
economy responds to an economic shock. Such characteristics may include
features such as economic structure, demographic structure, settlement
structure or governance structures. They tend to be institutionally embedded
and slow to change.
The second relates to the adaptive capacity of a region. This takes a more
‘agency’-based approach, emphasising the importance of the choices made by
businesses, households, individuals and organisations, such as governments.
A dimension that lay at the heart of our discussion of complex adaptive
systems reported in the Inception Report. This agency perspective also marks
our work out from most current writings on economic resilience, which tend to
focus on the role of systems and structures (see Annex C). Consideration of
the adaptive capacity of a region places an emphasis on the ability of agents to
prepare, to react, to respond and to learn.
Finally, the third element that we explore in our work is the notion of resilience as
agenda. This highlights the normative and political dimensions of resilience.
Resilient outcomes (e.g. persistent poverty cycles) may not always be desirable,
whilst non-resilient outcomes (such as lower growth rates) may depending upon the

ESPON 2013 34
perceptions of the agents involved and their overall goals and objectives (e.g. Hill et
al, 2011; Shaw, 2012).
Combining the literatures noted above reveals that adaptive resilience is shaped and
built by two broad sets of determinants.
The first of these can be characterised as relating to the regional economic
system and its structure, or its unique and inherent ‘DNA’. These
characteristics constitute the defining features of a regional economy, and are
shaped by its historical, geographical and economic context. As such they are
relatively slow changing but play a key role in shaping resilience. These
include: its industrial structure and diversity; market size; endowments in
natural (place) resources; endowments in human (people) resources; openness
and trade orientation (local and global); degree of spare capacity; its national
macroeconomy; its governance structures (centralised or decentralised etc); its
modularity, networks and connectivity (between key actors).
The second set of determinants of resilience is the actions or agency of
individual and collective agents in the regional economy. These are the
behavioural responses or the actions taken by different actors in response to
the shock or crisis and thus change more quickly. These can be separated into
three different kinds of response – proactive measures (actions taken in
advance of or in anticipation of the crisis); reactive responses (measures taken
during the crisis to alleviate, help adapt, cope, or adjust); and transformative
behaviour (actions to change the path of economy, encourage novelty /
innovation, adapt structures or the region’s ‘DNA’ or long-term behaviours
and growth paths). For each group of agents, different responses can be
identified that might fit under each of these categories (e.g. the responses of
policy actors can be proactive – e.g. monitoring; reactive – e.g. spending on
key sectors, buffering; and / or transformative e.g. investment in greening,
new platforms for innovation, learning, diversification etc). All of these
responses are shaped by the region’s unique (place and people) context and
the capacity of actors to see and process information (and thus act upon it) is
highly variable.
The unique mix of these capabilities within each region and their interaction with the
wider economic system will determine the resilience of the regional economy.
3.2 Identifying components of economic resilience
Based on an assessment of the available literature, coupled with the interim findings
of our case study research, we have identified a variety of characteristics that have
been associated with greater or lesser levels of economic resilience. Much of this
literature was set out in the Inception Report for this project. However, even the most

ESPON 2013 35
cursory reading of the literature illustrates that there is little comparative evidence
available as to the significance of different characteristics across varying regional and
national contexts. It is this gap that we are seeking to fill with the current work.
To do so we have identified a limited suite of indicators that might be regarded as
representative of the characteristics concerned. These are based on those identified in
the literature referred to above. In doing so we have also been cognizant of the
availability of data across the ESPON territory, with preference given to those
datasets available at a NUTS2 geography as a minimum. In practice this has limited
our indicator set in only a few cases, most notably around the question of levels of
entrepreneurship.
Using these selected indicators we intend to test their power of explanation for the
Resilience outcomes identified for each region. This will provide an important insight
for policy-makers, and researchers, as to the value of these characteristics in
determining economic resilience, either individually or in combination.
There are some acknowledged methodological challenges to the work. Not least the
risk that some indicators might be closely correlated to our measures of resilience
itself. Unemployment could be one example of this. A second challenge is the
limited availability of robust comparative timeseries data for many of the indicators
selected. A third is the variable dates at which regions have been affected by the
economic crisis (broadly specified). This means that we have to take judgements as
to the validity of the datepoint-data available to the study in relation to the geography
of the crisis itself. Our final challenge has been the unavailability of some key data
sets at a level below NUTS0 and, in some limited cases, the difficulty of accessing
other data in a quantitative format.
3.3 Potential influencers of resilience
Analysis of the literature and the interim findings of the case study research for this
project suggests that the following characteristics have the potential to influence
regional economic resilience:
That prevailing endowments of physical capital and human capital can all
positively influence levels of resilience
That the prevailing condition of the economy is influential, with stronger
economies more resilient than those that are weaker,
That the sectoral structure of an economy can play an important role in levels
of economic resilience, and that more diverse economies tend to exhibit
greater levels of resilience
That access to markets, and the size of these markets can positively affect the
resilience of an economy

ESPON 2013 36
That levels of entrepreneurship and innovation are positively associated with
economic resilience
That levels of social capital, informal institutions and network capital exert a
positive influence on levels of economic resilience
That governmental structures can influence levels of economic resilience, with
greater levels of fiscal or legislative autonomy supporting economic resilience
at a sub-national level
That the presence of a well-educated and skilled labour force is an important
influence on regional economic resilience, together with good school-leaver
qualifications
That the flexibility of labour markets can exert a significant influence on the
economic resilience of regions.
That higher levels of labour market participation rates is a feature of more
resilient regional economies
That resilient regions have lower levels of unemployment
That housing affordability can be a feature of resilient regions
That the presence of a strong critical mass of urban-based activities can be
identified as a significant influence on the resilience of particular areas
3.4 Existing measures of economic resilience
Existing indexes of resilience (see Annex D) identify various components of
resilience, and use a variety of indicators. One reason for this is the differential scale
at which the analysis is applied, with some taking a national perspective and others a
sub-national approach. Table 3.1 below identifies the different components. There is
some overlap in the identified components, with some use of similar individual
indictors, but overall there is more difference than similarity. Briguglio highlights
national traits, BRR takes a capacities approach, whilst Experian contributes the
notion of ‘place’. Consultancies such as EKOSGEN-EDAW and ECORYS in the UK
are also beginning to develop models of Resilience. For ECORYS this is about the
‘capacity of the local economy to adapt to a rebalancing of economic activity’,
measured by levels of enterprise, private-sector jobs in high value and knowledge
intensive industries and a strong skills base. For EKOSGEN-EDAW it is related to
shock-counteraction and shock-absorption. Interestingly, EKOSGEN-EDAW
introduces the notion of inter-connectivity and integration with surrounding areas.
Table 3.1 Indexes of Resilience
Briguglio et al
(World)
BRR (US) Experian
(UK)
EKOSGEN-
EDAW (UK)
ECORYS
(UK)
Macroeconomic
stability
Microeconomic
efficiency

ESPON 2013 37
Good Governance
Social development Socio-
demographic
capacity
People Workforce and
Labour market
Skills
Community
connectivity
capacity
Community
Regional
economic
capacity
Business Business and
Enterprise
Enterprise
and
Knowledge
intensive
businesses
Place
Scale and
proximity
Assets and
Infrastructure
In examining the components which might influence regional economic resilience we
have chosen to adapt the approach developed by Experian and focused on Business,
People, Community and Place. This reflects the conceptual research undertaken for
this project and acknowledges the roles of these factors as key sources, or agents, of
adaptive capacity within an economy. We have also sought to incorporate thinking
from the other approaches. One consideration for this work is the role that national
characteristics (such as macro-economic stability and micro-economic efficiency)
might play in differentiating regional economic resilience across the EU, another is
the significance of scale and proximity.
3.4 The selected indicators
Through a combination of:
Examination of existing conceptual literatures
Analysis of the preliminary results of the case studies
Reflections on existing indexes of resilience
Review of available data sets
ECR2 has identified a list of indicators with available data through which to explore
the economic resilience of regions to the economic crisis. These are summarized in
Table 3.2 and are grouped under the headings of:
Business
People
Community
Place

ESPON 2013 38
The principle analysis will be undertaken using those indicators which are available at
the regional scales (R). In addition, some indicators that are only available at the
national scale (N) may also be considered. Those indicators for which only
qualitative information (Q) is currently available or where availability is highly
variable in terms of time or geography (V) are not to be considered further at present.
Some indicators are not available as far as this study can discern (na) and one remains
to be ascertained (TBA). Annex E contains a fuller statement of the indicators to be
explored.
Table 3.2 Summary of Indicators of Resilience
Indicator Source Lowest
unit
time Use
Business Sectoral mix
(broad aggregate)
Experian data
set
ESPON
typology
2 S/T R
Number of enterprises Experian data
set
0
P N
Enterprise
discontinuation
GEM 0 P V
Size of enterprises Experian data
set
P N
Level of self-
employment
Experian data
set
0 S N
Investment by
businesses
Experian data
set
2 S R
Research/Innovation
by firms/Research
institutes
ESPON -
SMART Pillar
EU RIM
ESPON KIT
2 P/T R
Physical Capital Derbyshire et al
calculations
2 P R
People Participation rate Experian data
set
3 S R
Low work households ESPON
Inclusive Pillar
2 T R
Employment rate Experian data
set
3 S R
Household disposable
income
Experian data
set
2 S R
Household savings na

ESPON 2013 39
Household bill
payments
Eurobarometer 0 P N
Hours worked Experian data
set
0 S R
Unemployment rate Experian data
set
3 S R
Flexibility of labour
market
na
Skills of resident
population
Experian data
set
ESPON data
2
S
P
R
Beliefs/Perceptions of
population
Eurobarometer 0 P N
Community Governance structure ESPON
TANGO project
Marks et al
Index of
Regional
Authority
2 P R
Degree of fiscal
autonomy
Eurostat
Marks et al
Index of
Regional
Authority
0
2
P
P
R
Territorial
management
(planning)
Qualitative Q
Degree of social
capital
Qualitative Q
Entrepreneurial
interests
GEM (national
only)
0 P V
Community-based
(informal) responses
Qualitative Q
Level of social
enterprise
National only 0 P V
Innovation
Confidence
Point survey,
limited
coverage
0 P V
Old-age dependency Eurostat 2 S R
Business birth rate
(incl. in ent int)
Experian data
set
0 P N
Income inequality TBA

ESPON 2013 40
Place Level of migration Experian data
set
2 T R
Openness of economy
(ie level of external
trade – non domestic,
non-EU)
ESPON TIGER 2 T R
Territorial
characteristics –
degree of
agglomeration, peri-
urban development,
rural
Eurostat 2/3 T R
Presence of natural
capital (natural
resources, landscape
quality)
ESPON Atlas 2 T R
Availability of spare
capacity
na
Accessibility of area
(different transport
modes)
ESPON Atlas 2 T R
Property market
features
Qualitative Q
Time: S=series, P=point, T=typology

ESPON 2013 41
4 Territorial resilience as a policy concept
Our third hypothesis relates to the potential for policy-led actions, at different
territorial scales, to influence levels of regional economic resilience. Theoretically,
policy-makers can be powerful actors in promoting resilience through their role as
facilitators, influencers, agenda-setters, and direct intervention (see Section 3). Their
role in practice remains to be explored.
Much of the evidence for the role of policy-makers is being gathered through our case
study activities, which, at the time of the Interim Report, are insufficiently developed
to report on this element. However, a review of policy agendas at the European levels
and at a sub-national level in one Member State illustrates how the question of
managing resilience is rising in policy discourse, and strengthens our interest in the
question of resilience as ‘agenda’. From initial work undertaken through this study,
paths of potential actions available to policy-makers are already emerging.
4.1 European policy agendas
At the EU level the recent economic crisis is regarded as an opportunity for change
rather than a one-off hit that allows the resumption of business as usual. Thus the
emphasis is upon encouraging sustainable recovery with the Europe 2020 strategy
document explicitly stating ‘our exit from the crisis must be the point of entry into a
new economy’ (p. 10). More specifically, the Territorial Agenda 2020 states that the
crisis ‘provides an opportunity for a transition towards a more sustainable and
resource efficient economic structure if appropriate actions are taken’ (p. 5). At the
same time, European policy-makers are also aware that crisis induced austerity
measures are likely to present significant difficulties for some regions in terms of
finding resources to invest in appropriate innovation and regional development
policies. This creates an imperative for stronger inclusion of private sector actors and
resources in such policies and governance.
More broadly, it is also acknowledged that different regions are affected differently
by crises. Thus according to the Territorial Agenda 2020, ‘local endowments and
territorial characteristics have growing importance for regions in order to cope with
and recover from external shocks’ (p. 5). Much of the focus in terms of the objective
of sustainable growth to date has been on adaptation in relation to regions resilience
to climate change. The Commission has thus placed strong emphasis upon the use of
Cohesion policy to encourage investment in renewables, energy efficiency, risk-
prevention and investment in green infrastructure and public procurement. The
Territorial Agenda 2020 also notes that ‘regions have different opportunities to embed
adaptation and mitigation into their strategies’ (p. 6).
Across EU policy strategies, increasing emphasis is being placed on encouraging the
development of integrated, place-based policy action. This is policy which is tailored

ESPON 2013 42
to contexts; where intervention elicits and utilises local knowledge; where linkages
and interdependencies between placed are taken into account; and which is part of a
territorialised social agenda which aims at guaranteeing socially agreed standards for
particular aspects of well-being (Barca, 2009; Territorial Agenda, 2020). The logic
behind this is that cities and regions are faced with different combinations of
development problems and growth potential.
The EU’s Cohesion Policy is acknowledged to be ‘uniquely placed’ to contribute to
the EU’s sustainable growth objectives’ (Commission, 2011; p. 12). As well as
promoting its delivery through multi-level governance and public-private
partnerships, the external intervention it provides for territories may prove critical in
facilitating appropriate adaptation, changing development trajectories and thus in
building resilience. The Barca report (2009; p. 22) observes that ‘an exogenous
intervention might be needed to trigger change’. It goes on to acknowledge, however,
that such intervention must work with the grain of territorial assets and capacities –
‘the purpose is obviously not to import institutions from outside, but to provide the
pre-requisites for them to develop, to tilt the balance of costs and benefits for local
actors to start building up agency, trust and social capital, to change beliefs and to
experiment with institutions and democratic participation. As Amartya Sen (1999)
puts it, what is called for is a contribution to enhancing and guaranteeing the
substantive freedom of individuals seen as active agents of change, rather than passive
recipients of dispensed benefits’.
Cohesion policy in particular has the capability to unleash territorial potential through
integrated development strategies based on local and regional knowledge of needs,
and through building on the specific assets and factors which contribute to the
economic development of places. It this requires the encouragement and active
involvement of local actors. Territorial Agenda 2020 places particular emphasis upon
the development of strong local economies through effective use of territorial assets
and the integration of local endowments, characteristics and traditions into the global
economy. This is seen as critical ‘in strengthening local responses and reducing
vulnerability to external factors’ (p.8) – in other words for the development of
economic resilience.
This thinking clearly aligns with and has informed the conceptualisation of resilience
developed for purposes of this study. Regions are understood to be highly diverse and
evolutionary entities. Furthermore, their resilience is here conceived as a place-based
capacity shaped both by a territory’s inherited resources and structures, as well as its
people and the agency of its individuals, businesses and institutions.
4.2 Sub-national policy agendas
At a sub-national level there are signs that there is a stronger emphasis on the notion
of ‘economic resilience’ emerging. This can most readily be seen in the UK, which

ESPON 2013 43
we use as an exploratory lens for reporting here. We are exploring the comparative
emergence of the concept in other Member States and will report more fully on this in
the Draft Final Report.
Evidence for the increasing attention being paid to economic resilience can be seen
most vividly in the extent to which the term now occurs within policy documents and
strategies. This is illustrated by the inclusion of a section in “Creating Successful
Local Economies” - the national publication of the LEP Network (England’s new
structure of Local Enterprise Partnerships (LEP) responsible for local economic
development) – entitled “Economic Resilience and the Long-Term Growth
Challenge” (The LEP Network, 2012). This highlights both the emergence of this
theme and also the longer-term perspective being associated with it. In other
examples we have the New Economy Manchester (the LEP for Greater Manchester)
speaking of Building Economic Resilience across Greater Manchester, and, in its
submission to Government the proposed LEP for Cornwall and Isles of Scilly
identifying the “ingenuity, resilience and aspirations of our area”
(www.cornwall.gov.uk). Whilst there is evidence that some authorities, such as
Sheffield City Region, were beginning to consider notions of economic resilience
prior to the economic crisis in the UK, it is apparent that the crisis has provided an
impetus to sub-national policy considerations in this field.
Examining the available documentation it is apparent that, in broad terms, sub-
national policy-makers seek to influence resilience adaptive capacities in three main
ways.
First and foremost, they seek to provide leadership of the region’s resilience agenda
and through identification of resilience challenges, goals and preferred outcomes or
measures of success, can provide strategic leadership of the agendas of individual and
collective actors in the region. This is evident across the strategy documentation, as
well as the development of a new language of discourse. They also play a critical role
in mobilising knowledge of the economic environment and how it is changing, and
disseminating this knowledge and learning to other actors in the region. This depends
upon highly networked information and management systems. A number of sub-
national governments have already devised resilience action plans or strategies which
make an assessment of their risks and vulnerabilities to economic downturns and set
out ways and means by which they may take pertinent action (e.g. City of Edinburgh,
2008). In the case of Aberdeen resilience is also promoted but is conceived as an
individual trait rather than a systemic strength (Aberdeen – the smarter city, Aberdeen
City Council, 2012). The development of indexes of Resilience, or tools for
identifying levels of resilience are a strong part of this process (Yorkshire Cities, 2009
and 2011), a demand for which many consultancies respond (see for example,
ECORYS, EKOSGEN and City of Sheffield, Experian).

ESPON 2013 44
Secondly, and directly following on from the above, sub-national governments can
take action to influence the adaptive capacities of other individual and collective
actors in the region. A range of specific interventions can be identified for each
different actor or actors in the region. Thus in terms of business, for example, they
may seek to prioritise investment in growth business sectors or facilitate sectoral
diversity. In terms of people, they may invest in rapid redeployment initiatives to
support workers adaptability to changing labour market conditions (e.g. PROACT,
Wales), or provide ‘life-changing’ funds to support individual re-training or skill
enhancement. In the North East of England, Gateshead Council have introduced an
‘Economic Resilience Package’ to “alleviate the worst effects of the recession”
(Gateshead Council, 2012). In terms of community, they may invest in the
development of key multi-functional community hubs to build stronger social
networks and relationships.
Thirdly, sub-national governments also have the capacity to act on and help enhance
key structural features of the region’s economy or its unique, place-based assets or
‘capitals’. These include a place’s economic and financial capital, its social and
cultural capital, as well as its political, natural and built capital assets. For example, in
terms of social capital, sub-national governments act as unique connectors, facilitating
complex communication and co-operation between multiple agents including a
region’s firms, labour force, consumers, advocacy groups and so on, that otherwise
might not be made.
In summary therefore, sub-national governments thus have a unique and important
capacity to provide ‘institutional’ or ‘policy entrepreneurship’ that can co-ordinate,
provide strategic direction and leadership, enhance place assets and improve the
functioning of key networks in the regional economy.
But as well as understanding what sub-national policy-makers can do, it is also
important to understand when they can do it. Resilience thinking emphasises the
dynamic nature of regional economic development trajectories and policy responses.
As such, governance and policy actions in relation to resilience can be categorised
into three broad types or horizons, distinguished according to when they occur
relative to the shock or stimulus.
Anticipatory actions - that seek to build a stronger understanding of the
components of the regional economy, its existing strengths and vulnerabilities
to shocks
Reactive policies - which seek to respond to economic downturn to mitigate
the effects in a region, generally a series of shorter-term actions
Transformative actions – that seek to bolster the resilience of an economy over
the medium to long-term

ESPON 2013 45
Examples of each of these have been identified, although the precise form that they
each take varies between regions. The TPG is exploring the development of a useful
tool for sub-national actors, which might build upon the following assessment grid
(Table 4.1):
Table 4.1 Assessment Grid: Sub-national policy action for resilience
Key actions Anticipatory Responsive Transformative
Resilience agenda:
understand challenges and
vulnerabilities, set preferred
outcomes and measures of
success
Enhance adaptive capacities
(of business, people,
community)
Act on system structures,
place assets and networks/
relationships
ESPON 2013 46
5. Communication activities of the project
A number of dissemination activities have taken place within the project since the
submission of the Inception Report in July 2012.
Website and E-bulletin
Since the inception of the project, two e-bulletins have been produced, informing
project partners and their networks of the activities that have been taking place.
These can be found on the ECR2: Regional Economic Resilience website, hosted by
Cardiff University. Alongside the e-bulletins, this website is continually updated with
information from the project as well as topical details, thoughts and reading. This is
with the aim of extending the reach of the project. The website is located at:
http://cplan.subsite.cf.ac.uk/cplan/research/economic-crisis
Press reports
The project was included in the Royal Town Planning Institute Wales’ Summer 2012
edition of Cynllunio. Cynllunio is the quarterly magazine for the Wales branch of this
national representative body.
Seminars
Early in December, Cardiff University represented the ECR2:Resilience project at
ESPON's annual internal seminar is Cyprus. Hosted as part of the Cyprus Presidency
events the seminar addressed the topical theme of Territorial Development
Opportunities in Europe and its Neighbourhood to Foster Global Competitiveness.
The ECR2:Resilience project was part of the economic competitiveness theme of the
seminar and contributed to one of the two workshops organised for this.
Presentations
In mid-December, Project Partner 6 presented a paper at an Economics Research
Seminar in Lancaster University, UK. The paper dates the classical business cycle for
quarterly UK aggregate and regional employment to assess turning points in the
economic cycle.
In November 2012, the Lead partner delivered one of the Plenary session papers at the
Regional Studies Association (UK) Winter Conference entitled 'Regional Resilience:
a New Model for Territorial Development?'.
The Lead partner was asked to present at an event organised by the West Cork
Development Partnership. The event brought together almost 100 representatives of
community development organisations and local businesses from across West Cork in

ESPON 2013 47
Ireland. It provided a great forum to introduce our ESPON study on regional
economic resilience to a local audience and discuss the notion of resilience from a
local perspective.
Forthcoming
On behalf of ECR2:Resilience, the Lead Partner has been invited to deliver a key note
speech to a forthcoming Regional Studies Association conference to be held in
Ireland on 22 February 2013. With an audience of academics, practitioners and policy
makers the conference will provide a valuable platform to highlight, and discuss,
some of the emerging results of ECR2:Resilience. The conference will be held in
Cork City Hall and will also serve as the launch of the new regional strategy for South
West Ireland by the South West Regional Authority.
The Lead Partner will also be leading a workshop on ‘Planning and Resilience’ at the
annual conference of the Wales RTPI. This will reach an audience of practitioners
and sub-national policy-makers.

ESPON 2013 48
6 Towards the Draft Final Report
Key tasks
1. Amendments to Interim Report
Amend Interim Report in line with response by ESPON CU and
Sounding Board. Led by Cardiff University
May 2013
2. Finalise data collection
Identify gaps in dataseries for all key indicators and implement
strategy for overcoming these. Led by Experian plc.
End May 2013
3. Resilience Components analysis of data
Agree key characteristics and test their explanatory power as
components of observed levels of regional resilience. Led by Experian
plc and Cardiff University
End July 2013
4. Resilience Performance analysis of data
Using key datasets (employment and GDP) establish resilience of
regional economies to the economic crisis. Led by Manchester
University
End July 2013
5. Complete Case Studies
Finalise case studies, ensuring coverage of business perspectives and
Structural Fund programming. Led by individual case study partners.
End July 2013
6. Undertake wider stakeholder interviews
Complete small pattern of interviews with representatives of EC,
Member States and other informed observers. Led by Cardiff
University.
End September 2013
7. Draw up initial results paper (to inform SF programming)
Consider effects of economic crisis on Structural Fund programmes,
and response of these programmes to economic crisis. Led by Cardiff
University, supported by individual case study partners.
End August 2013
8. Analyse results
Address research questions and key hypotheses in light of results
identified. Led by Cardiff University
End September 2013
9. Draft Final Report
Complete Draft Final Report
November 2013
Draft Content of Draft Final Report
Inter alia the report is envisaged to include the following elements:
a) Main Report (max 50 pages) that includes:

ESPON 2013 49
introduction and context to the study
the key findings/analysis/diagnosis of the project bringing together the most
relevant outcomes of the case studies;
guidance for multi-level and cross-sector territorial governance (preconditions
and success factors);
policy options for future EC Cohesion Policy;
policy options for national, regional and local authorities.
b) Executive Summary (max 10 pages)
c) Scientific Report documenting the scientific work undertaken in the applied
research including elements such as:
Literature and methodology/theory used;
Typologies, concepts developed and used;
Data collected and indicators used, including tables with the exact values of
indicators;
Maps produced in support of the results, covering the territory of EU 27,
Iceland, Liechtenstein, Norway and Switzerland;
Models and other tools used or developed;
Detailed description of the case studies;
Roadmap for policy implementation and on the further research avenue to
follow.
d) Appendices to the Scientific Report including detailed results of the separate
case studies.
e) Additional material to contribute to the ESPON 2013 capitalisation and
communication strategy, including:
A slideshow explaining the assumptions, the methodology and the results of
the project
A selection of 5-10 maps suitable for the communication of project progress
and results

ESPON 2013 50
7. Emerging policy conclusions
Naturally, it is rather early in the development of this project to be drawing strong
policy conclusions. However, there are some preliminary conclusions that emerge
from the study results to date. These are worth highlighting and will be subject to
further testing as the study progresses.
Clear indications are emerging of the importance of a flexible and adaptive workforce
and labour market; of the important role innovative firms can play; of the complex
nature of entrepreneurial development in stimulating resilience; of the value of an
open and diverse economy, and of the role of expectations of the future in influencing
behaviour. The presence of a critical mass of activities also appears to be significant.
The increasing integration of economic activity across regional economies is
exacerbating the difficulties faced by local policy makers, but also suggests that the
reduction in the ‘localisation’ of economies may offer opportunities to build resilience
over the longer-term.
Evidence is also pointing to the effects of economic downturn on the long-term
prospects for economic resilience and growth. This is particularly visible in the out-
migration of young skilled labour from economies with fewer employment
opportunities. However, there is some evidence that this need not be a permanent loss
of talent and that past experience suggests that returning labour may act as a force for
future resilience. The evidence emerging from our study also suggests that net-
migration rates are a challenging indicator of resilience.
There is some evidence that public policies can make a difference to the economic
resilience of regions. These actions can be considered at three levels:
Anticipatory actions - that seek to build a stronger understanding of the
components of the local economy
Reactive policies - which seek to respond to economic downturn to mitigate
the effects in a region, generally a series of shorter-term actions
Transformative actions – that seek to bolster the resilience of an economy over
the medium to long-term
Examples of each of these have been identified, although the precise form that they
each take varies between regions. Context is also important, as similar policies
appear to have different effects in different regions. Again this is an area to be
explored in more depth in the following phases of the study. One of the clear points
emerging from the case studies though is the ability of policy-makers to learn from
the experience of past economic downturns. This ability is not evenly distributed.
A strong preliminary finding of the study is the constrained opportunities available for
significant independent action at a sub-national level. In many cases, national level
actions are more significant in determining overall levels of economic resilience.

ESPON 2013 51
This is often a function of different governance structures and the distribution of
powers and resources between different tiers of governance. Where sub-national
powers are limited this highlights the importance of place-aware policies at a national,
and supra-national, scale. This does not suggest that sub-national actions do not have
a role, rather that their effectiveness is strongly influenced by the overall national
economic context.
Finally, the TPG is beginning to consider the form that useful tools might take to be
of assistance to sub-national actors. One of the key tools is likely to take the form of
an assessment grid, assisting policy actors to assess the potential resilience of their
region. This will consider elements developed and tested in the latter stages of this
study under the categories of business, people, community and place.

ESPON 2013 52
ANNEXES

ESPON 2013 53
Annex A Mapping
Map 2.1 GDP change in European regions
Source: own calculations based on Experian data

ESPON 2013 54
Map 2.2 Employment effects of the last economic crisis
Source: own calculations based on Experian data

ESPON 2013 55
Map 2.3 Post-crisis employment recovery
Source: own calculations based on Experian data
ESPON 2013 56
Annex B Perceptions of Crisis
One of the under-reported elements of the economic crisis is individuals’ perceptions
of the economic climate they face. These perceptions can have an important
influence on individual and household consumption patterns, as people make
decisions on what they anticipate the duration and severity of an economic downturn
may be. Qualitative data can also provide insights into the effects of the crisis on the
incomes available to households. This Annex provides an introduction to those
insights.
Over the year from Spring to Autumn 2012 perceptions as to whether the employment
situation will worsen have reduced in seven economies but increased in all others,
particularly across the Eurozone (Figure B.1). The change in sentiment is particularly
marked in Sweden, given its apparent resilience to date.
The effects of the economic crisis on individuals’ perceptions of the future can be
seen in their levels of confidence of being able to retain employment. Between 2009
– 2011 there was a marked change in the proportion of citizens who were very
confident about the security of their employment (Figure B.2). The highest levels of
confidence can be found in Austria, Germany and Finland. Significant falls the
proportion of respondents expressing confidence are noticeable in a number of
countries particularly Greece and Cyprus, with increases in those feeling very secure
recorded in the Baltic States, Belgium, Hungary and Malta.

ESPON 2013 57
Figure B.1 Change in proportion of residents who believe worst of the crisis is
still to come
Source: adapted from Standard Eurobarometer 78 (2012 Autumn)
Figure B.2 Proportion of respondents Very Confident in their ability to keep
their job (%)
Source: adapted from Eurobarometer Flash EB no 286 (2010) and Flash EB no 338 (2012) Fieldwork
in 2009 and 2011 respectively
-20 -10 0 10 20
SE SK BE CY FR RO CZ LU DE DK PL FI SI
€ AREA LT
EU27 ES EE NL EL PT AT
NON€ AREA HU LV IT
BG IE
MT UK
0
10
20
30
40
50
60
70
AT
DE
FI
DK
NL
SE
FR
UK
IT
EU
27
MT
BE
HU
CY
RO
LU
EL
SI
IE
CZ
ES
PT
PL
BG
EE
SK
LT
LV
2009
2011

ESPON 2013 58
The corollary to those that feel secure in their employment prospects are those who
feel insecure. Looking at the same Eurobarometer data for the proportion of residents
who are not at all or not very confident about their ability to keep their job starkly
illustrates a changing geography to the economic crisis (Figure B.3). In 2009
residents of the Baltic States were feeling least secure in their employment prospects,
by 2011 this had changed to residents of Greece and Cyprus, with residents of
Slovakia persisting in their feelings of insecurity.
Figure B.3 Proportion of respondents Not At All or Not Very Confident in their
ability to keep their job (%)
Source: adapted from Eurobarometer Flash EB no 286 (2010) and Flash EB no 338 (2012) Fieldwork
in 2009 and 2011 respectively
In terms of the effect that the economic crisis is having on different parts of the EU, a
survey undertaken in 2010 gives a very strong indication of the varying territorial
impact. When asked whether the crisis was having a major impact or no impact, more
than 80% of respondents in Hungary, Romania and Greece felt that it was having an
important impact (Figure B.4). In contrast, respondents in Sweden, Denmark,
Germany, Austria, Finland, Netherlands and Luxembourg were most likely to feel
that the crisis was having no impact on their personal situation.
Figure B.4 Extent to which the crisis is having an impact on your personal
situation (% respondents)
Source: adapted from Special Barometer (2010): Europeans and the Crisis
0
10
20
30
40
50
60
LT
LV
EE
SK
BG
ES
PL
EL
PT
RO
CY
HU
IE
IT
FR
MT
CZ
EU
27
BE
SI
SE
LU
UK
AT
DE
DK
NL
FI
2009
2011
0
20
40
60
80
100
HU
R
O
EL
L
V
BG
C
Y
EE
P
T
IE
LT
SI
IT
E
S SK
C
Z
UK
E
U2
7
MT
F
R
BE
P
L
LU
N
L
FI
AT
D
E
DK
SE
no impact
important impact

ESPON 2013 59
Looking at respondents responses in terms of the employment effects of the crisis
(Figure B.5) it is clear that the effects were strongest in Latvia, Lithuania, Spain,
Estonia, Bulgaria and Ireland. Whilst this accords with the macro-economic data
identified earlier in this report it does not fully account for why residents in Romania
and Bulgaria identified such strong adverse impacts of the crisis. However, one
explanation may be that small economies are more likely to witness effects which are
closer to individuals than larger economies. Again the least effected economies are
those of Luxembourg, Germany, Finland, Malta and, in this instance, France. Of
course, business cycle effects mean that a single survey point across the EU will pick
up economies at different points in their business cycle, but nevertheless this provides
a useful indication of the territorial distribution of the effects of the last economic
crisis.
Figure B.5 Employment effects, as a direct response to the crisis:
Source: adapted from Special Barometer (2010): Europeans and the Crisis
Note: Total will not sum to 100 as each category is an independent value. All values expressed as a %
of responses
0 50 100 150 200 250
MT
LU
DE
FR
FI
SE
AT
SI
BE
IT
NL
CY
PL
EL
eu27
UK
DK
PT
HU
CZ
RO
SK
IE
BG
EE LT
ES
LV
you or your partner has lost their job
one of your relatives has lost their job
one of your colleagues has lost their job
someone else you know has lost their job

ESPON 2013 60
From the qualitative data available it is clear that remaining in employment is not the
only influence on whether respondents to surveys felt that the crisis was having an
important impact on their personal situation. The economic impact of the crisis can
also be seen in differences households report in their ability to pay household bills
and credit commitments. This may reflect changes in household income levels but,
crucially, also reflects changes in the cost of goods and services facing households,
their ability to access credit and levels of disposable income in the face of, potentially,
rising taxes. From Table B.1, it is evident that households in nine economies identify
the strongest difficulties in meeting household bills and credit commitments. The
situation has also worsened somewhat between 2009 and 2011. In contrast to this,
households in five economies do not report significant difficulties in either 2009 or
2011.
Alongside their own situation EU residents are also asked to comment upon their
perceptions of poverty in the area in which they live. These data should be taken with
a certain degree of caution as recent research by the EU illustrates that EU citizens
typically overstate the level of economic ‘bads’, such as unemployment, and
underestimate levels of economic ‘goods’, such as rates of economic growth3.
However, even taking this into account, the reported responses support the broad
picture of the territorial impact of the last economic crisis. When asked about the
situation in the year up to 2009 (Figure B.6), respondents from Latvia, Bulgaria,
Hungary and Greece were most likely to feel that poverty had strongly increased,
whilst those from Sweden, Denmark and the Netherlands were most likely to feel that
it had stayed the same.
Figure B.6 Perceived change in level of poverty in past 12 months in area where
respondents live (% all respondents)
Source: adapted from Eurobarometer: Monitoring the Social Impact of the Crisis (Flash 276)
3 Eurobarometer (2010) Eurobarometer 323 January
0
10
20
30
40
50
60
70
LV
BU
HU
EL
PT
RO
IT
EE
FR
LT
ES
PL
SI
BE
SK
MT
IE
DE
CY
CZ
UK
LU
AT
FI
SE
DK
NL
stayed same
Strongly increased
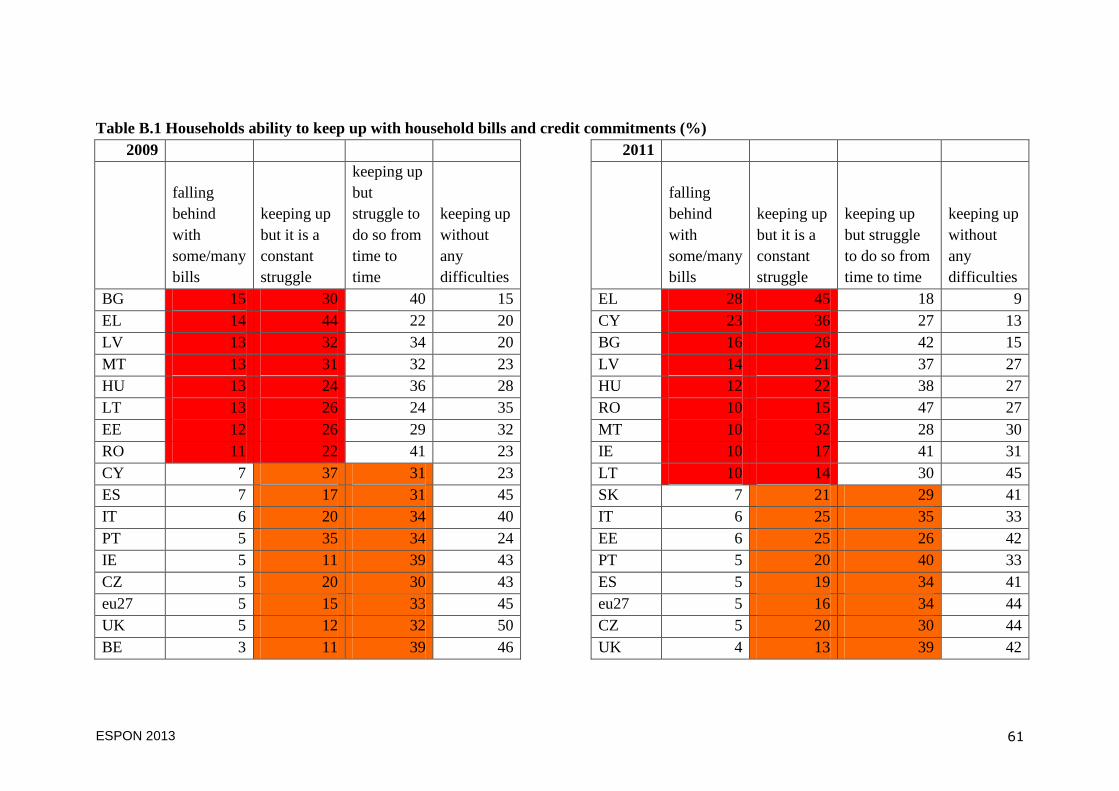
ESPON 2013 61
Table B.1 Households ability to keep up with household bills and credit commitments (%)
2009
2011
falling
behind
with
some/many
bills
keeping up
but it is a
constant
struggle
keeping up
but
struggle to
do so from
time to
time
keeping up
without
any
difficulties
falling
behind
with
some/many
bills
keeping up
but it is a
constant
struggle
keeping up
but struggle
to do so from
time to time
keeping up
without
any
difficulties
BG 15 30 40 15
EL 28 45 18 9
EL 14 44 22 20
CY 23 36 27 13
LV 13 32 34 20
BG 16 26 42 15
MT 13 31 32 23
LV 14 21 37 27
HU 13 24 36 28
HU 12 22 38 27
LT 13 26 24 35
RO 10 15 47 27
EE 12 26 29 32
MT 10 32 28 30
RO 11 22 41 23
IE 10 17 41 31
CY 7 37 31 23
LT 10 14 30 45
ES 7 17 31 45
SK 7 21 29 41
IT 6 20 34 40
IT 6 25 35 33
PT 5 35 34 24
EE 6 25 26 42
IE 5 11 39 43
PT 5 20 40 33
CZ 5 20 30 43
ES 5 19 34 41
eu27 5 15 33 45
eu27 5 16 34 44
UK 5 12 32 50
CZ 5 20 30 44
BE 3 11 39 46
UK 4 13 39 42

ESPON 2013 62
FR 2 15 40 42
FR 3 19 40 37
PL 5 9 35 50
SI 4 11 33 52
SI 4 10 35 51
PL 4 6 37 53
SK 4 15 24 57
LU 3 7 35 53
DE 3 11 35 50
BE 3 10 33 53
LU 3 6 24 66
AT 2 10 32 55
AT 2 5 29 63
FI 3 7 27 63
FI 2 7 25 66
DE 2 11 29 56
SE 1 4 18 75
NL 2 4 24 69
NL 1 2 20 76
DK 2 3 16 79
DK 1 2 14 82
SE 1 5 17 77
Source: Eurobarometer Flash EB no 286 (2010) and Flash EB no 338 (2012) Fieldwork in 2009 and 2011 respectively
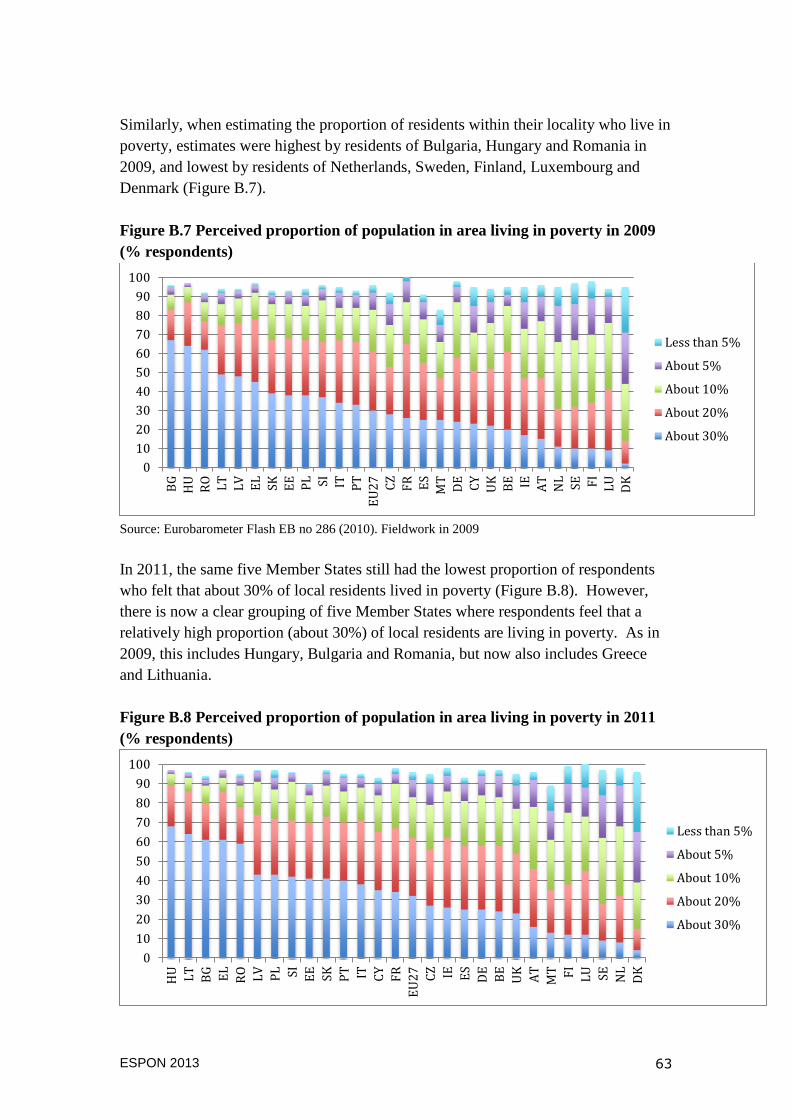
ESPON 2013 63
Similarly, when estimating the proportion of residents within their locality who live in
poverty, estimates were highest by residents of Bulgaria, Hungary and Romania in
2009, and lowest by residents of Netherlands, Sweden, Finland, Luxembourg and
Denmark (Figure B.7).
Figure B.7 Perceived proportion of population in area living in poverty in 2009
(% respondents)
Source: Eurobarometer Flash EB no 286 (2010). Fieldwork in 2009
In 2011, the same five Member States still had the lowest proportion of respondents
who felt that about 30% of local residents lived in poverty (Figure B.8). However,
there is now a clear grouping of five Member States where respondents feel that a
relatively high proportion (about 30%) of local residents are living in poverty. As in
2009, this includes Hungary, Bulgaria and Romania, but now also includes Greece
and Lithuania.
Figure B.8 Perceived proportion of population in area living in poverty in 2011
(% respondents)
0
10
20
30
40
50
60
70
80
90
100
BG
HU
RO
LT
LV
EL
SK
EE
PL
SI
IT
PT
EU
27
CZ
FR
ES
MT
DE
CY
UK
BE
IE
AT
NL
SE
FI
LU
DK
Less than 5%
About 5%
About 10%
About 20%
About 30%
0
10
20
30
40
50
60
70
80
90
100
HU
LT
BG
EL
RO
LV
PL
SI
EE
SK
PT
IT
CY
FR
EU
27
CZ
IE
ES
DE
BE
UK
AT
MT
FI
LU
SE
NL
DK
Less than 5%
About 5%
About 10%
About 20%
About 30%

ESPON 2013 64
Source: Eurobarometer Flash EB no 338 (2012) Fieldwork in 2011
The economies which recorded the biggest increase in the proportion of residents
living in poverty, and, by extension, can be judged as those whose residents feel were
worsening in performance between 2009-2011 are Greece, Lithuania, Cyprus, Ireland
and France (Figure B.9). Those where residents appear to believe that circumstances
are improving include Malta, Bulgaria, Latvia, Romania and the Netherlands.
Figure B.9 Change in proportion of residents believing that about 30% or more
of residents live in poverty (2009-2011)
Source: adapted from Eurobarometer Flash EB no 286 (2010) and Flash EB no 338 (2012) Fieldwork
in 2009 and 2011 respectively
Although the perceptual data available to the study is all at a national level it does
provide some highly valuable insights which can be used to complement the
economic indicators previously reported. Overall there is a strong complementarity
between the perceptual data and the economic datasets regarding where the effects of
the economic crisis have been most keenly felt. However, there are also some areas
of dissonance which we will explore further.
One of the features which emerges from this data appears to be the, not unexpected,
lag effect visible in some of the perceptual data, however, it also appears to illustrate a
degree of foresight in so far as it illustrates peoples’ perceptions of the future.
Equally, it also illustrates that individuals can be uncertain of the future even where
employment figures are relatively positive. This may have implications for their
spending/consumption decisions which in turn will have effects on levels of aggregate
demand within an economy. The extent to which ‘belief’ in the future may be a factor
in the resilience of economies remains to be explored. This may also suggest that
recessions can have longer-term effects on behaviour, attitudes and expectations – an
area which we will also consider in the forthcoming stages of this study.
-15
-10
-5
0
5
10
15
20
EL
LT
CY
IE
FR
PT
PL
SI
BE
HU
IT
EE
LU
DK
EU
27
FI
SK
AT
DE
UK
ES
CZ
SE
NL
RO
LV
BG
MT

ESPON 2013 65
Annex C Resilience: Systems, structure and agency
Conceptualisations of resilience often share a common emphasis on defining
resilience in terms of the functioning of the regional economy as a system. Resilience
is defined in terms of the system’s capacity to absorb, resist or respond to a
disturbance and at least maintain its functioning, if not necessarily the same system
structure (Carpenter et al, 2001). As well as shaping the definition of resilience, this
systems-based perspective also extends to its measurement and analysis. Thus, from
this perspective economically resilient and non-resilient regions are identified by
examining the system’s overall economic performance over a period of time, with
criteria for a negative economic shock defined, and pre- and post-shock growth rates
and trajectories of output and employment measured. Furthermore, analysis of the
determinants of resilience then typically focuses upon the structure of the system
whether through understanding how inherited regional production structures shape the
sensitivity of regions to recessionary shocks and their subsequent recovery (as Hill et
al, 2011; and Martin, 2012), or how these structures exhibit distinct phases or adaptive
cycles of change in line with complex ecological systems such as panarchy (Simmie
and Martin, 2010). Regional economic resilience from a systems perspective is thus
understood principally in relation to the system’s structure, performance and overall
functioning (Martin, 2012).
Whilst valuable in highlighting the potential for resilience to illuminate how regional
economies respond to economic disruptions, this system and structure emphasis has
resulted in much less attention being paid to understanding the role of human agency
in the adaptation at the heart of regional economic resilience. In part this reflects the
inevitable degree of determinism evident in translating systems thinking from the
natural and physical sciences to the social world where the ingenuity and foresight of
human agency means evolutionary paths and cycles are capable of being overridden,
broken or substantively changed (Davoudi, 2012).
Developing a fuller understanding of the role that the different actors in regional
economies - including local and regional governments - can play in shaping their
resilience to economic shocks requires that the systems-oriented perspective outlined
above be supplemented with a people-oriented perspective. Literatures from health
and psychology relating to individual and community resilience in the face of a range
of adverse situations (such as natural disasters) are particularly pertinent here, and
provide a number of important insights.
These include the notion that resilience is not simply an end point or performance
outcome: it is a process or an ongoing development capacity to adapt to change and
thrive. Furthermore, this literature focuses much more explicitly on how resilience is
shaped by the innate resources or capacities of individuals and collective groups of
actors, as well as the intentional actions they take to build up their capacities and
respond to and influence the course of change (e.g. Magis, 2010; Kulig et al, 2010;

ESPON 2013 66
Berkes and Ross, 2013). The literature acknowledges that capacities to develop
resilience vary between individuals, groups and communities (places) and that actors
have differential abilities to acknowledge, respond effectively to and influence change
(Goldstein, 2009). However, the literature also point to a number of characteristics
that play key roles in shaping resilience including strong people-place connections,
collaborative institutions and governance, strong social networks, well-developed
community infrastructures and positive cultures of leadership and readiness to accept
change (Berkes and Ross, 2013).
Combining these literatures thus suggests that regional economic resilience is an
adaptive notion or capacity and can be defined as the ability of a regional economy
(as a system comprised of multiple agents) to withstand, adapt to and recover from an
external economic shock. It thus represents its ability to adapt and thrive in the face of
adversity.

ESPON 2013 67
Annex D Existing Indexes of Resilience
In recent years there have been a small number of studies which seek to measure the
economic resilience of particular territories. These provide interesting insights in
terms of methodological approach and their underlying hypotheses. Some are also
instructive in terms of their potential predictive power, particularly where they were
developed prior to the current economic crisis. We focus here on three such studies,
to illustrate the different scales and approaches being taken.
At a global scale, Briguglio et al, develop an indicator of national economic resilience
by extending the notion of the vulnerability of economies. In their work they have
established one composite resilience value based on four categories. A number of
indicators make up each category (Table D.1)
Table D.1 Indicators of national economic resilience
Macroeconomic
stability
Microeconomic
efficiency
Good governance
Social
development
Fiscal deficit to
GDP ratio
Sum of the
unemployment and
inflation rates
The external debt-
to-GDP ratio
Based on
Economic
Freedom of the
World Index
Judicial independence
Impartiality of courts
The protection of intellectual
property rights
Military interference in the
rule of law;
Political system and the
integrity of the legal system
Life expectancy at
birth
Adult literacy rate
School enrolment
rates
Source: adapted from Briguglio et al (2008)
Their work was undertaken prior to the fiscal crash and the beginning of the economic
crisis, but provides a useful perspective on some potential facets of resilience. We
illustrate the performance of European economies in Map D.1, where 1 equals the
most resilient quintile and 5 equals the least resilient quintile.
The Resilience Capacity Index has been developed by the University at Buffalo
Regional Institute, as part of the University of Berkeley’s ‘Building Resilient
Regions’ network. This provides a single value of resilience for US metro regions,
based upon a composite index of 12 indicators, grouped into three categories (Table
D.2).

ESPON 2013 68
Map D.1 Resilience score of European economies
Source: adapted from Briguglio et al, 2008
Table D.2 Indicators of Resilience Capacity
Regional Economic
Capacity
Socio-demographic
Capacity
Community Connectivity
Capacity
Income equality
Economic diversification
Regional affordability
Business environment
Educational attainment
Without disability
Out-of-poverty
Health insured
Civic infrastructure
Metropolitan stability
Home ownership
Voter participation
Source: adapted from BRR website (http://brr.berkeley.edu/rci/)

ESPON 2013 69
Whilst several of these indicators are particular to the US context and do not translate
well to the European space as a whole, they provide a valuable indication of the issues
which are regarded as significant. The composite value of the index provides the
following geography of resilience in the US (Map D.2).
Map D.2 Regional Resilience in the US
Source: http://brr.berkeley.edu/rci/data/map
Within individual member states of the EU there have been a small number of
attempts to develop regional indexes of resilience, partly as a response to the current
economic crisis. These tend to relate to a particular Member State, such as the work
by Experian PLC in England, UK. In their work Experian identify four components
to resilience, each represented by a number of individual indicators with weighted
values (Table D.3).
Table D.3 Indicators of Components of Resilience
Business People Community Place
% vulnerable
sectors
% resilient sectors
% high-growth
(knowledge)
sectors
Business start-up
Insolvency Rates
Working age
population (growth)
NVQ4+ APS
Low qualifications
% employed as
corporate managers
% employed in
elementary
% vulnerable to
declines in
disposable income
% vulnerable to LT
unemployment
CC rate of
unemployment
Social cohesion/do
Achievement at
school
Crime rates
House prices
Previously
developed land
ERV commercial
office space

ESPON 2013 70
% workforce self-
employed
Adaptive
companies
Days beyond terms
Foreign-owned
businesses
Exporters
Highly exporting
SICs
% employment in
vulnerable sector
% employment in
resilient sectors
Business Density
Experian pH group
and APS
occupations
Earnings
neighbours look
out for each other
Life expectancy at
birth female
Life expectancy at
birth male
% wards amongst
10% most deprived
Greenspace as a %
of total land
Source: Experian PLC
Examining the various approaches highlighted above we find that some stated
indicators of resilience can only be applied at the national scale, and so, perhaps, have
less validity when compiling a regional index; others are particular to individual
national economies and some refer to indicators which are difficult to access on a
comparable basis across the EU or the ESPON space. However, they each offer
valuable pointers to the factors which might considered in developing typologies of
resilience as the study progresses.
Examining the various approaches to date it is apparent that most of the indicators
identified focus on innate characteristics of resilience, rather than measures of the
adaptive capacity of a region. Many of the indicators are also composite indicators
which require unpacking to appreciate their actual composition. Overall, there is a
degree of consistency in what is regarded as significant in determining resilience, put
broadly this relates to business characteristics, population characteristics and the
nature of society (or community). Place-based considerations are less prevalent, and
are only formally considered in the Experian index. The other area of variation is in
the level of significance ascribed to macro-economic conditions. Whilst this latter
element may have less significance in assessing relative resilience between
geographical units within a national economy it might be expected to play a stronger
role in cross-national comparisons. However, it is also the case that this is a factor
over which sub-national policy makers can have very little influence.

ESPON 2013 71
These features of resilience indexes have been used to guide the thinking of the study
team in developing our own approach to a typology of resilience to the economic
crisis and in seeking indicators through which to measure the components of
resilience. In particular, we seek to strengthen the consideration of place-based
characteristics and to distinguish more fully between indicators of performance and
capacity. We also intend to explore how best to balance macro-level indicators with
those which are more differentiated at a sub-national scale.

ESPON 2013 72
Annex E Underlying data
1 Business
Economic structure
The economic structure of a region is considered an important influence on the
susceptibility of a particular economy to an economic shock. Owing to a change in
classification during the data series available data currently supports a broad four-
sector (primary production, manufacturing, construction, services) assessment of
regional economic activity. We are exploring whether a more fine-grained analysis is
possible, by utilizing a breakpoint in the shift between the two classifications, and
whether this would assist in developing our model of economic resilience.
In the absence of Experian data we can make use of ESPON map typology from the
Territorial Diversity project (Figure 1).
Number of Enterprises
Experian data (from Eurostat) currently is only available at the NUTS0 level and for a
very limited time period. Alternative datasources, such as GEM, for number of
business discontinuations, also only available at national level and for limited points
in time on non-comparable basis.
Economies which are least resilient might be expected to exhibit higher levels of
business closures. Comparable date across the ESPON territory is lacking in this
regard, but the Global Entrepreneurship Monitor provides some useful evidence for a
large sample of countries, albeit at a national scale only (Figure 2). However, as the
graphic illustrates, the differences are not strong and may not follow anticipated
patterns. Some literature suggests that low levels of business closures may contribute
to less resilient economies as it prevents the recycling of economic capacity.
Figure 2: Business discontinuation (proportion of all businesses, 2011)
0
1
2
3
4
5
6
7
8
Slo
vak
ia
Po
lan
d
Ro
man
ia
Tu
rkey
Cro
atia
Irel
and
Swed
en
Gre
ece
Lat
via
Lit
hu
ania
Po
rtu
gal
Swit
zerl
and
Av
erag
e
Cze
ch R
epu
bli
c
No
rway
Den
mar
k
Hu
nga
ry
Fra
nce
Spai
n
Fin
lan
d
Net
her
lan
ds
UK
Ger
man
y
Slo
ven
ia
Bel
giu
m

ESPON 2013 73
Source: adapted from Global Entrepreneurship Monitor (2011) Global Report
Figure 1 Business sector concentration
Source: ESPON Project Territorial Diversity, via ESPON Map database
Number of Enterprises
Experian data (from Eurostat) currently is only available at the NUTS0 level and for a
very limited time period. Alternative datasources, such as GEM, for number of

ESPON 2013 74
business discontinuations, also only available at national level and for limited points
in time on non-comparable basis.
Economies which are least resilient might be expected to exhibit higher levels of
business closures. Comparable date across the ESPON territory is lacking in this
regard, but the Global Entrepreneurship Monitor provides some useful evidence for a
large sample of countries, albeit at a national scale only (Figure 2). However, as the
graphic illustrates, the differences are not strong and may not follow anticipated
patterns. Some literature suggests that low levels of business closures may contribute
to less resilient economies as it prevents the recycling of economic capacity.
Figure 2: Business discontinuation (proportion of all businesses, 2011)
Source: adapted from Global Entrepreneurship Monitor (2011) Global Report
Size of Enterprises
This is subject to the same challenges as the number of enterprises. Limited
timeseries data at NUTS0 available from Experian data set.
Level of self-employment
Available from the Experian dataset over a reasonable timeseries at a NUTS0 level.
Use could be made of this for testing significance at a national level. This can then be
linked to case study research findings.
Investment
Levels of business investment can provide a valuable indication of business
confidence. Comparable data is available at a NUTS2 level for a number of countries
within the ESPON space and has now been collated for the study by Experian.
Innovation
Levels of innovation may be regarded as a core component of resilience, as
innovation clearly demonstrates the ability of a firm, or an economy, to successfully
0
1
2
3
4
5
6
7
8
Slo
vak
ia
Po
lan
d
Ro
man
ia
Tu
rkey
Cro
atia
Irel
and
Swed
en
Gre
ece
Lat
via
Lit
hu
ania
Po
rtu
gal
Swit
zerl
and
Av
erag
e
Cze
ch R
epu
bli
c
No
rway
Den
mar
k
Hu
nga
ry
Fra
nce
Spai
n
Fin
lan
d
Net
her
lan
ds
UK
Ger
man
y
Slo
ven
ia
Bel
giu
m

ESPON 2013 75
introduce new ideas. Our approach here will consider the value of two key data sets,
the EU’s Regional Innovation Monitor (Figure 3) and the territorial patterns of
innovation identified in the ESPON project KIT, illustrated in Figure 4.
Alternative concepts will also be explored. These include notions of technologically
advanced regions and scientific regions in Europe (see ESPON project KIT, Final
Report p.4 for example). This will explore the explanatory power of these groupings.
We will not address individual indicators, such as R&D expenditure, as well owing to
the fact that these are included in the composite indicators that these typologies are
based on.
Figure 3 Territorial patterns of innovation in Europe
19
!
! ! !
!
!
!
!
!
!
!!
!
!
!
!
!
!
!
!
!
!
!
!
!
!
!
!
!
!
!
!
!
!
!
!
!
!
!
!
!
!
!
!
!
!
!!
!
!
Acores
Guyane
Madeira
Réunion
Canarias
MartiniqueGuadeloupe
Valletta
Roma
Riga
Oslo
Bern
Wien
Kyiv
Vaduz
Paris
Praha
Minsk
Tounis
Lisboa
Athina
Skopje
Zagreb
Ankara
Madrid
Tirana
Sofiya
London
Berlin
Dublin
Tallinn
Nicosia
Beograd
Vilnius
Kishinev
Sarajevo
Helsinki
Budapest
Warszawa
Podgorica
El-Jazair
Stockholm
Reykjavik
København
Bucuresti
Amsterdam
Luxembourg
Bruxelles/Brussel
Ljubljana
Bratislava
Regional level: NUTS2Source: Own elaboration, 2012
Origin of data: EUROSTAT, 2012© EuroGeographics Association for administrative boundaries
This map does not
necessarily reflect the
opinion of the ESPON
Monitoring Committee
© Politecnico di Milano, ESPON KIT Project, 20120 520260
km
Legend
No data
Imitative innovation area
Smart and creative diversification area
Smart technological application area
Applied science area
European science-based area
Map 2.2.1. Territorial patterns of innovation in Europe
A smart and creative diversification area (Pattern 2b), characterized by a low degree of local applied knowledge, some internal innovation capacity, high degree of local competences,
which suggest that the not negligible innovation activities carried out in the area mainly rely upon tacit knowledge embedded into human capital. Moreover, regions in this area are
strongly endowed with characteristics such as creativity and attractiveness that help to absorb
knowledge and to adapt it to local innovation needs. These regions are mainly located in
Mediterranean countries (i.e. most of Spanish regions, Central Italy, Greece, Portugal), in
agglomerated regions in Slovakia and Poland, a few regions in northern Europe, namely in
Finland and the UK.
An imitative innovation area (pattern 3), in which one measures a low knowledge and
innovation intensity, entrepreneurship, creativity, a high attractiveness and a high innovation
potentials, that can be considered as local pre-conditions enabling the acquisition of external
innovation (Figures 2.1.4-2.1.6). Most of these regions are in EU12 such as all regions in
Bulgaria and Hungary, Latvia, Malta, several regions in Poland, Romania, and Slovakia, but
also in Southern Italy.
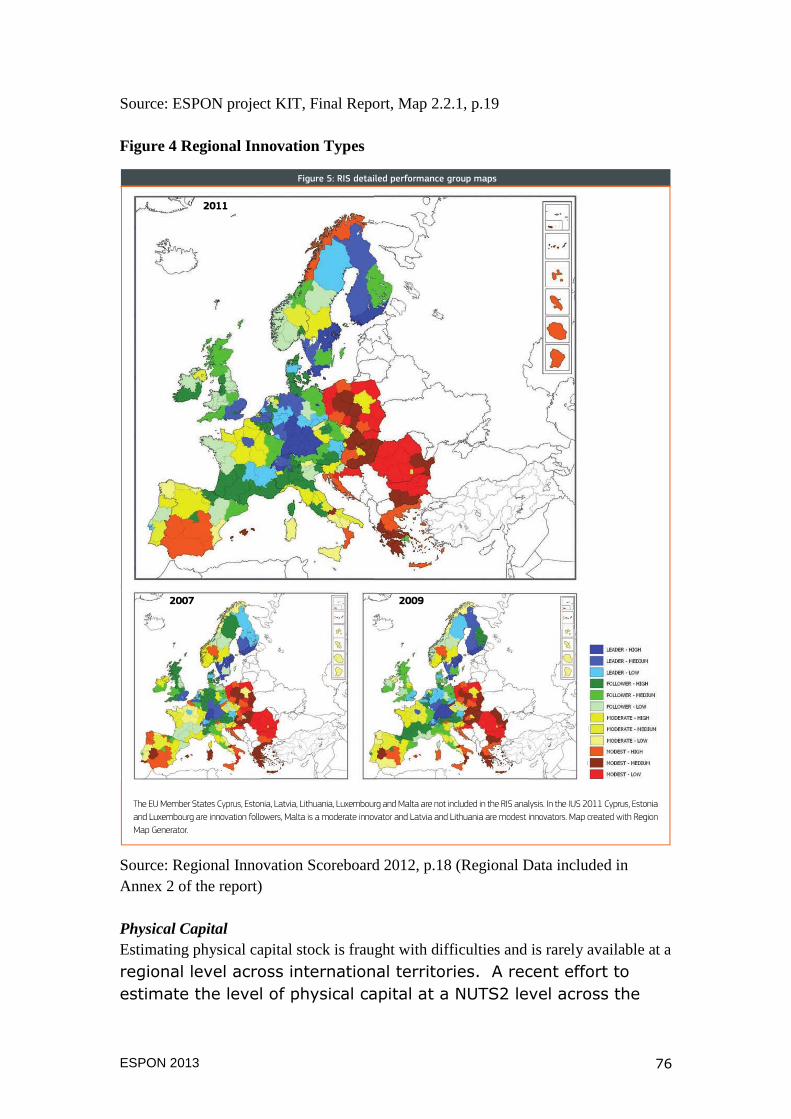
ESPON 2013 76
Source: ESPON project KIT, Final Report, Map 2.2.1, p.19
Figure 4 Regional Innovation Types
Source: Regional Innovation Scoreboard 2012, p.18 (Regional Data included in
Annex 2 of the report)
Physical Capital
Estimating physical capital stock is fraught with difficulties and is rarely available at a
regional level across international territories. A recent effort to
estimate the level of physical capital at a NUTS2 level across the
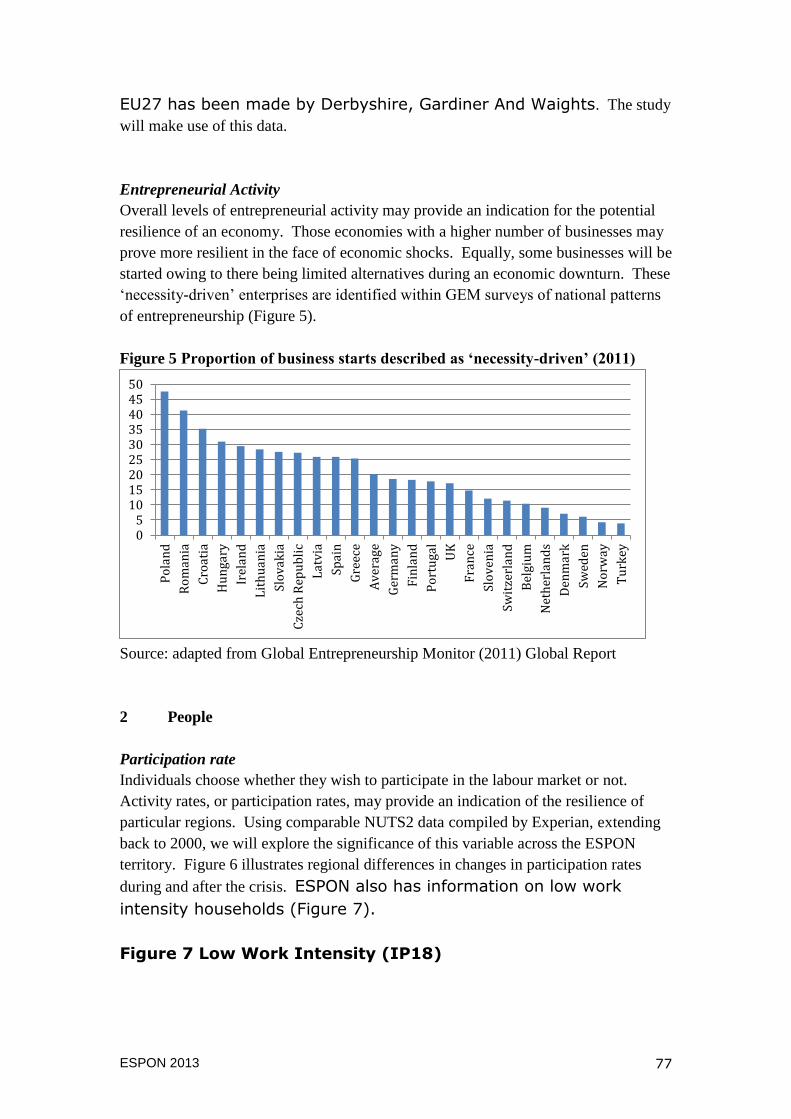
ESPON 2013 77
EU27 has been made by Derbyshire, Gardiner And Waights. The study
will make use of this data.
Entrepreneurial Activity
Overall levels of entrepreneurial activity may provide an indication for the potential
resilience of an economy. Those economies with a higher number of businesses may
prove more resilient in the face of economic shocks. Equally, some businesses will be
started owing to there being limited alternatives during an economic downturn. These
‘necessity-driven’ enterprises are identified within GEM surveys of national patterns
of entrepreneurship (Figure 5).
Figure 5 Proportion of business starts described as ‘necessity-driven’ (2011)
Source: adapted from Global Entrepreneurship Monitor (2011) Global Report
2 People
Participation rate
Individuals choose whether they wish to participate in the labour market or not.
Activity rates, or participation rates, may provide an indication of the resilience of
particular regions. Using comparable NUTS2 data compiled by Experian, extending
back to 2000, we will explore the significance of this variable across the ESPON
territory. Figure 6 illustrates regional differences in changes in participation rates
during and after the crisis. ESPON also has information on low work
intensity households (Figure 7).
Figure 7 Low Work Intensity (IP18)
0 5
10 15 20 25 30 35 40 45 50
Po
lan
d
Ro
man
ia
Cro
atia
Hu
nga
ry
Irel
and
Lit
hu
ania
Slo
vak
ia
Cze
ch R
epu
bli
c
Lat
via
Spai
n
Gre
ece
Av
erag
e
Ger
man
y
Fin
lan
d
Po
rtu
gal
UK
Fra
nce
Slo
ven
ia
Swit
zerl
and
Bel
giu
m
Net
her
lan
ds
Den
mar
k
Swed
en
No
rway
Tu
rkey

ESPON 2013 78
Educational qualifications
A key indicator to be explored by the study is the significance of higher levels of
skills and qualifications in economic resilience. Experian have now collated the
dataset for tertiary education attainment at a NUTS2 level extending in most cases
back to around the year 2000, and will use this in our forthcoming analysis.
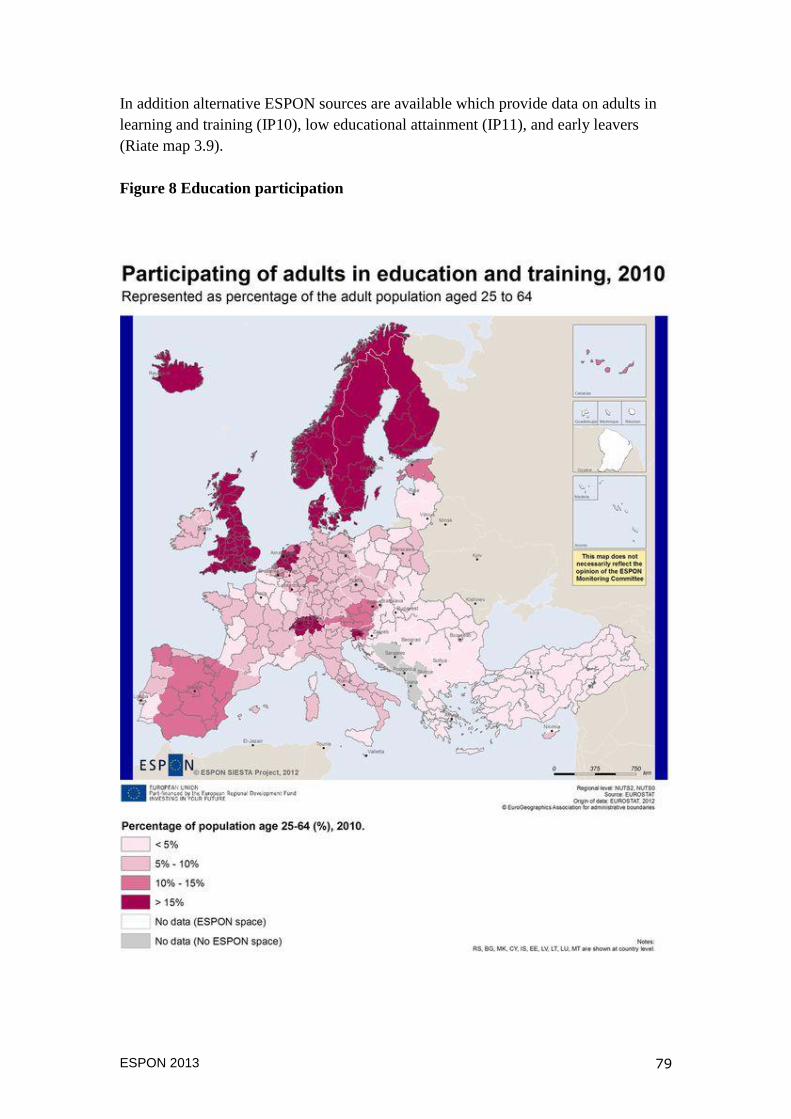
ESPON 2013 79
In addition alternative ESPON sources are available which provide data on adults in
learning and training (IP10), low educational attainment (IP11), and early leavers
(Riate map 3.9).
Figure 8 Education participation

ESPON 2013 80
Figure 9 Educational attainment
Hours worked
Individuals may choose whether to work longer, or shorter, amounts of time.
Employers may also request that workers accept shorter working hours, or undertake

ESPON 2013 81
additional hours. Changes in levels of working hours may signal an economy that is
able to adapt without recourse to simple hire/fire decisions. Data availability from
Experian is however limited to NUTS0 which has limited relevance to the current
study. We shall seek to use this alongside other national data sets in assessing its
relevance to the theme, but not in terms of regional-scale analyses.
Disposable Income
Levels of household disposable income provide a useful indication of the changes in
incomes which households experience at a time of economic shocks; either due to
reductions in income or increases in direct taxation. Comparable data is available
from Experian for this indicator at a NUTS2 level extending back to 2000. Figure 10
illustrates regional differences in changes in disposable income in the period prior to
and during the crisis. In addition data is available from ESPON (Figures 11b-13)
sources on population at risk of poverty (IP13, IP14, IP15, IP16*).
Use can also be made of Eurobarometer data on households’ ability to meet bills and
credit commitments, although this is only available at a national level (Figure 11a).

ESPON 2013 82
Figure 11a Households ability to keep up with household bills and credit commitments (%)
2009
2011
falling
behind
with
some/many
bills
keeping up
but it is a
constant
struggle
keeping up
but
struggle to
do so from
time to
time
keeping up
without
any
difficulties
falling
behind
with
some/many
bills
keeping up
but it is a
constant
struggle
keeping up
but struggle
to do so from
time to time
keeping up
without
any
difficulties
BG 15 30 40 15
EL 28 45 18 9
EL 14 44 22 20
CY 23 36 27 13
LV 13 32 34 20
BG 16 26 42 15
MT 13 31 32 23
LV 14 21 37 27
HU 13 24 36 28
HU 12 22 38 27
LT 13 26 24 35
RO 10 15 47 27
EE 12 26 29 32
MT 10 32 28 30
RO 11 22 41 23
IE 10 17 41 31
CY 7 37 31 23
LT 10 14 30 45
ES 7 17 31 45
SK 7 21 29 41
IT 6 20 34 40
IT 6 25 35 33
PT 5 35 34 24
EE 6 25 26 42
IE 5 11 39 43
PT 5 20 40 33
CZ 5 20 30 43
ES 5 19 34 41
eu27 5 15 33 45
eu27 5 16 34 44
UK 5 12 32 50
CZ 5 20 30 44
BE 3 11 39 46
UK 4 13 39 42

ESPON 2013 83
FR 2 15 40 42
FR 3 19 40 37
PL 5 9 35 50
SI 4 11 33 52
SI 4 10 35 51
PL 4 6 37 53
SK 4 15 24 57
LU 3 7 35 53
DE 3 11 35 50
BE 3 10 33 53
LU 3 6 24 66
AT 2 10 32 55
AT 2 5 29 63
FI 3 7 27 63
FI 2 7 25 66
DE 2 11 29 56
SE 1 4 18 75
NL 2 4 24 69
NL 1 2 20 76
DK 2 3 16 79
DK 1 2 14 82
SE 1 5 17 77
Source: Eurobarometer Flash EB no 286 (2010) and Flash EB no 338 (2012) Fieldwork in 2009 and 2011 respectively

ESPON 2013 84
Figure 11b Population at risk of poverty

ESPON 2013 85
Figure 12 Population at risk of poverty after social transfers
Figure 13 Change in population at risk

ESPON 2013 86
Unemployment
Although levels of unemployment are often regarded as an indicator of economic
performance the effects that it can have on individuals in terms of their choices, and
future economic opportunities means that we include this in our ‘people’ category.
Levels of unemployment (as a proportion of the labour force) have been collated by
Experian to the NUTS2 level back to 1999. Figure 14 illustrates regional differences
in changes in unemployment rates during and after the crisis.

ESPON 2013 87
Youth Unemployment rate (2009) is available from ESPON (IP8), longterm
unemployment from ESPON (IP19).
Figure 15 Youth Unemployment

ESPON 2013 88
Figure 16 Longterm unemployment
Labour productivity
Material on labour productivity is available for a single year from ESPON (Riate map
2.4).

ESPON 2013 89
Perceptions
A strong influence on future behavior is the belief in the future held by individuals.
Various measures of this are available through Eurobarometer surveys at the level of
the Member State. In some instances these have been repeated on an irregular basis
enabling snapshot comparisons to be made. We illustrate some of this material in
Annex B. We shall seek to undertake an assessment of this at a national level.

ESPON 2013 90
Figure 6 Change in participation rates during and post crisis

ESPON 2013 91
Figure 10 Disposable income change prior to and during the crisis

ESPON 2013 92
Figure 14 Changes in Unemployment pre and post crisis

ESPON 2013 93
3 Community
Governance
Governance structures play an important role in determining the ‘freedom to act’ at
different territorial scales. There is some evidence that different governance
structures can influence levels of territorial resilience to economic crisis. However,
this remains subject to further study. The ESPON space is characterised by a variety
of forms of governance, which can be characterised in a number of different ways.
Typical classifications focus on administrative traditions or welfare regimes (see
ESPON TANGO report for further details). Our interest is strongly related to the
relative autonomy of sub-national authorities, which is not well developed in these
classifications.
One potential source is that of Marks et al who have developed an index of Regional
Authorities (http://www.unc.edu/~gwmarks/data_ra.php). Although not
comprehensive for the ESPON territory it does provide useful assessment across the
following criteria (institutional depth, fiscal autonomy, self rule, law making and
fiscal control) for a number of countries.
The ESPON TANGO Project draws on the scores of the Worldwide Governance
Indicators (www.govindicators.org), published by the World Bank, to develop 6
clusters of governance ‘types’ across the ESPON space. This is as follows (with
clusters i and ii and clusters v and vi reportedly very close to forming one combined
cluster each):
cluster I: Denmark, Finland, Luxembourg, Norway, Sweden, Switzerland, The Netherlands
cluster II: Austria, Belgium, France, Germany, Iceland, Ireland, United Kingdom
cluster III: Czech Republic, Hungary, Latvia, Lithuania, Poland, Slovakia
cluster IV: Cyprus, Estonia, Malta, Portugal, Slovenia, Spain
cluster V: Bulgaria, Croatia, Greece, Italy, Montenegro, Romania
cluster VI: Albania, Bosnia, Kosovo, Macedonia, Serbia
Further consideration can also be given to the more detailed assessment set out in
Table 10, of Stead’s report on Developing Typologies of Regional Governance
(sourced from ESPON project 2.3.2), particularly where there is variation in identified
objectives (such as effectiveness, decentralization, accountability and co-ordination).
This is reproduced below as Figure 15.

ESPON 2013 94
Figure 15 Emphasis on governance objectives in EU member states (source: ESPON project 2.3.2, Annex B)
op
enn
ess
tran
spar
ency
par
tici
pat
ion
effe
ctiv
ene
ss
ho
rizo
nta
l
coo
rdin
atio
n
acco
un
tab
ility
vert
ical
coo
rdin
atio
n
dec
entr
aliz
atio
n
coh
eren
ce
Austria * * * * *
Belgium * * *
Bulgaria * * * * *
Cyprus * *
Czech Republic * * * *
Denmark * * * * *
Estonia * * * *
Finland * * *
France * * * * * * *
Germany * * * * * * * *
Greece * * * * * *
Hungary * * *
Ireland * * * * * *
Italy * * * *
Latvia * * * * *
Lithuania * * * * *
Luxembourg * * * * *
Malta * * * * *
Netherlands * * * * * * * * *
Norway * * * * *
Poland * * * * * *
Portugal * * * *
Romania * * * * * *
Slovakia * * * *
Slovenia * * * * *
Spain * * * *
Sweden * * * *
Switzerland * * * * * * *
UK * * * * * * *
Fiscal Autonomy
The level of fiscal autonomy may have an influence on levels of resilience, through
the affect that this can have on sub-national responsive capacity. A crude measure of
this can be obtained through adopting the characterisation developed by Ismeri
Europe and Applica and set out in the ESPON project SGPTD (Figure 16), but this is
not believed to be sufficient. A broad assessment could also be made from the Marks
Regional Authority Index, but this lacks coverage. Data can be obtained from Eurostat
(2009, Taxation trends in the EU), this is the preferred route.

ESPON 2013 95
Figure 16: State Systems: responsibilities and local autonomy
Group of
Countries
Features Trends in
Competencies
Local
revenues
and
autonomy
Federal States
(Austria, Belgium,
Germany)
Constitutionally
recognised, shared
powers between
central and sub-
central levels (states)
Not significant changes,
reinforcement of federal
organisation in Belgium
Medium
Unitary ‘Northern’
states (Sweden,
Finland, Denmark,
Norway)
Centralised states
with strong local
autonomy
Rationalisation and
unification of some
local tiers (counties,
municipalities
aggregated into regions)
High
Unitary
regionalised states
(Italy and Spain)
Strong autonomy of
intermediate levels
(regions)
Fast devolution and
tendency to introduce
federal agreements
Medium-
high and
increasing
Other unitary states
– ‘old’ Member
States
(France, Greece,
Ireland,
Luxembourg,
Netherlands,
Portugal, UK)
Different institutional
forms with more
(UK, Netherlands,
France) to less power
to local government
(Portugal, Greece)
On-going but slow
devolution and
reorganisation in UK
and France. Slowdown
or devolution halt in
Portugal and Greece
Medium
(high in
France)
Other unitary states
– ‘new’ Member
States
(Bulgaria, Czech
Republic, Estonia,
Hungary, Latvia,
Lithuania, Poland,
Romania, Slovakia,
Slovenia, Cyprus,
Malta)
States undergoing
restructuring;
fragmented local
government
Re-establishment and
reinforcement of local
governments; more
articulated devolution
process in Poland
Medium low
Source: ESPON SGPTD Final Report, p.8
Territorial Management
The role of development planning and control has contributed to the economic crisis
in some Member States, such as Ireland and Spain. In other areas it might have
played a more positive role in checking the development of property ‘bubbles’.
Assessment of this will be made at the case study level. Use will also be made of the

ESPON 2013 96
spatial planning typology of Farinos-Dasi (2007) reported by the ESPON TANGO
project - which identifies the following groupings (Figure 17):
Figure 17 Spatial planning types
Comprehensive integrated AT, DK, FI, NL, SE, DE (+ BE, FR, IE LU, UK) BG, EE, HU, LV, LT PL, RO, SL, SV
Land use regulation BE, IE, LU, UK (+ PT, ES) CY, CZ, MT
Regional economic FR, DE, PT, (+ IE, SE, UK) HU, LV, LT, SK
Urbanism GR, IT, ES CY, MT
Social Capital
There is some suggestion that areas with stronger levels of social capital may exhibit
higher levels of resilience. Assessment of this will be made at the case study level.
Entrepreneurial intentions
The extent to which a community has strong entrepreneurial intentions might offer
some insights into the potential resilience of an economy in the face of an economic
shock, as it signals active adaptive approaches. A priori one might anticipate that the
proportion of a population that is considering establishing an enterprise might be
higher either when the economy is stronger or when it is weaker. Data on
entrepreneurial intent is only available at a national scale, and not for all countries
within the ESPON space (Figure 18). We will examine this further in the light of the
qualitative case study material.
Figure 18 Proportion of population stating intention to start a business (2011)
Source: adapted from Global Entrepreneurship Monitor (2011) Global Report
Business Birth Rate
The rate at which new businesses created could influence levels of economic
resilience, although conceptually the picture appears to be mixed. Data is available
from Experian for a very limited period at the NUTS0 level.
0
5
10
15
20
25
30
Lat
via
Ro
man
ia
Po
lan
d
Hu
nga
ry
Cro
atia
Slo
vak
ia
Fra
nce
Lit
hu
ania
Cze
ch R
epu
bli
c
Av
erag
e
Po
rtu
gal
Bel
giu
m
Gre
ece
Swed
en
Swit
zerl
and
Slo
ven
ia
UK
No
rway
Net
her
lan
ds
Tu
rkey
Spai
n
Fin
lan
d
Den
mar
k
Irel
and
Ger
man
y

ESPON 2013 97
Social enterprise
Levels of social entrepreneurship may be considered to indicate both levels of social
capital within an economy and to provide indications of a more resilient economy.
Higher levels of social entrepreneurship may both act to reduce negative impacts of
economic shocks and may serve to provide employment opportunities within an
economy. There is anecdotal evidence from our case studies of increases in levels of
social entrepreneurship as individuals look for alternative sources of employment, but
also reductions in levels of activity as existing social enterprises struggle to survive in
difficult economic circumstances. There is only limited comparable evidence from
across the ESPON space on levels of social enterprise. The most robust source is a
recent survey of levels of social entrepreneurship by the Global Entrepreneurship
Monitor. This provides national data for a limited number of states, based on survey
data from 2009 (Figure 19).
Figure 19 Social Entrepreneurship (2009) as percentage of working population
Source: adapted from GEM 2011 Report on Social Entrepreneurship
It also provides a valuable insight into the scale of new social enterprise foundation
(Figure 20), which we will examine further to assess the insights this provides for
considerations of resilience. In most instances the numbers of early stage Social
Enterprises significantly outweigh the numbers of established Social Enterprises.
0
1
2
3
4
5
6
7

ESPON 2013 98
Figure 20 Early stage Social Enterprises as proportion working population (%)
Source: adapted from GEM 2011 Report on Social Entrepreneurship
Innovation confidence
We have considered the potential of an indicator on innovation confidence as a
measure of a population’s willingness to embrace new ideas. This might provide an
insight into levels of adaptability. Unfortunately there is limited data available for
such an indicator. An Index of Innovation Performance is produced on an occasional
basis which seeks to measure the extent to which consumers embrace innovations,
based upon survey returns. This covers a small number of national economies across
the ESPON space (Figure 21). Although analysis of this material is challenging there
is some suggestion that an inverse relationship might apply in terms of the
performance of the respective economies in the face of the economic crisis.
Figure 21 Reported levels of consumer confidence in innovation (%)
Source: adapted from Levie, J (2010) The IIIP Innovation Confidence Indexes 2009
Report
Where data is available for more than one year it does appear to indicate that
consumers became less ‘innovation-friendly’ (or more conservative) during the
economic crisis (Figure 22). However, the data series is insufficient to perform any
analysis of this material.
0 0.5
1 1.5
2 2.5
3 3.5
4 4.5
0
10
20
30
40
50
60
70

ESPON 2013 99
Figure 22 Changes in reported levels of Innovation Confidence
Croatia 2008-2009 -20
UK 2007-2009 -12
Slovenia 2007-2009 -10
Spain 2008-2009 -4
Iceland 2008-2009 -3
Finland 2007-2008 -2
Ireland 2007-2008 -1
Italy 2007-2008 +2
Source: adapted from Levie, J (2010) The IIIP Innovation Confidence Indexes 2009
Report
Demographic Structure
Populations which have different age structures may exhibit different levels of
resilience. Those with lower proportions of a working age may prove to be less
resilient owing to the smaller labour base, but may also prove to have a stronger level
of resilience where retirement incomes are more prevalent and provide a stronger
degree of income stability. Data is available from Eurostat
(http://epp.eurostat.ec.europa.eu/cache/ITY_OFFPUB/KS-HA-12-001/EN/KS-HA-
12-001-EN.PDF) and can be assessed in terms of population change, net migration
rate and old age dependency ratio amongst other attributes. For the present study we
propose to include the latter under the Community indicator-set.
4 Place
Migration
Migration rates can be considered to be a relatively strong indicator of the resilience
of an economy. Intuitively it is anticipated that less resilient economies will exhibit
net outmigration, particularly amongst those of a working age. Current reports of the
outflow of young adults from economies such as Ireland and Spain, to territories
which are economically stronger appears to support such an analysis. Evidence from
the ESPON ATTREG project suggests, however, that this thesis might not stand
stronger analysis. Their results suggest that net migration rates prior to the crisis were
highest in some of those regions that have proved least resilient to the economic
shock, a finding that is strengthened for those aged 25-49. In Figure 23, ATTREG
characterises regions by virtue of their relative ability to retain working-age
populations. By simple observation it is evident that there is no clear relationship
between those regions most able to retain populations and economic performance
during the last crisis.

ESPON 2013 100
Figure 23 Regional Mobility by typology of age cohorts
Source: ESPON project ATTREG, Final Report, Map B, p.6
Initial analysis of this data suggests that, at least some of, those areas with higher
levels of net in-migration were over-heating in the pre-crisis boom and so attracted
migrant labour on the basis of what proved to be unsustainable patterns of economic
growth. Indeed members of the ATTREG study team suggest post-crisis, those
regions which were least attractive to migration have proven to be the more resilient.
This is a line of inquiry that will be pursued in the next stages of our research.
Our qualitative research suggests that there is strong evidence that individuals are
responding to weaker economic opportunities by seeking employment in other
regions. However, much of this is not reflected in official migration figures as it
constitutes temporary movements based around what may be a working week in one
location followed by a return to the family home at weekends, or other temporal
patterns.

ESPON 2013 101
Access to markets
Connectivity – The connectivity of places might be considered as one potential
component of resilience. Potentially, the more connected a place the more able it is to
access other markets. However, having examined the relation between cities’
connectivity and their economic performance the ESPON study TIGER found no
evidence of such a link in advanced producer services or other functions (p.65 Final
Report).
Openness – openness to trade is regarded as a potential indication of resilience.
Qualitative research from the case studies suggests that strong export performance is
able to counteract declines in domestic demand. However, this also provides potential
risks in terms of vulnerability to overseas competition. Across the ESPON territory
there are clear disparities in levels of ‘openness’ as illustrated by the ESPON TIGER
project (Figure 24). We will explore the value of this indicator in the next stages of
our work.
Figure 24 Openness to extra-ESPON and neighbourhood trade of European
regions, average 2007-2009.

ESPON 2013 102
Source: Reproduced from ESPON TIGER Project, Draft Final Report, p.41.
Note: extra-EU and neighbourhood exports exclude all exports within the ESPON
space as well as its immediate neighbourhood (Western Balkans, Near East, former-
USSR and Northern Africa)
Territorial Characteristics - (NUTS3)
Urban-rural typology
One consideration to explore is whether levels of urban or rural intensity influences
levels of resilience. This will be done through use of the Commission’s urban-rural
typology (Figure 25)
Figure 25 Urban-rural typology

ESPON 2013 103
Urban structure
The presence of critical mass is regarded by some writers as a critical influence on
levels of economic resilience. Urban areas provide opportunities for diverse
employment opportunities and agglomeration economies. Representatives of the
ESPON TIGER4 project suggest that larger cities have performed more strongly post-
crisis citing a flight of global capital to ‘safe-haven’ locations. These safe havens
have more diverse markets and so provide more robust locations for real estate
investments.
In assessing urban structure we will make use of a typology based on the presence of
global centres, national capitals and second tier cities. In doing so we will be guided
by the ESPON project SGPTD, which identifies 31 capitals and 124 second tier cities
(Figure 26). Alternatively we can make use of the ‘metro regions’ concept identified
by the European Commission (Figure 27).
Figure 26 Urban structure across the Espon Space
4 Speaking at ESPON Internal Seminar, November 2012, Paphos, Cyprus

ESPON 2013 104
Source: Reproduced from the ESPON project SGPTD, Final Report, Map 1, p.2

ESPON 2013 105
Figure 27 EU Metro regions
Border regions
Using the territories of cross-border cooperation (Figure 28) we can examine whether
border region status has an influence on levels of resilience.

ESPON 2013 106
Figure 28 Border regions
Mountain regions
The study will examine whether mountain region status has an influence on measured
levels of resilience (Figure 29)

ESPON 2013 107
Figure 29 Mountain regions
Island Regions
The study will examine whether Island region status has an influence on measured
levels of resilience (Figure 30)

ESPON 2013 108
Figure 30 Island Regions
Sparsely Populated Regions
The study will examine whether Sparsely Populated region status has an influence on
measured levels of resilience (Figure 31)
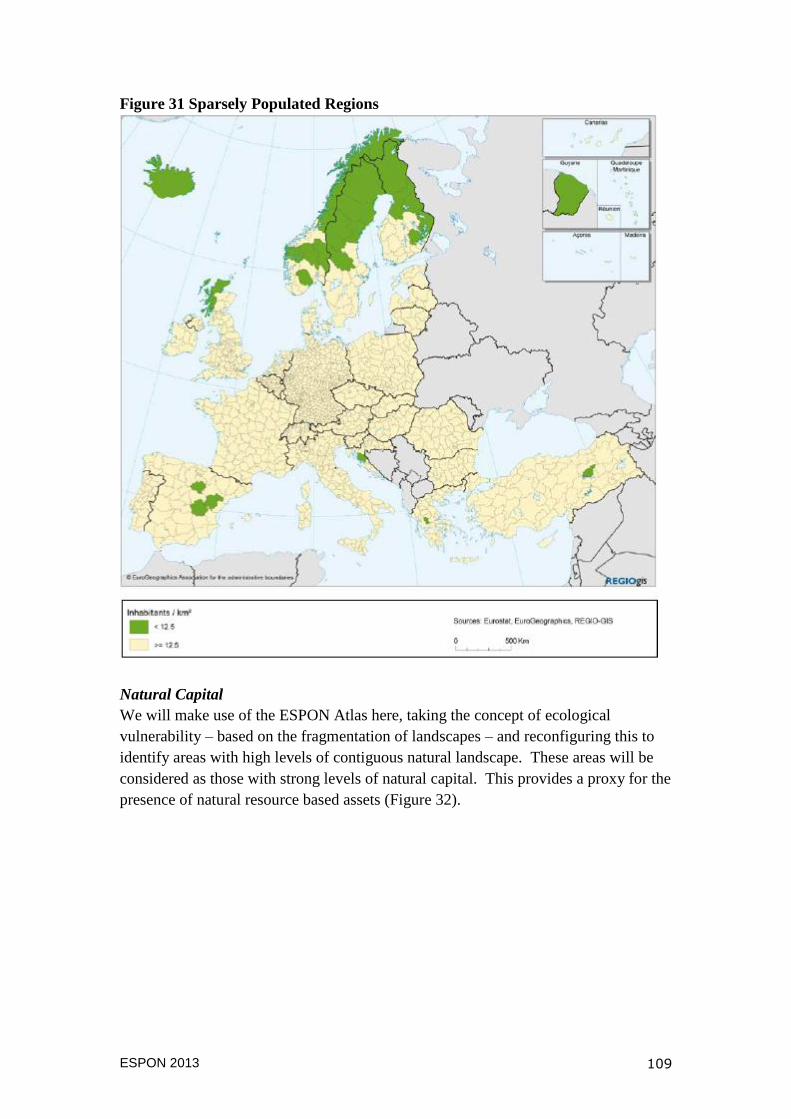
ESPON 2013 109
Figure 31 Sparsely Populated Regions
Natural Capital
We will make use of the ESPON Atlas here, taking the concept of ecological
vulnerability – based on the fragmentation of landscapes – and reconfiguring this to
identify areas with high levels of contiguous natural landscape. These areas will be
considered as those with strong levels of natural capital. This provides a proxy for the
presence of natural resource based assets (Figure 32).

ESPON 2013 110
Figure 32 Extent of natural capital
Source: ESPON Atlas (p.46)
Spare Capacity
Whilst spare capacity has been highlighted by commentators in the field of economic
resilience it is a challenging indicator to measure on a regional cross-national
comparative basis. It is also unclear whether all forms of spare capacity are fully
transferable, raising the spectre of shortages in the supply of some forms of capacity
whilst surpluses exist elsewhere. It is considered that this indicator will need to be
treated in a more qualitative context.
Local property market (vacancy rates/house prices)
Whilst there is good evidence of the potential offered by this indicator at the local
level it remains difficult to operationalise across the ESPON territory. Further work
will be undertaken in this area.

The ESPON 2013 Programme is part-financed by the European Regional Development Fund, the EU Member States and the Partner States Iceland, Liechtenstein, Norway and Switzerland. It shall support policy development in relation to the aim of territorial cohesion and a harmonious development of the European territory.
ISBN