ecosystem services in rangelands: paradigm change from supply to reconciling supply & demand...
TRANSCRIPT

Ecosystem Services in Rangelands: Paradigm Change from Supply to Reconciling Supply &
Demand
Osvaldo Sala

http://www.personal-mastership.com/contribution-community/gratitude-for-ecosystem-services
Ecosystem Services: benefits people obtain from ecosystems

Jornada LTER VI Project
• Objective 6 a: Broad-scale patterns and trends in drivers in socio-ecological states
• Specific objective of quantifying trends in socio-economic drivers
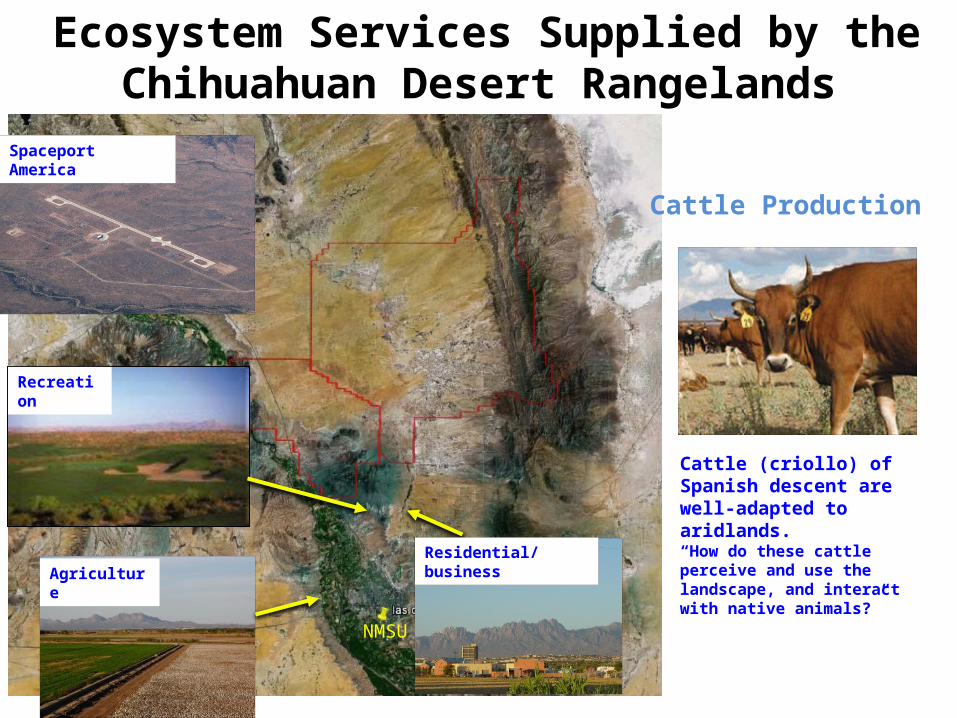
Ecosystem Services Supplied by the Chihuahuan Desert Rangelands
Cattle (criollo) of Spanish descent are well-adapted to aridlands. “How do these cattle perceive and use the landscape, and interact with native animals?”
Cattle Production
Spaceport America
Recreation
Residential/businessAgriculture
NMSU


Scopus in 2012 (Modified from Rositano et al. 2013.)
Refe
renc
es to
Eco
syst
em s
ervi
ces
Number of scientific publications related to Ecosystem Services over 1963-2012
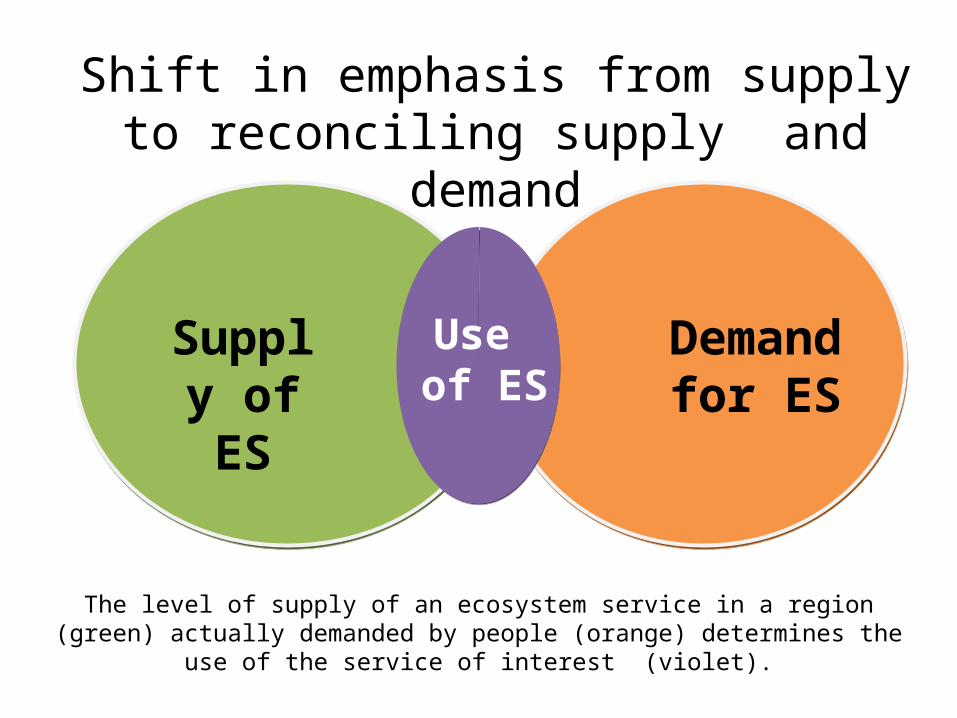
Supply of ES
Demand for ES
Use of ES
The level of supply of an ecosystem service in a region (green) actually demanded by people (orange) determines the use of the service of interest (violet).
Shift in emphasis from supply to reconciling supply and demand

Demand for Ecosystem Services in United States
Drylands

Figure 2Vi
sito
rs B
LM la
nd (M
illio
ns/y
ear)
Hun
ters
BLM
land
(M
illio
ns/y
ear)
1,4
1,5
1,5
2000 2002 2004 2006 2008 2010
0
5
10
15
20
25
30
35
40
45
1994 1996 1998 2000 2002 2004 2006 2008 2010 2012
Wild
life
view
ers
(Mill
ions
/yea
r)Vi
sito
rs o
nto
Nati
onal
Par
ks
(Mill
ions
/yea
r)
A
C
0
2
4
6
8
10
12
14
1998 2000 2002 2004 2006 2008 2010
0
10
20
30
40
50
60
1980 1985 1990 1995 2000 2005 2010
B
D
Yahdjian, Sala, Havstad, Frontiers 2015 13: 44-51
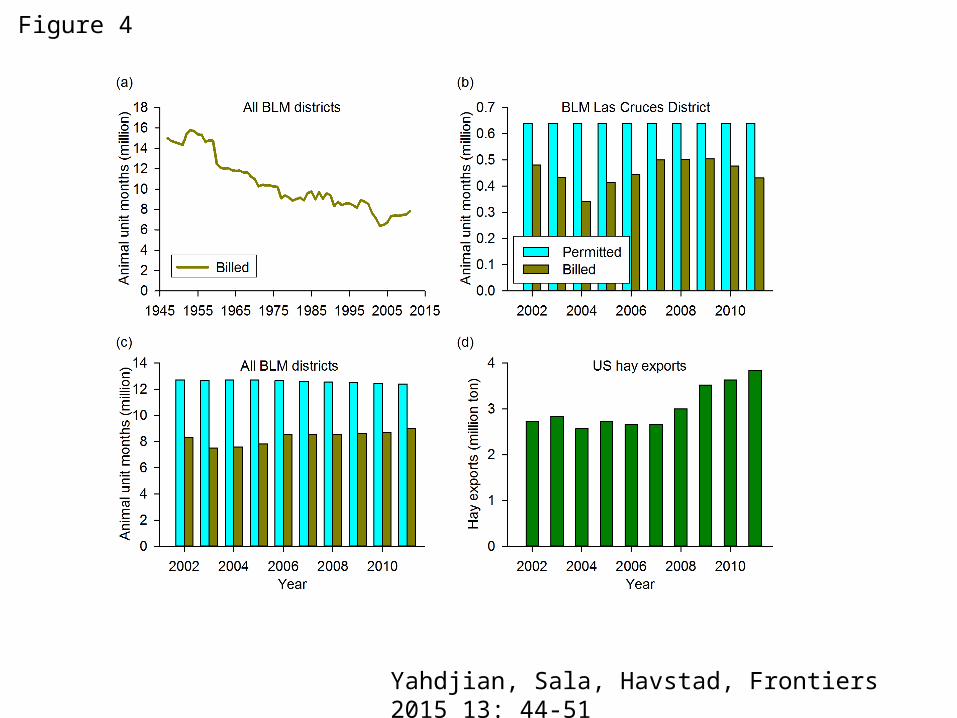
Figure 4
Yahdjian, Sala, Havstad, Frontiers 2015 13: 44-51

Popu
latio
n in
10
arid
US
Stat
es(M
illio
ns)
-
5
10
15
20
25
1980 1985 1990 1995 2000 2005 2010
TOTALMetroNon-MetroRural
Demand for Ecosystem Services in Other Areas of the World

The demand for ES in different regions of the world
National Parks
Provisioning Suporting
CulturalRegulating
Urban area
Developed regions
Agricultural area
Resorts
Rural area
National Parks
Urban area
Developing regions
Agricultural area
Resorts
Rural area
Modified from data in Martín-López 2012, PLoS ONE; Castro 2011, J. Arid Env; Zhen 2010, Environ. Res. Lett

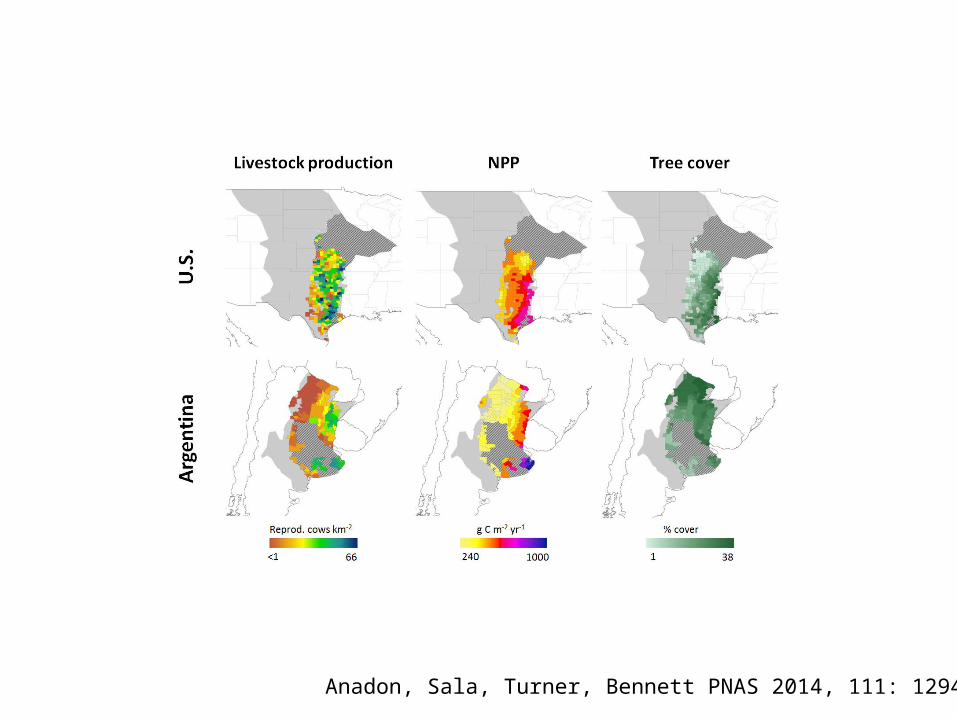
LIVESTOCK PRODUCTION IS A MAJOR PROVISIONING ECOSYSTEM SERVICE
FROM RANGELANDS
• Effects of woody-plant encroachment• A comparison of North and South America

LP = B0 + B1 NPP + B2 Tree Cover + Error
Hypotheses

Anadon, Sala, Turner, Bennett PNAS 2014, 111: 12948-53
Anadon, Sala, Turner, Bennett PNAS 2014, 111: 12948-53

Relative importance of ecological drivers on livestock production in woody encroached grasslands of two contrasting countries
Estimate p-value Estimate p-valueIntercept -40.8044 0.8424 -22.75 0.6015NPP 0.133 <0.0001 0.09796 <0.0001Tree cover -0.5754 0.0005 1.1360 0.0006NPP*Tree cover - n.s. -0.003 0.0001
R2 24.01 50.26
Anadon, Sala, Turner, Bennett PNAS 2014, 111: 12948-53

U.S. Argentina
Exp
lain
ed
va
ria
nce
(%
)0
10
20
30
40
50
pure NPPpure TCinteraction NPP-TC
Anadon, Sala, Turner, Bennett PNAS 2014, 111: 12948-53

Number of cattle and the agricultural population decreased during 1960-2005 in grasslands of the US while it remains constant in Argentinean grasslands
1960 1970 1980 1990 2000
% o
f var
iatio
n in
tota
l cat
tle0.
650.
750.
850.
95
Years
ARGUS
1980 1990 2000
% o
f va
riatio
n in
ag
ricu
ltura
l po
pu
latio
n0.
60.
70.
80.
91.
0
Years
ARGUS
Number of cattle
Agricultural population
Anadon, Sala, Turner, Bennett PNAS 2014, 111: 12948-53

Land use = ʄ ∑jn [(ESj supply), (∑i
n(ESj Demand stakeholder i *
Political Power stakeholder i ))]
Conclusion

Future
• Demand for other ecosystem services
• Demand for ecosystem services in diverse socio-economic setting
• Use managed relocation heuristic tool to assess brush control practices

Thank you

Ecosystem Services
Millennium Ecosystem Assessment (2005) Ecosystems & Human Well-being: Synthesis Report, Island Press

Demand for Ecosystem Services
How can we quantify the demand for ES?Which kind of ES are more demanded? How does demand change among stakeholders and regions? Which are the main drivers of ES demand?
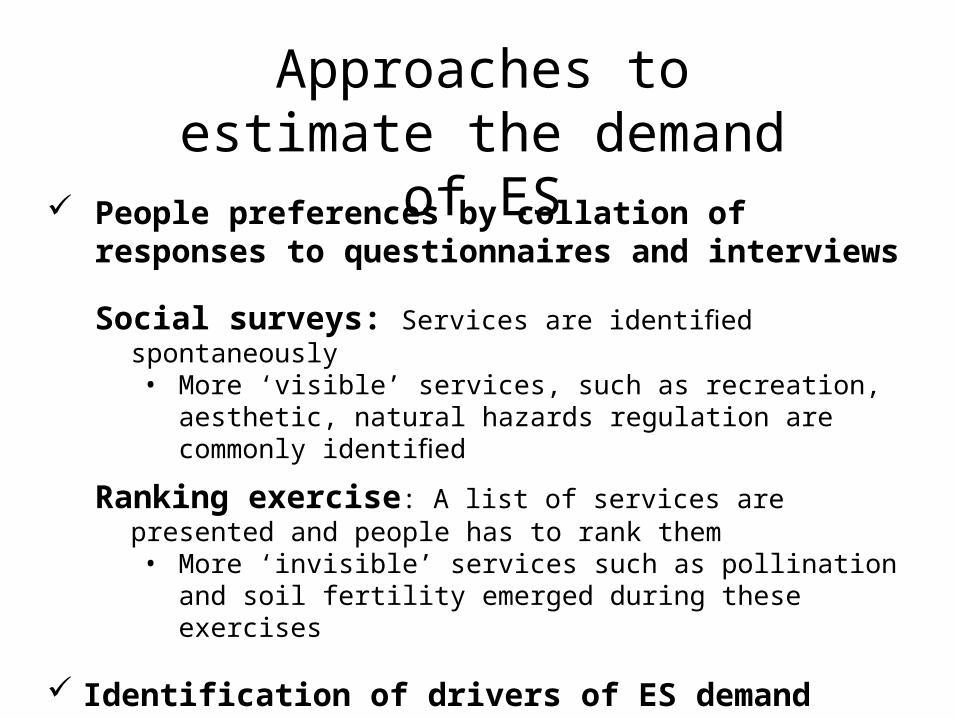
Approaches to estimate the demand of ES
People preferences by collation of responses to questionnaires and interviews
Social surveys: Services are identified spontaneously • More ‘visible’ services, such as recreation, aesthetic, natural
hazards regulation are commonly identified
Ranking exercise: A list of services are presented and people has to rank them • More ‘invisible’ services such as pollination and soil fertility
emerged during these exercises
Identification of drivers of ES demand• Collection and analysis of statistics
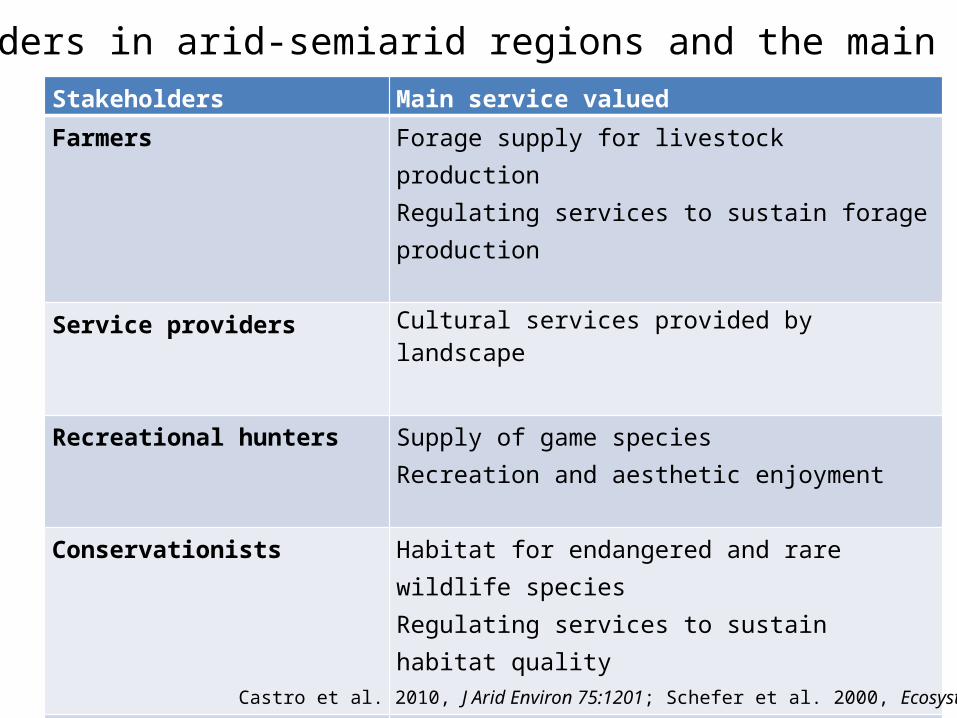
Stakeholders Main service valued
Farmers Forage supply for livestock productionRegulating services to sustain forage production
Service providers Cultural services provided by landscape
Recreational hunters Supply of game species Recreation and aesthetic enjoyment
Conservationists Habitat for endangered and rare wildlife species Regulating services to sustain habitat quality
Passive Nature tourists Recreation and aesthetic enjoyment
Active Nature tourists Recreation and aesthetic enjoyment Habitat for wildlife species
Stakeholders in arid-semiarid regions and the main ES valued
Castro et al. 2010, J Arid Environ 75:1201; Schefer et al. 2000, Ecosystems 5:451

Provisioning(Food production)
Supporting(Biodiversity )
Regulating(Carbon sequestration)
Cultural(Recreation )Ec
osys
tem
ser
vice
cla
sses
Supply of ES
Use of ES
Demand of ES
Modified from data in Carpenter et al. 2012. PNAS 106:1305
Supply and Demand for different ES

Drivers of Ecosystem Services DemandMonthly income Level of formal educationUrban vs. rural settingGeographic locationEnvironmental awarenessCultural valuesAgeGender Available technologies to replace ecosystem services

Supply of ES
Use of ES
Demand of ES
Pre-settlement:the supply of ES surpassed the demand
Present:the demand for ES is not fully satisfied by the supply
Future:the demand for ES will surpassed the supply
Supply & Demand through Time
?
Modified from data in Carpenter et al. 2012. PNAS 106:1305
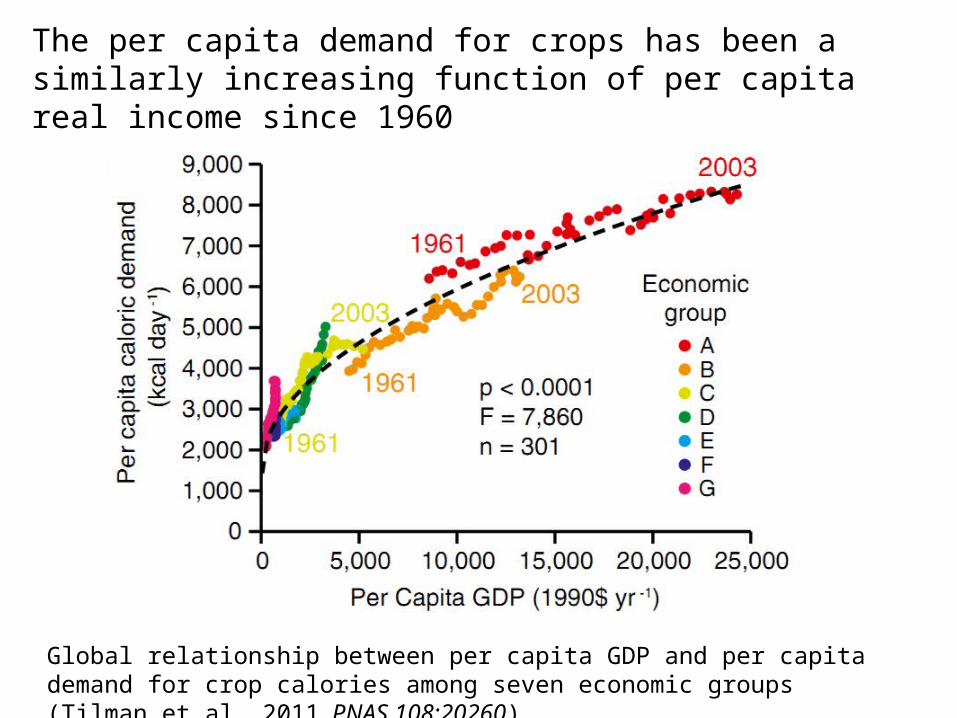
The per capita demand for crops has been a similarly increasing function of per capita real income since 1960
Global relationship between per capita GDP and per capita demand for crop calories among seven economic groups (Tilman et al. 2011, PNAS 108:20260)
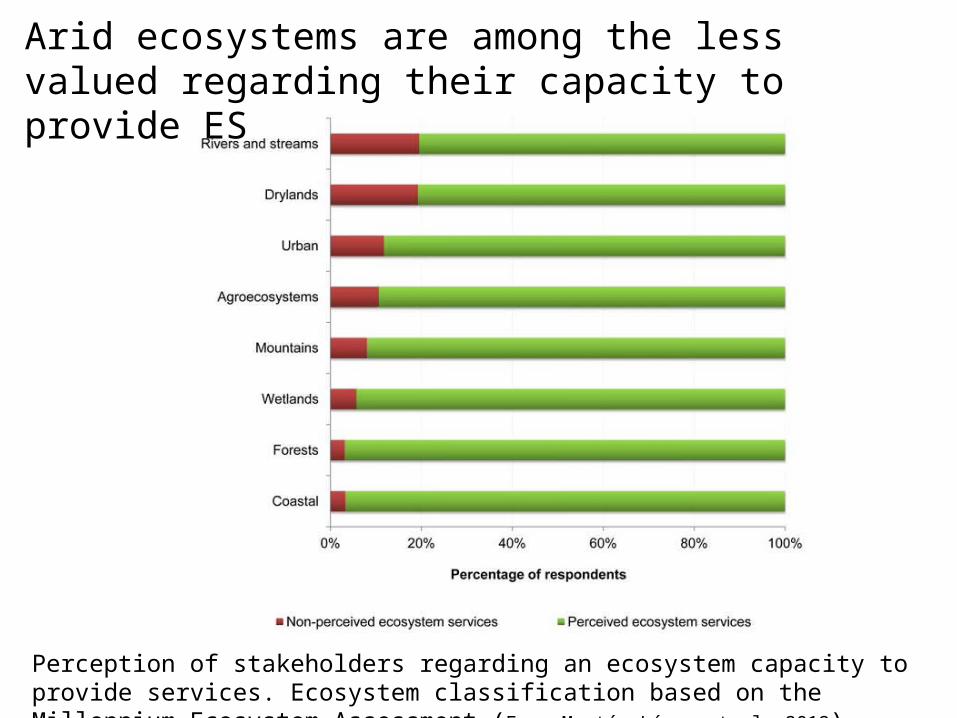
Perception of stakeholders regarding an ecosystem capacity to provide services. Ecosystem classification based on the Millennium Ecosystem Assessment (From Martín-López et al, 2012)
Arid ecosystems are among the less valued regarding their capacity to provide ES

PS: Provisioningservices
SS: Supporting services
CS: Cultural services
RS: Regulating services
Demand for Ecosystem
Services by different
stakeholders
PS
RS
SS
CS
FarmersPS
RS
SS
CS
Service providers
PS
RS
SS
CS
Recreational huntersPS
RS
SS
CS
Conservacionists
PS
RS
SS
CS
Passive nature touristsPS
RS
SS
CS
Active nature tourists

Hypothesized Trends in Demand in Ecosystem Services
Provisioning
Regulating
Supporting
Cultural
Rel
ativ
e de
man
d fo
r ec
osys
tem
ser
vice
s (%
)
Yahdjian, Sala, Havstad, Frontiers 2015 13: 44-51