ecosystem monitoring program 2018 water quality conditions
TRANSCRIPT

Ecosystem Monitoring Program 2018 – water quality conditions
Joe Needoba
OHSU-PSU School of Public Health
Oct 23, 2018

Sensor Networks in the Columbia River estuary

River Discharge at Bonneville
Min/Max time period 2009-2018
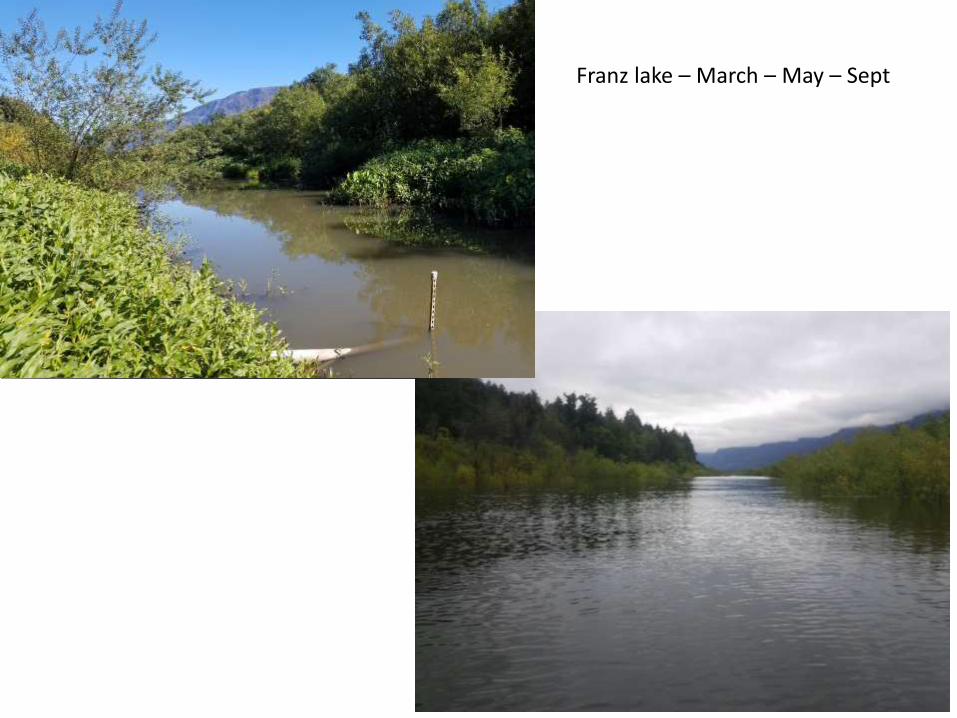
Franz lake – March – May – Sept

River Discharge at BAT
Bonneville – Willamette – Other tributaries

Mainstem Temperature

Average # days where river temperature is > 19°C

EMP YSI Sonde Deployments


Temperature of EMP sites compared to Mainstem

Temperature of EMP sites compared to Mainstem

Temperature of EMP sites compared to Mainstem

Temperature of EMP sites compared to Mainstem

Temperature of EMP sites compared to Mainstem

Temperature of EMP sites compared to Mainstem

Temperature of EMP sites compared to Mainstem


Dissolved Oxygen - potential for hypoxia

“Greening” of the River
Sullivan et al. (2001)

Nutrient Transformation in Two Different Rivers

Water column light and stratification measurements

Field work: weekly sampling for one year
Credit: Stuart Dyer

The Water Column is Homogeneously Mixed in Both Rivers: Depth Profiles
Dissolved oxygen Oxygen saturation
Temperature Conductivity

The Water Column is Homogeneously Mixed in Both Rivers: Depth Profiles
• Both rivers usually less then 2% different between surface and photic zone limit
• Occasional variation of up to 5%
• Willamette more irregular
• Comparison: heavily stratified Ross Island Lagoon had 36% temperature difference, 12% conductivity difference

The Water Column is Homogeneously Mixed in Both Rivers: Chlorophyll a
Chlorophyll patterns: early summer phyto bloom in Columbia, late bloom in Willamette

The Water Column is Homogeneously Mixed in Both Rivers: Chlorophyll a
• Chlorophyll concentrations were very close to each other between depths
• Result expected despite differing rates of photosynthesis between depths

The Water Column is Homogeneously Mixed in Both Rivers: Nitrate and Ortho-Phosphate
Nitrate was the same between depths

The Columbia has a deep photic zone most of the year

BOD Bottle Incubations Isolate Plankton Production from Different Depths
• BOD experiments to measure production and respiration in isolated samples
• Samples divided into two groups, incubated under full spectrum light and in darkness
• Change in dissolved oxygen shows rate of production and respiration

BOD incubations from different depths

NEM Open Water Technique
• Use average decrease in dissolved oxygen at night to infer respiration rate
• Increase in oxygen during daytime allows calculation of Net Ecosystem Metabolism and primary production

Comparing Sensor and BOD Results
• Columbia River is autotrophic most of the year
• Willamette slightly autotrophic, strongly heterotrophic in summer

Comparing Sensor and BOD Results

Trophic State
Willamette River:
Gross: 566Net: - 236
Columbia River:
Gross: ~631Net: + ~233