economy and environment program for southeast asia across the municipalities of nabas, malay and...
TRANSCRIPT

Economic Valuation of Conserving Endangered Species and Their Habitats in the North Western Panay Peninsula, Central Philippines
Rodelio Subade Evelyn Jugado
September, 2010
Economy and Environment Program for Southeast Asia

WHAT IS EEPSEA?
The Economy and Environment Program for Southeast Asia was established in May 1993 to support training and research in environmental and resource economics. Its goal is to strengthen local capacity in the economic analysis of environmental problems so that researchers can provide sound advice to policy-makers. The program uses a networking approach to provide financial support, meetings, resource persons, access to literature, publication avenues, and opportunities for comparative research across its nine member countries. These are Thailand, Malaysia, Indonesia, the Philippines, Vietnam, Cambodia,
Lao PDR, China, and Papua New Guinea.
EEPSEA’s structure consists of a Sponsors Group, comprising all donors contributing at least USD 100,000 per year, an Advisory Committee of senior scholars and policy-makers, and a secretariat in Singapore. EEPSEA is a project administered by the International
Development Research Centre (IDRC) on behalf of the Sponsors Group.
EEPSEA TECHNICAL REPORTS
EEPSEA Technical Reports include studies that are either too academic and/or technical for wider circulation. It also includes research work that are based on short-term inquiries on specific topics (e.g. case studies) and those that are already published as part of EEPSEA special publications (e.g. books).

Economic Valuation of Conserving Endangered Species and Their
Habitats in the North West Panay Peninsula, Central Philippines

CONTENTS
Section Page ABSTRACT.………………………………………………………………. 1 1.0 INTRODUCTION………………………………………………………… 2 1.1 Background………………………………………………………………… 3 1.2 Significance of the Study. ………………………………………………… 4 1.3 Objectives…………………………………………………………………. 4 2.0 LITERATURE REVIEW……………………………………………….. 5 2.1 Conservation and Management Plan for the North West Panay Peninsula... 5 2.2 Application of Contingent Valuation Method (CVM) Studies on Endangered
Species Conservation……………………………………………………..… 6 2.3 Contingent Valuation and Self-Administered Survey……………………... 7 3.0 METHODOLOGY…………………….... ……………………………… 8 3.1 Survey Methods…………………….... ………………………………….. 8 3.2 Questionnaire Design…………………….... ……………………………… 8 3.3 Training of Enumerators. ………………………………………………… 9 3.4 Pre-Test and Bid Levels. …………………………………………………. 9 3.5 Payment Vehicles and Scopes of the Good. ……………………………… 10 3.6 Sampling plan and procedure. ……………………………………………. 11 3.7 Contingent Valuation of Biodiversity Conservation and CVM Question
Format …………………………………………………………………….. 12 3.8 Dealing with Protest Votes. ………………………………………………. 13 3.9 Adjustments for Uncertainty. ……………………………………………… 14 4.0 RESULTS AND DISCUSSIONS. ………………………………………. 15 4.1 Knowledge and attitudes toward endangered species conservation. …… 15 4.2 Willingness to Pay for Conservation. …………………………………….. 19 4.3 Reasons for WTP. ………………………………………………………… 21 4.4 Reasons for Non WTP. …………………………………………………… 22 4.5 Determinants of Willingness to Pay. ……………………………………… 23 4.6 Parametric and Non-Parametric Mean WTP Estimation of Conserving
NWPP Species and Habitats. …………………………………………… 24 4.7 Social Willingness to Pay vs. the Costs of Conservation, and
Some Policy Options. …………………………………………………….. 24
5.0 SUMMARY AND CONCLUSIONS. …………………………………… 26 REFERENCES. …………………………………………………………. 27 APPENDICES. ………………………………………………………….. 32
TABLES Page Table 1 Sampling Plan and Design. ………………………………………………... 11 Table 2 Attitudes of Respondents toward Endangered Species Conservation…….. 16 Table 3 Species Ranking by Respondent, as to Priority for Protection…………….. 18 Table 4 Respondents WTP for Conservation of Endangered Species and
Habitats at NWPP…………………………………….................................. 19 Table 5 Reasons for Respondents’ Willingness to Pay……………………………. 21 Table 6 Reasons for Respondents’ Non-Willingness to Pay………………………. 22 Table 7 Variable Definitions, Mean, and Standard Deviations……………………. 23 Table 8 Regression Results of WTP Model When Protest Votes were Removed and
Certainty was Adjusted………………………………………………... 23 Table 9 Parametric and Non-Parametric Estimation of Mean WTP……………….. 24 Table 10 Respondents’ Social Willingness to Pay……………………………… 25
FIGURES Page Figure 1 Distribution of Respondents by Payment Vehicle and Scope……………. 16 Figure 2 Willingness to Pay Results after Adjustments for Certainty and Removal of Protest Votes ………………………………………………………….. 20
APPENDICES Page Appendix 1 Map of Pandan, Antique, Philippines. ……………………………… 32 Appendix 1A Opportunity Costs Table assuming that 100% of the total households
covered by NWPP would be affected………………………………. 33 Appendix 1B Opportunity Costs Table assuming that 100% of the total households
covered by NWPP would be affected, but allowing harvesting of some raw materials, enabling people to come up with certain finished products, crops like and copra……………………………………… 35
Appendix 2A Opportunity Costs Table assuming that 30% of the total households covered by NWPP would be affected……………………………… 37
Appendix 2B Opportunity Costs Table assuming that 100% of the total households covered by NWPP would be affected, but allowing harvesting of some raw materials, enabling people to come up with certain finished products, crops like vegetables and copra……………………….… 39

1
Economic Valuation of Conserving Endangered Species and Their Habitats in the North West Panay Peninsula, Central Philippines
Rodelio Subade1 and Evelyn Jugado2
ABSTRACT A Self-Administered-Contingent Valuation Method (SA-CVM) survey was used to determine the non-use values or willingness to pay (WTP) of San Jose, Antique and Kalibo, Aklan respondents on conserving endangered species and habitats of Northwest Panay Peninsula National Park (NWPPNP). The study examined two payment vehicles as regards their potential for soliciting people’s WTP and possible financing source for conservation: electric bill surcharge and the annual community tax collected by the local government treasury. The study found that people have high level of awareness of the importance of endangered species conservation but when compared with other environmental concerns, it was perceived as of less priority. When asked for specific (monetary) commitment or WTP to conserve NWPPNP, the majority was unwilling or non-committal. Results also revealed to a low and flat WTP curve, “yea” saying, and some bias toward a certain denomination. Based on the dichotomous choice CVM survey, results confirm the low WTP of respondents since only up to 14 percent were willing to pay for the hypothesized conservation fund for NWPPNP’s endangered species and habitats. This is almost the same proportion as those who were willing to pay through either of the payment vehicle groupings. The main motivations for their WTP were bequest and use values. On the other hand, the survivor function estimates of mean WTP showed that the average respondent was willing to pay as contribution to the conservation fund amounts ranging from PhP 122 to PhP 176 per year. These WTP estimates can collect a modest social WTP of PhP 2.7-3.9 million, which is not sufficient to cover the opportunity costs of conservation. Thus, sourcing conservation funds for NWPPNP should go beyond the local residents. Keywords: Self-administered-contingent valuation method survey, Willingness to pay
(WTP), Northwest Panay Peninsula National Park (NWPPNP), non-use values, denominational bias, yea saying
1 Associate Professor, University of the Philippines in the Visayas, Project Leader ,and Corresponding
Author. E-mail: [email protected]. 2 Research Assistant, University of the Philippines in the Visayas. * Ms. Cheryl Joy Fernandez and Mr. Paul Erwen Parreño provided field research and data encoding
assistance. The efforts of field research assistants are duly acknowledged.

2
1.0 INTRODUCTION
The Philippines has indicated its willingness to participate in the world-wide effort of conserving the precious biodiversity resources, embodied by the various species, many of which have been classified as endangered or threatened by the International Union for the Conservation of Nature (IUCN) and the Convention on International Trade in Endangered Species of Wild Flora and Fauna (CITES). The government ratified the CITES agreement in November 1981 as accession to its aim of ensuring that international trade of specimens of wild animals and plants does not threaten their survival. Moreover, among various laws formulated by Congress, the enactment of the 1993 National Integrated Protected Area System Act (Republic Act No. 7586) or NIPAS act has become one of the leading legal instruments in the establishment of protected areas across the country and in arresting biodiversity and species loss. Complementary to this is Republic Act 9147, passed on July 30, 2001, which provides for the conservation of wildlife resources and their habitats, appropriating funds thereof and for other purposes. Subsequently, various department administrative orders (DAOs) have been issued to ban the harvest or catching of endangered species like marine turtles, hornbills, warty pigs, and dugongs. However, despite the steps taken by the government, funding for conservation of biodiversity, endangered species and their habitats have been limited. There has been so much demand for funding public goods and services to cater the needs of the burgeoning population. Since 2004, the government has admitted its big budget deficit problem, such that appropriation for biodiversity and endangered species conservation will be both insufficient and uncertain. Furthermore, Republic Act 9147 does not specify the amount of budget to be appropriated for the conservation of wildlife resources and habitats; instead it states that the budget will be part of the allocation for the Department of environment and Natural Resources (DENR). The NIPAS Act provides for an integrated protected area fund, but its sources are not regular and uncertain as well (Anda 2006). Usually the seeming lack of a government’s priority and budget appropriation for public goods like endangered species and biodiversity conservation have been attributed to the lack of information on the potential benefits and economic value to be derived from conservation. Most of this is accounted for by the conservation value reflected in the non-use values of citizens. As one of the basic problems in environmental attributes preservation and improvement, resource under-valuation or the failure of either the market or government to capture all the benefits of the natural resource/environment can lead to the overuse, misallocation or extinction of the environmental resources like wildlife species and their habitats. The lack of information on how citizens value conservation, particularly non-use values, can easily weaken a government’s resolve in consistently allocating annual budget for conservation. As Dixon and Sherman (1990) explain it, “for various economic reasons that economists call market failure, the benefits of protection [and conservation] are only partly accounted for whereas the costs of protection receive thorough coverage. As a result, fewer [and smaller] areas are protected than is socially desirable. And because governments find it difficult to capture these benefits, the budget allocation for the management of protected areas, are frequently inadequate.”

3
Among several endangered species and habitats not provided sufficient government funding for conservation in the Philippines are the species and habitats in the North West Panay Peninsula National Park. 1.1 Background Sprawling across the municipalities of Nabas, Malay and Buruanga in Aklan province and the municipalities of Libertad and Pandan in Antique province, the Northwest Panay Peninsula is a recognized Important Bird Area (IBA) and includes probably the most extensive piece of lowland forest remaining within the Negros and Panay Endemic Bird Area (Curio 2003).
In recent years, surveys have recorded many highly threatened bird and mammal species, including the Negros bleeding-heart pigeon Gallicolumba keayi (critically endangered), Visayan tarictic hornbill Penelopides panini panini (endangered), Visayan wrinkled hornbill Aceros waldeni (critically endangered), white-winged cuckoo-shrike Coracina ostenta (vulnerable), green-faced parrotfish Erythrura viridifacies (vulnerable), and Visayan warty pig Sus cebifrons (critically endangered) (Curio 2002). Moreover, as a less studied site, various species not yet recorded, have been discovered mainly by the Frankfurt Zoological Society-supported Philippine Endemic Species Conservation Program (PESCP) in the site such as Ardea cinera (grey heron), Ardeola speciosa (Javan pond heron), Gorsachius giosagi (Japanese night heron), Anas clypeata (European northern shoveler), Ophiophagus Hannah (king cobra), Elaphe erythrura psephenoura (rat snake), Python reticulates (reticulated python), Ptenochirus jagori (musky fruit bat) and 17 endemic butterfly species. Some scientists claim that the Northwest Panay Peninsula may qualify for a world record of biodiversity as measured by the number of animals and plants per square kilometer. However, due to lack of studies, much needs to be accounted for on the site’s biodiversity in terms of the number of species, particularly those endemic to the site. Hence, there is a great imperative for conserving the area.
Recognizing the rich biodiversity of the site and the country’s commitment to biodiversity conservation as enshrined in the NIPAS Act of 1992, the Rio Summit of 1992 and the United Nations Convention on Biological Diversity, Philippine President Gloria Macapagal Arroyo signed a declaration in April 2002 establishing the Northwest Panay Peninsula Natural Park (NWPPNP). However, the process of integrating the area into the National Integrated Protected Area System as embodied in Republic Act 7586 of 1992 will take some time in order to define the different zones (and use zones) of the area. In 2003, a participatory community mapping undertaken by Green Forum recommended specific areas for the management plan of the 12,000-hectare protected area. This however needs counterchecking by the Department of Environment and Natural Resources (DENR) and other agencies.
Vis-à-vis the NWPPNP’s gargantuan potential for its biodiversity richness, various problems and threats underscore the need for conserving the species and habitats at the North West Panay Peninsula. In the meeting of the Northwest Panay Biodiversity Management Council (NPBMC) held on October 15, 2002, all Council members participated in the Advocacy Agenda Formulation workshop and identified several threats to the existence and conservation of the NWPPNP. Among these are: mining interests and

4
potentials in the site, timber poaching, slash and burn farming, squatting and intrusion of settlers, wildlife collection, and bio-prospecting.
Considering these threats, conserving the NWPPNP will not be an easy task. The conservation efforts that PESCP and Biodiversity Conservation Trust of the Philippines, Inc (BIOCON) have embarked on in the past few years include having forest patrols (forest rangers); confiscation, rehabilitation, and release of wildlife that had been illegally caught and domesticated; community organizing, introduction of alternative livelihood like agro-forestry for communities affected by the protected area establishment; information, education and communication campaigns.
Sustaining and more so improving these conservation efforts will require resources, particularly funding. The government has very minimal expenditures on conserving the area because most of the costs incurred were shouldered by PESCP and BIOCON, which in turn obtained funding from other agencies and donors.
This study intends to determine if the NWPPNP is valuable to citizens and whether potential economic values for conserving it can cover the costs of conservation. In particular, the study will determine if the economic benefits will exceed the full costs of conservation. 1.2 Significance of the Study This study provides information on how residents of the Aklan and Antique provinces value the endangered species and habitats in NWPPNP through their willingness to pay for their conservation. The results of this study can provide inputs in exploring alternative sources of financing the conservation program. 1.3 Objectives The general objective of this research is the economic valuation of conserving the endangered species and habitats in the Northwest Panay Peninsula National Park (NWPPNP). Specifically, this study aims to:
1. Determine respondents’ awareness of and attitudes toward the conservation of the endangered species and habitats in the NWPPNP.
2. Estimate the economic value of conserving the endangered species and habitats in NWPPNP through people’s willingness to pay.
3. Determine factors affecting people’s willingness to pay. 4. Estimate potential revenues that can be raised for conservation through
determining peoples’ willingness to pay under two different payment vehicles -- community tax or electric bill surcharge.
5. Determine the costs and benefits of conserving the NWPPNP. 6. Provide policy recommendations for the conservation of NWPPNP.

5
2.0 LITERATURE REVIEW 2.1 Conservation and Management Plan for the North West Panay Peninsula Presently the conservation efforts in the NWPP are led by the PESCP and BIOCON, both nongovernment organizations (NGOs) that have been working in the area for the past years. PESCP started its efforts in 1996 while BioCon, formed by PESCP in 2001, is now an independent NGO. Both were instrumental in the formation of the Northwest Panay Biodiversity Management Council (NWPBMC), an umbrella organization of NGOs, local government units (LGUs), national government agencies (NGAs), and people’s organizations. The NWPBMC serves as an advisory and policymaking body for the NWPP. Based from the work of these organizations, mainly PESCP and BIOCON, the present conservation efforts can be outlined as follows:
1. Community and Institution Building. BioCon has formed and capacitated at least 10 people’s organizations (POs) located in different barangays (villages). These were trained in effective management of their natural resources aimed at conserving endangered species and biodiversity in the NWPP. Both BIOCON and PESCP helped form the NWPBMC.
2. Livelihood. Both NGOs have worked toward establishment of livelihood projects in order to reduce or remove the people’s dependence on the forest/protected area’s products, thereby reducing threats of habitat destruction. These include agro-forestry and sustainable agriculture through cultivation of crops and livestock.
3. Information and Education Campaigns (IEC). PESCP’s wildlife educators regularly conduct conservation education campaigns. BioCon, on the other hand, assists in the annual Pista Ng Gubat, a forest conservation- focused festival.
4. Forest Ranger-based Habitat Protection and Law Enforcement. PESCP currently employs 14 forest rangers (FRs) at modest salary, equipped with basic communication equipment per team. Due to budget constraints, they operate 18 days in a month only. The FRs patrol and monitor the forests not only in NWPP but also in the Central Panay Mountain Range
A Conservation Management Plan for the endangered species and their habitats in NWPP will involve the above-mentioned aspects, and will entail increasing the present level of management efforts, characterized by:
1. Doubling of the numbers of forests rangers equipped with communication facilities.
2. Increased livelihood projects to cover all barangays in the NWPP in order to further reduce the people’s dependence on forests and their products for their daily needs.
3. Setting up of about 4-6 permanent camps for forest rangers in areas of the NWPP highly exposed to illegal logging threats.
4. Use of species-specific conservation measures like nest-hole stewardship and protection for hornbills and regular search for and removal of traps intended for birds, warty pigs and other species.
5. Increased scientific research and monitoring by Filipino scientists, with whom PESCP researchers may collaborate and share information.

6
Based on interviews with conservation biologists and officials of both PESCP and BIOCON, increasing the conservation efforts will likely lessen the risks posed on the endangered species. Specifically, it is possible that after five years, most, if not all, of the endangered species could be taken out of IUCN’s endangered species list. This also means that the viable population that can reproduce itself will be stable and adequate. 2.2 Contingent Valuation Method Studies on Endangered Species Conservation Endangered species provide a broad set of valuable services to society, many of which remain un-priced by the public sector. Because these public services are rarely bought and sold on the auction block, they never enter into private markets and thus remain un-priced. Since wildlife does not stay within the confines of either public or private property, many people enjoy the benefits or suffer the cost without compensation paid or received (Cherry et al. 2002). In the case of placing monetary value on environmental “goods” like endangered species conservation, contingent valuation is the most popular and widely used method. The contingent valuation method (CVM) estimates the economic value of environmental goods by placing survey respondents in a hypothetical market setting created for a particular species or group of species and asking them their willingness to pay (WTP) to either avoid the total loss of a population or increase the population size. Respondents pay the population described in the hypothetical scenario through payment vehicles. The payment vehicle can be as follows: increase in local taxes, entrance fees, surcharge on bills, higher prices, and other mechanisms. Reaves et al. (1999) provide evidence that CVM can elicit WTP values that satisfy convergent validity for goods with significant non-use values. In addition, Bulte and Van Kooten (1999) noted that non-use or preservation benefits are likely the most important non-market benefits especially when species are found in remote regions that are difficult to access. Estimates of non-use value for some endangered species are derived from CV studies employing either WTP to avoid loss of a species or WTP for a proposed gain in numbers (Bulte and Van Kooten 1999). To derive WTP figures, the CV surveys generally ask the respondent to indicate their WTP. According to Eagle and Betters (1998), WTP numbers (individual respondents) obtained from various CV surveys of threatened and endangered species (T&E) are relatively similar ranging from about US$9 to US$31 for a change in the respective species’ population. They noted that individuals may have a certain WTP threshold for T&E species, but these values may vary depending on the “goods” being valued and other determinants like payment vehicle and elicitation format. Shultz et al. (1998) used contingent valuation to determine the WTP of visitors of national parks in Costa Rica (Poas National Park and Miguel Antonio National Park). They found that the mean WTP (using entrance fees as payment vehicle) to Poas National Park was US$11 for residents and US$23 for foreigners and that for Miguel Antonio National Park was US$13 for residents and US$14 for foreigners. Loomis and Gonzalez-Caban (1998) also used a CV survey to estimate the economic value of implementing a fire management plans to reduce acres of old growth forest that burn in California and Oregon; they found that California and New England residents were willing to pay US$56 per household. Reaves et al. (1999), studying valuing endangered species (red cockaded woodpecker) and the restoration of its habitat following a natural disaster, found that mean WTP values for restoration of a red cockaded woodpecker population in South Carolina ranged from a low

7
of US$7.57 per person per year (payment card, protesters included) to a high of US$13.25 per person per year (double-bounded dichotomous choice, protesters deleted). Several studies have been undertaken on valuation of conserving endangered species or wildlife. While some had focused on valuation of single species conservation (Bowker and Stoll 1988-whooping cranes, Loomis and Larson 1994-gray whales), others attempted valuation of multiple species (Bulte and Van Kooten 1999-charismatic species, Carson et al 2000-bald eagle, kelp bass, peregrine falcon, white croaker, Hageman 1985-gray and blue whales), and few on endangered species and habitats (Reaves et al 1999-red cockaded woodpecker and the restoration of its habitat following a natural disaster, Jakobsson and Dragun 1996-conservation of Leadbeater’s possum vs. conservation of endangered flora and fauna). Numerous authors have found the CVM an appropriate tool in valuing environmental goods like endangered species conservation. A few studies also attempted to value multiple species and their habitats using CVM. It is indispensable to include aspects on biodiversity conservation as a whole because according to Cherry et al (2005), “valuing a single species do not address important ecological complementarities, since higher profile species may depend on the existence of other lower profile species, which may be an important link in biodiversity.” Bulte and Van Kooten (1999) also stressed that for policy purposes, it is important to elicit information on the value that people assign to ensure survival of a species and the value attribute to increasing numbers of the same species at the margin. 2.3 Contingent Valuation and Self-Administered Survey A self-administered-CVM (SA-CVM) survey had been recently used as a data collection tool by a few researchers. Jakobsson and Dragun (1996), for example, conducted a self-administered (mail) survey to residents of Victoria in Australia concerning their WTP to avoid either a decline in a number of endangered species (flora and fauna) or the loss of Leadbeater’s possum. The results show that the value expressed for the conservation of the Leadbeater’s possum is less than those values for the conservation of endangered flora and fauna in general, suggesting that the respondents valued one individual endangered species significantly less than a collection of endangered species SA-CVM has also worked in developing countries like the Philippines. Subade (2005) used a self-administered survey in his study of non-use values of conserving biodiversity for Tubbataha Reefs National Marine Park in the Philippines. He found that SA-CVM is an inexpensive and practical way of eliciting WTP information from respondents but it could suffer from non-participation and item non-response. He also noted that in contrast with SA, personal interviews require higher costs and are prone to interviewer and compliance bias. A considerable advantage of the self-administered survey is the potential anonymity of the respondent, which can lead to more truthful or valid responses. Also, the questionnaire can be filled out at the convenience of the respondent since there is no interviewer bias. Several approaches were developed to improve SA-CVM. The use of photographs, for example, can be used to illustrate the current situation of endangered species. Another one is proper translation of survey questionnaire so that the respondents could comprehend what the program or study is all about. Schechter et al. (1996) suggest ways on how to

8
improve self-administered surveys, as follows: “First, interviewing subjects about instrument format, appearance, and layout, as well as ease of instructions, may be a valuable first step in the questionnaire design process for self-administered instruments. Second, improvements to the questionnaire may be identified by conducting interviews after a mini field pretest in which questionnaires are mailed to recruited subjects, sent back to the laboratory, and analyzed. Subjects would then be brought to the lab for further testing of questionnaire versions. Certainly the most convincing evidence of problems based on reviewing completed instruments can come from the conventional pretests.”
3.0 METHODOLOGY 3.1 Survey Methods Primary data on the willingness to pay (WTP) of randomly selected residents in Kalibo, the capital town of Aklan province, and San Jose, the capital town of Antique province, were gathered through self-administered (SA) survey using the drop-off (DO) approach. These survey sites were chosen since they play crucial roles in the respective provincial governments’ decision-making process particularly in the allocation of budget for funding development projects and public goods. Moreover, they are the biggest urbanized towns in these provinces, though both can be considered rurban (more rural and some urban) compared with Metro Manila, Metro Davao and Metro Cebu, the three biggest metropolis in the Philippines. Two towns of Antique and three towns of Aklan cover the NWPPNP, hence the conservation of NWPPNP was expected to be of immediate concern for the residents of these provinces. In the case of Antique, its provincial symbol has the hornbill, two species of which are considered endangered and are found in the NWPPNP (though, according to Kunzel, (2006), PESCP assesses that the Aceros waldini or writhed-billed hornbill may no longer be inhabiting the area).
The drop-off approach has been proven to provide high return rates of completed questionnaires and is not prone to interviewer bias (Subade 2004). The DO mainly consists of:
1. Questionnaire distribution, where the enumerator/field survey assistant personally gives the questionnaire to the respondents at their homes, and concisely explains it to each of them in 5-10 minutes. The respondents are informed that they were randomly selected for the survey, and that the questionnaire should be answered by the respondent and, if possible, in consultation with her/his family members.
2. Follow-up and collection, which is undertaken a few hours after questionnaire distribution or the following day. Respondents, if available, are asked to answer on the spot the portion(s) of questionnaire that they were not able to answer.
3.2 Questionnaire Design As a conservation study sponsored by EEPSEA, this research adopted the common elements crafted through a series of meetings by the researchers from Vietnam, China and the Philippines, in consultation and coordination with the resource persons from EEPSEA: Dr. Dale Whittington, Dr. Vic Adamowicz, Dr. David Glover and Dr. Herminia Francisco.

9
The questionnaire is composed of five sections designed to collect the necessary information through the drop-off mode. Thus, its design should enable the respondents to understand the CVM scenario so that they could provide the data needed for the study. The five sections are as follows:
Introductory part: This portion introduced the researchers and the purpose of the study. It provided initial information on endangered species in North West Panay Peninsula. It also specified the right of the respondents to refuse to participate in the survey. It assured the respondents that their answers would be dealt with confidentiality.
Section 1: Questions on problems faced by your country: In this section, the
respondents were asked to rank the problems that they thought the country was facing.
Section 2: Attitude and knowledge section: This portion assessed respondents’
awareness and knowledge of endangered species, biodiversity, and the North West Panay Peninsula.
Section 3: Conservation and Management Plan for the NWPP and the WTP
Section: It provided information on North West Panay Peninsula and the Central Panay Mountain Range and their conservation plan. In this section, respondents were asked if they were in favor of a region-wide program to conserve endangered species specifically those found in the North West Panay Peninsula that would be added as a surcharge in their monthly electric bill or annual community tax.
Section 4: Socioeconomic characteristics of respondents and their households:
Respondents were asked to provide information on their household such as household water services, economic status and access to credit, membership in organization, and other personal information.
Section 5: Questions on time preferences: This section assessed the respondents’
time preferences and attitudes toward risk. 3.3 Training of Enumerators A set of guidelines in conducting drop-off self-administered survey was prepared and used in the training of survey assistants. Role-playing on how to deal with different situations or respondent was also done. The training-workshop lasted for at least two days and covered the topics of the questionnaire (endangered species, biodiversity, North West Panay Peninsula, etc.), role-playing, overview of economic valuation and CVM, etc. This training was quite similar to the training design by Whittington (2002) intended for personal interviewers of CVM. 3.4 Pre-Test and Bid Levels Five bids were used in the final survey. These were determined using a pre-test design by Whittington (2005). This pre-test involved selecting three prices, whereby:

10
1. Price 1 is a price level that 90 percent of the respondents will accept. 2. Price 2 is a price level that 50 percent of the respondents will accept. 3. Price 3 is a price level that 10 percent of the respondents will accept.
Thus, if the pre-test was able to find such expected outcome, the three major bids/prices for the final survey would already be found. The two other prices shall be some mid-prices, one between price 1 and price 2, and the other is between price 2 and price 3. The low price was tested in a low-income barangay or neighborhood, the middle price in an average-income barangay or neighborhood, and the high price in an upper-middle-income barangay or neighborhood. However, if a barangay or neighborhood with mixed neighborhood where all income levels could be found, the pre-test survey could be done in such site. Depending on the results of this pre-test, a follow-up pre-test survey might be done to re-calibrate the price bids. However, the desired result of the pretest of bids was not satisfied. The five bids used in the study are Philippine pesos 60, 120, 360, 600, and 1200. Four pretests were conducted to determine bids prices that could be used in the survey proper following the suggestions of Whittington (2005). The pre-tests results show that at even at a low price (PhP 3), still a big portion (35%) of the respondents was not yet willing to pay for the conservation program. On the other end, a high price of PhP 100 per month or PhP 1,200 per year was not able to “choke off” demand. After consultation with EEPSEA, the researcher decided that the study would adopt the same final bids (on monthly basis) as those used in a similar WTP study of Harder et al (2006) on the Philippine Eagle; that is, PhP 5 (or PhP 60 yearly), PhP 10 (or PhP 120 yearly), PhP 30 (or PhP 360 yearly), PhP 50 (or PhP 600 yearly), and PhP 100 (or PhP 1,200 yearly). It was thought that the eagle study and this study could be used for a comparative analysis given that the same final bids were adopted in both surveys. 3.5 Payment Vehicles and Scopes of the Good The study examined two payment vehicles regarding their potential for soliciting people’s WTP and possible financing source for conservation: electric bill surcharge and the annual community tax collected by the local government treasury.
1. Electric Bill Surcharge. A mandatory payment through a surcharge in the monthly electric bill for the next five years was proposed to be used as a payment vehicle for conservation. Electricity is widely distributed all over Panay, though there remain some rural households that are not yet reached by electricity. Nevertheless, as part of the EEPSEA cross-country CVM study, this payment vehicle was proposed to be used for cross-country comparison. Moreover, a similar surcharge -- called environmental charge -- is already being collected on a per kilowatt basis per household, amounting to PhP 0.0025 per kilowatt of electricity consumed. So far no one has protested nor complained about this surcharge, which is reflected in the un-bundled rates indicated in the electricity bill. It was clearly explained to the respondents that the proposed surcharge in this study is a fixed surcharge, and will not vary with the volume of electricity used.
2. Annual Community Tax Surcharge. Every resident of legal age is required to obtain
a residence certificate (commonly called “cedula”), which he/she will need for any

11
documented transactions like purchase of property, signing a contract, transacting in a bank, etc. Using such a payment vehicle would make it possible to cover all households (and as many people of legal age) in the collection of any environment-related fee like the conservation fee being proposed by this study. The proposed surcharge would be imposed yearly for the next five years. In the focus group discussions (FGDs) conducted in April-May 2005, this payment vehicle was found to be the most popular among the FGD participants.
In order to allow scope testing, two scopes of the good were incorporated in this study and laid down in the sampling design. The bigger scope concerns asking people’s WTP for a conservation fund to be set up, funds for which will come from the people either as a surcharge in their monthly electric bill or their yearly community tax. The money raised will be for the conservation of endangered species and their habitats in the North West Panay Peninsula and the Central Panay Mountain Range. On the other hand, the smaller scope of the good concerns asking people’s WTP which will be channeled to the conservation efforts in NWPP only. Carson et al. (2000) explain that a scope test looks at whether or not respondents are willing to pay more for a good that is large in scope, either in quality or quantity sense. This forms a theoretical validity test (Desvouges et al. 1996) of a consumer theory that says that, for any good, more of that good is preferred to less of it. Such that, a scenario offering a bigger scope of the good -- in the case of this study, a larger area for endangered species and habitats conservation -- should yield higher value. 3.6 Sampling Plan and Procedure To ensure that there will be at least 40 samples per bid, 60 respondents per bid were obtained to have allowances for item non-response, non-return of questionnaire, refusal to participate, and questionable answers. With five bids, two payment vehicles and two levels of scopes, the study had 1200 respondents altogether (Table 1). Eight barangays were randomly selected in San Jose and Kalibo. For each barangay, the number of respondents randomly selected was proportionate to the total number of households. Table 1. Sampling Plan and Design.
Split Sample Payment Vehicle 1: Community Tax Surcharge/
Property Tax Surcharge
Payment Vehicle 2: Electric Bill Surcharge
Both Payment Vehicles
Scope 1 (bigger) 60 samples per bid 60 samples per bid 120 samples per bid Scope 2 (smaller) 60 samples per bid 60 samples per bid 120 samples per bid Number of bids/ prices 5 5 5 Total 600 600 1200
The target respondents were the household heads, but if unavailable, the spouse or another adult (18 years old and above) member of the family/household who is an income earner was interviewed. A randomly selected replacement was used for the survey in case randomly selected household-respondent could not be found or refused to participate in the survey.

12
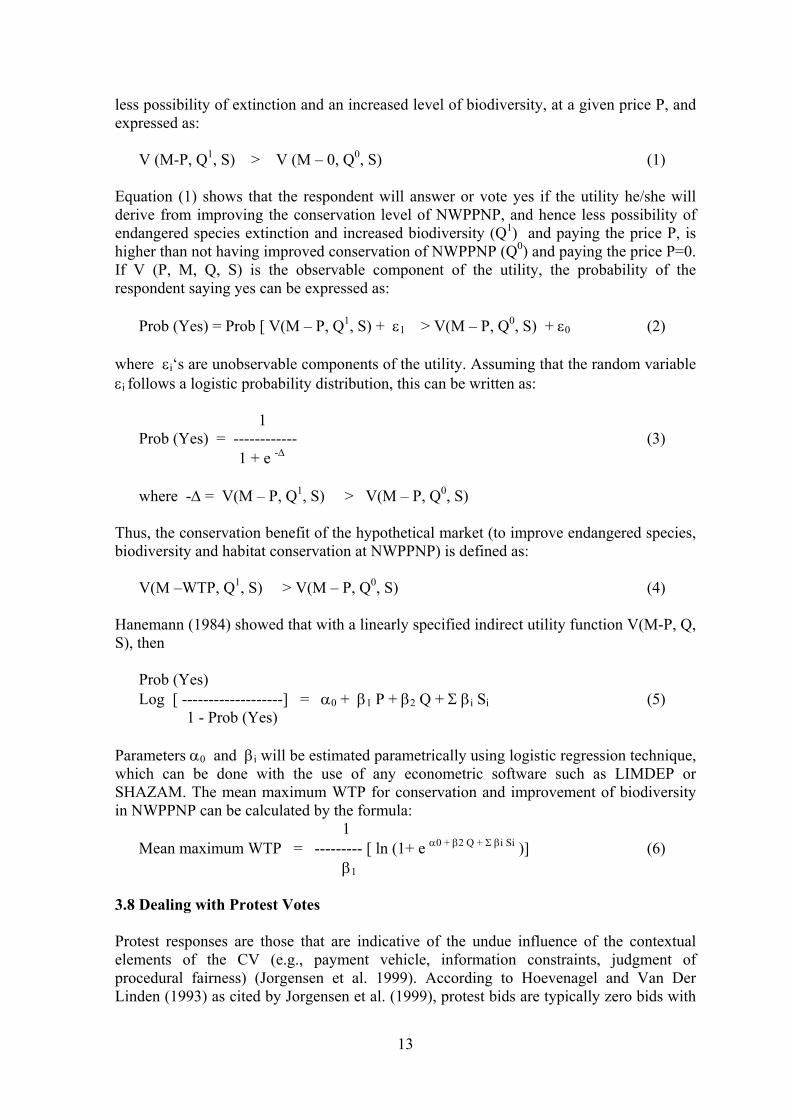
3.7 Contingent Valuation of Biodiversity Conservation and CVM Question Format The CVM was used because conservation of species and their natural habitats involved the non-use of biological resources, hence, implying passive use or non-use values, particularly bequest and existence values. Cartier and Riutenbeek’s (2000) categories of biodiversity values and biodiversity utility values (BUV) measure within an economic utility function, attempted to capture total consumer surplus or demand-oriented value. They stressed that contingent valuation techniques are often used to capture non-use values, or other techniques are used to value the final end-use benefits of biodiversity. Moreover, Pearce and Moran (1994) point out that CVM offers the most promise in measuring biodiversity (as well as conservation of species and their habitats). The study adopted the referendum dichotomous choice format as the CVM question design. Boyle (2003) cited the conceptual arguments of Carson et al. (2000) and Hoehn and Randall (1987), which suggest that the “take-it-or-leave-it” nature of dichotomous choice questions, when framed as a referendum vote, has desirable properties for incentive compatible (truthful) revelation of preferences. Boyle (2003) explains that there is a single bid amount to which respondents respond (i.e. looking at price tags of goods in a market), and respondents are not able to pick very high or very low currency amounts to purposively misstate their values/valuation. In adopting the referendum dichotomous choice format for this study, people would be “voting” for a program that corresponds to an amount that they have to decide if they will give. The hypothetical market or scenario is given in the questionnaire. Mitchell and Carson (1989) thoroughly discuss several biases (and the corresponding solutions) that can be encountered in the use of CVM. Pearce and Moran (1994) also discuss these biases and suggest solutions in the context of biodiversity valuation. For example, strategic bias or strategic behavior can be minimized by carefully framing the CVM questions in an incentive-compatible way such that this type of behavior/bias is not induced. Also, by removing the outliers from the data set gathered, the effect of strategic bias can be reduced. Boyle et al. (1994) pointed out that there might be greater potential for part-whole bias (embedding) in estimating non-use values because respondents generally do not have choice experience or knowledge of the object being evaluated. To minimize part-whole bias problem, Mitchell and Carson (1989) suggest that the survey instrument must include a description of the larger and smaller commodities, and then ask respondents to focus their attention on the smaller commodity. Inclusion of graphic aids such as maps and photographs is also proposed (Boyle et al. 1994). Spash et al. (2000) pointed out that the embedding problem or part-whole bias can be remedied by careful survey design. Predo (1995), in dealing with possible embedding problem or part-whole bias, asked respondents to rank their rating of the attributes for the environmental good being studied – the protection of Lake Danao National Park, Ormoc, Leyte, Philippines. The WTP model was specified following the work by Hanemann (1984), whereby a representative consumer has an indirect utility function V(P,M,Q,S), such that his/her level of utility or satisfaction depends on price P, income M, socioeconomic characteristics S or Si, and the quality of the environment Q. The respondent would vote yes if he/she would pay to help conserve the endangered species and habitats in NWPPNP, which would mean
13
less possibility of extinction and an increased level of biodiversity, at a given price P, and expressed as:
V (M-P, Q1, S) > V (M – 0, Q0, S) (1) Equation (1) shows that the respondent will answer or vote yes if the utility he/she will derive from improving the conservation level of NWPPNP, and hence less possibility of endangered species extinction and increased biodiversity (Q1) and paying the price P, is higher than not having improved conservation of NWPPNP (Q0) and paying the price P=0. If V (P, M, Q, S) is the observable component of the utility, the probability of the respondent saying yes can be expressed as:
Prob (Yes) = Prob [ V(M – P, Q1, S) + 1 > V(M – P, Q0, S) + 0 (2) where i‘s are unobservable components of the utility. Assuming that the random variable i follows a logistic probability distribution, this can be written as:
1 Prob (Yes) = ------------ (3) 1 + e -
where - = V(M – P, Q1, S) > V(M – P, Q0, S)
Thus, the conservation benefit of the hypothetical market (to improve endangered species, biodiversity and habitat conservation at NWPPNP) is defined as:
V(M –WTP, Q1, S) > V(M – P, Q0, S) (4) Hanemann (1984) showed that with a linearly specified indirect utility function V(M-P, Q, S), then
Prob (Yes) Log [ -------------------] = 0 + 1 P + 2 Q + i Si (5) 1 - Prob (Yes)
Parameters 0 and i will be estimated parametrically using logistic regression technique, which can be done with the use of any econometric software such as LIMDEP or SHAZAM. The mean maximum WTP for conservation and improvement of biodiversity in NWPPNP can be calculated by the formula:
1 Mean maximum WTP = --------- [ ln (1+ e 0 + 2 Q + i Si )] (6) 1
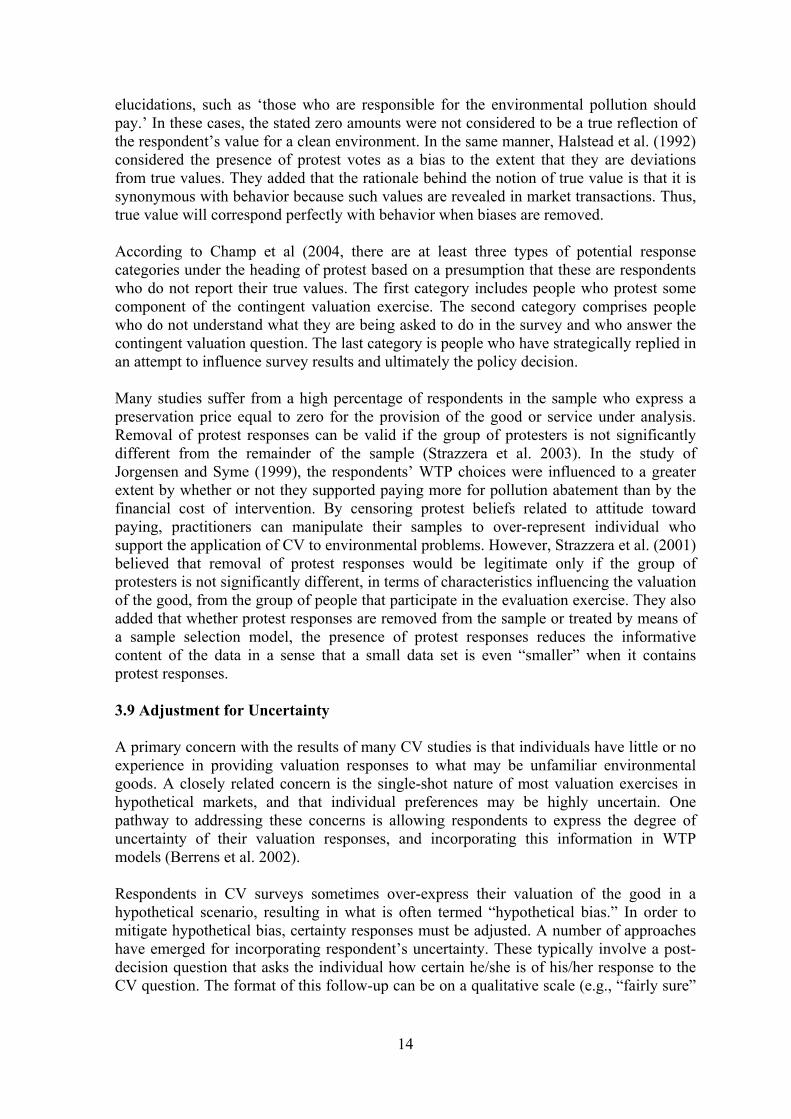
3.8 Dealing with Protest Votes Protest responses are those that are indicative of the undue influence of the contextual elements of the CV (e.g., payment vehicle, information constraints, judgment of procedural fairness) (Jorgensen et al. 1999). According to Hoevenagel and Van Der Linden (1993) as cited by Jorgensen et al. (1999), protest bids are typically zero bids with
14
elucidations, such as ‘those who are responsible for the environmental pollution should pay.’ In these cases, the stated zero amounts were not considered to be a true reflection of the respondent’s value for a clean environment. In the same manner, Halstead et al. (1992) considered the presence of protest votes as a bias to the extent that they are deviations from true values. They added that the rationale behind the notion of true value is that it is synonymous with behavior because such values are revealed in market transactions. Thus, true value will correspond perfectly with behavior when biases are removed. According to Champ et al (2004, there are at least three types of potential response categories under the heading of protest based on a presumption that these are respondents who do not report their true values. The first category includes people who protest some component of the contingent valuation exercise. The second category comprises people who do not understand what they are being asked to do in the survey and who answer the contingent valuation question. The last category is people who have strategically replied in an attempt to influence survey results and ultimately the policy decision. Many studies suffer from a high percentage of respondents in the sample who express a preservation price equal to zero for the provision of the good or service under analysis. Removal of protest responses can be valid if the group of protesters is not significantly different from the remainder of the sample (Strazzera et al. 2003). In the study of Jorgensen and Syme (1999), the respondents’ WTP choices were influenced to a greater extent by whether or not they supported paying more for pollution abatement than by the financial cost of intervention. By censoring protest beliefs related to attitude toward paying, practitioners can manipulate their samples to over-represent individual who support the application of CV to environmental problems. However, Strazzera et al. (2001) believed that removal of protest responses would be legitimate only if the group of protesters is not significantly different, in terms of characteristics influencing the valuation of the good, from the group of people that participate in the evaluation exercise. They also added that whether protest responses are removed from the sample or treated by means of a sample selection model, the presence of protest responses reduces the informative content of the data in a sense that a small data set is even “smaller” when it contains protest responses. 3.9 Adjustment for Uncertainty A primary concern with the results of many CV studies is that individuals have little or no experience in providing valuation responses to what may be unfamiliar environmental goods. A closely related concern is the single-shot nature of most valuation exercises in hypothetical markets, and that individual preferences may be highly uncertain. One pathway to addressing these concerns is allowing respondents to express the degree of uncertainty of their valuation responses, and incorporating this information in WTP models (Berrens et al. 2002). Respondents in CV surveys sometimes over-express their valuation of the good in a hypothetical scenario, resulting in what is often termed “hypothetical bias.” In order to mitigate hypothetical bias, certainty responses must be adjusted. A number of approaches have emerged for incorporating respondent’s uncertainty. These typically involve a post-decision question that asks the individual how certain he/she is of his/her response to the CV question. The format of this follow-up can be on a qualitative scale (e.g., “fairly sure”

15
or “absolutely sure”) or a numeric certainty scale such as a 10-point Likert scale in which 1=very uncertain and 10=very certain (Murphy et al. 2004). For responses to a hypothetical question in which a respondent reports a high degree of uncertainty, these studies generally find that recoding uncertain “yes” responses as “no” yields WTP estimates that are a good approximation of actual payments. This recoding scheme has effectively calibrated hypothetical responses in a number of studies, but the cut-off point at which this technique work varies. Champ et al. (1997) found 10 as an appropriate cut-off point; Champ and Bishop 2001 used 8, and Vossler et al. 2003 used 7 (Murphy et al. 2004). In addition, Samnaliev et al. (2003) found that certainty calibration reduced the goodness of fit (of the Logit model) and increased the variance of responses. Certainty scale calibration is another technique used to correct for hypothetical bias in dichotomous choice (DC) CV questions where respondents may generally be less certain of their answer to the offer price as compared with an open-ended or polychotomous choice format (Ready et al. 1995). In the certainty scale calibration, the WTP question is followed by a question that asks how sure respondents are about their response to the valuation question. The effectiveness of this method has been established by comparing hypothetical payments with actual donations (Champ et al. 2001; Polasky et al. 1996) as cited by Samnaliev et al (2003).
4.0 RESULTS AND DISCUSSIONS
The final survey was conducted in San Jose Antique and Kalibo, Aklan in eight waves that covered weekends from late September to middle of December 2005. There were 600 target respondents from San Jose and 600 from Kalibo, for which the equivalent number of questionnaires were distributed to randomly selected respondents, based from the sampling lists provided by each barangay. Out of the 1200 questionnaires distributed, 1106 were accomplished, returned to the enumerators, and found usable for the purpose of this study. After protest vote-responses to WTP question were removed, 924 were found usable for analysis. Figure 1 shows the distribution of the 924 questionnaires, whereby protest votes were removed and certainty responses were adjusted (as discussed in sections 3.8 and 3.9 above). 4.1 Knowledge of and Attitudes toward Endangered Species Conservation The respondents were asked on their stand on different statements concerning endangered species conservation. They evaluated 10 statements, as to whether they strongly agreed (SA), agreed (A), were neutral about it (N), disagreed (D), or strongly disagreed (SD). The statements can be grouped into 3 types, namely:
i. Statements on the government’s role (statements A and C), ii. Statements on personal commitment (statements D, E, G and I), and iii. Statements on endangered species conservation versus other goals (statements F, J,
B and H)

16
Figure 1. Distribution of Respondents by Payment Vehicle and Scope (N=924) Table 2 shows that most of the choices of the respondents in statements A and C were “strongly agree” and “agree.” When combined, the percentage of respondents who chose such ratings totaled 80.2 percent for statement A and 84.8 percent for statement C. This result shows that people believed or strongly agreed that the government plays an important role in addressing environmental problems such as the conservation of endangered species.
Regarding statements D, E, G, and I, Table 2 indicates that when asked for commitment in a conservation program, most people would agree and even strongly agree when the commitment is just on general terms as shown by results for statement D (“It is everyone’s duty to ensure that plants and animals as we know them today will exist for mankind in the future”). A total of 88.5 percent of the respondents chose “agree” and “strongly agree” for statement D. Table 2. Attitudes of Respondents toward Endangered Species Conservation (N=924)
Question Answer Range
Strongly Agree
Agree Neutral Disagree Strongly Disagree
Un- answered
Statement A 376
(40.7%) 365
(39.5%) 109
(11.8%) 51
(5.5%) 13
(1.4%) 10
(1.1%)
Statement B 186
(20.1%) 381
(41.2%) 240
(26%) 70
(7.6%) 34
(3.7%) 13
(1.4%)
Statement C 390
(42.2%) 394
(42.6%) 99
(10.7%) 23
(2.5%) 8
(0.9%) 10
(1.1%)
Statement D 517
(56.0%) 300
(32.5%) 64
(6.9%) 28
(3.0%) 6
(0.6%) 9
(1.0%)
Statement E 98
(10.6%) 276
(29.9%) 304
(32.9%) 182
(19.7%) 52
(5.6%) 12
(1.3%)
Statement F 380
(41.1%) 402
(43.5%) 94
(10.2%) 26
(2.8%) 10
(1.1%) 12
(1.3%) Statement G 96 228 275 198 110 17
CPMR (big scope) N=222
NWPP (small scope) N=237
ELECTRIC N=450
CEDULA N=474
CPMR (big scope) N=237
NWPP (small scope) N=228

17
Question Answer Range
Strongly Agree
Agree Neutral Disagree Strongly Disagree
Un- answered
(10.4%) (24.7%) (29.8%) (21.4%) (11.9%) (1.8%)
Statement H 23
(2.5%) 80
(8.7) 273
(29.5) 331
(35.8%) 204
(22.1) 13
(1.4%)
Statement I 56
(6.1%) 165
(17.9%) 282
(30.5%) 258
(27.9%) 149
(16.1%) 14
(1.5%)
Statement J 217
(23.5%) 258
(27.9%) 220
(23.8%) 146
(15.8%) 68
(7.4%) 15
(1.6%) Statement A: The government should raise more funds to deal with environmental programs in this country. Statement B: There are more important environmental concerns than endangered species conservation. Statement C: Poaching of wildlife species should be punishable by law. Statement D: It is everyone’s duty to ensure that plants and animals as we know them today will exist for
mankind in the future. Statement E: Citizens should contribute to endangered species conservation by making cash donations to this
cause. Statement F: Endangered species are important even if I don’t get to see or interact with them. Statement G: The government should raise taxes to pay for more endangered species protection. Statement H: The government should invest in helping people before it spends money on endangered
species. Statement I: Households who earn more income should pay higher taxes in order to pay for endangered
species conservation. Statement J: Endangered species conservation should not be a priority concern of the government. On the other hand, the majority would likely be non-committal (neutral) and would even not agree if the commitment would be specifically monetary. Statement E, which says “Citizens should contribute to endangered species conservation by making cash donations to this cause,” received 32.9 percent “neutral,” 19.7 percent “disagree,” and 5.6 percent “strongly disagree” responses. Altogether, these totaled 58.2 percent. While statement G (“The government should raise taxes to pay for more endangered species protection”) may seem to refer to the government’s role, it actually concerns extracting monetary commitment from people. With regards this statement, 33.3 percent of the respondents disagreed and strongly disagreed, while 39.8 percent were noncommittal. In the Philippine context, a noncommittal stand or reply can tantamount to disagreement with the proposal or idea presented, particularly when it is about collecting tax from people. Thus, when summed up, close to three-fourths (73%) actually disapproved raising taxes for endangered species protection. Statement I (“Households who earn more income should pay higher taxes in order to pay for endangered species conservation”) may sound not extracting monetary commitment from many people since it concerns the fewer higher-income people, rather than the majority lower-income people. However, only 24 percent agreed and strongly agreed with the statement. In comparison 30.5 percent were neutral or noncommittal, while only 44 percent disagreed and strongly disagreed. Those who disagreed/strongly disagreed may have been composed of the respondents from the higher income families. The third group of statements is about the importance of endangered species conservation and how it compares with other goals of the government or society. Statement F, an expression of existence value, says “Endangered species are important even if I don’t get to see or interact with them.” Of the respondents, 84.6 percent agreed and strongly agreed with the statement. On the other hand, 51.4 percent disagreed and strongly disagreed while

18
23.8 percent were neutral with Statement J (“Endangered species conservation should not be a priority concern of the government”). These figures amply indicate the respondents’ view that conserving endangered species per se should be a priority concern of the government. However, when compared with other goals or environmental concerns, endangered species conservation is perceived as of less priority, as indicated by responses to statement B (“There are more important environmental concerns than endangered species conservation”) A total of 61.3 percent of the respondents agreed and strongly agreed with it. Moreover, 57.9 percent of the respondents agreed and strongly agreed with statement H which says “The government should invest in helping people before it spends money on endangered species.” Only 11.2 percent disagreed and strongly disagreed with this statement indicated that the majority of respondents would prioritize other concerns like helping people to conserving endangered species. The respondents were also asked to rank given endangered species, from most to least deserving of protection and conservation. The species’ pictures were part of the questionnaire in order to facilitate proper evaluation and ranking. Since they were asked to rank the species in terms of priority for government attention and conservation, scores for ranking were used to compute the weighted raw score. This was done by multiplying the total responses for ranked 1 by 3 points, ranked 2 by 2 points, and ranked 3 by 1 point (Table 3). Based on this, the eagle, which garnered 1946 points, was perceived as the most important species needing conservation and protection. It was followed by marine turtle (1251 points), dugong (947 points), and whale shark (386 points). Two NWPPNP species, bleeding heart pigeon (360 points) and hornbill (276 points) ranked fifth and sixth only, respectively of the nine species presented for ranking. Table 3. Species Ranking by Respondents as to Priority for Protection (n=928)
SPECIES FREQUENCY WEIGHTED RAW
SCORE RANK 1 RANK 2 RANK 3
1. Dugong 179
(19.4%) 140
(15.2%) 130
(14.1%) 947
2. Eagle 465
(50.3%) 235
(25.4%) 81
(8.8%) 1946
3. Whale shark 40
(4.3%) 83
(9.0%) 100
(10.8%) 386
4. Marine turtles 161
(17.4%) 287
(31.1%) 194
(21.0%) 1251
5. Bleeding heart pigeon 18
(1.9%) 63
(6.8%) 180
(19.5%) 360
6. Warty pig 18
(1.9%) 37
(4.0%) 102
(11.0%) 230
7. Hornbill 22
(2.4%) 59
(6.4%) 92
(10.0%) 276
8. Flying fox bat 17
(1.8%) 8
(0.9%) 32
(3.5%) 99
9. unanswered 4
(0.4%) 12
(1.3%) 13
(1.4%) 29 TOTAL 924

19
It can be noted that the endangered species commonly seen on television or heard over the radio received more recognition from the respondents as needing appropriate protection and conservation. For example, the Philippine eagle has a wide range of media exposure not only because it was declared as the national bird of the Philippines but also because of the many programs concerning it. This indicates that disseminating information on the importance of endangered species can be further raised through the help of media. This is one way of educating people against over exploitation of the natural resources since doing so could damage the habitats of the endangered species or even result in its extinction. Marine turtles ranked second in priority. This can be explained by the awareness of the respondents on their importance to the ocean and their medicinal or even direct uses (e.g. egg, meat, and shell). 4.2 Willingness to Pay for Conservation Responses to willingness to pay (WTP) question are given in Table 4 below. At the lowest price of 60 per year, only 15.8% were willing to pay, as price bid increases, percent of WTP decreases that at the highest price bid of 1200, only 10% were willing to pay. This is consistent with the law of demand that as price increases, the demand (or the willingness to pay for the good) decreases. The low (i.e. below 50%) rate of affirmative replies in all respondent groups is not surprising, as this was also found by previous studies on non-use values (Kramer and Mercer 1997; Cummings and Taylor 1999; Giraud, Loomis, and Johnson 1999; Berrens et al 2000; Seenprechawong 2001; Subade 2005) Table 4. Respondents’ WTP for Conservation of Endangered Species and Habitats at NWPPNP
Bid Price WTP Reply
TOTAL Yes No
60 30 (15.8%)
160 (84.2%) 190
120 37 (19.7%)
151 (80.3%) 188
360 24 (12.8%)
164 (87.2%) 188
600 19 (10.8%)
157 (89.2%) 176
1200 19 (10.4%)
163 (89.6%) 182
Total 129 (14.0%)
795 (86.0%) 924
Figure 2 below shows the WTP behavior of the respondents. It is noticeable that more respondents were willing to pay the price of PhP 120 annually (or PhP 10 pesos monthly), than the lower price of PhP 60 pesos annually (or PhP 5 pesos monthly). This is called “denominational bias,” wherein respondents tend to contribute an amount they can afford but not at such a low price as five pesos a month (or PhP 60 pesos yearly). The “denominational bias” occurs at price PhP 10 monthly or PhP 1,200 annually. Do the respondents have some bias toward a certain denomination? Why would the respondents demonstrate a low and flat WTP curve? To shed light on these questions, six

20
focus group discussions (FGD) were conducted among randomly selected respondents from the pool of respondents in San Jose, Antique, and Kalibo, Aklan. The FGDs were held in June and July 2006.
0
5
10
15
20
25
60 120 360 600 1200
Bid Price
Pe
rce
nt
WT
P
Figure 2. Willingness to pay results after adjustments for certainty and removal of
protest votes (N=924)
The FGD respondents were asked to indicate the amount (continuous variable) they would be willing to pay when someone asks for a donation to any cause. The majority of respondents indicated to pay PhP 10 pesos, confirming the respondents’ “denominational bias.” Perhaps this can be explained by the Filipino’s hiya culture (literally, hiya means shame or shyness, a cultural trait still exhibited by many Filipinos). It is possible that the respondents indicated giving PhP 10 because anything lower than this could be embarrassing. Until recently, PhP 10 pesos had been the lowest bill denomination; lower amounts are coins. Thus, giving a PhP 10 bill looks reasonable. This explanation, however, deserves further investigation with regards to peoples’ WTP and contributions to public goods. The seemingly flat WTP behavior in Figure 2 above is not so un-common. A similarly low WTP and flat WTP curve was observed by Whittington et al. (2000) in Semarang, Indonesia, whereby residents were asked their WTP for a full-service assessment fee for sewage service connection through their neighborhood association. Harder et al. (2006) also found a relatively flat WTP curve for the conservation of the Philippine eagle. Subade (2005) likewise found a relatively flat WTP curve for Puerto Princesa City and Cebu City residents who accomplished self-administered questionnaires on their WTP for the conservation of Tubbataha Reefs World Heritage Marine Park. A possible reason for the low WTP behavior and flat WTP curve is “yea saying,” wherein respondents of CV surveys tend to bid positively when in fact they are not willing to pay. Results of the follow-up FGDs in San Jose, Antique and Kalibo, Aklan confirmed that the majority of respondents tended to please and were very polite to visitors, which somehow confirms “yea saying” as reason for their WTP behavior (See Appendix – STATE the Appendix numbers). Pooled regressions with dummy variable on scope and another pool regression with dummy variable on payment vehicle showed insensitivity to scope and no significant difference between payment vehicles.

21
4.3 Reasons for WTP To distinguish the components or rationale for positive WTP, those who responded “yes” to the WTP question were also asked to state their reasons or motives for such. The economic values or motives for willingness to pay in Table 5 were categorized based on Stevens et al. (1994), McConnell (1997), and Manouka (2001). Table 5. Reasons for Respondents’ Willingness to Pay (N=129)
REASON Community Tax (CED)
Electric Bill (ELEC)
All
1. I want to preserve NWPPNP [and CPMR (Central Panay Mountain Range)] because I visit it. (direct use value)
5 (8.06%)
9 (13.43%)
14 (10.85%)
2. I want to preserve NWPPNP (and CPMR) because I directly use or consume goods and services such as birds, medicinal plants, reptiles, ornamental plants, etc. from it. (direct use value)
3 (4.84%)
2 (2.99%)
5 (3.88%)
3. I want to contribute to preserve NWPPNP (and CPMR) for future generations. (bequest value)
31 (50.0%)
29 (43.28%)
60 (46.51%)
4. I take personal pleasure in knowing that NWPPNP and CPMR will continue to exist. (existence value)
4 (6.45%)
3 (4.48%)
7 (5.43%)
5. I would like to contribute because I am concerned about the people who depend upon the goods and services provided by NWPPNP (and CPMR). (non-paternalistic altruistic motive)
2 (3.23%)
2 (2.99%)
4 (3.10%)
6. I would contribute because I think that the goods and services provided by NWPPNP should be available for others. (paternalistic altruistic motive)
2 (3.23%)
2 (2.99%)
4 (3.10%)
7. I do not use NWPPNP (and CPMR) now, but I am willing to contribute to have the option of visiting/using it in the future. (option value)
1 (1.61%)
1 (1.49%)
2 (1.55%)
8. I am contributing because marine plants and animals in NWPPNP (and CPMR) have the right to exist independent of anyone’s use either in the present or future. (existence value)
5 (8.06%)
6 (8.96%)
11 (8.53%)
9. It is a good cause and I enjoy contributing to good causes in general. (good cause)
5 (8.06%)
6 (8.96%)
11 (8.53%)
10. It is my moral duty to contribute to preserve NWPPNP (and CPMR). (moral duty)
2 (3.23%)
5 (7.46%)
7 (5.4%)
11. Others 0 (0%)
1 (1.49%)
1 (0.78%)
12. Unanswered 2 (3.23%)
1 (1.49%)
3 (2.33%)
Total 62
67
129 (100%)
Table 5 confirms the a priori expected outcome; that is, since most of the respondents were off-site (i.e., more than 100 km from NWPPNP), their direct use values would be

22
small. Across respondent groups, no more than 20 percent cited use values (categories 1 and 2), though when combined these were the second most cited motives for WTP. On the other hand, the main motive for WTP was bequest values -- the concern for future generations. Almost half (47%) of all respondents cited this as their main reason. Further, nearly half of the community tax group cited it as their motive for contributing to the hypothesized conservation fund. These respondents believed that the endangered species and habitats in NWPPNP ought to be conserved so that there can be something for their children and children’s children. A distant third WTP motivation were existence values– the belief that marine plants and animals in NWPPNP have the right to exist independent of anyone’s use either in the present or future and good cause. It was cited by nearly 9 percent of the respondents (8.06% of CED respondents, 8.96% of ELEC respondents) 4.4 Reasons for Non-WTP Respondents who indicated unwillingness to pay were also asked to indicate their reasons. As mentioned earlier, protest votes were removed from the data set. These were the no-replies whose reasons included: “being far from the place I feel paying anything is irrelevant to me”, “I do not think paying will solve the problem”, “I believe this improvement will take place without my contribution”, and “I do not trust the institutions who will handle the money for this conservation work.” Several authors explained that such responses should not be included in further analysis particularly in the WTP function’s regression(s) (Loomis et al. 1993; Stevens et al. 1994; Spash et al. 2000; Manouka 2001). Zero bids (or no replies) associated with protests do not necessarily indicate a zero value for the resource being valued (Manouka 2001; Stevens et al. 1994). Respondents may be objecting to some aspects of the survey. For example they maybe objecting or rejecting the way the CV question was asked as to collecting contributions from people. They could also be rejecting the scenario being hypothesized as to the “good” being “purchased” by their WTP. Such respondents are also called scenario rejecters. Of the remaining 795 “no” replies across payment vehicle groupings, 55 percent cited economic reason for non-WTP (i.e., they could not afford to pay or they did not have spare income to give for the conservation trust fund) (Table 6). Table 6. Reasons for Respondents’ Non-Willingness to Pay
REASON CED ELEC All
I cannot afford to pay/I have no spare income but would otherwise contribute.
233 (56.55%)
208 (54.31%)
441 (55.47%)
I feel the environmental improvement of NWPPNP (and CPMR) is unimportant.
6 (1.46%)
6 (1.57%)
12 (1.51%)
Other reasons 14 (3.39%)
10 (2.61%)
24 (3.01%)
Not applicable 159 (38.59%)
159 (41.51%)
318 (40.0%)
Total 412 383 795

23
4.5 Determinants of Willingness to Pay Logit regressions were conducted on the data set from which the protest votes had been removed and the certainty was adjusted. Table 7 shows the variables used for the regression. Table 8 shows that across payment vehicles and by pooled regression, the coefficient for bid or price (WTP per year) is significant and has a negative sign, an a priori expectation consistent with demand theory. This means that at higher prices, the probability of people willing to pay for the good decreases. Alternatively, as price increases, the demand would lessen (Table 8). Furthermore, income was found to be significantly affecting WTP in all data set regressions, and is positively signed. Familiarity with endangered species is also positively affecting WTP. The latter, however, is true only for the pooled and community tax data set regressions. Table 7. Variable Definitions, Mean, and Standard Deviations (N=924)
Variable Definition Mean Standard Deviation
WTPYR Bid amount offered to respondent annually 462.93 412.53 INCOME Average income of the respondent 6519.26 7706.32 AGE Age of the respondent 44.11 12.97 SEX Respondent’s sex: male=0 female=1 0.54 0.50 EDUCYRS Number of years of education 10.54 3.44 HELPFM Respondent was assisted by the family member/s in
answering the questionnaire: No=0 Yes=1 0.66 0.47
FAMES Respondent is familiar with “endangered species”; No=0 Yes=1
0.84 0.37
Table 8. Regression Results of WTP Model when Protest Votes were Removed and Certainty was Adjusted
Variable Community Tax
(CED) Electric Bill
(ELEC) All
Constant -3.126
(-3.182)*** -2.815
(-3.220)*** -2.928
(-4.602)***
WTPYr -0.000029 (-0.088)
-0.00155 (-3.319)***
-0.00065 (-2.445)**
Income 0.000038
(2.663)*** 0.000044
(2.455)*** 0.00004
(3.507)***
Age -0.0081 (-0.683)
0.00137 (0.121)
-0.00198 (-0.244)
Sex -0.207
(-0.718) 0.0776 (0.271)
-0.047 (-0.233)
EducYrs 0.0261 (0.358)
0.0819 (1.814)*
0.059 (1.807)*
Fames 1.34
(2.163)** 0.246
(0.579) 0.64
(1.888)*
HelpFm -0.153
(-0.515) 0.234 (0.774
0.021 (0.1)
***significant at 1% level **significant at 5% level * significant at 10% level

24
4.6 Parametric and Non-Parametric Mean WTP Estimation of Conserving NWPP Species and Habitats An advantage of non-parametric analysis of CV data is that the response to price can be directly observed in the data (Jianjun and Wang 2005). This non-parametric technique on analyzing WTP responses develops survivor curves showing the likelihood of agreeing to pay the yearly or monthly fee (e.g., a surcharge on the electric bill or annual community tax) as a function of how much the respondent was asked to contribute (bid price). This means that for each bid price (PhP 60, PhP 120, PhP 360, PhP 600, PhP 1,200), the percentage of respondents willing to pay the corresponding requested bid price can be calculated. The lower bound and mid-point methods were used in estimating the non-parametric values of mean WTP. Table 9 shows the parametric and non-parametric estimates for both methods, across payment vehicles. Across all respondents (i.e., the pooled data), the non-parametric annual mean WTP amounted to PhP 140 for the lower bound estimate, and PhP 176 for the middle bound estimate. When computed for monthly equivalent, mean WTPs were PhP 12 and PhP 15, respectively. These figures are not very far from the non-parametric estimates for both the community tax-based and electric bill-based mean WTPs. In contrast, the parametric mean WTP for all respondents, using Hanemann’s formula, is almost 80 percent bigger than the survivor function-based estimates. Moreover, the parametric estimate for the community tax-based annual mean WTP is large at about PhP 3,000, which is due to the non-significance of bid amount as determinant of WTP for the community tax data regression. Table 9. Parametric and Non-Parametric Estimation of Mean WTP Hanemann’s Formula Yearly Monthly
All respondents N=924 253.89 21.16
Community tax (n=474) ** **
Electric bill (n=450) 165.8 13.8
Survivor Function (Non-parametric)
Lower Bound Middle Point
Yearly Monthly Yearly Monthly
All respondents (N=924) 140.47 11.7 176.29 14.69 Community Tax (n=474) 152.62 12.7 179.27 14.9 Electric bill (n=450) 122.68 10.22 170.49 14.21
4.7 Social Willingness to Pay vs. the Costs of Conservation, and Some Policy Options In discussing this section, it must be noted that the results of the study showed that the proposed scenario of collecting conservation financing would not pass the referendum, implying its non-implementability. However, for the sake of argument, suppose that only those who voted favorably in the referendum will pay, then, one could estimate the social benefits based from the recoverable WTP. This can provide a measure of conservation benefits. Table 10 shows the computation using the survivor function.
25
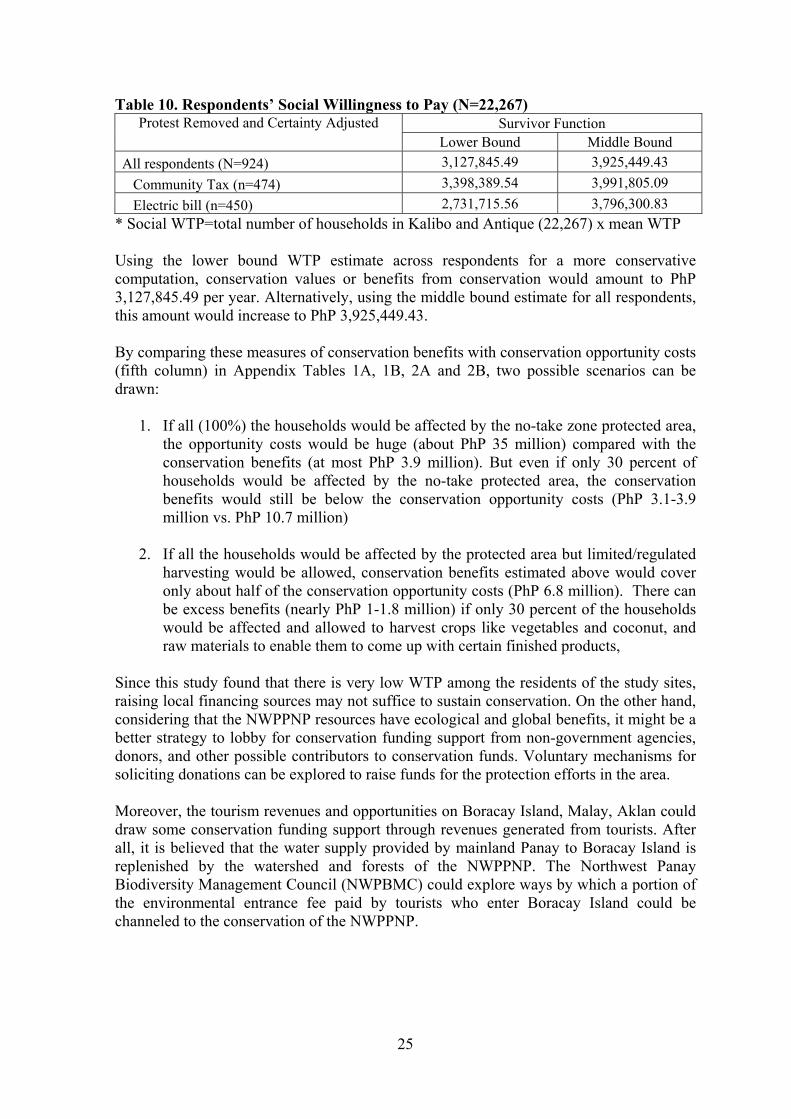
Table 10. Respondents’ Social Willingness to Pay (N=22,267) Protest Removed and Certainty Adjusted Survivor Function
Lower Bound Middle Bound
All respondents (N=924) 3,127,845.49 3,925,449.43
Community Tax (n=474) 3,398,389.54 3,991,805.09
Electric bill (n=450) 2,731,715.56 3,796,300.83
* Social WTP=total number of households in Kalibo and Antique (22,267) x mean WTP Using the lower bound WTP estimate across respondents for a more conservative computation, conservation values or benefits from conservation would amount to PhP 3,127,845.49 per year. Alternatively, using the middle bound estimate for all respondents, this amount would increase to PhP 3,925,449.43. By comparing these measures of conservation benefits with conservation opportunity costs (fifth column) in Appendix Tables 1A, 1B, 2A and 2B, two possible scenarios can be drawn:
1. If all (100%) the households would be affected by the no-take zone protected area, the opportunity costs would be huge (about PhP 35 million) compared with the conservation benefits (at most PhP 3.9 million). But even if only 30 percent of households would be affected by the no-take protected area, the conservation benefits would still be below the conservation opportunity costs (PhP 3.1-3.9 million vs. PhP 10.7 million)
2. If all the households would be affected by the protected area but limited/regulated
harvesting would be allowed, conservation benefits estimated above would cover only about half of the conservation opportunity costs (PhP 6.8 million). There can be excess benefits (nearly PhP 1-1.8 million) if only 30 percent of the households would be affected and allowed to harvest crops like vegetables and coconut, and raw materials to enable them to come up with certain finished products,
Since this study found that there is very low WTP among the residents of the study sites, raising local financing sources may not suffice to sustain conservation. On the other hand, considering that the NWPPNP resources have ecological and global benefits, it might be a better strategy to lobby for conservation funding support from non-government agencies, donors, and other possible contributors to conservation funds. Voluntary mechanisms for soliciting donations can be explored to raise funds for the protection efforts in the area. Moreover, the tourism revenues and opportunities on Boracay Island, Malay, Aklan could draw some conservation funding support through revenues generated from tourists. After all, it is believed that the water supply provided by mainland Panay to Boracay Island is replenished by the watershed and forests of the NWPPNP. The Northwest Panay Biodiversity Management Council (NWPBMC) could explore ways by which a portion of the environmental entrance fee paid by tourists who enter Boracay Island could be channeled to the conservation of the NWPPNP.

26
5.0 SUMMARY AND CONCLUSION There has been lack of information on average citizen or household preference for and awareness of endangered species conservation, particularly in the developing country setting. This study documented and found that in rurban San Jose Antique and Kalibo, Aklan (consisting of about 22,267 households), people have high level of awareness of the importance of endangered species conservation. In fact, environmental problems were third in their ranking of concerns. However, when asked for specific monetary commitment, the majority was unwilling or non-committal. Based on the dichotomous choice CVM survey, results confirm the low WTP of respondents since only 14 percent were willing to pay for the hypothesized conservation fund for NWPPNP’s endangered species and habitats. This is almost the same proportion as those who were willing to pay through either of the payment vehicle groupings. The main motivations for their WTP were bequest and use values. On the other hand, the survivor function estimates of mean WTP showed that the average respondent was willing to pay as contribution to the conservation fund amounts ranging from PhP 122 to PhP 176 per year. These WTP estimates can collect a modest social WTP of PhP 2.7-3.9 million, which is not sufficient to cover the opportunity costs of conservation. Thus, sourcing conservation funds for NWPPNP should go beyond the local residents.

27
REFERENCES Adamowicz, W. 2005. Personal communications. November 14, 2005 Anda, A.D. Jr. 2006. An Institutional Assessment of the Integrated Protected Area Fund (IPAF) in the Philippines, Resources, Environment & Economics Center for Studies (REECS). Pages 1-49. Bateman, I.J., R.T. Carson, B. Day, M. Hanemann, N. Hanley, T. Hett, M. Jones-Lee, G. Loomes, S. Mourato, E. Ozdemiroglu, D.W. Pearce, R. Sugden, and J. Swanson. 2002. Economic valuation with stated preference techniques: a manual. Cheltenham: Edward Elgar Publishers. Berrens, R., H. Smith, A. Bohara, and C. Silva. 2002. Further investigation of voluntary contribution contingent valuation: Fair share, time and contribution, and respondent uncertainty. Journal of Environmental Economics and Management. 44:144-168. Bowker, J.M. and J. R. Stoll. 1988. Use of Dichotomous Choice Nonmarket Methods to Value the Whooping Crane Resource. American Agricultural Economics Association. 70: 372-381. Boyle, K.J. 2003. Contingent valuation in practice. In P.A.,Champ, K.J. Boyle and T.C. Brown (eds). A primer on nonmarket valuation. The Economics of Non-Market Goods and Resources. Bateman, I.J. Series Editor. Kluwer Academic Publishers. Dordrecht/ London/Boston. Boyle, K.J., W.H. Desvouges, F. R. Johnson, R.W. Dunford, and S.P. Hudson. 1994. An investigation of part-whole biases in contingent valuation studies. Journal of Environmental Economics and Management. 27 (1): 64-83. Breffle, W. S., E. R. Morey, and T. S. Lodder.. 1998. Using contingent valuation to estimate a neighborhood’s willingness to pay to preserve undeveloped urban land. Urban Studies, 35(4) 715-727. Bulte, E. H., and G. C. Van Kooten. 1999. Marginal valuation of charismatic species: Implications for conservation. Environmental and Resource Economics, 14(1) 119-130. Calia P, and E. Strazzera. 1999. A sample selection model for protest votes in contingent valuation analyses.FEEM Working Paper No. 55.99. Available at SSRN: http://ssrn.com/abstract=200620. Carson R.T., N. E. Flores, and N. F. Meade. 2000. Contingent Valuation: Controversies and Evidence, Environmental and Resource Economics. 19: 173 – 210, 2001, Netherlands: Kluwer Academic Publishers. Carson, R.T., T. Groves, and M. Machina. 2000. Incentive and informational properties of preference questions. Unpublished paper. Department of Economics, University of California, San Diego.

28
Cartier, C and J. Ruitenbeek. 2000. Review of the empirical biodiversity literature. In K. Gustavson, R. Huber, and J. Ruitenbeek (eds). Integrated Coastal Zone Management of Coral Reefs: Decision Support Modeling. The World Bank, Washington, DC. Champ, P. A., and R. C. Bishop. 2001. Donation Payment Mechanisms and Contingent Valuation: An Empirical Study of Hypothetical Bias. Environmental and Resource Economics 19(4), 383-402. Champ, P. A., R. C. Bishop, T. C. Brown, and D. W. McCollum. 1997. Using Donation Mechanisms to Value Nonuse Benefits from Public Goods. Journal of Environmental Economics and Management 33(2), 151-162. Champ, P. A., T. C. Brown, and K. J. Boyle. 2004. A Primer on Nonmarket Valuation. Dordrecht: Kluwer Academic Publishers. Cherry, T. J.A. List, and J. Shogren. 2005. Valuing Wildlife at Risk from Exotic Invaders in Yellowstone Lake. In Anna Alberini and Jim Kahn (eds.). A Handbook of Contingent Valuation. London: Edgar Elgar Publishers. Curio, E. 2003. Species conservation as an integral part of forest maintenance in the Philippines. Tenth Annual Report (anniversary issue) of the Philippines Endemic Species Conservation Project (PESPCP). Desvouges, W, S.P. Hudson and M.C. Ruby. (1996). Evaluating CV performance: Separating the light from the heat. In: Current Issues in Environmental Economics. Johansson, P.O., Kriström, B. and Maler, K.G. (eds.). Manchester University Press., Manchester, pp. 117-145. Dixon, J. and P. Sherman. 1990. Economics of protected areas: a new look at benefits and costs. London: Earthscan Publication Ltd. Eagle, J. and D. Betters. 1998. The endangered species act and economic values: a comparison of fines and contingent valuation studies. Ecological Economics. 26:165-171. Hageman, R. 1985. Valuing Marine Mammal Populations: Benefit Valuations in Multi-species Ecosystem. National Marine Fisheries Service, Southwest Fisheries Center, La Jolla, California. 88pp. Halstead, J.M., A.E. Luloff and T.H. Stevens. 1992. Protest Bidders in Contingent Valuation. Northeastern Journal of Agricultural Economics. 21: 160-69. Hanemann, W.M. 1984. Welfare evaluations in contingent valuation experiments with discrete responses. American Journal of Agricultural Economics. 66:332-41 Harder, D. 2006. Does Payment vehicle affect willingness to pay of Filipinos for Philippine Eagle Conservation. Available Online: http://www.idrc.ca/uploads/user-S/11939066061DieldreTR.pdf Hoehn, J.P. and A. Randall. 1987. A satisfactory benefit-cost indicator from contingent valuation. Journal of Environmental Economic and Management. 14:226-247.

29
Hoevenagel, R. and J. W. van der Linden. 1993. Effects of different descriptions of the ecological good on willingness to pay values Ecological Economics. Vol. 7, issue 3, pages 223-238 Jakobsson, K. M. and Dragun, A.K. 1996.Contingent Valuation and Endangered Species. Methodological Issues and Applications. Edward Elgar Publishing Limited. pp. 77-115 Jianjun, J. and Z. Wang. 2005. Comparison study on endangered species conservation in Southeast Asia: Black-faced Spoonbills and Marine Turtles. Draft Interim Report submitted to EEPSEA Jorgensen, B. S., and G. J. Syme. 2000. Protest responses and willingness to pay: attitude toward paying for storm water pollution abatement. Ecological Economics. 33(2) 251-265. Jorgensen, B. S., G. Syme, B. Bishop and B. Nancarrow. 1999. Protest responses in contingent valuation. Environmental & Resource Economics 14(1) 131-150. Jorgensen, B. S., M. A. Wilson, and T. A. Heberlein. 2001. Fairness in the contingent valuation of environmental public goods: attitude toward paying for environmental improvements at two levels of scope. Ecological Economics 36(1) 133-148. Langford, I. H., A. Kontogianni, M.Skourtos, S. Georgiou, and I.Bateman. 1998. Multivariate mixed models for open-ended contingent valuation data - willingness to pay for conservation of monk seals. Environmental and Resource Economics. 12(4) 443-456. Loomis, J. and D. Larson. 1994. Total Economic Values of Increasing Gray Whale Populations: Results from A Contingent Valuation Survey of Visitors and Households. Marine Resource Economics 9:275-286. Loomis, J. B. 2000. Can environmental economic valuation techniques aid ecological economics and wildlife conservation? Wildlife Society Bulletin. 28(1) 52-60. Loomis, J. B., and A. Gonzalez-Caban. 1998. A willingness-to-pay function for protecting acres of spotted owl habitat from fire. Ecological Economics.25 (3) 315-322. Loomis, J., and D. White. 1996. Economic benefits of rare and endangered species: summary and meta-analysis. Ecological Economics. 18: 197-206. Loomis, J. 1993. Some empirical evidence on Embedding effects in Contingent Valuation of Forest Protection. Journal of Environmental Economics and Management: 24, 45-55
Loomis, J., A. Gonzalez-Caban and R. Gregory. 1994. Do reminders of substitutes and budget constraints influence contingent valuation estimates. Land Economics. 70 (4): 499-506.
Loomis, J., P. Kent, L. Strange, K. Fausch, and A. Covich. 2000. Measuring the total economic value of restoring ecosystem services in an impaired river basin: results from a contingent valuation survey. Ecological Economics. 33 (1) 103-117.

30
Manouka, B. 2001. Existence value: a re-appraisal and cross-cultural comparison.
Research Report. Singapore: Economy and Environment Program for Southeast Asia (EEPSEA). McConnell, K.E. 1997. Does altruism undermine existence value? Journal of Environmental Economics and Management. 32: 22-37. Mitchell, R. and R. Carson. 1989. Using surveys to value public goods: the contingent valuation method. Resources for the Future, Washington D.C. Murphy, J.J., P. G. Allen T.H. Stevens, and D.Weatherhead. 2004. A meta-analysis of hypothetical bias in stated preference valuation. Environmental and Resource Economics. 30, 313-325. Pearce, D. and D. Moran. 1994. The economic value of biodiversity. London: Earthscan Publications Ltd.172 p. Polasky, S., O. Gainutdinova, & J. Kerkvliet. 1996. Comparing CV Responses with Voting. Behavior: Open-Space Survey and Referendum in Corvallis, Oregon (W-133 Benefits and Costs Transfer in Natural Resources Planning, 9th Interim Report). Department of Economics, Iowa State University. Predo, C. 1995. Estimating the recreation and preservation benefits of Lake Danao national park. M.S. Thesis. School of Environmental Science and Management, University of the Philippines Los Baños, College, Laguna, Philippines. Purzuelo, M. 2003. Community mapping of the Northwest Panay Peninsula Natural Park. A report submitted to Dr. Samuel Koffa. Green Forum Panay. Iloilo City. Ready, R., J. Buzby, and D. Hu. 1996. Differences between continuous and discrete contingent value estimates. Land Economics. 72(3):397-411. Ready, R. C., J. C Whitehead, and G.C. Blomquist.1995. Contingent Valuation When Respondents Are Ambivalent. Journal of Environmental Economics and Management, 29(2) 181-96. Reaves, D.W., R.A. Kramer, and T. P. Holmes. 1999. Does question format matter? Valuing an endangered species. Environmental and Resource Economics. 14(3) 365-383. Samnaliev, M. , T. Stevens. and T. More (2003): A Comparison of Cheap Talk and Alternative Certainty Calibration Techniques in Contingent Valuation, Working Paper No. 2003-11, Department of Resource Economics, University of Massachusetts Amherst. Schechter, S., J. Blair, and J.V. Hey. 1996. Conducting cognitive interviews to test self-administered and telephone surveys: Which method should we use? http://www.amstat.org/sections/SRMS/Proceedings/y1996f.html.

31
Shultz, S., J. Pinazzo, and M. Cifuentes, 1998. Opportunities and Limitations of Contingent Valuation Surveys to Determine National Park Entrance Fees: Evidence from Costa Rica. Environment and Development Economics; 3(1), pages 131-49. Spash, C., J.D. Werfftenbosch, S. Westmacott and J. Ruitenbeek. 2000. Lexicographic preferences and the contingent valuation of coral reef biodiversity in Curacao and Jamaica. In Gustavson, K., R. Huber and J. Ruitenbeek (eds.). Integrated coastal zone management of coral reefs: decision support modeling. Washington, D.C.: The World Bank
Stevens, T.H., T.A. More, and R.J. Glass. 1994. Interpretation and temporal stability of CV bids for wildlife existence: a panel study. Land Economics, 70 (3): 355-363, Stevens, T.H., J. Echeverria, R.J. Glass, T. Hager, and T.A. More. 1991. Measuring the existence value of wildlife: what do CVM estimates really show? Land Economics, 67 (4): 390-400, Strazzera, E., M. Genius, R. Scarpa, and G. Hutchinson. 2003. The Effect of Protest Votes on the Estimates of WTP for Use Values Recreational Sites, Environmental and Resource Economics, Volume 25, Number 4, pp. 461-476(16) Subade, R.F. 2005. Economic valuation of biodiversity conservation of a world heritage site: citizens’ non-use values for Tubbataha Reefs National Marine Park, Sulu Sea, Philippines. Research Report No. 2005-RR5. Economy and Environment Program for Southeast Asia (EEPSEA). Singapore. Turner, K. R., D. Pearce, and I. Bateman. 1993. Environmental Economics: An elementary introduction. The Johns Hopkins University Press. Vossler, C. A., R. Ethier, G. L. Poe, and M. P. Welsh. 2003. Payment Certainty in Discrete Choice Contingent Valuation Responses: Results from a Field Validity Test. Southern Economic Journal, 69, 216-232. Whittington, D. 1998. Administering contingent valuation surveys in developing countries, World Development. 26, 21-30 Whittington, D. 2002. Improving the Performance of Contingent Valuation Surveys in Developing Countries’, Environmental and Resource Economics:22(1–2), 323–367. Whittington, D., J.Davis, H. Miarsono, and R. Pollard. 2000. Designing “neighborhood deal” for urban sewers: a case study of Semarang, Indonesia. Journal of Planning, Education and Research 19:297-308 Whittington, D. 2004. Ethical Issues with Contingent Valuation Surveys in Developing Countries: A note on Informed consent and other concerns. Environmental and Resource Economics: 28, 507-515 Whittington, D. 2005. Personal communications. November 14, 2005
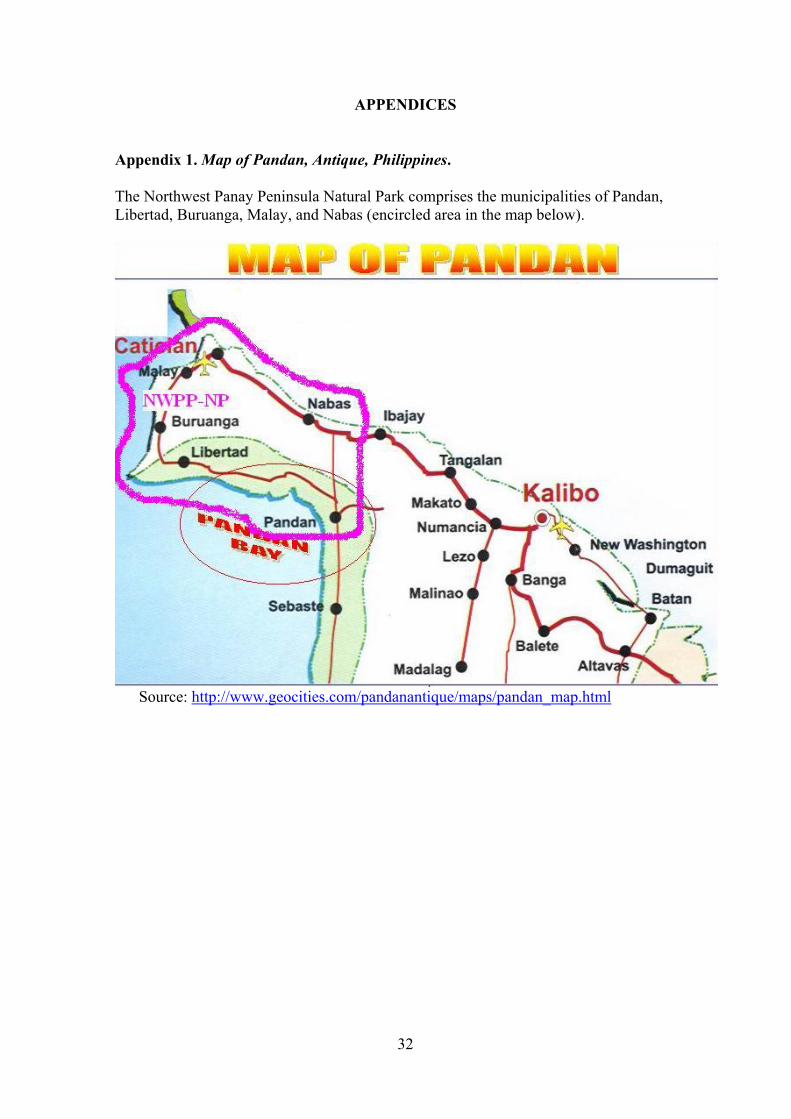
32
APPENDICES
Appendix 1. Map of Pandan, Antique, Philippines. The Northwest Panay Peninsula Natural Park comprises the municipalities of Pandan, Libertad, Buruanga, Malay, and Nabas (encircled area in the map below).
Source: http://www.geocities.com/pandanantique/maps/pandan_map.html

33
Appendix 1A Opportunity costs assuming that 100% of the total households within NWPPNP would be affected
Population -15,818 # of Hholds=3163
Forest-based Product Unit Selling Price Average Estimated
Benefits Minimum Benefits
Maximum Benefits Minimum Maximum
A. Wood Timber Piece 50 100 2,846,700.00 1,897,800.00 3,795,600.00 Coconut Lumber Board Feet 4 11 284,670.00 151,824.00 417,516.00 Firewood Bundle 3 50 1,005,834.00 113,868.00 1,897,800.00 Charcoal Putos/Sack 5 85 1,708,020.00 189,780.00 3,226,260.00 B. Raw Materials Bamboo Piece 10 50 1,138,680.00 379,560.00 1,897,800.00 Bariw (Palm-like Tree) Bundle 100 150 4,744,500.00 3,795,600.00 5,693,400.00 Rattan Bundle 25 25 948,900.00 948,900.00 948,900.00 C. Finished Products Broom Bundle 12 100 2,125,536.00 455,472.00 3,795,600.00 Pineapple (piña) Cloth Meter 100 100 3,795,600.00 3,795,600.00 3,795,600.00 Rope (lubid) Bundle 19 27 872,988.00 721,164.00 1,024,812.00 Mat (banig) Piece 35 100 2,562,030.00 1,328,460.00 3,795,600.00 Hats Piece 40 50 1,708,020.00 1,518,240.00 1,897,800.00 Placemats Piece 18 49 1,271,526.00 683,208.00 1,859,844.00 D. Crops Root Crops Lata/Big Can 35 50 1,613,130.00 1,328,460.00 1,897,800.00 Banana Sack 165 200 6,926,970.00 6,262,740.00 7,591,200.00 E. Vegetables & Fruyas Buidle/Kilo 5 30 664,230.00 189,780.00 1,138,680.00 F. Copra Kilo 4 15 360,582.00 151,824.00 569,340.00 G. Wild Orchids Piece
5 20 474,450.00 189,780.00 759,120.00

34
Forest-based Product Unit Selling Price
Average Estimated Benefits
Minimum Benefits Maximum Benefits Forest-based
Product H. Wild Animals Snake Piece consumed consumed Monitor Lizard Piece consumed consumed Monkey Piece 50 100 237,225.00 158,150.00 316,300.00 Hornbills Piece 75 100 276,762.50 237,225.00 316,300.00 Wild Boar/warty pig Piece consumed consumed - - TOTAL 35,566,353.50 24,497,435.00 46,635,272.00

35
Appendix Table 1B Opportunity costs assuming that 100% of the total households within NWPPNP would be affected, but allowing harvesting of some raw materials, enabling people to come up with certain finished products, crops like vegetables and copra
Population = 15,818 # of H’holds= 3163 Forest-based Product Unit Selling Price Average Estimated
Benefits Minimum Benefits
Maximum Benefits Minimum Maximum
A. Wood Timber Piece 50 100 2,846,700.00 1,897,800.00 3,795,600.00 Coconut Lumber Board Feet 4 11 284,670.00 151,824.00 417,516.00 Firewood Bundle 3 50 1,005,834.00 113,868.00 1,897,800.00 Charcoal Putos/Sack 5 85 1,708,020.00 189,780.00 3,226,260.00 B. Raw Materials Bamboo Piece 10 50 Bariw (Palm-like Tree) Bundle 100 150 Rattan Bundle 25 25 C. Finished Products Bundle Broom Bundle 12 100 Pineapple (piña) Cloth Meter 100 100 Rope (lubid) Bundle 19 27 Mat (banig) Piece 35 100 Hats Piece 40 50 Placemats Piece 18 49 D. Crops Root Crops Lata/Big Can 35 50 Banana Sack 165 200 E. Vegetadles & Fruyas Bundle/Kilo 5 30 F. Copra Kilo 4 15 G. Wild Orchids Piece 5 20 474,450.00 189,780.00 759,120.00 H. Wild Animals Snake Piece consumed consumed Monitor Lizard Piece consumed consumed
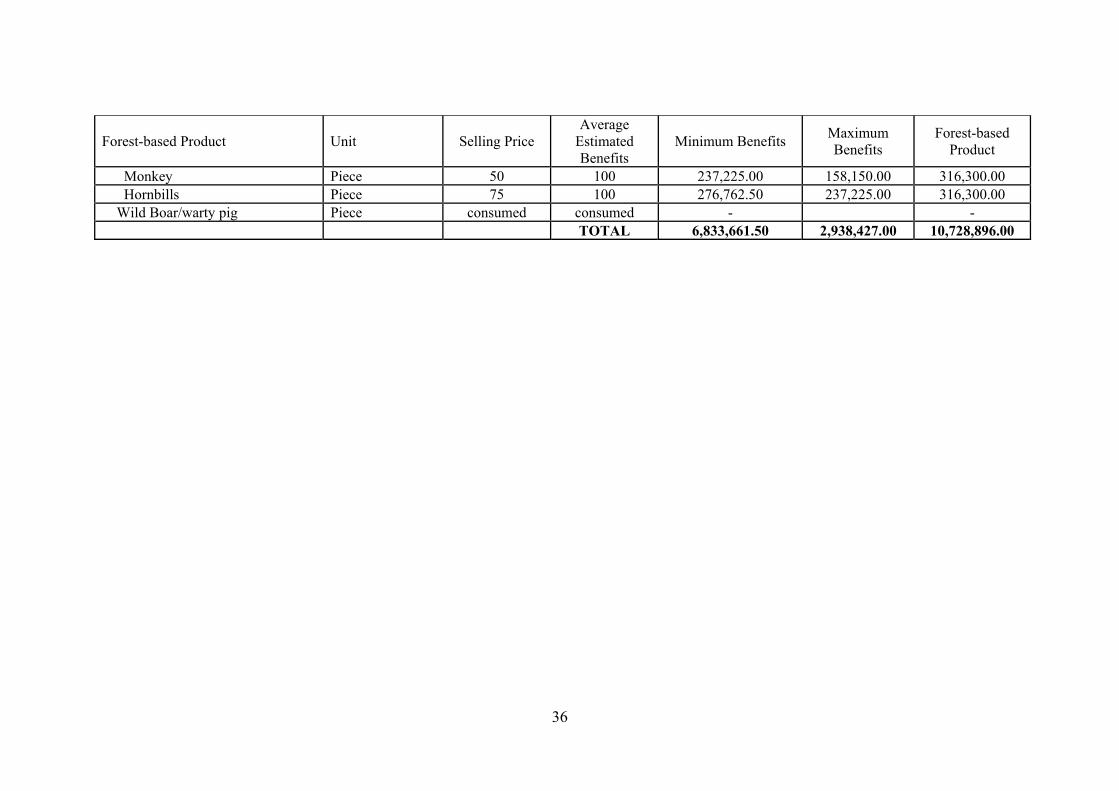
36
Forest-based Product Unit Selling Price Average
Estimated Benefits
Minimum Benefits Maximum Benefits
Forest-based Product
Monkey Piece 50 100 237,225.00 158,150.00 316,300.00 Hornbills Piece 75 100 276,762.50 237,225.00 316,300.00 Wild Boar/warty pig Piece consumed consumed - - TOTAL 6,833,661.50 2,938,427.00 10,728,896.00
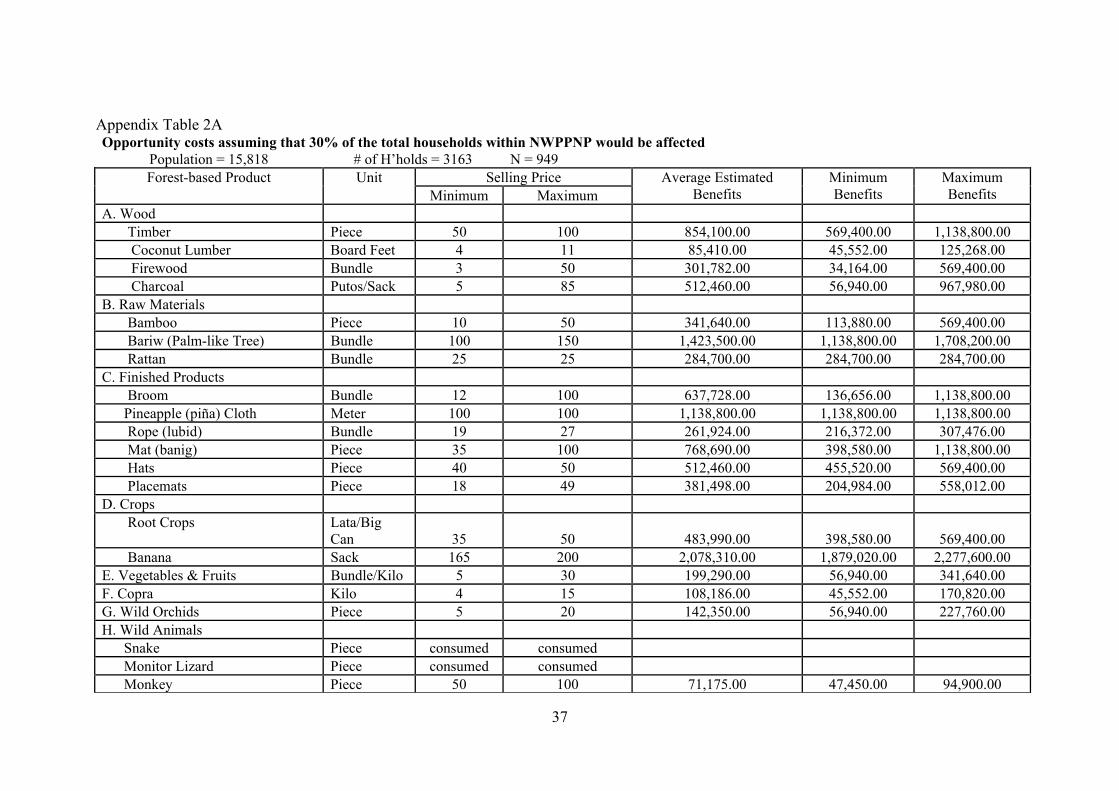
37
Appendix Table 2A Opportunity costs assuming that 30% of the total households within NWPPNP would be affected
Population = 15,818 # of H’holds = 3163 N = 949 Forest-based Product Unit Selling Price Average Estimated
Benefits Minimum Benefits
Maximum Benefits Minimum Maximum
A. Wood Timber Piece 50 100 854,100.00 569,400.00 1,138,800.00 Coconut Lumber Board Feet 4 11 85,410.00 45,552.00 125,268.00 Firewood Bundle 3 50 301,782.00 34,164.00 569,400.00 Charcoal Putos/Sack 5 85 512,460.00 56,940.00 967,980.00 B. Raw Materials Bamboo Piece 10 50 341,640.00 113,880.00 569,400.00 Bariw (Palm-like Tree) Bundle 100 150 1,423,500.00 1,138,800.00 1,708,200.00 Rattan Bundle 25 25 284,700.00 284,700.00 284,700.00 C. Finished Products Broom Bundle 12 100 637,728.00 136,656.00 1,138,800.00 Pineapple (piña) Cloth Meter 100 100 1,138,800.00 1,138,800.00 1,138,800.00 Rope (lubid) Bundle 19 27 261,924.00 216,372.00 307,476.00 Mat (banig) Piece 35 100 768,690.00 398,580.00 1,138,800.00 Hats Piece 40 50 512,460.00 455,520.00 569,400.00 Placemats Piece 18 49 381,498.00 204,984.00 558,012.00 D. Crops Root Crops Lata/Big
Can 35 50 483,990.00 398,580.00 569,400.00 Banana Sack 165 200 2,078,310.00 1,879,020.00 2,277,600.00 E. Vegetables & Fruits Bundle/Kilo 5 30 199,290.00 56,940.00 341,640.00 F. Copra Kilo 4 15 108,186.00 45,552.00 170,820.00 G. Wild Orchids Piece 5 20 142,350.00 56,940.00 227,760.00 H. Wild Animals Snake Piece consumed consumed Monitor Lizard Piece consumed consumed Monkey Piece 50 100 71,175.00 47,450.00 94,900.00

38
Forest-based Product Unit Selling Price
Average Estimated Benefits
Minimum Benefits Maximum Benefits
Forest-based Product
Hornbills Piece 75 100 83,037.50 71,175.00 94,900.00 Wild Boar/warty pig Piece consumed consumed - TOTAL 10,671,030.50 7,350,005.00 13,992,056.00

39
Appendix Table 2B Opportunity costs assuming that 30% of the total households within NWPPNP would be affected, but allowing harvesting of some raw materials, enabling people to come up with certain finished products, crops like vegetables and copra
Population =15,818 # of H’holds=3163 N=949 Forest-based Product Unit Selling Price Average Estimated
Benefits Minimum Benefits
Maximum Benefits Minimum Maximum
A. Wood Timber Piece 50 100 854,100.00 569,400.00 1,138,800.00 Coconut Lumber Board Feet 4 11 85,410.00 45,552.00 125,268.00 Firewood Bundle 3 50 301,782.00 34,164.00 569,400.00 Charcoal Putos/Sack 5 85 512,460.00 56,940.00 967,980.00 B. Raw Materials Bamboo Piece 10 50 Bariw (Palm-like Tree) Bundle 100 150 Rattan Bundle 25 25 C. Finished Products Broom Bundle 12 100 Pineapple (piña) Cloth Meter 100 100 Rope(lubid) Bundle 19 27 Mat (banig) Piece 35 100 Hats Piece 40 50 Placemats Piece 18 49 D. Crops Root Crops Lata/Big Can 35 50 Banana Sack 165 200 E. Vegetables & Fruits Bundle/Kilo 5 30 F. Copra Kilo 4 15 G. Wild Orchids Piece 5 20 142,350.00 56,940.00 227,760.00 H. Wild Animals Snake Piece consumed consumed Monitor Lizard Piece consumed consumed
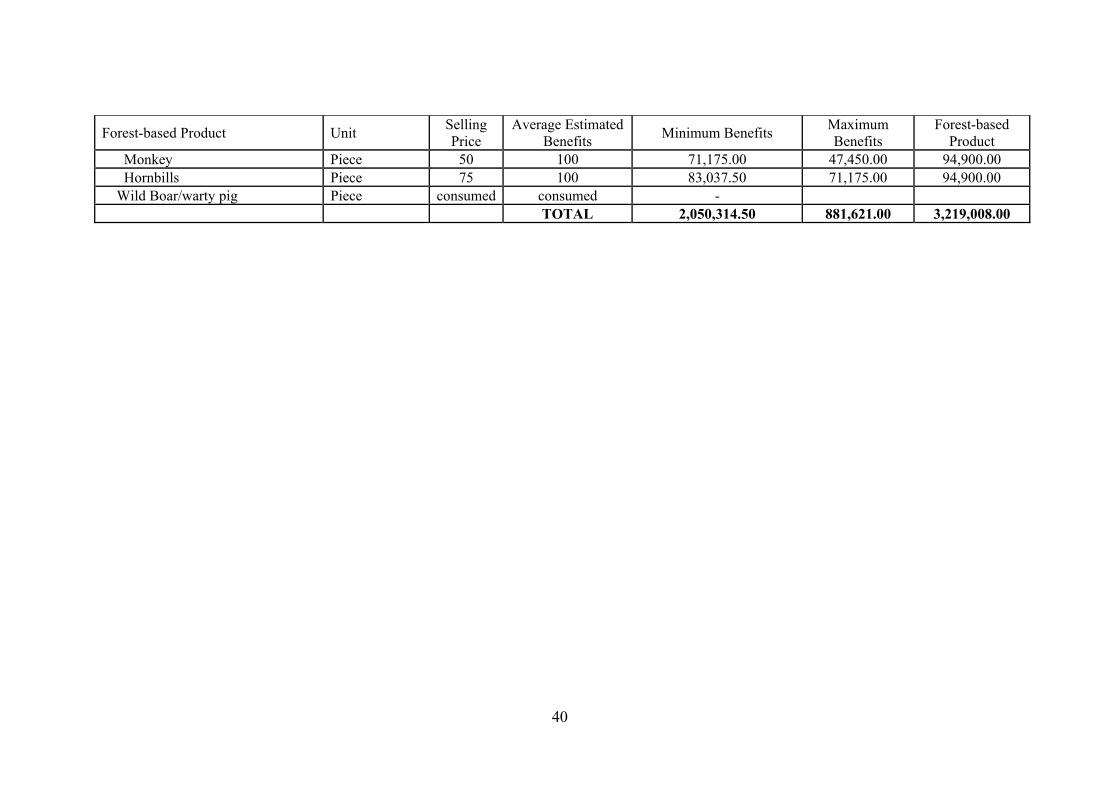
40
Forest-based Product Unit Selling Price
Average Estimated Benefits
Minimum Benefits Maximum Benefits
Forest-based Product
Monkey Piece 50 100 71,175.00 47,450.00 94,900.00 Hornbills Piece 75 100 83,037.50 71,175.00 94,900.00 Wild Boar/warty pig Piece consumed consumed - TOTAL 2,050,314.50 881,621.00 3,219,008.00


Economy and Environment Program for Southeast Asia 22 Cross Street, #02-55 South Bridge Court, Singapore 048421
Phone: (65) 6438-7877; Fax: (65) 6438-4844 URL: http://www.eepsea.org; E-mail: [email protected]