economics program working paper series - the …€¦ · leading indicators of economic activity...
TRANSCRIPT

Economics Program
845 Third Avenue
New York, NY 10022-6600
Tel. 212-339-0420
http://www.conference-board.org/publications
Economics Program Working Paper Series
Using a Leading Credit Index to Predict Turning Points
in the U.S. Business Cycle
Gad Levanon
Jean-Claude Manini
Ataman Ozyildirim
Brian Schaitkin
Jennelyn Tanchua
The Conference Board
December 2011
EPWP #11 – 05

Using a Leading Credit Index to Predict Turning Points in the U.S. Business
Cycle1
Gad Levanon
Jean-Claude Manini
Ataman Ozyildirim
Brian Schaitkin
Jennelyn Tanchua
The Conference Board
December 2011
Abstract
Financial indicators such as yield curves and stock prices have been extensively used as
leading indicators of economic activity due to their forward looking content. Indeed, the
Leading Economic Index (LEI) for the United States, a widely used forecasting tool for
business cycle turning points, includes several financial components. However, we argue that
the coverage of financial and credit market activity in the LEI can be improved to account for
some of the structural changes in the U.S. economy (especially in financial markets) and we
present evidence that at least one of the existing components, namely real money supply does
not perform as well as it used to as a leading indicator in the past several decades. Over the
past three decades, many new financial indicators, such as interest rate swaps, credit default
swaps, certain corporate-treasury spreads, the Federal Reserve’s senior loan officer survey,
etc. have become available, but, since most of these new indicators have not been available
for a long enough period, very little research has been conducted to evaluate their utility as
leading indicators. In this paper we evaluate the usefulness of a large number of financial
indicators according to their ability to predict recessions (i.e. peaks in the business cycle).
First, we establish the criteria which are helpful for assessing whether and when such
financial indicators generate signals of recessions. We then choose the best ones and
aggregate them into a single composite index of financial indicators which we name the
Leading Credit Index (LCI). Our approach differs from others in the literature in that we
focus on a small, carefully selected set of indicators as index components and, additionally, in
our selection criteria we target business cycle turning points rather than financial stability. We
argue that this leading credit index can be helpful to estimate recession probabilities better
than individual indicators, including some of the existing components of the LEI, especially
real money supply. As opposed to other recent financial indexes created to measure financial
instability or volatility, the purpose of ours is to signal recessions in the US economy, and as
such it could serve as an appropriate new component for the U.S. LEI.
Keywords: business cycles, turning points, forecasting, financial conditions, money and
credit
1 © The Conference Board, Inc. 2011. Corresponding author: Ataman Ozyildirim, [email protected]. We would like to
thank members of The Conference Board Business Cycle Indicators Advisory Panel, and seminar participants at the CIRET Workshop in
Moscow, September 2011, and at the Fifth Joint EU/OECD Workshop on Recent Developments in Business and Consumer Surveys for
helpful comments and suggestions. We would also like to thank Justyna Zabinska for excellent research assistance. All remaining errors are,
of course, ours. The views expressed in this paper are those of the author(s) and do not necessarily represent those of The Conference Board.

1. Introduction
The latest global recession highlighted the importance of the link between the financial sector
and the real economy. Moreover, there are complex interactions between financial cycles and
economic cycles. The relationship between the two sectors has not been very well understood
and incorporated into macroeconomic models. The indicator approach which is focused on
measuring and analyzing the business cycle can help to improve the understanding of how the
financial and economic cycles evolve over time.2
In this paper we review some of the available financial, monetary, credit market indicators
from the perspective of their relationship with the general business cycle of the U.S.
economy. We find that it is possible to identify some new financial indicators that are useful
in predicting recessions and recoveries. We argue that aggregating our selected indicators into
a composite index offers advantages over relying on them individually. These advantages
come from the ability of the simple, easy to calculate and transparent methodology of the
composite index approach to generate reliable and smooth estimates of an unobserved
business cycle variable.
The current ten leading index components each attempt to measure a different aspect of
general economic activity including contractual relationships (i.e. orders, permits, etc.) and
expectations or sentiment (i.e., consumer expectations and stock market prices). The leading
index has three financial variables: real money supply, index of stock prices, and the interest
rate spread. In this paper we argue that these indicators don’t fully capture the complex and
changing nature of the interactions and impact of the financial sectors and real economic
activity and propose a new financial activity index that attempts to remedy this shortfall. We
show that a new composition of the leading economic index (LEI) which uses the resulting
composite index of financial indicators performs better than the current composition of the
LEI.
2 The indicator approach to business cycle research is just one of many ways to study and analyze business
cycle. It was first introduced by Mitchell and Burns (1938) and since then it has figured prominently in the NBER
business cycle program. The timing and chronologies of business cycles and the classifications of economic
indicators have been useful over the years. Currently, The Conference Board continues this tradition in its
indicators program.

There is a growing literature on indexes of financial conditions and stability. Recent research
such as Hatzius et. al. (2010)3 and Brave and Butters (2011)
4 among others also explores
some of these issues. A number of new indexes of financial conditions and financial stability
have been proposed in the recent literature. In contrast to most of the recent literature on
financial instability, in this paper, we propose a new composite leading index of financial
indicators, following the indicator approach of relying on a small set of carefully selected
components. Our aim is to focus on financial indicators that can help predict turning points in
general economic activity broadly defined. In our approach, the business cycle chronology
determined by NBER and a composite index of current economic condition given by The
Conference Board Coincident Economic Index (CEI) are key components of the evaluation
and scoring of the leading indicators from the financial sector. In this paper we also evaluate
some of the other new indexes of financial conditions and ask how they compare with our
proposed index in capturing business cycle movements. Finally, we are interested in finding
out whether such financial indexes can serve well as leading indicators of economic activity
and whether they could help improve the composite index of leading economic indicators
(LEI) published by The Conference Board.
A further motivation for this study comes from the one of the existing components of the LEI,
namely real money supply measured by the monetary aggregate M2 (deflated by the deflator
for personal consumption expenditures). We present empirical evidence showing that real
money supply as measured by the monetary aggregate M2, one of the ten components of the
LEI, has ceased to be a good leading indicator in the United States. As an important indicator
of monetary and credit conditions, real money supply, has been a component of the LEI for
the US since the 1970s. However, empirical evidence over the last two decades suggests that
the relationship between general economic activity and monetary aggregates such as M2
adjusted for inflation has undergone a major change, at least in the US economy. More
specifically, real M2 performed well as leading indicator until the late1980s, but its
relationship with business cycles has weakened and become unstable since. In fact, in the
3 Jan Hatzius, Peter Hooper, Frederic Mishkin, Kermit L. Schoenholtz and Mark W. Watson (April 2010)
“Financial Conditions Indexes: A Fresh Look after the Financial Crisis”
4 Scott Brave, R. Andrew Butters (2011) ”Gathering Insights on the Forest from the Trees: A New Metric for
Financial Conditions ”

most recent decade it appears to be inversely related to current economic activity. For
example, real M2 remained on an uptrend in the period prior to the start of the recession in
December 2007. Indeed, continued increases in real M2 had provided the largest positive
contributions to the index at that time, which helped keep the LEI generally flat from January
2006 to the middle of 2007 and prevented a sharper decline in the second half of 2007.5
Since the late 1970s when real M2 was added to the LEI as a component, the U.S. economy
and the banking and financial sectors have gone through deregulation and structural changes
in the subsequent decades. The earlier observed relationship between real M2 and general
economic conditions is no longer observed in the data6. Real M2 began to lag the CEI, our
preferred monthly measure of current economic conditions, in the mid-1990s. Levanon (2010)
shows that, compared to other leading indicators and the LEI itself, real M2 has performed
poorly as a leading indicator since 1989.7
Given the importance of the financial sector developments for the economy it is crucial to
capture the impact of this activity on the business cycle. The turning point analysis used in the
development and evaluation of composite indexes by The Conference Board as well as the
non-linear methods of indicator evaluation and selection proposed by Levanon (2010) is used
to score the new financial indicators (the latter evaluate and compare the ability of individual
leading indicators to signal recession probabilities while the former evaluate the relationship
between the turning points of the individual indicators with those of the business cycle).
Our proposed index has six components and it aggregates different types of quantitative and
qualitative survey indicators using principal component analysis8. We argue that this new
index can reasonably capture important channels through which the financial sector can
impact the real economy. The components of our proposed index are 1) 2-year Swap Spread,
5 See Tanchua, Jennelyn, “The Conference Board Leading Economic Index
® for the United States in the 2007
Recession,” Business Cycle Indicators, February 2010. 6 See Levanon, Gad, et.al., “Real M2 and Its Impact on The Conference Board Leading Economic Index
® (LEI)
for the United States,” Business Cycle Indicators, March 2010. 7 Levanon, Gad “Evaluating and Comparing Leading and Coincident Economic Indicators,” Business
Economics, Vol. 45, No. 1, 2010, pp. 16–27.
8 The principal component method can be used for the Leading Credit Index because it includes only six
components. Forni, Hallin, Lippi and Reichlin (2004) argue that while the principal component methodology is
useful for extracting common factors from a small number of time series, dynamic factor models are more
effective in extracting common factors when a large number of series are used.

2) LIBOR 3 month less 3 month Treasury-Bill yield spread, 3) Debit balances at margin
account at broker dealer, 4) AAII Investors Sentiment Bullish (%) less Bearish (%), 5) Senior
Loan Officers C&I loan survey – Bank tightening Credit to Large and Medium Firms, 6)
Total Finance: Liabilities – Security Repurchase. We also show that the forecasting
performance of the leading index can be improved upon if our new index of financial
conditions is used as a component of the LEI replacing the money supply measure currently
used as a component. It’s important to note that the forecasting tests are constructed with the
real time performance of the LEI in mind (tests use unrevised data and compared out of
sample forecasts) and that they were not used in the indicator selection process (the selection
process avoids explicit statistical model fitting).
The paper is organized as follows. Section 2 discusses the relationship between financial
activity and real economic activity to help identify the conceptual and theoretical
underpinnings for identifying financial indicators. Section 3 briefly discusses the changing
relationship between real monetary aggregates (namely real M2) and economic activity.
Section 4 is on existing financial conditions indexes and section 5 describes our proposed
index and its components as well as the basis for their selection. Section 6 reports the
evidence on real time forecasting performance of the proposed index and the impact it has on
the real time forecasting performance of the LEI. Section 7 concludes.
2. The relationship between financial markets and the real economy
In a world with perfectly functioning and complete financial markets, the transmission
channels between financial markets and the real economy – which are sometime called
neoclassical channels9
– are mainly price related channels. Indeed in such an ideal economy,
interest rates, foreign exchange rates and asset prices are the main channels through which
monetary policy and overall financial conditions interact with the real economy.10
The
structures of balance-sheets have no effect on the economy.11
9 See Jean Boivin, Michael T. Kiley, Frederic Mishkin , “How has Monetary Transmission Mechanism evolved
over Time?”, NBER Working Paper Series, Working Paper 15879, April 2010
10 For example, financial conditions influence the real economy via investments channels (cost of capital and
Tobin’q), consumption channels (wealth effect and intertemporal substitution effect) and international trade channels (see Boivin and All for more details)
11 As in the Monetarist view of Friedman or the Irrelevance view of Modigliani and Miller.

However, financial markets do not function perfectly. Among others, asymmetric information
and incomplete contracts12
lead to frictions, credit rationing and incomplete markets. In a
context where the different sources of funding are not completely substitutable,13
the
structures of economic agents’ balance-sheets are keys and banks have a specific role to play
in the allocation of capital. The corresponding transmission channels between financial
markets and the real economy – that are some times called non-neoclassical channels – are the
balance-sheets channels and the bank based channels.14
The main balance-sheets channel is the financial accelerator15
which is concerned by
borrowers’ balance-sheets - more specifically their net worth – and their ability to use it as
collateral. As implied by the name, the underlying mechanism involves a feedback loop
between credit conditions and the real economy that tends to be pro-cyclical.16
The bank based channels focuses on the balance-sheets of lenders, e.g. banks and other
financial institutions, as their structures influence their lending policies. More specifically,
their ability and willingness to lend can be affected by a duration mismatch17
- a shortage of
liquid asset or a problem of funding – or a capitalization effect – where the capital ratio is too
low given assets risk.
12
Both problems favor adverse selection and moral hazard.
13 Especially for Small and Medium Enterprises (SMEs) and consumers.
14 We use the terminology of Boivin and All 2010.
15 See Bernanke, Ben and Mark Gertler, “Agency Costs, Net Worth, and Business Fluctuations”, American
Economic Review, volume 79(1), page 14-31, March 1989 and Bernanke Ben, Mark Gertler, Simon Gilchrist,
“the Financial Accelerator in Quantitative Business Cycle Framework” in John B. Taylor and Micheal Woodford,
Editors, “Hanbook of Macroeconomics”, Elsevier, volume 1, part 3, pages 1341 – 1393, 1999.
16 Note that a tightening of financial conditions due to higher interest rate may reduce cash-flows and increase
the need for external funding, leading to similar constraints – this latter effect highlight the fact even nominal
interest rates can have an effect of the real economy.
17 Here, we use the terminology of Jürgen Antony and Peter Broer, “Linkage between the Financial and the Real
Sector of the Economy, A Litterature Survey”, CPB Documents, No 216, December 2010.

Some authors consider the existence of an additional transmission channel, the risk channel,18
which is independent from other real or financial variables. It may be related to the so-called
“greed and fear” cycles19
and to the “animal spirits”20
that are of particular importance in an
incomplete market context.21
It may also play a growing role in market based banking sector.
However empirical evidence tends to be model dependent and of little use. Moreover, this
channel may already be taken into account by stock prices. Overall, we tend to see it as an
additional support for the inclusion of financial indicators in LEIs.
The importance of the different transmission channels depends on the source of shocks. A
detailed knowledge of the transmission channels is important because the sources of the
shocks that affect financial conditions are not always the same and because the relative
importance of the different channels depends on the nature of the shock. The most common
source of shocks is monetary policy. But shocks also originate in the real economy – e.g.
productivity shocks – or on financial markets – e.g. assets prices shocks. Of course all these
shocks tend to interact, highlighting among other the interactive nature of the relationship
between the real and the financial economies. The neoclassical channels or prices channels
always play an important role. Moreover, a majority of these shocks can be detected by the
existing set of components of the LEI. However, the relative importance of non neoclassical
channels – i.e. of balance-sheets – tends to increase in case of financial stress as highlighted
by the financial crisis. As it is likely affect the pattern of recession and recovery, it lends
support to the idea to include indicators specifically related to these transmission channels.22
The evolving nature of the relationship between financial markets and the real economy
Looking for indicators related to the non neoclassical channels brings us to a discussion on
the relationship between monetary aggregates (represented by real M2 as a component of the
18
Here, we use the terminology of Antony and Broer 2010.
19 These are a type of liquidity cycles.
20 This is our interpretation.
21 In the work of Minsky 1978, financial instability and credit bubbles are endogeneous and largely due to wave
of euphoria and anxiety. Economic Historians – like Kindleberger – have been sympathetic to that view by
pointing out recurrent episodes of credit-driven financial instability.

LEI) and business cycles. The potential causes of the break of the relationship between the
two help to identify new indicators. The purpose is to deepen the analysis of the two main
causes identified earlier23
in order to assess their robustness and the likelihood of other
changes.
Changes in the monetary policy transmission channel24
The changes of the goals and the strategy of the Federal Reserve (Fed) that took place during
the last two or three decades went beyond the shift from targeting monetary aggregates to
targeting the Federal Funds rate (Fed fund). In spite or because of its dual mandates – which
can be interpreted as minimizing the unemployment rate subject to a constraint of prices
stability – the Fed has put more emphasis on inflation25
and the anchoring of inflation
expectations. As a result, interest rates expectations and their “management” have seen their
influence on the monetary policy transmission channel growing over time. The successful
anchoring of inflation expectations26
has been achieved by relying on an approach focused on
the deviations from trend growth and from targeted inflation. Empirical evidence is mixed,
but it seems that the success of this strategy has reduced the influence of monetary policy on
growth while making its effects more persistent.
Overall, the change of emphasis of monetary policy that took place in between the 1980s and
1990s seems to have weakened the link between real economic activity and credit on the one
hand and monetary aggregate on the other. As a result, tracking the stance of monetary policy
and its expected impact on economic activity27
with interest rates related indicators, like the
yield spread - which provides an indirect view on the term structure of interest rate and
23
See “The Conference Board Leading Economic Index® for the United States in the 2007 Recession,” Business
Cycle Indicators, February 2010.
24 We use the terminology and the analysis of Boivin and All 2010.
25 It does not mean that Fed ignored inflation before, but it relied on different approach. For example, it used
an intermediary target – a monetary aggregate – during the Volker’s era. Note that the Fed has still not a
formal inflation target – e.g. as the Bank of England – even if it has moved closer to that approach recently.
26 And the resulting credibility.
27 The term premium – i.e. the difference between 10 year Treasury yield and Fed Funds – depends on the level
of official rates which are targeted by the Fed and the 10 year yield which results from investors expectations.
Of course, nominal yields do not allow disentangling the effect of expected inflation.

therefore on investors’ expectations– seems sufficient from a business cycle tracking point of
view.
Of course, one can wonder in which direction the conduct of monetary policy will evolve in
the future and if the increased volatility of the short term velocity of money is permanent.
Among the factors that may influence the choices of policymakers in the futures, three related
factors deserve some attention: the long term inflation outlook, the zero-bound for nominal
interest rate and the potential broadening of the scope of monetary policy to prevent bubbles.
Looking forward, one can wonder if the current ultra-loose policy-mix will not lead to a
structurally higher inflation rate.28
Bordo and Filardo (2006)29
show a relationship between
the inflation regime, the behaviour of the velocity of money and the interest of the
information provided by monetary aggregates. They suggest the existence of a U –shaped
curve where the importance of monetary aggregates grows at the extremes – i.e. deflation or
high inflation. Of course, their aim is to make the case for the use of monetary aggregates in
the conduct of monetary policy,30
not to suggest that the relationship between monetary
aggregates and the business cycles may become more stable in some inflation regimes. They
also highlight the issue of the zero bound for interest rates whose importance was illustrated
by the non-orthodox strategies implemented by the Federal Reserve.31
It should also be noted
that the zero-bound may also affect the signal provided by the yield spread. In any case, the
crisis is likely to have lasting effect on the way monetary policy is viewed and implemented.
There is therefore a potential case for completing the yield spread – and stock prices – with
non-price indicators to track developments on credit markets and the stance of monetary
policy.
28
In a provocative note, Blanchard, the Chief Economist of the IMF, suggested to increase the inflation target in
advanced economies.
29 Michael D. Bordo and Andrew Filardo, “Money Still makes the World Go Round: the Zonal View”, paper
prepared for the 21st
Congress of the European Economic Association held in Vienna in August 2006.
30 Indeed they vindicate a two pillars policy, like the strategy of the ECB.
31 Of course, the key role played by broker dealers in a market based credit market, in particular in the
securitization process, also explains why the Fed used its balance-sheet to backstop the markets that froze at
the worst of the crisis.

2.3 Indicators of the price and the availability of credit
The business model of banks started to change well before the shift in monetary policy and
the structural reforms in the 1980s. Indeed, the post WWII period saw a trend increase in the
leverage of banks and in the riskiness of their assets.32
It reinforced the need for funding and
the importance of assets as collateral and weakened the relationship between money and
credit.33
The deregulation, the financial innovations – in particular the development of
securitization – and the globalisation that started or accelerated during the 1980s mainly
reinforced that trend and contributed to completing the move toward a market based financial
system.34
Adrian and Shin (2010) provide a detailed description and analysis of what is meant by a
market based financial system. One of its main features is the growing importance of three
related phenomenon: securitization, the so-called shadow-banking system and broker dealers.
Securitization has broadened the access to credit and reinforced the role financial market
based interest rates – e.g. mortgages rates are closely related to Treasury yields. But it has not
reduced the importance of non-neoclassical or balance-sheets transmission channels, it has
just changed their nature.
As a result, a specific case can be made to maintain or add credit related indicators in the LEI
for the US. Long term historical evidence also supports that view. Bordo and Haubrich
(2009)35
suggest a close relationship between corporate credit spreads and the business cycle.
They also insist on the importance of credit crunches – i.e. non price related credit rationing –
reinforcing the case for non-price related indicators. However, their econometric analysis
32
See Moritz Schularick and Alan M.Taylor, “Credit Booms go Bust: Monetary Policy, Leverage Cycles and Financial Crisis, 1870 – 2008”, NBER Working Papers Series, Working Paper 15512, November2009.
33 i.e. as long as credit was mainly based on deposit, the relationship was stable and monetary aggregate were
good proxies of credit.
34 See for example Tobias Adrian and Hyun Song Shin, “The Changing Nature of the Financila Intermediation
and the Financial Crisis of 2007-09”, Federal Reserve Bank of New York Staff Reports, Staff Reports no. 439,
March 2010.
35 Michael D. Bordo and Joseph G. Haubrich, “Credit Crisis, Money and Contractions: an Historical View”, NBER
Working Paper Series, Working Paper 15389, September 2009.

shows that the average duration (and asymmetry) of credit cycles doesn’t correspond to the
average duration of business cycle.
Overall, theoretical, historical and statistical evidence supports the inclusion of credit related
and non-price credit related indicators – i.e. quantity and survey based indicators – in the LEI
for the US.
3. The Changing Relationship between Real M2 and Economic Activity
Until the mid-1980s, real M2 performed well as a leading indicator. It could be argued
perhaps that it was able to capture, at least imperfectly, various channels through which
financial and credit activity could impact real economic activity in the short term. It was
procyclical and anticipated turning points in general economic activity. The leading
relationship and usefulness of broad monetary aggregates was documented by Victor
Zarnowitz and Charlotte Boschan in the 1970s.36
When monetary aggregates were deflated
with an appropriate price index, they tended to show consistent leads ahead of business cycle
turning points. This is because late in an economic expansion, nominal money growth tends to
fall as banks become increasingly restrained in their ability to create deposits by the
availability of reserves. At the same time, the increase in prices usually picks up late in the
cycle. Thus, real money balances would typically decline ahead of an economic downturn.
However, this relationship broke down over the past couple of decades as a result of
structural changes in the U.S. economy and the banking and financial sectors (Chart 1). The
10-year correlation between the six-month growth rates in real M2 and the CEI, a measure of
current economic activity, was fairly stable and high at 0.8 during the 1960s and 1970s.
However, this relationship deteriorated in the following decades, and it eventually became
negative during the past decade.
36
Victor Zarnowitz and Charlotte Boschan, “Cyclical Indicators: An Evaluation and New Leading Indexes”,
1977, pp 170-184.

Chart 1, Real M2 and the U.S. CEI
-10
-5
0
5
10
15
20
1960 1965 1970 1975 1980 1985 1990 1995 2000 2005 2010
US CEI
M2 Money Supply
Six-month percent change (annualized)
Levanon (2010) provides further evidence of the changing relationship between real M2 and
economic activity37
and shows that, compared to other leading indicators and the LEI itself,
real M2 has performed poorly as a leading indicator since 1989. For every indicator studied,
the quarters in the sample were ranked by the likelihood of being recession quarters and then
compared with the timing of the actual recessions. For the 1989–2009 period, 10 of real M2’s
12 recession signals were produced in quarters when a well-performing leading indicator
should not have signalled a recession.
The breakdown in the procyclical relationship between real M2 and the CEI can be attributed
to several factors. As suggested above, examples include the shift in the conduct of monetary
policy in the 1980s, when the Federal Reserve abandoned targeting monetary aggregates in
favor of targeting interest rates, weakened the positive link between real M2 and economic
activity. In addition, the innovations that resulted from financial market deregulation— e.g.
the creation of interest-bearing checking accounts and money market funds—spurred safe-
haven demand for real M2. In periods of high risk aversion, such as those that occur before or
during recessions, investors would shift away from risky assets to money, thereby raising M2
balances and creating a negative relationship between real M2 and economic activity. During
these periods, inflation could also fall, which would push real M2 higher and possibly
37
Gad Levanon, “Evaluating and Comparing Leading and Coincident Economic Indicators,” Business
Economics, Vol. 45, No. 1, 2010, pp. 16–27.

magnify its negative relationship to economic activity. The downtrend in inflation since the
1980s could also have contributed to the poor performance of real M2, since it was the
interaction between nominal money balances and inflation that was believed to be important
in making real M2 a suitable leading indicator. A negative relationship between real money
supply and economic activity could occur when nominal M2 is rising faster than the price
level.
3.1 The Impact of Real M2 on the LEI in 2007
Until the 1990s, real M2 had performed fairly well in signalling in advance the peaks and
troughs in economic activity. Since then, real M2 has not conformed well to the business
cycle, missing the 2001 and 2007 recessions (Chart 2). The propensity of real M2 to miss
turning points was also mentioned in Zarnowitz (1992) and documented in the Business
Conditions Digest (December 1989, p. 104). According to these sources real M2 missed six of
the turning points in the business cycles that occurred during 1953 and 1982. Despite this
record, real M2 had fewer false signals and an acceptable leads at peaks and troughs.
According to Zarnowitz (1992) the misses were given less weight than false signals. Thus,
real M2 qualified as a component of the LEI at that time. However, the experience of the last
two decades and the last two or three recessions suggests there may be a potential cost to
including real M2 among the LEI components.
Chart 2, Cyclical Timing of Real M2
1,000
2,000
3,000
4,000
5,000
6,000
7,000
8,000
1960 1965 1970 1975 1980 1985 1990 1995 2000 2005 2010
Billio
ns o
f 2
00
5 $
Real M2

From 2007 to 2008, the correlation between the monthly changes in real M2 and the CEI was
−0.6, while that for real M2 and real GDP was −0.7. Since real M2 continued to increase from
2007 to 2008, the declines in the LEI during this period were smaller compared to what they
would have been had M2 not been in the index (Chart 3).38
Without real M2, the six-month
declines in the LEI would have exceeded 5.0 percent (annual rate) at the beginning of 2008,
which, according to the Three Ds criteria, would have been a stronger recession signal than
the one the present LEI (including real M2) produced.39
Recall that real GDP did not contract
severely until the second half of 2008. (According to revised data in December 2011, real
GDP was negative already in 2008Q1 at -1.8 although 2008Q2 was 1.3. Third and fourth
quarters of 2008 saw deeper contractions in real GDP -- -3.7 and -8.9, respectively)
Chart 3, U.S. LEI with and without Real M2 (Six-Month Annual Rate of Change)
-30
-20
-10
0
10
20
30
1960 1965 1970 1975 1980 1985 1990 1995 2000 2005 2010
US LEI
US LEI excluding M2
Six-month percent change (annualized)
May-11
On the other hand, the peak of the LEI ahead of the latest recession without real M2 would
have been much earlier and far less credible. If real M2 is excluded, the leading index would
have reached a turning point in January 2006, which is 23 months ahead of the cyclical peak.
The turning point in the current leading index is 5 months (Table 1). An earlier peak would
have also eliminated the essentially flat period from January 2006 to July 2007—a pattern that
was generally consistent with economic conditions prevailing at that time. All previous peaks
of the LEI are unaffected by the omission of real M2. However, excluding real M2 from the
38
In general, the amplitude in the LEI is smaller than if real M2 were excluded from the index. 39
According to the “Three-Ds” rule, a recession usually follows when the (annualized) six-month decline in the
LEI reaches at least 4.5 percent and the six-month diffusion index falls below 50 percent.

LEI would change some of its troughs, and reduce the median lead at troughs from 7 months
to 2 months and the average lead from 3.9 months to 2.9 months.
Table 1, Leads/Lags of the LEI
with and without Real M2
Business Cycle Peaks
Current LEI LEI ex M2
Apr-60 -10 -10
Dec-69 -8 -8
Nov-73 -9 -9
Jan-80 -14 -14
Jul-81 -8 -8
Jul-90 -18 -18
Mar-01 -11 -11
Dec-07 -5 -23
Mean -10.4 -12.6
Median -9.5 -10.5
St. Deviation 4.0 5.4
Business Cycle Troughs
Current LEI LEI ex M2
Feb-61 -3 -2
Nov-70 -7 0
Mar-75 -2 -2
Jul-80 -2 -2
Nov-82 -10 -10
Mar-91 -2 -2
Nov-01 -2 -2
Jun-09 -3 -3
Mean -3.9 -2.9
Median -2.5 -2.0
St. Deviation 3.0 3.0
Note: Negative numbers denote number of months of leads.
3.2 The Future of Real M2 as an Indicator
In addition to an unstable relationship with business cycles, our analysis suggests that real M2
is adding noise, rather than relevant information about the economic cycle, to the LEI for the
United States. We are therefore proposing to remove real M2. However, this removal raises
some questions. Firstly, just omitting M2 do not necessarily improve the behaviour of the LEI
for the United States at turning points – see above the impact on the lead time before the last
peak – and therefore this could lead to an increase in the difficulty of interpreting the signals
from the LEI.

It should be noted that the problems of real M2 apply to all the available monetary
aggregates40
which have been evaluated with the approach proposed by Levanon (2010). Of
course, M3 was not tested as it is not published anymore. We could have tested a proxy of M3
but historical and theoretical researches – see below – suggest that other financial and credit
indicators may be more appropriate and that monetary aggregates have ceased to be good
proxies of credits in a market-based financial system.
Secondly, the removal of a leading indicator that has failed to perform during recent turning
points raises the concern of missing signals in the future. Indeed, as business cycles have
different causes and follow different patterns, this leading indicator may prove once again
useful in signalling future turning points. However, the above and below mentioned
explanations for the lack of performance of real M2 since the beginning of 1990s suggest that
a structural shift has taken place and that it is unlikely to be reversed. As a result, there are
good reasons to think the real M2 or other monetary aggregates are unlikely to perform as
reliable leading indicators again in the future.
At the same time, the financial crisis has highlighted the importance of the credit cycle and of
the related indicators, which were previously incorporated via real M2. So, on top of the yield
spread and stock prices, a case can be made for credit related financial indicators.
4. Existing financial conditions indexes
Given the lack of detailed knowledge and the apparent changing nature of the relationship
between credit markets and the real economy – due to innovation, the importance of the
shadow banking system or difficulty to monitor over-the-counter (OTC) derivatives – one can
be tempted to favour broad financial conditions indicators which incorporate as many
indicators as possible to avoid missing signal provided by different market segments. This is
the approach taken by Hatzius et. al. (2010)41
and Brave and Butters (2010).42
However, the
40
i.e. M0 and M1 as well as the difference between these aggregates.
41 Jan Hatzius, Peter Hooper, Frederic Mishkin, Kermit L. Schoenholtz and Mark W. Watson (April 2010)
“Financial Conditions Indexes: A Fresh Look after the Financial Crisis”
42 Scott Brave, R. Andrew Butters (2010) ”Gathering Insights on the Forest from the Trees: A New Metric for
Financial Conditions ”

apparent lack of a stable relationship between the credit cycle and the business cycle and the
reliance of such indexes on econometric estimation given the available data suggests that such
indexes could add noise to the LEI, especially in a real time setting.
There are numerous indicators intended to track financial conditions in the United States.
They can be pooled into two main categories. The first category focuses on financial
instability. As implied by their name, their purpose is to provide early signals of financial
crisis. Financial crises are often related to recessions, either as causes or as consequences, but
they don’t appear to have a consistent relationship with business cycles defined as expansions
and contractions in the level of real economic activity. As a consequence, these indicators are
generally unfit as components of a composite business cycle index such as the LEI for United
States.43
The second category of financial indicators is made of financial condition indexes. These
indexes build on the tradition of monetary conditions indexes that were developed in the early
1990s to gauge the stance of monetary policy in some countries (e.g. Bank of Canada
(BoC)).44
LEIs are indicators of the business cycle, but financial condition indexes are more
closely related to the growth cycle concept.45
Financial conditions indexes have evolved since
their inception, but they remain related to growth cycle defined as fluctuations in the
deviations from the long run growth of the economy– instead of business cycles– and are also
often related to monetary policy assessment and forecasting. In addition, a majority of them
are constrained by the short history of their components.
5. The Proposed Leading Credit Index
Given the need to complement the yield spread and stock prices with non-price and credit
related indicators, and given the lack of a satisfying index that targets the level of general
43
Note that professional investors use risk-appetite indicators which are close to financial instability indexes
but which purpose it to be used as market timing indicators.
44 These indicators – which included foreign exchange related indicators – seemed better for monetary policy
purpose than the Taylor-Rule for export oriented economies like Canada.
45 Business cycles are defined as expansions and contractions in the level of real economic activity while growth
cycle while growth cycles are defined as deviation from the trend level of activity, a concept that is used in the
conduct of monetary policy as explained above.

economic activity (rather than its growth rate or deviations from trend), we develop a Leading
Credit Index (LCI) and argue that this index can be a useful component of the LEI for United
States. The purpose is to construct a composite index whose specific aim is to provide early
signals of turning points of the business cycle. Because of the unique features of the financial
indicators and data availability, we take an approach that is closely related to developing
earlier versions of the LEI, but also take advantage of other methods in our selection and
evaluation of the components as well as the index construction.
The first step is to select a “small” number of financial indicators that fulfils TCB’s
requirements for LEIs’ components and that include non-price and/or credit related data.
While there is a growing literature in using large datasets to extract common factors in an
economy and use these in forecasting, we follow the more traditional approach of carefully
selecting a subset of components. There are a number of papers on the advantages of large vs.
small data sets and the latter come out favourably (see Inklaar et. al.).
We use several methods to determine which financial indicators are the best leading
indicators of turning points in economic activity. As components of the LCI we select those
financial indicators that receive the highest rankings. We also compared the financial
indicators that we considered with the existing components of the LEI. We used three
approaches to evaluate the indicators. The first is the turning point analysis that was
traditionally done when the set of leading indicators were first selected. The second is based
on a regime switching model where the variables are modeled using a Markov switching
model. Lastly, the third approach was based on generating recession probabilities using a
probit model.
We complement the traditional approach of turning point analysis with the two latter because
there are only three business cycle peaks and troughs in the sample since 1990. And, many
indicators considered do not have turning points that can be matched to business cycle turning
points but they nevertheless contain useful information on the state of the business cycle and
whether the economy is in expansion or contraction. In addition, we don’t want to use
traditional model fitting exercises (i.e. econometric) so we specifically focus on matching
turning points in short sample using the other methods.
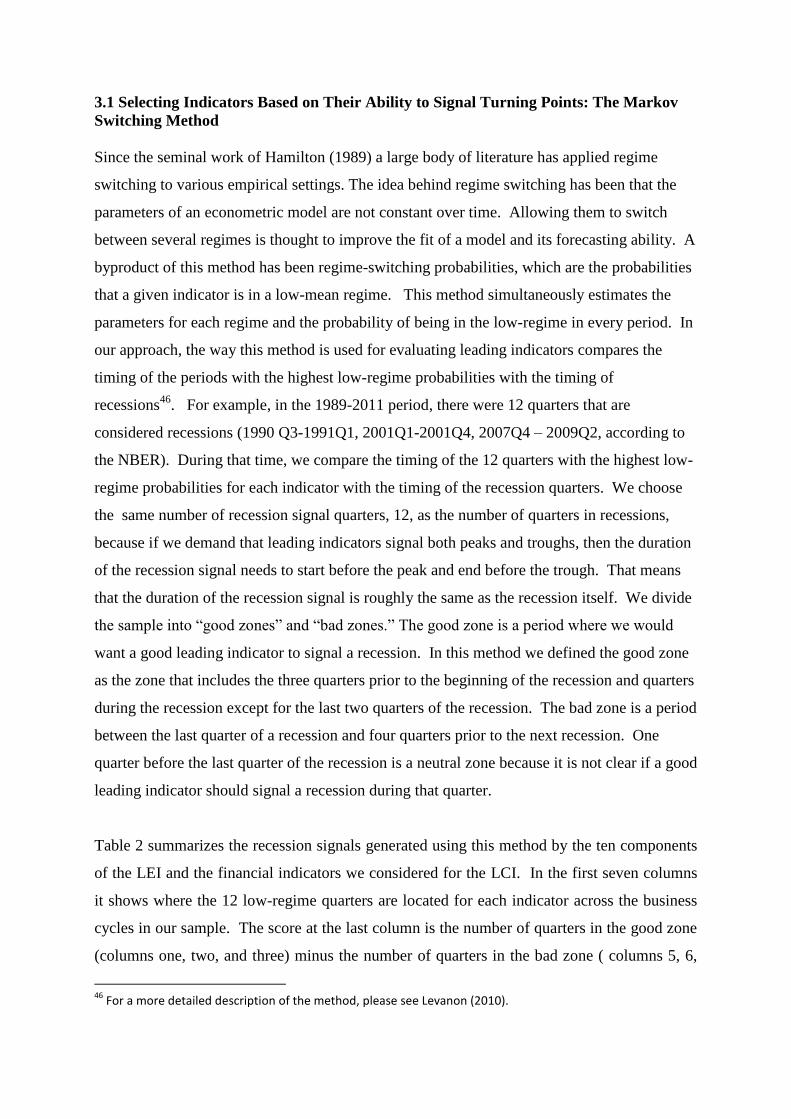
3.1 Selecting Indicators Based on Their Ability to Signal Turning Points: The Markov
Switching Method
Since the seminal work of Hamilton (1989) a large body of literature has applied regime
switching to various empirical settings. The idea behind regime switching has been that the
parameters of an econometric model are not constant over time. Allowing them to switch
between several regimes is thought to improve the fit of a model and its forecasting ability. A
byproduct of this method has been regime-switching probabilities, which are the probabilities
that a given indicator is in a low-mean regime. This method simultaneously estimates the
parameters for each regime and the probability of being in the low-regime in every period. In
our approach, the way this method is used for evaluating leading indicators compares the
timing of the periods with the highest low-regime probabilities with the timing of
recessions46
. For example, in the 1989-2011 period, there were 12 quarters that are
considered recessions (1990 Q3-1991Q1, 2001Q1-2001Q4, 2007Q4 – 2009Q2, according to
the NBER). During that time, we compare the timing of the 12 quarters with the highest low-
regime probabilities for each indicator with the timing of the recession quarters. We choose
the same number of recession signal quarters, 12, as the number of quarters in recessions,
because if we demand that leading indicators signal both peaks and troughs, then the duration
of the recession signal needs to start before the peak and end before the trough. That means
that the duration of the recession signal is roughly the same as the recession itself. We divide
the sample into “good zones” and “bad zones.” The good zone is a period where we would
want a good leading indicator to signal a recession. In this method we defined the good zone
as the zone that includes the three quarters prior to the beginning of the recession and quarters
during the recession except for the last two quarters of the recession. The bad zone is a period
between the last quarter of a recession and four quarters prior to the next recession. One
quarter before the last quarter of the recession is a neutral zone because it is not clear if a good
leading indicator should signal a recession during that quarter.
Table 2 summarizes the recession signals generated using this method by the ten components
of the LEI and the financial indicators we considered for the LCI. In the first seven columns
it shows where the 12 low-regime quarters are located for each indicator across the business
cycles in our sample. The score at the last column is the number of quarters in the good zone
(columns one, two, and three) minus the number of quarters in the bad zone ( columns 5, 6,
46
For a more detailed description of the method, please see Levanon (2010).

and 7). The indicators are ranked according to the score in the last column, from highest to
lowest. A higher score indicates that the indicator gives good recession signals with
appropriate timing before recessions.
This table also provides additional evidence for omitting the money supply component of the
LEI. Out of the 12 recession signals of this indicator, only two occurred in the good zone.
Some of the indicators we considered for the LCI were ranked the highest in Table 2. The top
two were the two-year swap spread and the senior loan officer survey. The LIBOR spread
and the bull-bear sentiment index were also ranked better than the existing components of the
LEI.
Table 2 – Markov Switching Model Results
Except where indicated, the series are all used in first differences rather than levels. Note: The variables are ranked according to the score they received in column 1. The score is
calculated by adding the number of signals that occur before or during recessions and subtracting the
number of signals that occur during expansions. That is, cols. 2+3+4-6-7-8. A signal occurs if the
Markov switching model indicates a switch in the regime. For a more detailed description of the
method, please see Levanon (2010).
Ranking Financial Indicators Based on Their Ability to Signal Recession Using a Markov Switching Model, 1989Q3 - 2011Q1
Recession Signal observed:
P-3 P (Peak)
Other
recession
quarters
T(Trough) T+3 Expansions
(1) (2) (3) (4) (5) (6) (7) (8)
VARIABLEScore
3 before
first first
other
recession last
3 after
last other
1 2-years Swap Spread 7 4 2 3 0 0 2
2Senior Loan Officers C&I loan survey – Bank
tightening Credit to Large and Medium Firms 5 3 1 3 1 1 0
3Average Weekly Initial Claims Unemployment
Insurance (SA, Thous) 3 2 1 3 2 0 1
4LIBOR 3 month less 3 month Treasury-Bill yield
spread 2 2 1 3 1 0 3
5Building Permits: New Private Housing Units (SAAR,
Thous) 2 3 1 2 1 0 3
6Interest Rate Spread: 10-Year Treasury Bonds Less
Federal Funds (%) 2 7 0 0 0 0 5
7 WILSHIRE 5000 Index 1 1 2 2 1 1 2
8AAII Investors Sentiment Bullish (%) les Bearish
(%) 0 1 2 2 1 1 3
9 Average Weekly Hours: Manufacturing (SA, Hours) 0 2 1 2 1 0 4
10Manufacturers New Orders: Consumer Goods &
Materials (SA, Mil. 1982$) 0 1 1 3 2 0 3
11Manufacturers New Orders: Nondefense Capital
Goods (SA, Mil. 1982$) 0 2 1 2 2 2 1
12 S&P 500 Composite Price Index (1941-43=10) 0 1 2 1 2 2 3
13Debit balances at margin account at broker
dealer -1 2 1 1 2 2 1
14 Total Finance: Liabilities – Security Repurchase-1 1 1 3 1 0 5
15Consumer Confidence 12M Exp: Stock Prices will
Decline (TCB) -2 0 1 3 2 1 3
16 Michigan Consumer Expectations (Q1-66=100) -2 0 1 3 0 1 5
17 RUSSSEL 2000 Index -3 1 2 1 0 1 6
18 High Yield Spread -4 1 1 1 3 2 2
19 Money Supply: M2 (SA, Bil.Chn.2005$) -6 0 1 1 1 1 6
20 MOODY'S Baa - Treasury Spread -7 0 0 2 2 4 3
21 VIX Volatility Index -8 0 0 1 2 2 5
22NAPM Vendor Performance Deliveries Diffusion Index
(SA, 50+=Slower Deliveries) -9 0 0 1 1 0 9

On the other hand, some well-known financial indicators we considered ranked very low,
especially the corporate spreads and the VIX. These indicators ranked low mostly because
they were lagging rather than leading indicators. The corporate spreads in particular are
highly correlated with default rates, which tend to lag the business cycle. Among the
indicators we considered we chose the highest ranked five or six for the construction of the
LCI.47
The results from the regime switching analysis are largely confirmed by the probit model
analysis. In this method we define a binary variable with the value of one during quarters
when there was a recession. We used lags of the indicators to forecast the binary variable one
or two quarters ahead using a probit model. We then calculate the quadratic probability
scores and use that as a measure for evaluating the leading indicators. In most cases, the
results in Table 3 confirm the regime switching analysis.
47
Note this analysis shows that there are other components of the LEI that rank poorly such as the ISM supplier
delivery index and the consumer expectations component. In this paper, our focus is on the financial indicators
and real money supply only.

Table 3 – Quadratic Probability Scores
Earliest lead 1qrt & latest lead 2qrtsQPS 1989/Q3
to 2011/Q2
Financial Index Components
Senior Loan Officers C&I loan survey –
Bank tightening Credit to Large and
Medium Firms 0.1145
Average Weekly Initial Claims
Unemployment Insurance (SA, Thous) 0.1445
2-years Swap Spread 0.1509Debit balances at margin account at
broker dealer 0.1529
Building Permits: New Private Housing
Units (SAAR, Thous) 0.1550Total Finance: Liabilities – Security
Repurchase 0.1557Consumer Confidence 12M Exp: Stock
Prices will Decline (TCB) 0.1571
WILSHIRE 5000 Index 0.1602
S&P 500 Composite Price Index (1941-
43=10) 0.1686
Manufacturers New Orders: Consumer
Goods & Materials (SA, Mil. 1982$) 0.1723LIBOR 3 month less 3 month Treasury-
Bill yield spread 0.1739
High Yield Spread 0.1824
MOODY'S Baa - Treasury Spread 0.1973
RUSSSEL 2000 Index 0.2013AAII Investors Sentiment Bullish (%) les
Bearish (%) 0.2059
Manufacturers New Orders: Nondefense
Capital Goods (SA, Mil. 1982$) 0.2078
Interest Rate Spread: 10-Year Treasury
Bonds Less Federal Funds (%) 0.2174
Average Weekly Hours: Manufacturing
(SA, Hours) 0.2208
VIX Volatility Index 0.2245
Money Supply: M2 (SA, Bil.Chn.2005$) 0.2410
NAPM Vendor Performance Deliveries
Diffusion Index (SA, 50+=Slower
Deliveries) 0.2654

The indicators that have been selected with this strategy are (ranked according to their
frequency – frequency and sources are shown in Table 4):
2-years Swap Spread (real time)
LIBOR 3 month less 3 month Treasury-Bill yield spread (real time)
Debit balances at margin account at broker dealer (monthly)
AAII Investors Sentiment Bullish (%) less Bearish (%) (weekly48
)
Senior Loan Officers C&I loan survey – Bank tightening Credit to Large and Medium
Firms (quarterly)
Total Finance: Liabilities – Security Repurchase (quarterly)
This selection of indicators is compatible with the model of financial intermediation described
by Adrian and Shin (2010) and the historical evidence presented by Schularick and Taylor
(2009). Our selected components are also found in broader financial conditions indexes like
the one developed by Hatzius et. al. (2010). The two first are credit related price indicators.
The 2-year Swap Spread is a standard measure of the creditworthiness of banks and by
extension of corporate credit spread.49
The LIBOR 3 month50
less 3 month Treasury-Bill yield
spread is a liquidity indicator of the funding conditions of banks51
but also of other financial
firms as the quest for quality collateral – i.e. Treasury-Bill – for liquidity purpose can signals
stress in the system.
48
Weekly data are averaged to give monthly observations.
49 An interest rate swap is a derivative in which one party exchanges a stream of interest payments for another
party's stream of cash flows. Interest rate swaps are used by hedgers and speculator to manage fixed or floating assets and liabilities. The swap spread is determined by the same factors that influence the spread over Treasuries of financial instruments with same characteristics. Swaps spread with maturities of less than five year depends on the cost of hedging in the Eurodollar CD futures market. For longer maturities, swap spreads depends on the credit spreads in the corporate bon market.
50 The LIBOR is the London Interbank Offered Rates (see www.bbalibor.com for more details). is the primary
benchmark for short term interest rates globally. It is used as the basis for settlement of interest rate contracts on many of the world's major futures and options exchanges and is often used as a barometer to measure the health of financial monetary markets.
51 It also used as an indicator of risk aversion in financial markets.

The four remaining indicators correspond to our non-price constraints. Debit balances at
margin accounts52
at broker dealer is an indicator of the willingness and the ability of
speculators to leverage their bets on financial markets. As such, it depends on the balance-
sheets of speculators and broker dealer alike and is mainly driven by the level of interest rates
and risk appetite with a clear pro-cyclical nature. The AAII53
Investors Sentiment Bullish (%)
less Bearish (%) is an indicator of the risk appetite of retail investors. It is often considered as
a contrarian indicator of the stock market – i.e. extreme optimism tends to lead markets’
declines while extreme pessimism tends to lead markets’ rebound.
The Senior Loan Officers C&I loan survey – Bank tightening Credit to Large and Medium
Firms (quarterly) is a traditional non-price indicator of credit availability and by extension of
non-price credit rationing – i.e. credit crunch.54
Once again, that is an indicator that is closely
related to balance-sheets, in the case of non-financial firms and (mainly commercial) banks.
The Total Finance: Liabilities – Security Repurchase (repos) is particularly relevant in a
market-based credit system as repos is the main source of funding for many financial firms
and in particular broker dealers that are so central to the functioning of the system. As such, it
also provides an indication on what is taking place in the shadow-banking system.
The second step is the aggregation of these indicators. Using the normalized values of the
indicators, we used principal component analysis to create the index.55
The two quarterly
series were interpolated to the monthly frequency, using the Chow-Lin interpolation method
using as an instrumental variable the National Financial Conditions Index (NFCI) published
52
In a margin account, the broker lends the customer cash to purchase securities. The loan in the account is
collateralized by the securities and cash. If the value of the stock drops sufficiently, the account holder will be
required to deposit more cash or sell a portion of the stock.
53 The American Association of Individual Investors. See www.aaii.com/sentimentsurvey for more details on the
indicator.
54 Asymmetric information and its consequences in terms of adverse selection and moral hazard explain why
banks do not use the interest rate charged to borrowers to clear the credit market. The use of collateral and
other credit enhancement techniques mitigate these problem but only partially Moreover, all borrowers are
not equal with respect to the access to other sources of funding.
55 Principal component analysis (see, Stock and Watson, 2002) helps to identify the common business cycle
component of the selected variables. The variance structure of the set of selected index components is
modeled using linear combinations of the variables. The coefficients or loadings serve as weights that combine
the selected variables. The principal component was calculated in Eviews.

by the Federal Reserve Bank of Chicago.56
Chart 4 shows the Leading Credit Index, with Top
5 referring to the index created from highest ranked five components and Top 6 referring to
the index created from the Top 6 indicators in Table 6. The LCI is the first principal
component of the selected indicators and its fluctuations match the major business cycle
fluctuations in the available sample since 1990. The cumulated form of the LCI can be
compared directly with the levels of LEI and CEI. The cumulation procedure is also useful in
the interpretation of the LCI as a business cycle indicator.
Chart 4 – Leading Credit Index
56
See Chow and Lin (1971). NFCI is a coincident index of financial conditions published weekly by the Federal
Reserve Bank of Chicago. We rely on the high correlation of this composite indicator with our selected
variables and utilize it in the time disaggregation of the quarterly variables.

Table 4, Selected Financial Indicators
TCB Financial Index Components
Indicator Frequency Source
1) Two-year Swap Spreads monthly Datastream
2) Libor 3 month Less Treasury 3-month yield monthly ECB, Federal Reserve, Datastream
3) Debit balances at margin accounts at broker dealers monthly New York Stock Exchange, Haver
4) Senior Loan Officer C&I Loan Survey - quarterly Federal Reserve
Banks Tightening Credit to Large & Medium Firms
5) AAII Investor Sentiment: Bullish (%) Less Bearish (%) monthly American Association of Individual Investors, Haver
6) Total Finance: Liabilities - Security Repurchases quarterly Federal Reserve, Bureau of Economic Analysis
The AAII Investor Sentiment Survey measures the percentage of individual investors who are bullish, bearish, and neutral on the stock market for
the next six months; individuals are polled from the ranks of the AAII membership on a weekly basis. Only one vote per member is accepted in
each weekly voting period.
Debit balances at margin accounts at broker dealers. Series refers to aggregate debits in securities margin accounts, as well as aggregate free
credits in cash and margin accounts. Margin accounts cover stock, convertible bond, special subscription, and corporate and government bond
accounts. This is reported by NYSE member organizations (and can be found in Federal Reserve Bulletin" Table 1.36). Deflated by PCE.
Security repurchases outstanding in financial companies. Deflated by PCE. From Flow of Funds Liabilities. (Table L.5 Total Liabilities and Its
Relation to Total Financial Assets, item 11 – Security RPs.)
Chart 5 LEI and new LEI (replacing M2 with LCI)
120
110
100
90
80
70
60
50
40
30
201960 1965 1970 1975 1980 1985 1990 1995 2000 2005 2010
The Conference Board Leading Economic Index® for the U.S.
Alternative LEI with LCI
Index, 2004=100
Chart 5 shows the current LEI and the alternative LEI which replaces the M2 component with
our new Leading Credit Index (LCI). The history of the two indexes are very similar until
1990, as expected, because the new LCI only enters the LEI after May 1990 (given data
availability for the selected financial indicators). The new LEI shows a more rapid expansion
during the 1990s and a much deeper contraction ahead of and during the 2008-2009 recession.

Following the end of the latest recession, the new LEI shows a rapid recovery, as does the old
LEI, but the former has not recovered its previous peak (this is similar to the post recession
behavior of the CEI, not shown). Table 5 below shows the turning points of the alternative
indexes with and without the M2 component, and with two versions of the LCI replacing the
M2 component. The historical turning points and the average leads at peaks and troughs
remain roughly the same. The lead ahead of the most recent business cycle peak in December
2007 increases to over 20 months compared with the 5 months lead in the current LEI. While
an ex-post lead of 20 months is somewhat too long to be very useful in real time, the cyclical
movements in the alternative LEI are not entirely inconsistent with the similar cyclical
movements in the current LEI which also showed an essentially flat period in the index during
2006-2007 with a double peak configuration.57
Table 5, Cyclical Timing of LEI, LEIexM2, and LEI with LCI
Business Cycle Peaks
NLEI_PC5 NLEI_PC6 LEI_EXM2 USLEAD
Apr-60 -3 * -3 * -4 * -10
Dec-69 -8 -8 -8 -8
Nov-73 -9 -9 -9 -9
Jan-80 -15 -15 -15 -15
Jul-81 -8 * -8 * -8 -8
Jul-90 -6 -4 -18 -18
Mar-01 -11 -11 -14 -11
Dec-07 -21 -21 -23 -5
Mean -10.1 -9.9 -12.4 -10.5
Median -8.5 -8.5 -11.5 -9.5
St. Deviation 5.6 5.9 6.3 4.2
Business Cycle Troughs
NLEI_PC5 NLEI_PC6 LEI_EXM USLEAD
Feb-61 -11 * -11 * -3 * -3
Nov-70 -7 -7 -7 -7
Mar-75 -2 -2 -2 -2
Jul-80 -2 -2 -2 -2
Nov-82 -10 * -10 * -10 -10
Mar-91 0 0 -2 -2
Nov-01 -1 -1 -2 -2
Jun-09 -3 -3 -3 -3
Mean -4.5 -4.5 -3.9 -3.9
Median -2.5 -2.5 -2.5 -2.5
St. Deviation 4.2 4.2 3.0 3.0
*manually selected
57
See footnote 47 on other components of the LEI. This exercise only discusses the marginal effect of omitting
M2 and replacing it with LCI.

In Table 6 and 7, we compare LCI with other financial indicators described above.
We find that in the 1990-2009 period, the two alternatives we considered were ranked higher
than any other financial indicator or index.

Table 6 – Quadratic Probability Scores
Earliest lead 1qrt & latest lead 2qrtsQPS 1990/Q3
to 2009/Q4Earliest lead 2qrts & latest lead 3qrts
QPS 1990/Q3
to 2009/Q4
Financial Indexes Comparison Financial Indexes Comparison
LCI TCB TOP6 0.0678 2-years Swap Spread 0.1501
LCI TCB TOP5 0.0781 LCI TCB TOP6 0.1624Senior Loan Officers C&I loan survey –
Bank tightening Credit to Large and
Medium Firms 0.1298 LCI TCB TOP5 0.1724
Total Finance: Liabilities – Security
Repurchase0.1326
Interest Rate Spread: 10-Year Treasury
Bonds Less Federal Funds (%) 0.1812
FCI Deutsche Bank 0.1463 FCI Deutsche Bank 0.2064
FCI Chicago FED 0.1484
Senior Loan Officers C&I loan survey –
Bank tightening Credit to Large and
Medium Firms 0.2065
2-years Swap Spread 0.1509 FCI Chicago FED 0.2065
Debit balances at margin account at
broker dealer 0.1543
LIBOR 3 month less 3 month Treasury-
Bill yield spread 0.2137
Average Weekly Initial Claims
Unemployment Insurance (SA,
Thous) 0.1573 FCI purged (Hatzius et. al.) 0.2163
FCI Kansas City FED 0.1681
Debit balances at margin account at
broker dealer 0.2231
Building Permits: New Private
Housing Units (SAAR, Thous) 0.1690
Total Finance: Liabilities – Security
Repurchase 0.2232
LIBOR 3 month less 3 month Treasury-
Bill yield spread 0.1796
Average Weekly Initial Claims
Unemployment Insurance (SA, Thous) 0.2269
S&P 500 Composite Price Index (1941-
43=10) 0.1832
Building Permits: New Private Housing
Units (SAAR, Thous) 0.2294
Manufacturers New Orders:
Consumer Goods & Materials (SA,
Mil. 1982$) 0.1891 FCI CITI 0.2362
FCI CITI 0.1918 FCI Kansas City FED 0.2367
FCI purged (Hatzius et. al.) 0.2045
S&P 500 Composite Price Index (1941-
43=10) 0.2458
Michigan Consumer Expectations
(Q1-66=100) 0.2104
Michigan Consumer Expectations (Q1-
66=100) 0.2519
AAII Investors Sentiment Bullish (%)
les Bearish (%)0.2200
Manufacturers New Orders: Consumer
Goods & Materials (SA, Mil. 1982$) 0.2539
Interest Rate Spread: 10-Year
Treasury Bonds Less Federal Funds
(%) 0.2226
AAII Investors Sentiment Bullish (%)
les Bearish (%)0.2670
Manufacturers New Orders:
Nondefense Capital Goods (SA, Mil.
1982$) 0.2296
Average Weekly Hours: Manufacturing
(SA, Hours) 0.2674
Average Weekly Hours:
Manufacturing (SA, Hours) 0.2425 FCI Chicago FED (purged) 0.2733
Money Supply: M2 (SA,
Bil.Chn.2005$) 0.2669
Manufacturers New Orders:
Nondefense Capital Goods (SA, Mil.
1982$) 0.2748
FCI Chicago FED (purged) 0.2703 Money Supply: M2 (SA, Bil.Chn.2005$) 0.2849
NAPM Vendor Performance
Deliveries Diffusion Index (SA,
50+=Slower Deliveries) 0.2911
NAPM Vendor Performance Deliveries
Diffusion Index (SA, 50+=Slower
Deliveries) 0.2888

Table 7, Selected Financial Indexes and Their Relative Ranking based on QPS
6. Real time forecasting performance of the proposed index
6.1 Forecasting the growth of the Coincident Economic Index (CEI) with the LEI
in Real Time
Given the selection of the components of the new LCI, we now turn to an evaluation of the
forecasting performance of the new leading index which incorporates the LCI. We construct a
forecasting test in the spirit of Granger causality tests by using a simple time series model
which uses lags and the current (or old) LEI to forecast growth in the CEI. We then ask
whether replacing the old LEI with the new alternative in this model reduces out of sample
forecast errors. Our approach follows Diebold and Rudebusch (1999), McGuckin et. al.
(2007), and McGuckin and Ozyildirim (2004) among others. Our hypothesis is that in real-
time (unrevised) out of sample forecasts of the final (historical) data for the CEI can be
improved when the new LEI composition is used compared to the old LEI composition
(which includes real M2).
Since both LEI and CEI are nonstationary we first transform the variables into growth rates.58
All of our forecast models use data in one-, three-, or six-month logarithmic differences for
58
For the US LEI, Camacho and Perez-Quiros (2002, pp. 62-63) note that the augmented Dickey-Fuller test
cannot reject the null hypothesis of a unit root in the levels of the LEI series but is consistent with stationarity
of log differences of LEI. We have also used detrended the data before estimating the models. The results
parallel those in growth rates. Detrending the composite indexes requires that an appropriate long term trend
be estimated. In this we follow the guidance of Zarnowitz and Ozyildirim (2006) who compared different trend
estimation methods used in the recent literature, such as Hodrick-Presscot and band pass filters, with the
Phase Average Trend (PAT) method used by the traditional NBER approach (see Boschan and Ebanks, 1978).
Indexes Comparison
QPS 1-2 Qtrs
TCB LCI Top 6 0.0678 TCB LCI Top 5 0.0781
FCI Deutsche 0.1463
FCI Chicago Fed 0.1484
FCI KC Fed 0.1681
FCI Citi 0.1918
FCI_prgd_Watson 0.2045 FCI Chicago Fed Adj. 0.2703

CEI and LEI. In our forecasting exercises, we look at one-month ahead, three-month ahead
and six-month ahead forecast horizons. The LEI is commonly referred to as a short term
forecasting tool effective over such short horizons. A useful leading index should be capable
of anticipating changes in CEI over these near-term intervals.
Our benchmark models are simple autoregressions with one lag of the CEI augmented with
lags of the LEI. The alternative models use lags of real-time LEI, in addition to the lags of
the CEI. In order to mimic real time forecasting conditions as closely as possible we
generated 187 vintages (from January 1996 to July 2011) of the LCI and the LEI.59
Each of
the vintages in our dataset provides inputs for out of sample forecasts of CEI in real time. We
use an initial in-sample period starting in May 1990 (when the LCI begins and enters the LEI)
and ending in December 1995, so the first forecast for the one month horizon is made for
January 1996, and the first forecast for the six month horizon is made for June 1996.
The models are specified as:
t
k
i
itit oldLEIcCEI ,1
1
,1
where CEIt denotes 1,3 or 6 month changes in natural logs of CEI. Rather than optimally
choosing the number of lags, we estimate the models with k=6. In the benchmark model, LEI
refers to the current LEI. The results could be improved if the lag lengths were selected
optimally and regressions were specified more parsimoniously. In the alternative models, we
replace old LEI with lags of new LEI so that
t
k
i
itit newLEIcCEI ,2
1
,2
These benchmark and alternative models are used to generate forecasts for three different
forecast horizons: one-month ahead, three-month ahead and six-month ahead.
They argue that if the smoothing parameters are chosen appropriately more sophisticated methods compare
well with the PAT method for business cycle analysis. Specifically, they found that the Hodrick-Presscot trend
estimated with a lambda parameter of 108,000 is almost identical with the PAT. Similarly, Ravn-Uhlig (2001)
argue for a smoother trend, especially for higher frequency data. And this approach has already been
incorporated into major statistics packages (i.e. Eviews 7.0). Thus, because of its appropriate trend estimation
and computational ease, we have decided to use Ravn and Uhlig’s modification of the Hodrick-Prescott trend.
59 See the appendix for notes on the calculation of the real time indexes with unrevised data.

For each vintage in our sample we estimate the benchmark and alternative models and
forecast changes in the CEI one, three and six-months ahead. Subtracting these forecasts from
the corresponding actual (revised) values of CEI60
gives us sequences of out-of-sample
forecast errors for each model and horizon. We summarize these sequences for all models by
an estimate of the mean square error (MSE).61
6.2 Empirical Findings
Table 8 summarizes our findings from a range of forecast models. The numbers shown in the
table refer to the ratio of MSE’s from the benchmark model to the MSE’s from the alternative
model (i.e. negative numbers show that the alternative model reduces the out of sample
forecast errors as measured by MSE of the corresponding model). Thus, an improvement in
the forecast indicated by a reduction in forecast errors is denoted by a negative number (in
bold) in the table. The forecast horizons and the number of lags of LEI used in each
regression are given in columns 1 and 2. Columns 3-5 refer to the different growth rates used
(i.e., in logs 1, 3, 6 month changes). For the dlog transformation we only forecast one month
ahead. For three month ahead forecasts both 1 month and 3 month log changes are used, and
so on.
In Table 8, we have split the out of sample forecast error evaluation period in two sub-
samples. The first sub sample is 1996-2007 and it covers the second half of the 1990s
expansion in the business cycle, the 2001 recession and the subsequent expansion. In this sub
sample we exclude the 2008-2009 recession to isolate the models’ performance during what
are arguably more typical business cycle phases. In the second sub sample, 1996-2011, we
cover the Great Recession of 2008-2009 to see how including this deep and long contraction
affects the forecasting performance. In the first part of the out of sample period, one month
ahead forecasts with the new LEI do not show a large improvement over the existing LEI.
However, in longer horizon forecasts the improvement ranges from 1 to 7 percent. Once the
2008-2009 recession is included, however, there is an even greater improvement in the out of
60
The revised CEI is based on data from July 2011.
61 Mean squared error is defined as
21
nt tMSE e n , where n is the number of out of sample forecasts and
et refers to the out of sample forecast errors.

sample forecasting performance of the new LEI. These improvements range from 7 to 23
percent. All model specifications across horizons and number lags of LEI consistently show
improvements.
Table 8, Real Time Out of Sample Forecast Performance of the old LEI and new LEI with LCI
Forecast improvement of model with alternative new LEI compared with old LEI, (MSE(new)/MSE(old))-1)
In-sample 1990-95, Out of Sample 1996-07 (1) (2) (3) (4) (5)
Horizon Lags dlog dl3 dl6
1 0.01
1 3 -0.01
6 0.01
1 0.00 -0.03
3 3 -0.01 -0.02
6 -0.02 -0.02
1 -0.03 -0.07 -0.07
6 3 -0.03 -0.07 -0.06
6 -0.04 -0.05 -0.05
In-sample 1990-95, Out of Sample 1996-11 Horizon Lags dlog dl3 dl6
1 -0.08
1 3 -0.14
6 -0.12
1 -0.09 -0.23
3 3 -0.13 -0.21
6 -0.12 -0.20
1 -0.10 -0.18 -0.21
6 3 -0.10 -0.16 -0.19
6 -0.07 -0.13 -0.19
7. Concluding Comments
In this paper we review financial, monetary, credit market indicators from the perspective of
their relationship with the general business cycle of the U.S. economy. We document which
of these financial indicators are useful in predicting recessions and recoveries (i.e. business
cycle turning points) and argue that aggregating our selected indicators in a composite index
offers advantages over relying on them individually. Given the nature of most of our selected

indicators, we call this composite index the Leading Credit Index (LCI). The advantages of
the LCI come from the ability of the simple, easy to calculate and transparent methodology of
the composite index approach to generate reliable and smooth estimates of an unobserved
business cycle variable.
Our proposed index is the principal component of six selected indicators and, thus, it
aggregates different types of quantitative and qualitative survey indicators which are all
related to the availability and cost of credit and economic agents’ willingness to borrow or
lend. We argue that this new index can reasonably capture important channels through which
the financial sector can impact the real economy. We also show that the suitability as a
leading indicator of one of the financial components of the current LEI, namely the real
money supply as measured by M2, has declined in recent decades as a result of changes
occurring in the U.S. economy. We argue that our leading credit index is an appropriate
replacement for the money supply component of the LEI. We show that forecasting
performance of the leading index can be improved upon if our new index of financial
conditions is used as a component of the LEI replacing the money supply measure currently
used as a component. The contribution of the new LCI to forecasting during the great
recession is noteworthy. It is important to note also that the forecasting tests are constructed
with the real time performance of the LEI in mind and that they were not used in the indicator
selection process.
Considering our overall findings on the new leading index of financial indicators proposed in
this paper, we believe the LEI can provide real forecasting improvements, both in forecasting
growth and in turning points. The real time out of sample forecasting performance of a new
LEI which replaces the real M2 component with this new index support this conclusion. The
changes in the behavior and usefulness of real money supply (i.e. ceasing to be a useful
leading indicator) to monitor and predict the economic cycle and the emergence of new more
useful financial indicators result from the structural changes in the U.S. economy and
financial markets over the last 2 or 3 decades. The changes to the LEI we propose help to
address some of these structural changes.

References
Adrian, Tobias and Hyun Song Shin, “The Changing Nature of the Financial Intermediation
and the Financial Crisis of 2007-09”, Federal Reserve Bank of New York Staff Reports, Staff
Reports no. 439, March 2010.
Antony, Jürgen and Peter Broer, “Linkage between the Financial and the Real Sector of the
Economy, A Literature Survey”, CPB Documents, No 216, December 2010.
Bernanke, Ben and Mark Gertler, “Agency Costs, Net Worth, and Business Fluctuations”,
American Economic Review, volume 79(1), page 14-31, March 1989
Bernanke, Ben, Mark Gertler, Simon Gilchrist, “The Financial Accelerator in Quantitative
Business Cycle Framework” in John B. Taylor and Michael Woodford, Editors, “Handbook
of Macroeconomics”, Elsevier, volume 1, part 3, pages 1341 – 1393, 1999.
Boivin, Jean, Michael T. Kiley, Frederic Mishkin, “How has Monetary Transmission
Mechanism evolved over Time?” NBER Working Paper Series, Working Paper 15879, April
2010
Bordo, Michael D. and Andrew Filardo, “Money Still makes the World Go Round: the Zonal
View”, paper prepared for the 21st Congress of the European Economic Association held in
Vienna in August 2006.
Bordo, Michael D. and Joseph G. Haubrich, “Credit Crisis, Money and Contractions: an
Historical View”, NBER Working Paper Series, Working Paper 15389, September 2009.
Boschan C, WW Ebanks. 1978. The Phase-Average Trend: A New Way of Measuring
Growth, in 1978. Proceedings of the Business and Economic Statistics Section, American
Statistical Association, Washington, D.C.
Brave, Scott, R. and Andrew Butters (2010)”Gathering Insights on the Forest from the Trees:
A New Metric for Financial Conditions” Federal Reserve Bank of Chicago, WP 2010-07.
Bry, Gerhard, and Boschan, Charlotte 1971. ‘‘Cyclical Analysis of Economic Time Series:
Selected Procedures and Computer Programs,’’ NBER Technical Working Paper. No. 20.
Camacho M, Perez-Quiros G. 2002. This is What the Leading Indicators Lead. Journal of
Applied Econometrics 17: 61-80.
Diebold FX, Rudebusch GD. 1991. Forecasting Output with the Composite Leading Index:
An Ex Ante Analysis. Journal of the American Statistical Association 86: 603-610.
Forni M, Hallin M, Lippi M, Reichlin L. 2004. The Generalized Dynamic Factor Model One-
Sided Estimation and Forecasting

Hamilton, James D. 1989. ‘‘A New Approach to the Economic Analysis of Nonstationary
Time Series and the Business Cycle.’’ Econometrica, 57(2): 357–84.
Hatzius, Jan, Peter Hooper, Frederic Mishkin, Kermit L. Schoenholtz and Mark W. Watson
(April 2010) “Financial Conditions Indexes: A Fresh Look after the Financial Crisis”
Hodrick RJ, Prescott EC. 1997. Postwar U.S. Business Cycles: An Empirical Investigation.
Journal of Money Credit and Banking 29(1): 1-16.
Levanon, Gad, Ataman Ozyildirim, and Jennelyn Tanchua, “Real M2 and Its Impact on The
Conference Board Leading Economic Index® (LEI) for the United States,” Business Cycle
Indicators, March 2010.
Levanon, Gad, “Evaluating and Comparing Leading and Coincident Economic Indicators,”
Business Economics, Vol. 45, No. 1, 2010, pp. 16–27.
McGuckin R. H, Ozyildirim A, 2004. Real-Time Tests of the Leading Economic Index: Do
Changes in Index Composition Matter? Journal of Business Cycle Measurement and
Analysis, Vol. 1. No. 2: 171-191.
McGuckin R. H, Ozyildirim A, Zarnowitz V. 2007. A More Timely and Useful Index of
Leading Indicators. Journal of Business and Economic Statistics 25: 110-120.
Ravn M. O., Uhlig H. 2001. On Adjusting the HP-Filter for the Frequency of Observations.
CEPR Discussion Papers 2858, C.E.P.R. Discussion Papers.
Schularick, Moritz and Alan M.Taylor, “Credit Booms go Bust: Monetary Policy, Leverage
Cycles and Financial Crisis, 1870 – 2008”, NBER Working Papers Series, Working Paper
15512, November2009
Stock, J. H., and M. W. Watson, 2002, “Forecasting using principal components from a large
number of predictors,” Journal of the American StatisticalAssociation, Vol. 97, No. 460,
December, pp. 1167–1179.
Tanchua, Jennelyn, “The Conference Board Leading Economic Index® for the United States
in the 2007 Recession,” Business Cycle Indicators, February 2010.
The Conference Board. 2001. Business Cycle Indicators Handbook. New York, NY.
Zarnowitz, Victor and Charlotte Boschan, “Cyclical Indicators: An Evaluation and New
Leading Indexes”, 1977, pp 170-184.
Zarnowitz V, Ozyildirim A. 2006. Time Series Decomposition and Measurement of Business
Cycles, Trends and Growth Cycles. Journal of Monetary Economics 53(7): 1717-1739.

Appendix:
Overview of the LEI
The LEI is a commonly used forecasting tool that helps to predict changes in the direction of
aggregate economic activity and business cycle turning points which are identified in the
reference chronologies determined by the National Bureau of Economic Research (NBER).62
Business cycles vary greatly in their duration and magnitude as well as their causes and
consequences. The contributions of specific factors differ over time. Composite indexes like
the LEI, and the coincident economic index (CEI), rather than individual indicators generally
work better in tracking cyclical movements.63
The multi-causal and multi-factor nature of
economic movements is represented better by the LEI than by each of its components: the
average workweek, initial claims for unemployment insurance, new investment commitments
(orders, contracts, housing permits), real money supply, yield spread, stock prices, and
consumer expectations. The monthly change in the LEI is the sum of the (unweighted)
contributions from each component. As such, the index summarizes the cyclical movements
of its various components.64
The contributions of the individual components vary over time,
depending on the characteristics of each cycle. The leading series themselves vary in timing,
smoothness, currency, etc. The index gains from this diversification.65
The LEI leads the CEI
62
Cyclical activity of the U.S. economy has been measured, monitored, and analyzed using the framework of
monthly Business Cycle Indicators which have been classified and grouped according to their cyclical timing –
that is, leading, coincident, and lagging indicators. The best of these indicators have been selected as
components of composite indexes of business cycle indicators which can be thought of as representing
unobserved cyclical indicators of the overall U.S. economy. The U.S. business cycle indicators and their
composite indexes are currently published by The Conference Board.
63 The NBER Business Cycle Dating Committee relies to a large extent on four principal coincident indicators
(nonfarm establishment employment, real personal income less transfers, real manufacturing and trade sales,
and industrial production (IP)) and real GDP. These are the same four indicators that make up The Conference
Board Coincident Economic Index (CEI). The turning points of the CEI match the business cycle peaks and
troughs. Growth rates of CEI also mirror peaks and troughs in the growth cycle (see Zarnowitz and Ozyildirim,
2001).
64 The component contributions are standardized to have equal volatility so that more volatile components do
not influence the index disproportionately. 65 Technical problems that arise from this diversity are discussed in McGuckin, Ozyildirim and Zarnowitz (2003). In that paper we dealt intensively with procedures to make the LEI timelier, which are now a regular part of The Conference Board’s Program. Here all tests are done on a basis consistent with historical practice, to make the tests consistent with published versions of the LEI.

at all business cycle peaks and troughs since 1959.66
Moreover, this relationship holds in
growth rates as well.
Real time indexes
To create real time LCIs, we first need monthly historical series for its components. Using
linear interpolation fails to incorporate information about intra-quarterly dynamics of the 2
quarterly series. We chose the Chow-Lin method to interpolate the quarterly series into the
monthly frequency. For this we need a monthly series as an instrumental variable. In our case
we used the Chicago Fed FCI as the instrumental variable for both quarterly series because it
was highly correlated with the quarterly indicators. (The Chicago Fed FCI is a regularly
published weekly index of financial conditions.)
January February March
Debit balances at margin accounts 1 1 1
Senior Loan Officer Survey 0 1 2
Security Repurchases 4 2 3
Month of Index being produced (Indexes produced for the previous month)
In any given month, the LCI is calculated from data that would have been available at that
time. Missing data are forecasted according to the schedule above using the equation below.
This is similar to the way missing data due to publication delays are imputed in the LEI;
however, it also relies on the high correlation between the Chicago Fed index and the
indicator to get a more reliable current estimate.
For Senior Loan Officer Survey the estimation is done in levels for the other two quarterly
variables the estimation is done in dlogs.
66 The correlation of the LEI to the CEI appears to be lessened since the mid-1990s. McGuckin and Ozyildirim () suggest that this could be due to structural changes in the U.S. economy underway in the 1990s. In this paper, we identify one of those structural changes, namely, those occurring in the activity of financial sectors of the economy that are not currently well represented in the LEI.
tchicagofedi
itVitV
2
10

Example of Vintages of LCI in real time
Jan '96 Feb '96 Mar '96 Apr '96 – Apr ‘11 May '11 Jun '11 Jul '11
Vintage: LCI_1 LCI_2 LCI_3 LCI_4 - LCI_184 LCI_185 LCI_186 LCI_187
(1) (2) (3) (4) (5) (6) (7)
Jan-90 2.40 2.42 2.44 … 1.12 1.12 1.12
Feb-90 1.70 1.71 1.73 … 0.82 0.83 0.83
Mar-90 1.79 1.81 1.83 … 0.94 0.94 0.95
… … … … … … … …
… … … … … … … …
Oct-95 -0.21 -0.13 -0.11 … … … …
Nov-95 -0.93 -0.85 -0.84 … … … …
Dec-95 -0.46 -0.33 -0.31 … … … …
Jan-96 -0.77 -0.43 -0.41 … … … …
Feb-96 NA -1.28 -1.38 … … … …
Mar-96 NA NA -1.03 … … … …
Apr-96 NA NA NA … … … …
May-96 NA NA NA … … … …
… NA NA NA … … … …
… NA NA NA … … … …
Feb-11 NA NA NA … -1.86 -1.86 -1.85
Mar-11 NA NA NA … -1.30 -1.30 -1.30
Apr-11 NA NA NA … -1.57 -1.57 -1.57
May-11 NA NA NA … -1.33 -1.11 -1.14
Jun-11 NA NA NA … NA -1.09 -0.90
Jul-11 NA NA NA … NA NA -1.35
Now that we have obtained real time vintages of the LCI, we can turn to the same for the LEI.
Several components of the LEI will not be available at the time of its release each month.
Using a similar approach the missing components are imputed (the imputation only uses an
AR(2) model in dlogs).
The following tentacle charts show how the LEI vintages look in real time following these
procedures:

Real Time LEI Vintages
2011
135
136
137
138
139
140
141
142
143
144
145
2010q1 2010q2 2010q3 2010q4 2011q1 2011q2 2011q3
LEI_180LEI_181LEI_182LEI_183LEI_184LEI_185LEI_186LEI_187

Real Time LEI Vintages 1996-
2011
100
110
120
130
140
150
160
170
180
96 97 98 99 00 01 02 03 04 05 06 07 08 09 10 11