economics (1)
DESCRIPTION
COUNTRY ECONOMIC ANALYSIS OF MAURITIUSTRANSCRIPT

TAMIL NADU NATIONAL LAW SCHOOL
B.A.LL.B., (HONS.), THIRD SEMESTER 2015-16
ECONOMICS PROJECT
ON
COUNTRY ECONOMIC ANALYSIS OF MAURITIUS
PROJECT BY: - SUBMITTED TO:-
SHUBHAM SINGH BHADOURIYA PROF. S SATYAMOORTHY
BA0140059
SECTION-B
1

INTRODUCTION
Today, Mauritius is the most densely populated country in Africa. Yet Mauritius was
uninhabited until 1598, when the Dutch who settled on the island named it Mauritius after Prince
Maurice of Nassau. The French took formal possession in 1715, renaming the island Île de
France; the British captured the island in 1810 and renamed it Mauritius.
From 1810 until they were separated in 1903, Mauritius and Seychelles were administered as a
single British colony by a governor and British officials. Mauritius became an independent state
and joined the Commonwealth in 1968. Negotiations for political autonomy in the 1960s were
led by Seewoosagur Ramgoolan, leader of the Labour Party. He went on to become the first
prime minister of Mauritius.
The government of Ramgoolan refused to allow the general election due in 1972 to go ahead,
concerned as they were about the growing strength of the socialist Mouvement Militant
Mauricien (MMM). A state of emergency was declared and MMM and union members leaders
were imprisoned. In 1982 the MMM, in alliance with Labour break-away group the Parti
Socialiste Mauricien (PSM), won all the elected seats in the National Assembly. Although the
MMM in government was less radical than it had been in the early 1970s, the alliance broke
down within a year. Anerood Jugnauth, prime minister and president of the MMM, then broke
away from the MMM to form a new party, the Mouvement Socialiste Mauricien (MSM). At the
head of a new alliance of parties, the MSM won the elections of 1983, leaving the old MMM in
opposition. An alliance of MMM and MSM were returned to power in 1991. In 1992 Mauritius
became a republic within the Commonwealth.
In the July 2005 general election, the opposition Social Alliance (with 38 seats) defeated the
governing alliance; Labour Party leader Dr Navinchandra Ramgoolam became prime minister.
He was the son of Seewoosagur Ramgoolan, the first prime minister of Mauritius. The general
2
election in 2010 was won by Navinchandra Ramgoolam’s newly formed Alliance of the Future,
with 41 of the 62 National Assembly seats.1
1. Economic Snapshot (Latest figures/percentage for)
a. Form of government:
Mauritius is a democratic republic with a parliamentary system and a non-executive president.
The president is appointed for a five-year term by the National Assembly.
The prime minister is head of the government, which holds executive power. The prime minister
and deputy prime minister are appointed by the president and are responsible to the National
Assembly. The prime minister’s position is maintained by his or her ability to command a
majority in the Assembly.
Legislative power is vested in the government and the National Assembly. The Assembly
comprises up to 70 members, 62 of whom are elected (60 from 20 three-member constituencies
on the island of Mauritius plus two from the single constituency of Rodrigues). Seats are
allocated to a maximum of eight additional members to allow representation of a variety of
ethnic groups; this system of nominating members is commonly called the ‘best loser’ system.
General elections take place every five years, based on universal suffrage for citizens over the
age of 18. Local government has nine administrative divisions. The island of Rodrigues forms
the tenth division.
The constitution establishes the separation of the powers between the legislature, the executive
and the judiciary. It guarantees the protection of the fundamental rights and freedoms of the
individual. The death penalty was abolished in 1989.
The judicial system derives from the English common law and the French Napoleonic Code. The
Supreme Court comprises the Court of Civil Appeal and the Court of Criminal Appeal; it has a
chief justice and nine judges, and has original jurisdiction in the most serious criminal cases,
1 http://www.commonwealthofnations.org/sectors-mauritius/government/
3

when it sits with judge and jury. The Industrial Court is mandated to protect the constitutional
rights of the citizen. The Privy Council in the United Kingdom is the final court of appeal.2
b. GDP:
The Gross Domestic Product (GDP) in Mauritius was worth 12.62 billion US dollars in 2014.
The GDP value of Mauritius represents 0.02 percent of the world economy. GDP in Mauritius
averaged 4.53 USD Billion from 1976 until 2014, reaching an all time high of 12.62 USD Billion
in 2014 and a record low of 0.71 USD Billion in 1976. GDP in Mauritius is reported by the
World Bank.
The gross domestic product (GDP) measures of national income and output for a given country's
economy. The gross domestic product (GDP) is equal to the total expenditures for all final goods
and services produced within the country in a stipulated period of time. This page provides the
latest reported value for - Mauritius GDP - plus previous releases, historical high and low, short-
term forecast and long-term prediction, economic calendar, survey consensus and news. Content
for - Mauritius GDP - was last refreshed on Sunday, September 6, 2015.3
c. Population:
As of 1 January 2015, the population of Mauritius was estimated to be 1 319 906 people.
This is an increase of 0.73 % (9 552 people) compared to population of 1 310 354 the year
before. In 2014 the natural increase was positive, as the number of births exceeded the number of
deaths by 9 552. Unfortunately, we do not have any data related to external migration in 2014.
The sex ratio of the total population was 0.975 (975 males per 1 000 females) which is lower
than global sex ratio. The global sex ratio in the world was approximately 1 016 males to 1 000
females as of 2014. See also map of the world by sex ratio of total population.4
d. Unemployment:
2 http://www.commonwealthofnations.org/sectors-mauritius/government/3 http://www.tradingeconomics.com/mauritius/gdp4 http://countrymeters.info/en/Mauritius
4
Unemployment Rate in Mauritius increased to 8.70 percent in the first quarter of 2015 from 7.54
percent in the fourth quarter of 2014. Unemployment Rate in Mauritius averaged 7.65 percent
from 1983 until 2015, reaching an all time high of 19.70 percent in the fourth quarter of 1983
and a record low of 2.70 percent in the fourth quarter of 1991. Unemployment Rate in Mauritius
is reported by the Central Statistics Office, Mauritius.
In Mauritius, the unemployment rate measures the number of people actively looking for a job as
a percentage of the labour force. This page provides the latest reported value for - Mauritius
Unemployment Rate - plus previous releases, historical high and low, short-term forecast and
long-term prediction, economic calendar, survey consensus and news. Content for - Mauritius
Unemployment Rate - was last refreshed on Sunday, September 6, 2015. 5
e. Country rating:
Mauritius's small yet diversified economy, good record of attracting investment and its resilience
against external shocks underpin its Baa1 (Stable) government bond rating6.
f. Ease of doing Business:
Mauritius made starting a business easier by reducing trade license fees. And it made enforcing
contracts easier by introducing an electronic filing system for court users.
Areas of business regulatory reform: Starting a business, Enforcing contracts
DB2015 ease of doing business rank: 28
DB2014 back-calculated ease of doing business rank: 29
DB2015 distance to frontier score: 74.8
DB2014 back-calculated distance to frontier score: 74.4; improvement: 0.47
g. Human Development Index:
The Human Development Index (HDI) is a summary measure of average achievement in key
dimensions of human development: a long and healthy life, being knowledgeable and have a
5 http://www.tradingeconomics.com/mauritius/unemployment-rate6 https://www.moodys.com/research/Moodys-Mauritiuss-diversified-and-resilient-economy-support-rating-fiscal-challenges--PR_3262427 http://www.doingbusiness.org/~/media/GIAWB/Doing%20Business/Documents/Fact-Sheets/DB15/DB15SSAFactSheetEnglish.pdf
5

decent standard of living. The HDI is the geometric mean of normalized indices for each of the
three dimensions. The HDI of Mauritius is 0.771 ranks 63rd in the world8.
h. Gini Coefficient:
Gini index measures the extent to which the distribution of income (or, in some case,
consumption expenditure) among individuals or households within an economy deviates from a
perfectly equal distribution. A Lorenz curve plots the cumulative percentages of total income
received against the cumulative number of receipts, starting with the poorest individual or
household. The Gini index measures the area between the Lorenz Curve and a hypothetical line
of absolute equality, expressed as a percentage of the maximum area under the line. Thus a Gini
index of 0 represents perfect equality, while an index of 100 implies perfect inequality9.
The Gini Coefficient of Mauritius in the index is 35.9.
i. Ranking by size and population:
Population:
The total population in Mauritius was last recorded at 1.3 million people in 2014 from 0.7
million in 1960, changing 91 percent during the last 50 years. Population in Mauritius averaged
1.02 Million from 1960 until 2014, reaching an all time high of 1.26 Million in 2014 and a
record low of 0.66 Million in 1960. Population in Mauritius is reported by the Central Statistics
Office, Mauritius.
The population of Mauritius represents 0.02 percent of the world´s total population which
arguably means that one person in every 5408 people on the planet is a resident of Mauritius.
This page provides - Mauritius Population - actual values, historical data, forecast, chart,
statistics, economic calendar and news10.
Size
8 http://hdr.undp.org/en/content/table-1-human-development-index-and-its-components9 http://data.worldbank.org/indicator/SI.POV.GINI10 http://www.tradingeconomics.com/mauritius/population
6
Land area (sq. km) in Mauritius was last measured at 2030 in 2014, according to the World
Bank. Land area is a country's total area, excluding area under inland water bodies, national
claims to continental shelf, and exclusive economic zones. In most cases the definition of inland
water bodies includes major rivers and lakes11.
2. ECONOMIC HISTORY OF MAURITIUS
Since independence in 1968, Mauritius has developed from a low income, agriculture based
economy to a middle income diversified economy with growing industrial, financial, and tourist
sectors. For most of this period, annual growth has been on order of 5% to 6%. This achievement
has been reflected in more equitable income distribution, increased life expectancy, lowered
infant mortality, and a much improved infrastructure. The economy rests on sugar, textiles and
apparel, tourism and financial services, and is expanding into fish processing, information and
communication technologies, and hospitality and poverty development. Mauritius’ sound
economic policies and prudent banking practices helped to mitigate negative effects of the global
financial crisis in 2008-09. GDP grew in the 3-4% per year range in 2010-12, and the country
continues to expand its trade and investment outreach along the globe12.
2. GDP
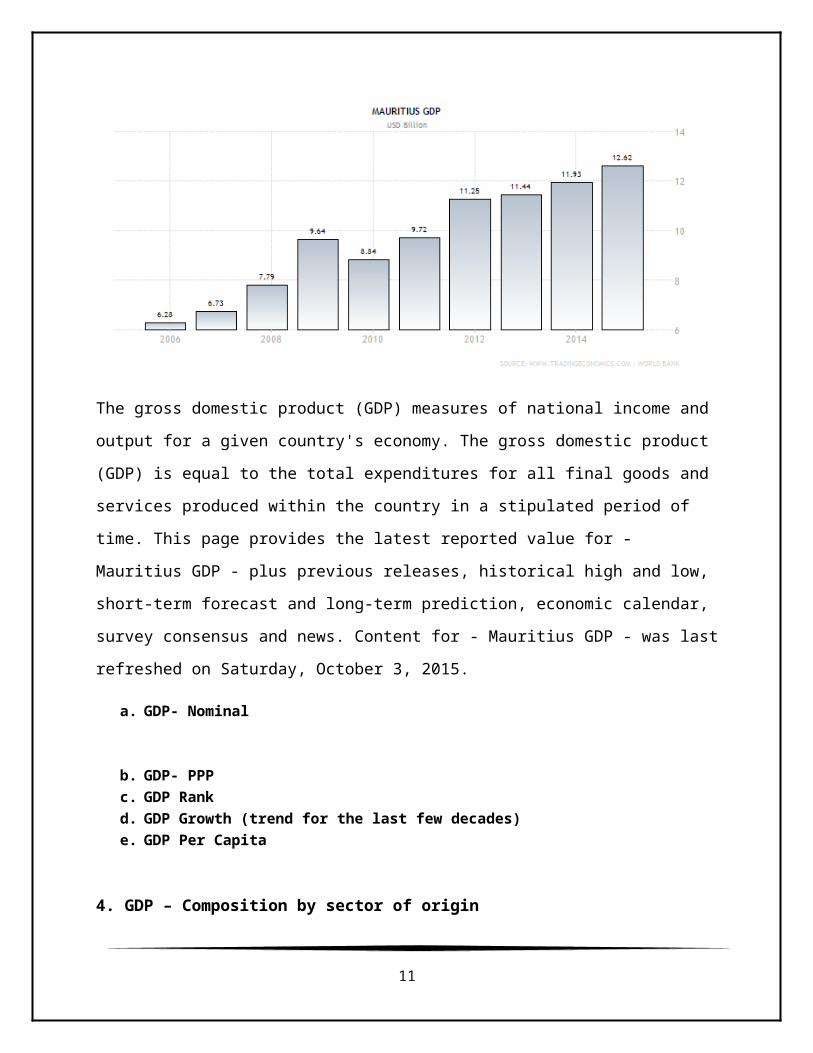
The Gross Domestic Product (GDP) in Mauritius was worth 12.62 billion US dollars in 2014.
The GDP value of Mauritius represents 0.02 percent of the world economy. GDP in Mauritius
averaged 4.53 USD Billion from 1976 until 2014, reaching an all time high of 12.62 USD Billion
in 2014 and a record low of 0.71 USD Billion in 1976. GDP in Mauritius is reported by the
World Bank.
11 http://www.tradingeconomics.com/mauritius/land-area-sq-km-wb-data.html12 http://www.globalfinance.mu/index.php?option=com_content&view=article&id=115&Itemid=461
7
The gross domestic product (GDP) measures of national income and output for a given country's
economy. The gross domestic product (GDP) is equal to the total expenditures for all final goods
and services produced within the country in a stipulated period of time. This page provides the
latest reported value for - Mauritius GDP - plus previous releases, historical high and low, short-
term forecast and long-term prediction, economic calendar, survey consensus and news. Content
for - Mauritius GDP - was last refreshed on Saturday, October 3, 2015.
a. GDP- Nominal
b. GDP- PPPc. GDP Rankd. GDP Growth (trend for the last few decades)e. GDP Per Capita
4. GDP – Composition by sector of origin
a. Sector wise contribution to GDP of the top 5 sectors with the reason
5. GDP– Composition by sector of origin
a. Main goods/products in each sector
8
6. Inflation and interest rate
Inflation:
The inflation rate in Mauritius was recorded at 1.10 percent in August of 2015. Inflation Rate in
Mauritius averaged 6.53 percent from 1988 until 2015, reaching an all time high of 18.10 percent
in April of 1989 and a record low of -1 percent in January of 1992. Inflation Rate in Mauritius is
reported by the Central Statistics Office, Mauritius.
In Mauritius, the inflation rate measures a broad rise or fall in prices that consumers pay for a
standard basket of goods13.
Interest Rate:
The benchmark interest rate in Mauritius was last recorded at 4.65 percent. Interest Rate in Mauritius averaged 5.55 percent from 2006 until 2015, reaching an all time high of 9.25 percent in June of 2007 and a record low of 4.65 percent in June of 2013. Interest Rate in Mauritius is reported by the Bank of Mauritius.
In Mauritius, interest rates decisions are taken by the Bank of Mauritius. The BoM’s official interest
rate is the repo rate.
7. Population and unemployment
Population
The total population in Mauritius was last recorded at 1.3 million people in 2014 from 0.7
million in 1960, changing 91 percent during the last 50 years. Population in Mauritius averaged
1.02 Million from 1960 until 2014, reaching an all time high of 1.26 Million in 2014 and a
record low of 0.66 Million in 1960. Population in Mauritius is reported by the Central Statistics
Office, Mauritius.
The population of Mauritius represents 0.02 percent of the world´s total population which arguably means that one person in every 5408 people on the planet is a resident of Mauritius. This page provides - Mauritius Population - actual values, historical data, forecast, chart, statistics, economic calendar and news
13
9
Unemployment
Unemployment Rate in Mauritius decreased to 7.80 percent in the second quarter of 2015 from 8.70 percent in the first quarter of 2015. Unemployment Rate in Mauritius averaged 7.65 percent from 1983 until 2015, reaching an all time high of 19.70 percent in the fourth quarter of 1983 and a record low of 2.70 percent in the fourth quarter of 1991. Unemployment Rate in Mauritius is reported by the Central Statistics Office, Mauritius.
In Mauritius, the unemployment rate measures the number of people actively looking for a job as a percentage of the labour force.
8. FISCAL HEALTH
Real GDP growth in 2014 was lower than expected at 3.2%, well under the 4% projected in the
2014 National Budget. Economic growth in 2013-14 was driven by the information and
communications technology (ICT) sector and by the financial and insurance sector, which grew
by 6.8% and 5.4%, respectively. These gains were partially offset by the poor performance of the
construction sector, which contracted by 9.4%. The government’s fiscal stance in 2014 remained
expansionary, with the budget deficit increasing to 3.6% of GDP, compared with 3.5% recorded
at the end of 2013. The Bank of Mauritius (BoM) maintained the key repo rate (KRR) at 4.65%
throughout 2014. Year-on-year headline CPI peaked at 4.5% in March 2014, against the
backdrop of public sector wage increases and higher food prices, and then slowed to 3.2% by
September 2014, on the back of falling energy prices. Export growth contributed 4.4% to GDP,
up from 3.5% in 2013. Mauritius’ current-account deficit stood at 8.2% in 2014, mostly driven
by a drop in net income from service exports.
The Government of Mauritius (GoM) has drawn up an economic “blue-print” offering a strategic
vision for a more diversified and resilient economy and an action plan to achieve High Income
Country status by 2025. The “blue-print” plan calls for economic growth of 8-9% per annum and
an upward growth trajectory in ICT, the seafood and marine industry, as well as the financial,
business and biomedical services sectors. The implementation of the Maurice Il Durable
Program and Action Plan – which provides the framework for “green growth” and sustainable
development of the island – and that of the “Blue” Economy, which involves harnessing the
oceanic resources to strengthen Mauritius’ competiveness through innovation in areas such as
10
deep-sea water exploitation, bio-pharmacy and renewable energy, could contribute to a 1% rise
in the GDP within the next two years. While inflation is expected to remain subdued in the short-
to-medium term, at less than 4%, the structural deficit of the current account remains a major
concern. To further counter the current account deficit, policies should be adopted to encourage
national savings and foster competitiveness that will help build human capital and infrastructure.
Mauritius has a very high population density with some 618 people per square km. This situation
has resulted in great pressure on the limited land resources. To address the problems resulting
from acute urbanisation, the government produced a framework for spatial planning in Mauritius
which is contained in the National Development Strategy (NDS). The NDS provides the basis for
land use planning. It sets out the guidelines for sector development and local plans and policies
for the nine administrative districts, based on international spatial planning practices.
Real GDP growth 3.2 3.2 3.5 3.6
Real GDP per capita growth 2.8 2.8 3.2 3.3
CPI Inflation 3.5 3.2 3.1 3.5
Budget Balance % GDP -3.5 -3.6 -3.3 -3.6
Current Account Balance % GDP -8.9 -8.2 -5.9 -7.1
Source: http://www.africaneconomicoutlook.org/en/country-notes/southern-africa/mauritius/
9. CURRENCY
“The Rupee is the official currency of Mauritius. After the Indian immigration, the Indian was
also used in Mauritius. The Rupee is subdivided into 100 cents, but cent coins are not in
circulation.
In 1876, the Mauritius Rupee was first established as the official currency unit.
In 1877, it was put into circulation, replacing the Indian Rupee, the Mauritian Dollar, and
the British Pound Sterling. A Mauritian Rupee was equal to 1 Indian Rupee or ½ a Mauritian
Dollar. The Pound Sterling was worth 10¼ Mauritian Rupees.
The Mauritian Rupee was also used in the Seychelles until 1914; since then the Seychelles have
11

used their official currency, the Seychellois Rupee, at par with the Mauritius Rupee.
In 1934, the pegged Indian Rupee was replaced by the pegged Pound Sterling, with a rate of 1
Rupee = 1 Shilling 6 pence.
Until 1979, 13 1/3 Rupees = equivalent to 1 Pound”14.
“The USDMUR traded at 35.45 MUR on Thursday October 1, according to interbank foreign
exchange market quotes. The Mauritian Rupee averaged 31.23 from 2009 until 2015, reaching an
all time high of 35.68 in September of 2015 and a record low of 27.75 in April of 2011.
Trend of the currency vs. USD over the last few decades
10. FDI & FII
”Besides the government's incentive measures (such as tax incentives, payment facilities, etc.),
the country offers investors a stable economic and political environment, modern infrastructure,
a solid judicial system and a highly skilled and dynamic workforce. Only the television sector is
subject to restrictions: a foreign company cannot hold more than 20% of the capital of a
Mauritian company. Mauritius expects to become an investment platform located midway
between Africa and Asia. In recent years, the country's economic diplomacy has sought to create
and strengthen partnerships with emerging countries (India, Turkey, Asia, etc.), while also
offering technical aid to several African countries.
14 http://www.oanda.com/currency/iso-currency-codes/MUR
12

FDI experienced constant growth in the years leading up to the global economic crisis. After
having slightly decreased, FDI almost reached its record level again in 2012. According to
estimations, FDI inflows to Mauritius reached USD 258 million in 2013. However a large part of
FDI is redirected to India (45% of Indian FDI inflows come from Mauritius), as both countries
have signed a double taxation agreement. According to the ratings of Doing Business 2015,
issued by the World Bank, Mauritius is the 28th (out of 189) most favorable countries for
businesses in the world. The Heritage Foundation classifies Mauritius in tenth place worldwide
in regards to its economic freedom ranking in 2015.
The tourism sector attracts most of FDI, particularly the Integrated Resort Scheme, which
concerns the construction of luxury villas, golf courses and other amenities in the resort areas.
The main investors are the United Kingdom, France, South Africa and the United States”15.
Foreign Direct Investment
2012 2013 2014
FDI Inward Flow (million USD)
589 259 418
FDI Stock (million USD)
3,218.0 4,411.5 4,586.1
Number of Greenfield Investments***
12.0 4.0 7.0
FDI Inwards (in % of GFCF****)
22.8 10.2 16.3
FDI Stock (in % of GDP)
28.7 37.0 34.6
Source: http://www.mauritiustrade.mu/en/trading-with-mauritius/mauritius-investing-in-mauritius
11. TRADING IN MAURITIUS (IMPORT-EXPORT)
15 http://www.mauritiustrade.mu/en/trading-with-mauritius/mauritius-investing-in-mauritius
13

Mauritius has a liberal economic and trade policy. The country is a member of the WTO, as well
as many other regional economic groups (COMESA, SADC, and IOC). In the past few years,
foreign trade has represented more than 120% of the GDP. The objective of the trade policy of
Mauritius is to transform the island into an open and globally competitive economy and to fully
integrate it into the world trade system. Comparatively, customs duties are low, the island is open
to international trade and does not have any trade barriers. The factors that attract trade include a
solid banking and financial system, good infrastructure, a stable social environment and
transparent and favourable trade regulations. Mauritius wishes to become a gateway to attract
investors from all over the world towards Africa, and it is developing economic partnerships and
technical assistance with several countries of the continent.
Mauritius imports more than it exports, resulting in a trade deficit that increased during the
economic crisis and should continue increasing in the coming years. However, according to
available records, this deficit was reduced between 2012 and 2013 due to a slight increase in
exports.
The country's main trade partners are the European Union, India and the United States. Mauritius
exports clothing, textiles, sugar, cut flowers, molasses and fish towards the European Union
(United Kingdom, France, Italy, etc.), the United States, South Africa, Madagascar and Vietnam.
Sugar cane occupies 90% of the country's cultivated land and represents 15% of its exports. The
export of services has been constantly rising. In this area, the country has a positive trade
balance. The island imports manufactured goods, capital goods, foodstuffs, oil and chemical
products from India, the European Union, China, South Africa and Australia.
Foreign Trade Indicators
2010 2011 2012 2013 2014
Imports of Goods(million USD)
4,386 5,149 5,354 5,399 -
Exports of Goods(million USD)
2,261 2,565 2,673 2,872 -
Imports of 1,951 2,450 2,378 2,608 -
14

Foreign Trade Indicators
2010 2011 2012 2013 2014
Services(million USD)
Exports of Services(million USD)
2,656 3,237 3,364 3,217 -
Imports of Goods and Services(Annual % Change)
10 6 1 6 2
Exports of Goods and Services(Annual % Change)
14 5 3 4 3
Trade Balance(million USD)
-1,895 -2,352 -2,456 -2,270 -
Foreign Trade (in % of GDP)
116 120 121 121 117
Imports of Goods and Services(in % of GDP)
64 66 67 66 63
Exports of Goods and Services(in % of GDP)
52 53 55 54 54
Source: http://www.mauritiustrade.mu/en/trading-with-mauritius/mauritius-trade-profile
15

MAIN PARTNER COUNTRIES:
Main Customers(% of Exports)
2014 Main Suppliers(% of Imports)
2014
France 14.6% India 21.6%
United Kingdom 13.6% China 16.2%
United Arab Emirates 10.7% France 7.7%
United States 10.5% South Africa 6.6%
South Africa 7.1% Vietnam 3.6%
Other Countries 43.6% Other Countries 44.4%
Source: http://www.mauritiustrade.mu/en/trading-with-mauritius/mauritius-trade-profile
Main Products:
2.7 bn of USD products exported in 2014 5.6 bn of USD products imported in 2014
Prepared or preserved fish; caviar and
caviar….
12.0% Petroleum Oils or Oils obtained
from bituminous
15.9%
Transmission apparatus for radio
telephony…
11.2% Transmission Apparatus for radio-
telephony
5.9%
Cane or beet sugar and chemically
pure sucrose, in….
9.5% Frozen fish (excl. fish fillets and
other fish
5.1%
T-shirts, singlets and other vests,
Knitted or……..
8.7% Motor Cars and other Motor
Vehicles principally
3.3%
16

Men’s or boys’ shirts (excl. knitted or
crocheted…
6.3% Diamond, whether or not worked,
but mounted
2.1%
Source: http://www.mauritiustrade.mu/en/trading-with-mauritius/mauritius-trade-profile
16. IMPACT OF 2008 FINANCIAL CRISIS ON THE ECONOMY
“Like almost all economies worldwide, the Mauritian economy has not been spared from the
effect of the global financial crisis and subsequently to the recent European crisis. The former is
considered to be the worst financial crisis since the Great Depression of the 1930s. This was
mainly due to the falling home prices in the United State which consequently spread to all other
major economies and those which are dependent on the US economy. The Global Financial
Crisis has led to the crisis of public debt in the Euro zone starting with Greece at the end of 2009.
Due to the linkage of member countries in the Euro zone and the use of a single currency, the
crisis faced by Greece started to spread to other member countries and this became known as the
Euro zone crisis. It is obvious that although the measures that would be analyzed have had great
effectiveness on mitigating the impact of the two crises, it has not been inevitable to prevent
them from affecting the key sectors of the Mauritian economy. One reason is because of its
openness and financial integration to the world economy and the other being the fact that
Mauritius has longed been and is still very Eurocentric.
With the impact of the Global Financial Crisis on the world economy and the deterioration of
banks' financial position, investors in Mauritius started to react in September 2008 by massively
selling their shares. Not surprisingly, companies whose prices declined the most were those in
the banking and financial sector such as the Mauritius Commercial Bank (MCB) and the State
Bank of Mauritius (SBM). As a result, the SEMDEX, the share price index of shares quoted on
the Official Market of the Stock Exchange of Mauritius, started to decline to its lowest level.
This indicated the level of pessimism among investors in the Mauritian economy.
The Global Financial Crisis affected all key sectors of the Mauritian economy, such as the textile
industry, the tourism industry, the sugar industry, the financial services sector, and the
17
construction industry. This was mainly due to the trade liberalization of Mauritius to the world
economy. As such, even though Mauritius is not related to the origin of the financial crisis, the
effects of the crisis crossed the Mauritian border uninvited. This is the danger of globalization on
small states like Mauritius.
Among all the sectors of the Mauritian economy, the textile and tourism was most affected.
Many firms closed down. Low level of tourist arrivals, due to the increasing level of
unemployment in key markets, affected the tourism industry deeply. The construction industry
experienced a slowdown in its economic activity. Foreign Direct Investment fell significantly
during the crisis. Finally, during the same period the sugar industry had to undertake reforms
because of the end of the European Union Sugar Protocol in 2006. Rising unemployment was not
inevitable and the economic growth rate was declining.
However, it should be noted that Mauritius did not register negative output growth during the
global economic downturn. Measures by the government and the Bank of Mauritius successfully
prevented the Mauritian economy from entering into a recession”16.
17. ECONOMY BEFORE AND AFTER 2008
18. INTERNATIONAL TRADE MEMBERSHIP OF MAURITIUS
WTO
Mauritius has been a WTO member since 1 January 1995 and a member of GATT since 2
September 1970. As a member of the WTO, Mauritius is subject to surveillance of national trade
policies by the WTO. In this context, a Trade Policy Review (TPR) is carried out every 5 years
by officials of the WTO.
16 http://www.ukessays.com/essays/economics/impact-of-the-financial-crisis-globally-and-in-mauritius-economics-essay.php
18

The latest Trade Policy Review was published in 2014 and highlights the commitment of
Mauritius to a continuous economic reform process aimed at further improving its economic and
doing business climate; increasing economic resilience and more efficient use of its limited
resources17.
19. Financial markets
20. SWOT analysis
The Strategy contains a Strengths, Weaknesses, Opportunities, and Threats (SWOT) analysis
which identified major strengths as political stability, dynamic entrepreneurship, favourable trade
agreements, strong public / private sector dialogue and shared goals, and positive economic and
social indices. Weaknesses include uncoordinated institutional support, inadequate economic
infrastructure, weak technology / innovation base and inadequate R & D, low productivity,
product and market concentration and an inward oriented manufacturing sector.
SWOT analysis of the economy with no more than five points under each header backed up by references
I. Mauritius Tourism:
Strengths:
1. Natural Resources and Beauty
2.
17 http://www.mcci.org/en/global-marketplace/trade-agreements/wto/
19

20