economic value of the tournament black bass fishery on
TRANSCRIPT

Economic Value of the Tournament Black Bass Fishery on Lake Guntersville, Alabama
by
Patrick Lee Snellings
A thesis submitted to the Graduate Faculty of
Auburn University
in partial fulfillment of the
requirements for the Degree of
Fisheries, Master of Science
Auburn, Alabama
May 9, 2015
Keywords: Recreational fishing, Tournament Fishing,
Economic impact, Travel cost model
Copyright 2015 by Patrick Lee Snellings
Approved by
Terrill R. Hanson, Chair, Associate Professor,
Steven Sammons, Research Fellow IV,
Diane Hite, Professor,
School of Fisheries, Aquacultures and Aquatic Sciences

ii
Abstract
Lake Guntersville is one of the most renown black bass fisheries in the United States and as such
attracts many tournaments of various sizes and competition levels. This study attempted to quantify
the economic impact of these tournaments on the local communities and state through expenditures,
tax revenues, and estimated consumer surplus. The study was conducted via access points where
anglers were distributed survey packets in postage paid envelopes and instructed to complete and
return the survey via mail or online. Of 1672 total surveys distributed, 439 were returned, for a 26%
response rate. A total of 272 tournaments were estimated to have occurred in 2013, fished by 10,035
anglers. Annual tournament angling effort on Lake Guntersville was estimated to be 89,000 angler
hours; when accounting for time spent practicing this number increased to 266,000 hours. Overall
annual tournament angling expenditures on Lake Guntersville in 2013 were $4.6 million dollars,
generating $222,000 in tax revenue. The total economic impact of the tournament fishery was
estimated to be $6.7 million after adjusting for a regional multiplier. Consumer surplus for
tournament black bass anglers was $667 (SE, $102) per visit and $225 per day. Overall willingness-
to-pay for tournament anglers was $1,122 per visit; consumer surplus represented 59% of the total
willingness-to-pay. Large single tournaments, which attracted large proportions of out of state
anglers and associated overnight trips, resulted in the greatest local economic impact, and should be
the events local tourism bureaus and Chambers of Commerce focus on attracting to the area. These
large events are usually highly publicized and can showcase the fishery directly leading to more
tournaments and recreational angling at the fishery.

iii
Acknowledgements
I would like to thank my parents, David and Wanda Morris, my family, and close friends for
their support while pursuing a higher education in the field of fisheries science. If it weren’t for my
parents exposing me to the outdoors and encouraging my participation in these endeavors none of
this would have been possible.
I would like to thank Dr. Terry Hanson, my major professor, for all of his support, guidance,
and encouragement throughout the course of this project. Dr. Steve Sammons was an essential part
in my attending of Auburn University and I appreciate all of his support throughout the project. Dr.
Diane Hite was a tremendous help in the economic analysis phase of the project and leading me to
greater understanding of natural resource economic modeling. I would like Dr. Mike Meceina for his
expertise in analysis and his insight in the development of this study.
This study was funded by the Alabama Department of Conservation and Natural Resources
(ADCNR) in 2013 and 2014. I would like to thank them for the opportunity to work on such an
incredible fishery and the opportunity to pursue my graduate studies at Auburn University. The
tournament organizations BASS, FLW, and Jaime Shay at The Bait Tackle and Grill at Goosepond
were cooperative and courteous in providing tournament information when needed and providing
assistance when necessary during this project. Finally, I would like to specifically thank Jeff
Buckingham, Chase Katechis, Jeff Holder, David Smith, and KC Weathers for helping with
sampling or doing so when I was not able.

iv
Table of Contents
Abstract ii
Acknowledgements iii
List of Tables vii
List of Figures viii
List of Abbreviations ix
Definitions of Note x
I. Introduction 1
1. Tournament Fishing 1
2. Site Description 4
3. Economic Valuation 5
4. Angler Surveys 6
5. Rationale and Significance 6
6. Study Objectives 7
II. Methods 9
1. Survey Design 9
2. Sampling Schedule and Tournament Selection 10

v
3. Survey Distribution 11
4. Effort and Catch 12
5. Expenditures 15
6. Tax Revenue 17
7. Travel Cost Model 18
8. Consumer Surplus 21
9. Local Impact of Tournament Angling 22
III. Results 23
1. Descriptive Survey Statistics 23
2. Effort and Catch 24
3. Expenditures 26
4. Tax Revenues 27
5. Travel Cost Model and Consumer Surplus 28
IV. Discussion 30
1. Sampling Techniques 30
2. Effort and Catch 32
3. Expenditures 33

vi
4. Tax Revenue 35
5. Consumer Surplus 36
6. Local Impact of Tournament Angling 38
7. Conclusions and Management Implications 39
V. Literature Cited 42
VI. Tables ` 47
VII. Figures 59
VIII. Appendices 65

vii
List of Tables
Table 1. Relative tournament frequency by type 47
Table 2. Local City, County, and State Tax Rates 48
Table 3. Average number of anglers per tournament 49
Table 4. Descriptive Trip Variable Averages for Different Tournament Types 50
Table 5. Angling Effort 51
Table 6. Travel Cost in Thousands 52
Table 7. Travel Cost by State of Origin 53
Table 8. Tax Revenue Generated by Tournament Anglers 54
Table 9. Distribution of Tax Revenue 55
Table 10. Results from TCM Regression for All Tournament Anglers 56
Table 11. Results from TCM Regression for Out-of state Tournament Anglers 57
Table 12. Results from TCM Regression for In-state Tournament Anglers 58

viii
List of Figures
Figure 1. Map of Lake Guntersville and the Surrounding Counties and Cities 60
Figure 2. Relative Tournament Frequency by Type from McKee 61
Figure 3. Graphical Representation of a Demand Curve 62
Figure 4. Tournaments Sampled and Tournaments Know to Occur by Month 63
Figure 5. Angler Expenditures on Lake Guntersville by Tournament Type 64

ix
List of Abbreviations
CPUE Catch per unit effort
RPUE Release while culling per unit effort
WPUE Weighed in per unit effort
TCM Travel cost model
WTP Willingness to pay

x
Definitions of Note
Border State Tennessee or Georgia
Consumer Surplus willingness to pay above and beyond a person’s actual expenditures and is the
area below the recreational visit demand curve and above the equilibrium
travel cost (price)
Culling the act of removing a smaller fish from the live well during a tournament and
replacing it with a larger fish that was just caught
Local Madison, Marshall, or Jackson Counties, Alabama
Non-local all of Alabama excluding Madison, Marshall, or Jackson Counties
Opportunity Cost measure in terms of value of the next best alternative forgone; in this study, a
fraction of the angler’s wage rate applied to the round trip travel time to the
study site and substitute sites
Substitute Site similar site that could replace the study site; in this study the opportunity cost
of travel to the substitute site was used in the travel cost model
Travel Cost Model method to estimate travel costs (opportunity cost of travel plus actual
expenditures) and visit frequency to establish angler visitation demand for
tournament black bass fishing
Willingness-to-pay maximum an angler is willing to pay to fish
I. INTRODUCTION
I. 1. Tournament Fishing
One of the largest and fastest growing aspects of inland fishery use is organized
competitive sport fishing (Schramm et al. 1991a). Estimates of competitive fishing events
(hereafter, “tournaments”) on inland waters in the United States have increased, from 12,369 in
1978, to 18,303 in 2000, to the most recent estimate of 32,321 in 2005 (Schupp 1979; Kerr and
Kamke 2003; Schramm and Hunt 2007). In 2005, number of tournaments per state ranged from
20 in the District of Columbia to 6,000 in Texas (Schramm and Hunt 2007). Duttweiler (1985)
found that black bass Micropterus spp. represented the majority of freshwater tournament fishing
in the United States, a ratio of 10 to 1 when compared to other species. Likewise, Schramm et
al. (1991b) reported found that black bass were the target species in 78% of all competitive
fishing events held on inland waters in North America.
Organized competitive fishing for black bass originated in Alabama in 1967 with the
formation of the Bass Anglers Sportsman Society which has become the most recognized
organization conducting bass fishing tournaments (Shupp 1979). Since 1967, many other bass
tournament groups have been organized on the local, state, and national level, expanding from
primarily southern and midwestern states to all regions of the continental United States.
Advances in fishing technologies such as boats, motors, electronics, tackle, and accessories have
come as a result of the popularity of tournament fishing and have led to greater specialization of
black bass anglers. Wilde and Ditton (1994) found anglers that identifying themselves as
specifically targeting largemouth bass Micropterus salmoides had characteristics different than
anglers generally targeting just “bass”, having more years of fishing experience, spending more

2
days fishing, having a higher percentage of boat ownership, and were more likely to participate
in tournaments or belong to fishing clubs. Wilde et al. (1998) examined differences between
tournament and non-tournament anglers and found that tournament fishermen were a more
specialized group, spending more days fishing annually and were more invested in the resource.
Tournament anglers undoubtedly have higher expenditures than many noncompetitive anglers
due to larger tow-vehicles, boats and motors, and increased use of fuel, tackle, travel, and
lodging (Schramm et al. 1991a).
Many tournament events last multiple days and attract participants from outside the
region or state, (exceeding 50% of anglers in some tournaments), but can range in size from a
few anglers in a Local Club to several thousand anglers (Schramm et al. 1991a). These events
can result in substantial expenditures in the local communities where the event is held and can be
an important component of the local economy which often spend thousands of dollars to attract
these tournaments (Schramm et al. 1991a). The Southern Collegiate Bass Fishing Series in 2009
averaged more than eighty anglers in each of its four tournaments in North Alabama and
attracted anglers from seven different states traveling an average distance of 850 km one way to
reach the tournament (Myles and Swaim 2010). Competing anglers spent an average of $127.77
each day during the events, which resulted in a total direct economic impact of $111,141,
including tournament organizer expenditures.
Recent boosts in tournament coverage through websites and other media emphasize that
tournament fishing is more widespread now than it has been in the last twenty years (Schramm
and Hunt 2007). The popularity of high-profile tournament series has turned fishing into a
spectator sport where fans attend tournaments and follow the sport through various forms of
printed and electronic media. The 2012 Bassmaster Classic, held over a three-day period in

3
Shreveport, Louisiana, attracted over 63,000 spectators who spent an average of $55.09 for local
daytrippers, $120.75 for out-of-town daytrippers, and overnighters $273.73, for a total direct
economic impact of $10.9 million to the Shreveport-Bossier metropolitan area (Destination
Exploration 2012).
These tournaments often attract high levels of participation, of which a large proportion
are not from the local area, and can be assumed to incur many travel and fishing related expenses
in close proximity of Lake Guntersville (Schramm et al. 1991a). Chen et al. (2003) found on
Lake Fork, Texas, that anglers from bordering states had average per trip expenditures that were
six times more than those of local anglers, and non-bordering states spent over ten times per trip
on average than local anglers. Ditton et al. (2002) predicted that areas with good fishing
opportunities with large population concentrations on their borders are most likely to benefit
from fishing as tourism; thus, Lake Guntersville is likely to attract many out of state tournaments
due to its location within 300 km of four major metropolitan areas, three of which are outside
Alabama.
Thus, black bass tournaments have a significant economic impact on the communities
that hold these events, and numerous studies have recognized the importance of determining
economic values of competitive fishing (Shupp 1979; Schramm et al. 1991a; Schramm and Hunt
2007). However, economic valuations of competitive fishing to date have determined the
economic value of individual competitive events, but few have determined the overall economic
impact of tournament angling on a specific resource (Driscoll et al. 2010). This study looks to
address this concern by determining the overall economic impact of tournament bass angling on
Lake Guntersville, Alabama, a main stem impoundment of the Tennessee River.

4
I. 2. Site Description
The birthplace of organized bass fishing tournaments and home to many large freshwater
impoundments, the state of Alabama is well known for its black bass fisheries. In 2011 in
Alabama 683,000 anglers spent $456 million statewide on recreational angling. Approximately
30% of these anglers were nonresidents
The 27,500-ha Lake Guntersville is the largest impoundment in the state of Alabama,
located in the northeastern corner of the state adjacent to both Georgia and Tennessee. The
reservoir was impounded in 1939 and provides flood control, navigation, hydroelectric power,
water supply, and recreational opportunities. Lake Guntersville is predominantly known for its
excellent fishing opportunities especially for black bass. In 2012 it was ranked by Bassmaster
Magazine as the third best bass fishing lake in the country and boasts healthy populations of
largemouth bass, spotted bass Micropterus punctulatus, and smallmouth bass Micropterus
dolomeiu (Hall et al. 2012). Lake Guntersville also attracts several large tournament Trails
including FLW series (Walmart FLW Tour, the FLW Everstart Series, the Walmart Bass Fishing
League, and FLW College Fishing), Bassmaster series (the Bassmaster Elite Series, the
Bassmaster Open Series, the Bassmaster Weekend Series), and American Bass Angler
tournament series. Also, numerous Large Open events occur annually such as the Sealy Big
Bass, Oakley Big Bass, the Rat-L-Trap Classic, the Snag Proof Open, the Spro Frog Open, and
the Gambler Lures Tournament. Large tournaments and tournament series can produce
significant economic impacts to the local Lake Guntersville area, specifically the surrounding
towns of Guntersville and Scottsboro, and the surrounding counties of Jackson, Madison, and
Marshall (Figure 1).

5
I. 3. Economic Valuation
One of the most common models for estimating the economic values of recreational
fisheries is the travel cost method (TCM) (Palm and Malvestuto 1983; Sorg and Loomis 1986;
Stynes and Donnelly 1987; Shrestha et al. 2002; Ojumu et al. 2009). TCM is a revealed
preference approach to estimating a demand curve for angling using travel costs (vehicle fuel,
lodging, food and drink, etc.), angler expenditures (boat fuel, fishing equipment, license and
tournament fees, etc.), substitute sites, opportunity costs, income distributions, and
socioeconomic factors as it relates to distance traveled to reach the fishing site (Stynes and
Donnelly 1987; Shrestha et al. 2002). Opportunity cost of income determines the value anglers
place on a resource using the relationship between a percentage of their hourly salary, typically
ranging from 25% to 50%, and the time spent travelling to and from a site (Sorg and Loomis
1986; Donnelly 1987; Pollock et al. 1994).
Opportunity cost of a substitute site examines how far an angler will travel to reach a
target fishing site, as opposed to a substitute site (Sorg and Loomis 1986; Stynes and Donnelly
1987; Pollock et al. 1994). Possible bias can arise using the TCM to evaluate a fishery if
multiple destination or multiple purpose trips are included in the estimate (Sorg and Loomis
1986). The recreational use value of a fishery is measured by anglers’ willingness to pay, also
known as consumer surplus, which is a non-market value placed on a resource representing the
net benefit attributable to a fishery (Palm and Malvestuto 1983; Shrestha et al. 2002). Therefore,
the consumer surplus of an individual can be considered the amount an angler is willing to pay
for the use of a resource above and beyond their actual expenditures (Sorg and Loomis 1986).
The contingent valuation method (CVM) is another model used to estimate consumer surplus by
using a bid style approach to determine an individual’s willingness to pay to use a resource
6
(Pollock et al. 1994). A potential bias in the CVM, however, is that individuals will often deflate
or inflate estimates based on if they believe that higher charges will result from the survey, or
that a resource with low economic value will be lost.
To measure the impact of the tournament black bass fishery on Lake Guntersville beyond
direct expenditures a multiplier effect was used from Myles and Swaim (2010) which looked at
the economic impact of college tournaments in North Alabama.
I. 4. Angler Surveys
The two main designs to conduct angler surveys on fishery resources are through access
point and roving creel methods (Robson and Jones 1989). During access point surveys, a creel
clerk waits at a boat ramp at a predetermined time and intercepts anglers as they complete their
fishing trip. To be representative of an entire calendar year of tournament fishing this survey
should be performed for 12 calendar months (Carlander et al. 1958).
I. 5. Rationale and Significance
Tournament fishing is and has been a growing use of our freshwater fishery resources
since the late 1960’s. Most recent estimates show over 30,000 inland competitive fishing events
are being held annually in the United States of which approximately 80% are targeting black
bass (Schramm and Hunt 2007). Wilde et al. (1998) found that black bass anglers fishing in
tournaments exhibit greater angler specialization than other bass anglers. Fishing is a more
central part of the lives of these anglers, they spend more days fishing, and invest more in fishing
equipment. These anglers also typically have higher expenditures than noncompetitive anglers,
often with great sums of money invested into tow-vehicles, performance boats and motors,
tackle, fuel, and travel expenses to compete in events (Schramm et al. 1991a).

7
Quantifying the effort expended by tournament anglers in Lake Guntersville will provide
insight into a component of the fishery that has not been directly studied previously. Valuating
anglers’ expenditures (tackle, equipment, licenses, food, travel, and lodging) by the location of
these expenditures (towns, cities, and counties in the region) will provide estimates of the
contribution of fishing tournaments to local economies and tax bases. Schramm et al. (1991a)
found that in half of the tournaments studied, over 50% of the anglers were from out-of-state.
With the proximity of Lake Guntersville to both Tennessee and Georgia it is likely that many
anglers fishing in tournaments are non-residents. With the wide range of sizes and frequency of
tournaments, the impact on the regional economies is likely highly variable among tournaments.
Quantifying these differences will allow local chambers of commerce and tourism bureaus to
better utilize resources to target specific angler markets to maximize their economic benefits
from tournaments.
I. 6. Study Objectives
This study estimates the economic value of tournament black bass fishing, to the towns,
cities, and counties (Jackson, Marshall, and Madison) surrounding Lake Guntersville, Alabama
and their tax contributions to these locales. Specifically, the project objectives are:
1. Quantify black bass tournament angling effort;
2. Quantify total travel costs for all tournament types angling for black bass;
3. Partition total tournament trip travel costs into the local cities and counties in which
they occurred;

8
4. Quantify the consumer surplus associated with the demand on tournament black bass
angling; and
5. Investigate the impact of socio-demographic variables on tournament fishing
expenditures and associated taxes on local cities and counties.

9
II. METHODS
II. 1. Survey Design
The nature of bass tournaments where anglers depart from a single ramp together and
return at a scheduled time to “weigh-in”, made it necessary to use an access point survey in this
study as opposed to a roving creel survey. I contacted local merchants, tournament organizers,
and fishing clubs to determine where tournaments were being held and when the weigh-in would
take place. Due to the chaotic nature of the weigh-in period with anglers weighing in fish,
loading and securing their boats and gear, a conventional full creel interview was impractical.
Therefore, prepaid postage mail surveys were distributed to anglers at the weigh in.
Survey questions included socio-demographic characteristics of anglers, substitute site
information, and specific trip catch and expenditures (Appendix I). Due to the Alabama
Department of Conservation and Natural Resources (ADCNR) interest in the use of castable
umbrella rigs (A wire harness to which multiple baits can be attached to be used simultaneously)
we asked if anglers used them while fishing tournaments on Lake Guntersville.
Tournaments were separated into different tournament types based on distinctive
characteristics including number of events annually, number of participants, whether a
tournament organizer was present, cost of entry fee, whether there was angler registration,
organization membership, and if a set schedule existed. Prior to sampling black bass
tournaments were separated into eight different types using the above characteristics which
resulted in Professional, Semiprofessional, Large Open, Small Open, Trail, Non-Local Club,
Local Club, and Wildcat tournaments. Professional events were the most organized and affiliated
with a national fishing organization, had more than 300 participants, entry fees over $400, and a

10
large proportion of non-local anglers. Semiprofessional tournaments were affiliated with a
national fishing organization as well, had over 100 participants, entry fees over $100, and
attracted regional anglers. Large Open tournaments were one time large events on the reservoir
that attracted many nonlocal anglers, were well organized, and ranged from 100 to 1200
participants. Small Open tournaments were single events that were normally held for charity or
fund raising. These tournaments had a tournament organizer, typically 20 or more boats, and
entry fees starting at $30. Trail tournaments were characterized as being part of a larger series
where anglers competed against each other over the course of a season and had an official
tournament director and were often sponsored. These tournaments typically had more than 20
boats, were mostly made up of regional anglers, and entry fees over $50. Non-Local Club and
Local Club tournaments had similar characteristics including some form of tournament director,
typically less than 20 boats, and entry fees less than $40. The difference between these two was
the NonLocal Clubs were generally from out of state and would make Lake Guntersville their
biggest trip of the year often fishing multiple day events. Lastly Wildcat tournaments were the
least organized and were either spontaneous events or had a regular weekly schedule in which
anyone could participate, for example from early spring to late fall there were weekly Tuesday
and Thursday night Wildcat events. These tournaments had the lowest participation typically
fewer than 15 boats, entry fees less than $40, and consisted of local anglers.
II. 2. Sampling Schedule and Tournament Selection
Tournament sampling began in February, 2013, and was completed at the end of January
2014. Sampling was primarily conducted on weekends (Saturday and Sunday) due to data found
by McKee (2013) on Guntersville that approximately 90% of tournaments occurred between the
days of Saturday and Sunday. During the peak tournament seasons of February-June and

11
September-November three weekend sampling trips were conducted each month when there
were known tournaments occurring on Lake Guntersville. During the summer season, July-
August, when many tournaments were fished into the evening, I conducted weekday trips to
assess those nighttime events with a supplemental weekend trip if a known tournaments were
occurring. During the winter season December-January, when there were fewer occurrences of
tournaments two weekends were randomly sampled at major boat ramps.
Tournaments during which surveys were distributed were selected using a random non-
uniform probability sampling where tournaments were chosen based on frequency of tournament
type observed by McKee (Auburn University, unpublished data) on Lake Guntersville in 2012
(Table 1, Figure 2). Initial classification had both Local and Non-Local Club tournaments
combined. Large single events received priority when occurring concurrently with smaller
events to be certain their value was not overlooked and undocumented. Tournaments sampled
were scheduled to maximize effective effort in distributing surveys on sampling trips.
II. 3. Survey Distribution
All surveys distributed were marked with a unique identification number to assign an
angler contact to each individual survey. Surveys were distributed at the conclusion of
tournaments, prior to or directly after, “weigh-in” (Exceptions were made if there was another
method of obtaining a representative sample of competing anglers. e.g. pretournament meeting).
Anglers were contacted once they removed their boat from the water while prepping their boat
for Trailering or upon weighing and releasing their fish. Upon approaching the angler(s) the
creel clerk identified themselves and stated their purpose. With the angler’s permission a survey
was distributed to them. Each survey packet directed anglers to complete the survey and return it

12
in the postage prepaid envelope or take the survey online instead if they preferred. The creel
clerk then asked for tournament affiliation, and if possible, recorded contact information from
that angler on the ‘Tournament Angler Data Sheet’ (Appendix II) next to the corresponding
survey number. If an angler declined to take the survey, a tic mark was placed into a category
labeled NS (Not Surveyed) on the ‘Tournament Angler Data Sheet’. If the angler had already
been surveyed and refused to complete another survey a tic mark was placed in the category AS
(Already Surveyed) on the ‘Tournament Data Sheet’ (Appendix III).
Once the tournament is completed the creel clerk interviewed the tournament organizer to
collect data about the tournament on the ‘Tournament Information Sheet’ (Appendix IV).
Data collected on ‘Tournament Information Sheet’
Tournament (Club/Series name):
Weigh-in location:
Tournament Date(s):
Launch time:
Weigh-in time:
Team or Individual:
Entry Fee:
Number of boats:
Number of tournaments on Guntersville in 2013:
II. 4. Effort and Catch
Black bass tournament angling effort is a principle component to determine the overall
expenditures of tournament anglers on Lake Guntersville and provides useful information for
local governments and the ADCNR. This value was obtained using observed tournament
frequency on Lake Guntersville and expanded to estimate the total number of tournaments on the

13
reservoir for the calendar year by tournament type. Tournament angling effort and catch for an
individual tournament was determined using the following equation
𝐸(𝐶)𝑗 = ∑ 𝐸(𝐶)ℎ × 𝑤𝑗
𝑛
𝑗=1
(1)
where ℎ represents an individual in a tournament, 𝑤𝑗 represents the weighting factor for
tournament 𝑗, 𝐸(𝐶)𝑗 is total tournament angling effort in hours (or catch) for all anglers in an
individual tournament in angler hours, and 𝐸(𝐶)ℎ represents the angling effort in hours (or
catch) of each individual in a tournament. 𝑤𝑗 is a weighting factor used to extrapolate known
values to the entire tournament 𝑗 population.
For each tournament surveyed, the total number of participants was determined by
talking to a tournament organizer or participant in the event. This value along with the number
of returned surveys was used to calculate the weighting factor 𝑤𝑗 in the following equation
𝑤𝑗 =𝑃𝑇
𝑆𝑅 (2)
where 𝑆𝑅 represents the number of surveys returned and 𝑃𝑇 is the total number of participants in
the tournament. The total number of participants in each tournament was determined by talking
to the tournament organizer.
Angler effort (or catch) for each tournament type was calculated using the following
equation
𝐸(𝐶)𝑖 = ∑ 𝐸(𝐶)𝑗 × 𝑤𝑖 (3)

14
where 𝑖 represents each tournament type, 𝐸(𝐶)𝑖 represents the angling effort (or catch) of all
individual tournaments within a single tournament type, 𝐸(𝐶)𝑗 is as defined in equation 1, and
𝑤𝑖 is the weighting factor to expand the cost estimate to all tournaments within type 𝑖 where 1 =
Wildcat, 2 = Local Club, 3 = Non-Local Club, 4 = Trail or Series, 5 = Small Open, 6 = Large
Open, 7 = Semiprofessional, and 8 = Professional.
The weighting factor 𝑤𝑖 is based on the uncertainty of knowing if a tournament within a
tournament type occurred and was calculated using the following equation
𝑤𝑖 =(𝑁𝑖 + 𝑆𝑖 + 𝑈𝑖) × (𝑈𝑖 + 𝑆𝐴𝐿𝐿)
(𝑆𝑖 + 𝑈𝑖) × (𝑆𝐴𝐿𝐿) (4)
where 𝑁𝑖 is the number of tournaments of tournament type i that were known but not sampled
due to sampling limitations, 𝑆𝑖 is the number of known tournaments that were sampled of type i,
𝑈𝑖 is the number of tournaments that were unknown of tournament type i but discovered while
sampling another tournament, and 𝑆𝐴𝐿𝐿 is the total number of known tournaments that were
sampled of all tournament types.
Known tournaments that were sampled were tournaments that I knew were occurring on
Lake Guntersville and were thus present to sample. Known but not sampled tournaments were
tournaments I knew were occurring but were not sampled because of lack of manpower to cover
all tournaments occurring on the lake. Unknown tournaments that were sampled were
tournaments that I did not have knowledge of prior to sampling and were discovered while
sampling known tournaments.
The overall effort (or catch) for anglers across all tournament types was calculated using
the following equation

15
𝐸(𝐶) = ∑ 𝐸(𝐶)𝑖
8
𝐴=1
(5)
where 𝐸(𝐶) is the sum of aggregated effort (or catch) for each tournament type 𝑖 and 𝐸(𝐶)𝑖 is as
defined in equation 4.
Catch per unit effort (CPUE) is an estimate of angler success rate and was calculated
using the equation
𝐶𝑃𝑈𝐸 =𝐶
𝐸 (6)
where C is the total number of black bass caught across all tournament types and E is angler
effort in hours across all tournament types.
Catch per unit effort for each tournament type 𝑖 (𝐶𝑃𝑈𝐸𝑖) was calculated using the
equation
𝐶𝑃𝑈𝐸𝑖 = 𝐶𝑖
𝐸𝑖 (7)
where 𝐶𝑖 is total number of black bass caught in tournament type 𝑖 and 𝐸𝑖 is total angler effort for
tournament type 𝑖.
II. 5. Expenditures
The tournament survey was used to collect angler expenditure and demographic data to
calculate total expenditures of tournament anglers. The estimated total number of tournaments
by tournament type occurring on Lake Guntersville and the average angler participation in these
events was used to estimate total number of angler trips to Lake Guntersville. The formal mail

16
survey was used to estimate average expenditures per trip. Tournament anglers provided data for
several key independent travel cost variables (vehicle fuel, boat gas, lodging expense, groceries,
meals, fishing tackle, guide fees, boat launch fees, repair/maintenance fees, and tournament entry
fees).
The following equation calculates actual travel cost for a participant in a tournament
𝑇𝐶ℎ = ∑(𝑥1 + 𝑥2 + 𝑥3 + ⋯ 𝑥𝑛)
𝑛
ℎ=1
(8)
where ℎ represents an individual in a tournament, 𝑇𝐶ℎ represents the travel cost of each
individual in a tournament and 𝑥𝑛 represents the independent cost variables 𝑛 where 1=vehicle
fuel, 2=boat gas, 3=lodging expense, 4=groceries, 5=meals, 6=fishing tackle, 7=guide fees,
8=boat launch fees, 9=repair/maintenance fees, 10=tournament entry fees, and 11=license fees.
To calculate the travel cost of each tournament the following equation was used
𝑇𝐶𝑗 = ∑ 𝑇𝐶ℎ × 𝑤𝑗
𝑛
𝑗=1
(9)
where 𝑤𝑗 represents the weighting factor for tournament 𝑗 as defined in equation 2, 𝑇𝐶𝑗
represents the total travel cost for all participants in tournament 𝑗, and 𝑇𝐶ℎ is as defined in the
above equation 8.
Travel cost for each tournament type will be calculated using the following equation
𝑇𝐶𝑖 = ∑ 𝑇𝐶𝑗 × 𝑤𝑖 (10)

17
where 𝑖 represents each tournament type, 𝑇𝐶𝑖 represents the travel cost of all individual
tournaments within a single tournament type, 𝑇𝐶𝑗 is as defined in equation 4, and 𝑤𝑖 is the
weighting factor to expand the cost estimate to all tournaments within type 𝑖 as defined in
equation 4.
The overall travel cost for anglers across all tournament types was calculated using the
following equation
𝑇𝐶 = ∑ 𝑇𝐶𝑖
8
𝐴=1
(11)
where 𝑇𝐶 is the sum of aggregated travel cost for each tournament type 𝑖 and 𝑇𝐶𝑖 is as defined in
equation 6.
II. 6. Tax Revenue
Local tournament trip expenditures occurring in the cities of Scottsboro and Guntersville,
and the three counties of Jackson, Madison, and Marshall will be identified and the impact of
tournament angling on these local tax bases and how they were spent will be quantified. Non-
local expenditures are those that occurred outside the local area.
Total expenditures calculated in equation 11 were sorted by their location, city, county,
and state. The tax rates used by the Alabama Department of Revenue were then applied to these
expenditures to determine fuel, lodging, and general sales tax revenues for the local cities,
counties, and State of Alabama (Table 2). Tax revenues were not calculated for out of state
expenditures.

18
To calculate fuel tax revenues the tax rate of $3.34 per gallon of gas was divided by the
average price of a gallon of regular unleaded gasoline for the state of Alabama in 2013 (C.
Ingram, AAA Alabama, personal communication). This percentage tax rate was then multiplied
by the total fuel expenditures in each location to estimate fuel tax revenues. The distribution rates
of tax revenue within Alabama, local counties, and cities were obtained from McKee (2013).
II. 7. Travel Cost Model
The Travel Cost Model (TCM) as described by Parsons (2003) was used to describe the
relationship between annual tournament visits to Lake Guntersville and a number of independent
variables including travel cost, opportunity cost of a substitute site, tournament type, and socio-
demographic characteristics. To determine the demand for tournament angling trips, opportunity
costs must first be calculated for round trip travel time and for the option of tournament fishing
at a substitute site. The following equation is used to calculate the opportunity cost for roundtrip
travel time (𝑂𝐶𝑎):
𝑂𝐶𝑎 =𝐷𝑎
55𝑚𝑝ℎ× (
𝐻𝑎
2000)/3 (12)
where 𝐻𝑎 is annual household income for an angler, 𝑎; and 𝐷𝑎 is roundtrip distance travelled in
miles to Lake Guntersville for that angler. This equation values travel time as one-third of an
angler’s hourly pay rate which is calculated by taking annual household income and dividing it
by the standard 2,000 hour work year (40 hours per week multiplied by 50 weeks per year). To
quantify time spent travelling from home to Lake Guntersville and back home roundtrip travel
distance was divided by an average speed of 55 mph (Prado 2006; Ojumo 2009).

19
Opportunity cost of travel for a substitute site is calculated similarly to equation 12, but using the
roundtrip distance to the substitute site instead of roundtrip distance to Lake Guntersville.
I estimated travel cost for an individual angler (𝑇𝑎) by:
𝑇𝑎 = 𝑂𝐶𝑎 + 𝑋𝑎 (13)
where 𝑋 is the summation of an angler’s expenditures incurred on a tournament trip, including
vehicle operation, lodging, restaurant meals, and groceries; and 𝑂𝐶 is as defined in equation 12.
Cost of vehicle operation was calculated by multiplying the angler’s roundtrip distance
travelled in miles by $ 0.565, which was the Federal mileage reimbursement rate for vehicle
operation for business purposes in 2013 (Internal Revenue Service 2012). This is within the
American Automobile Association’s composite average range of $0.52 to $0.78 per mile in 2013
(American Automobile Association 2013).
The quantity demanded (𝑄) for all tournament fishing trips on Lake Guntersville will be
calculated using the following equation:
𝑄 = 𝛽0 + 𝛽1𝑇 + 𝛽2𝑆 + 𝛽3𝐻 + 𝛽4𝑉 + 𝜀𝑖 (14)
where 𝛽𝑛 are parameter estimates for the regression, 𝑇 is travel cost, 𝑆 is opportunity cost of
travelling to an substitute site, 𝐻 is angler income, 𝑉 is a matrix of socio-demographic variables
that can effect fishing demand, and 𝜀𝑖 is random model error (Ojumu et al. 2009). It is expected
that the demand curve would have a negative relationship between travel cost and number of
trips demanded as visit cost increases as travel distance to the reservoir increases, therefore the
number of tournaments an angler would fish on Guntersville should decrease as well.

20
I obtained individual angler household income through asking them to identify which
income bracket range they belonged. The midpoint of each income range was then calculated
and used in the TCM. To correct for the top income range being infinite (>$200,000), I added
half of the preceding bracket income range ($200,000 - $100,000 / 2 = $50,000) to the initial
value of the highest income bracket ($200,000 + $50,000 = $250,000).
I calculated Cook’s distance for variables in the dataset and removed influential entries
where Cook’s distance was greater than four over the sample size (Bollen and Jackman 1990,
SAS 2009). To account for overdispersion, truncation, and endogenous stratification I used a
count model with a negative binomial distribution to estimate the quantity of tournament trips
demanded by anglers on Lake Guntersville because the dependent variable, tournament trips, is a
non-negative integer (Parsons 2003; Martínez-Espiñeira and Amoako-Tuffour 2008). This model
weights the dependent variable, visits, by the number of days an angler spent at Lake
Guntersville to correct for endogenous stratification and truncation. An additional parameter (α)
is present in this model to account for missing heterogeneity and prevent the overdispersion
present when the variance is larger than the mean for the data, which is common when looking at
number of visits taken. Number of tournament trips taken were calculated using the negative
binomial count model:
𝜆 = exp(𝛽0 + 𝛽1𝑇 + 𝛽2𝑆 + 𝛽3𝐻 + 𝛽4𝑉 + 𝛼) (15)
where 𝜆 is the expected number of tournament trips an angler will take, 𝛽 are coefficient
estimates, 𝑇 is aggregated travel cost, 𝑆 is opportunity cost of an substitute site, 𝐻 is an angler’s
household income, 𝑉 is a matrix of socio-demographic variables, and α is a parameter that
determines the degree of dispersion in the predictions (Parsons 2003; Martínez-Espiñeira and

21
Amoako-Tuffour 2008). To accurately estimate consumer surplus using the TCM the variables
travel cost, income, and substitute site opportunity cost must be included in the model (Kling
1989; Parsons 2003). Other variables selected to be used in the model were found to be
statistically significant at P ≤ 0.05 and collinear variables were removed (Ward and Beal 2000).
II. 8. Consumer Surplus
Consumer surplus gives the value above and beyond the actual cost of a tournament
angling trip to Lake Guntersville that anglers are willing to pay to use the resource (Figure 3).
Consumer surplus per tournament trip on Lake Guntersville was estimated using:
𝐶𝑆 = (�̂�/−�̂�1)
�̂�=
1
−�̂�1
(16)
where 𝐶𝑆 is the consumer surplus for a single tournament trip, �̂� is the estimated number of
tournament trips, and �̂�1 is the estimated travel cost coefficient from the TCM (from equation
15) (Parsons 2003). To estimate aggregate consumer surplus for the entire fishery the consumer
surplus was multiplied by the estimated total number of tournament trips on Lake Guntersville.
The second-order Taylor series approximation was used to calculate the standard error for the
consumer surplus per tournament trip and was estimated using:
𝑉𝑎𝑟 (1
−�̂�1
) = (𝛶2
−�̂�14
) + 2 (𝛶4
−�̂�16
) (17)
where 𝛶 is the standard error of �̂�1 (Englin and Shonkwiler 1995).

22
II. 9. Local Impact of Tournament Angling
Results of this analysis will be useful to local cities and counties as it can indicate the
demographic groups they should target to increase tournament angling expenditures and taxes.
This will be conducted by sorting total expenditures and taxes by location, tournament type, and
other significant socio-demographic variables that might influence angler expenditures. From
this analysis local government agencies and businesses can make more well-informed decisions
on how to efficiently target angler groups to fish tournaments on Lake Guntersville.

23
III. Results
III. 1. Descriptive Survey Statistics
On site sampling of Lake Guntersville resulted in 77 different tournaments sampled and
1672 total surveys distributed to tournament black bass anglers from February 2013 to January
2014 (Figure 4). The most frequent tournament type sampled was Non-Local Club (23%)
followed by Trail or Series (21%), Local Club (17%), Small Open (16%), Wildcat (9%), Large
Open (6%), Semiprofessional (6%), and Professional (1%) (Table 3). Anglers returned 439
surveys which resulted in a response rate of 26%. On average 21.7 anglers were contacted and
5.7 surveys were returned by anglers from each tournament. Of those surveys returned 84% of
the surveys were returned by mail and 16% of them were completed online. Of the 439 returned
surveys only 28 anglers (6%) had been sampled at a previous tournament.
On average 58.7 (SE, 16.9) anglers fished in tournaments on Lake Guntersville from
February 2013 to January 2014. This ranged from an average of 7 (SE, 2.3) anglers in Wildcat
tournaments to 466.8 (SE, 206.7) in Large Open events (Table 3). The typical tournament angler
on Lake Guntersville was a Caucasian male, 49 years old with 18 years of tournament fishing
experience, and a mean annual household income of $106 thousand. On average, tournament
anglers travelled 262 km one way, practiced 2 days for each tournament, and fished 6.7
tournaments annually on Lake Guntersville. Tournament anglers were generally satisfied with
their angling experience averaging 3.2 out of 5 and catching an average of 8.5 bass during a
tournament day. Thirty-seven per cent of tournament anglers stayed overnight while at the lake
and 48% were from out of state. Forty per cent of anglers used a castable umbrella rig (Alabama

24
Rig) in the tournament about which they were interviewed, and 45% of tournament anglers
belonged to a bass club.
Professional anglers travelled the farthest to fish tournaments on Lake Guntersville
(621km one way) and constituted the greatest proportion of out of state anglers 80%.
Semiprofessional, Large Open, and NonLocal Club tournaments all consisted of over 43% out of
state anglers. Professional, Semiprofessional, Large Open, and Small Open tournament anglers
stayed over 2.45 at Guntersville per trip and practiced on average more than 1.5 days per
tournament (Table 4).
III. 2. Effort and Catch
Total overall tournament angling effort on Lake Guntersville was estimated to be 89,684
angler hours. Assuming one practice day is equivalent to the number of hours in a tournament
day, overall effort for both practicing and tournament fishing was over 266 thousand angler
hours. I estimated 10,035 anglers fished in 272 tournaments held on Lake Guntersville from
February 2013 to January 2014. The most angling effort was observed at Large Open (36%) or
Semiprofessional events (24%) followed by Trail or Series (9%), Small Open (8%), Wildcat
(7%), Professional (6%), Non-Local Club (5%), and Local Club (4%) tournaments (Table 5).
Overall catch for tournament anglers were 69,415 black bass resulting in an average
Catch per unit effort (CPUE) of 0.77 across all tournament types. A total of 18,872 black bass
were caught and then held in the live well before being released when culling. This resulted in an
average of 0.21 released by culling per unit effort (RPUE). Tournament anglers weighed in
22,931 black bass on Guntersville for an overall weighed in per unit effort (WPUE) of 0.26
(Table 5).

25
Wildcat tournament anglers fished a total of 6,206 hours and had a mean trip length of
5.84 hours per angler per event and mean one way travel distance of 24 km. Wildcat tournament
anglers caught a total of 12,326 black bass for an average CPUE of 1.99, the highest of all
tournament types. Average RPUE and WPUE were calculated to be 0.49 and 0.42 respectively
(Table 5).
Local Club tournament anglers fished a total of 3,849 hours and had a mean trip length of
9.5 hours per angler per event and mean one way travel distance of 93 km. These anglers caught
a total of 4,366 black bass for a CPUE of 1.13, a RPUE of 0.31, and WPUE of 0.36 (Table 5).
Non-Local Club tournament anglers fished a total of 4,463 hours and had a mean trip
length of 11.05 hours per angler per event and mean one way travel distance of 321 km. Non-
Local Club tournament anglers caught a total of 3,707 black bass and had a CPUE of 0.83,
RPUE of 0.18, and WPUE of 0.32 (Table 5).
Trail and Series tournament anglers fished a total of 7,922 hours and had an average trip
length of 8.2 hours per angler per event and mean one way travel distance of 133 km. These
anglers caught a total of 8,200 black bass and had a CPUE of 1.04, RPUE of 0.38, and WPUE of
0.42 (Table 5).
Small Open tournament anglers fished a total of 7,434 hours and had an average trip
length of 8.1 hours per angler per event and mean one way travel distance of 204 km. Small
Open anglers caught a total of 11,054 black bass and had a CPUE of 1.49, RPUE of 0.41, and the
highest WPUE of all tournament types at 0.48 (Table 5).
Large Open tournament anglers fished a total of 32,258 hours and had an average trip
length of 13.4 hours per angler per event and mean one way travel distance of 286 km. These

26
anglers caught a total of 14,034 black bass and had a CPUE of 1.49 and RPUE of 0.12. Large
Open tournament anglers had the lowest WPUE of all anglers at 0.10 (Table 5).
Semiprofessional anglers fished a total of 21,920 hours from February 2013 to January
2014 and had an average trip length of 10.5 hours per angler per event and mean one way travel
distance of 160 km. Semiprofessional anglers caught a total of 13,810 black bass for a CPUE of
0.63, RPUE of 0.15, and WPUE of 0.28 (Table 5).
The only Professional tournament on Guntersville from February 2013 to January 2014
had a total effort of 5,632 hours and the event length was 16 hours and anglers had a mean one
way travel distance of 621 km. Professional anglers caught a total of 1,918 fish in the event,
releasing 518 bass when culling and weighing in a total of 1,138 bass. CPUE was calculated to
be the lowest of all tournament types at 0.34, with the lowest RPUE of 0.09 of all tournament
anglers, and WPUE of 0.20 (Table 5).
III. 3. Expenditures
Overall more than 10 thousand anglers competed in Black Bass tournaments on Lake
Guntersville and generated $4,570,000 in direct expenditures during February 2013 to January
2014. The greatest expense for anglers fishing tournaments at Lake Guntersville was vehicle fuel
and boat gas (33%), followed by tournament entry fees (27%), lodging (16%), tackle (7%),
meals (6%), and grocery expenditures (6%). Repair and maintenance expenditures, license fees,
launch fees, and guide fees comprised the remaining 6% of expenditures (Figure 5, Table 6).
Total economic impact was estimated to be $6.7 million after adding a multiplier of 1.47 to
direct expenditures (Myles and Swaim, 2010).

27
Tournament anglers fishing in Large Open events were responsible for $1.7 million
(38%) of total tournament expenditures more than any other tournament type. Semi-Professional
tournaments and the single Professional tournament had the second and third highest
expenditures of $1.1 million (24%) and $550 thousand (12%) respectively. Trails and series
(9%), Small Opens (7%), Non-Local Clubs (5%), Wildcats (3%), and Local Clubs (2%) made up
the remaining $1.1 million in expenditures (Table 6). Professional anglers incurred the highest
per trip expenditures of $1,568, followed by Non-Local Club ($502), Semi-professional ($486),
Large Open ($463), Trail ($421), Small Open ($420), Local Club ($304), and Wildcat ($103)
anglers.
Anglers from 20 different states fished tournaments on Lake Guntersville from February
2013 to January 2014. These out-of-state anglers contributed the most to total expenditures
spending $2.6 million (56%). Outside of Alabama the states of Tennessee and Georgia
contributed most to total expenditures of $1.0 million (22%) and $480 thousand (11%)
respectively. Non-local Alabama anglers spent $1.5 million (33%) and Local anglers, those
living within 30 miles of lake Guntersville, were responsible for $0.5 million (10%) of the total
expenditures (Table 7).
III. 4. Tax Revenue
Tournament Black Bass angling on Lake Guntersville generated $222 thousand in
revenue for the State of Alabama and local governments (Table 5). The State of Alabama
received 64 per cent of this revenue a total of $141 thousand (Table 5). Fuel sales made up
majority of this revenue (47%), followed by lodging (29%), and general sales (23%) (Table 5).
State tax revenues were distributed as follows: 34% to roads and bridges; 24% to state health

28
services, education, and human welfare; 19% to the general fund; 6% to tourism; and 15% was
returned to the counties for road maintenance, education, and tourism (Table 8).
For the local cities of Guntersville and Scottsboro, and counties of Jackson, Marshall, and
Madison, tournament black bass angling generated $81 thousand in tax revenue. The city of
Guntersville collected $33,809 in revenue of which 74% went to the general fund, which also
provides road maintenance, 17% to tourism, and 9% to education (Tables 6 and 7). The city of
Scottsboro generated $21,300 in tax revenue which distributed 87% to the general fund, 10% to
education, and 3% to road maintenance (Tables 9 and 10).
Tournament angling expenditures generated $18,561 in tax revenue for Jackson County
of which 52% went to tourism, 33% to education, and 25% went to maintenance of roads and
bridges (Table 8 and 10). Marshall County received $6,556 in tax revenue from tournament
anglers (Table 8). Sixty per cent of these funds went to tourism, road maintenance received 25%,
and 14% of these funds went toward education (Table 9). Tournament angling revenues for
Madison County were $622 of which 60% went to road maintenance, 37% went to education,
and 4% went to tourism (Tables 9 and 10).
III. 5. Travel Cost Model and Consumer Surplus
Prior to estimating the TCM, outliers were removed using Cook’s Distance procedure,
resulting in the elimination of less than 5% of data set observations. The independent variables
travel cost, log of household income, years of tournament experience, and number of practice
days were significant in explaining the dependent variable number of tournament visitation to
Lake Guntersville (Table 10). The independent variable opportunity cost of a substitute site was
found to be non-significant, however, must be included in the model do to requirements of the

29
TCM to estimate consumer surplus (Kling 1989; Parsons 2003). The estimated negative binomial
count model of demand for tournament visits for all tournament anglers on Lake Guntersville
was:
𝜆 = exp (0.006 − 0.0015 𝑇 + 0.0005 𝑆 + 0.1584 𝐻 + 0.0129 𝐸 + 0.0628 𝑃 + 1.0875) (18)
where 𝜆 was the number of expected black bass tournament angling visits, 𝑇 was the travel cost,
𝑆 was the opportunity cost of a substitute site, 𝐻 was the log of household income, 𝐸 was years
of tournament fishing experience, and 𝑃 was number of days spent practicing before the
tournament (Table 10).
Travel Cost was found to have a negative relationship with the dependent variable visits
which indicates that an increase in travel cost will cause a decrease in the number of tournament
visits an angler will make to Lake Guntersville. The independent variables log of household
income, number of days spent practicing before the tournament, and years of tournament fishing
experience had a positive relationship with the dependent variable visits, therefore, an increase in
any of these variables will result in more tournament visits. The variable opportunity cost of
substitute site was found non-significant in the model but was positively correlated with visits,
which I would expect as distance to substitute sites and increasing travel costs should result in
more visits to Lake Guntersville.
Consumer surplus for all tournament anglers of all tournament types was $667 per visit
(SE, $62). Total willingness to pay (WTP) for a tournament angler on Lake Guntersville was
$1,122 per visit which was found by summing the consumer surplus and the mean travel cost
($455). Thus, consumer surplus represented 59% of the total WTP for a tournament angler.
Consumer surplus per visit was converted to consumer surplus per day by dividing by average
30
length of trip for an estimate of $225. Aggregate consumer surplus and willingness to pay for
the tournament fishery on Lake Guntersville was estimated to be $6.7 million and $11.3 million,
respectively.
Consumer surplus for out-of-state tournament anglers was $909 per visit (SE, $170) and
$292 per day. Total WTP for out-of-state tournament anglers was $1,689 per visit (Table 11).
Consumer surplus for in-state tournament anglers was $588 (SE, $107) and $207 per day. Total
WTP for in-state tournament anglers on Lake Guntersville was $881 (Table 12).
IV. Discussion
IV. 1. Sampling Techniques
Typically black bass tournaments are held on weekends, have specific start and end
times, require the use of watercraft, and each tournament is conducted at a single location. Due
to these characteristics it was decided an access point survey was best suited for the highest
response per sampling effort. Typically access point surveys are conducted using random
nonuniform probabilities of sampling access points, however, Lake Guntersville is 121 km in
length, has over thirty boat ramps that could hold tournaments, and prior information as to
tournament use of individual ramps was unavailable (Malvestuto 1996). Therefore, I used prior
roving creel data from a previous angler survey on Lake Guntersville to assign nonuniform
probabilities to different tournament types and used all resources available (bait and tackle shops,
information, flyers, internet websites, and direct communication) to identify tournaments
occurring on Lake Guntersville from February 2013 to January 2014 (C. E. McKee, Auburn
University, unpublished data).

31
Large single tournaments are known to have a substantial economic impact when
compared to numerous small tournaments which I saw in this study as well (Schramm et al.
1991a; Destination Exploration 2012). The Professional Everstart tournament and Sealy Big
Bass tournament were each responsible for 12% of the overall tournament angling expenditures
on Lake Guntersville. This justifies our reasoning that large single events should have priority
when sampling and that random nonuniform probability sampling should be used for all
tournaments but these events.
I found that most tournaments originated from several of the larger ramps on Lake
Guntersville (Goosepond, Waterfront grocery, Browns creek, and Lake Guntersville State Park).
When sampling these ramps it was common to discover previously unknown tournaments and I
documented up to five separate tournaments of four different tournament types going out of a
single ramp in a single day. A permitting process for black bass tournaments in Alabama would
help fisheries managers better manage and estimate the effect of tournaments occurring on the
fishery.
Tournament type influenced how each tournament was sampled on Lake Guntersville.
For Professional and Semiprofessional events they were highly publicized and there were
multiple officials working for a for profit organization which helped inform anglers that a survey
was taking place. At these events surveys were distributed after the angler weighed their fish and
crossed the weigh-in stage or prior to the event at the pre-tournament meeting. Large Opens were
conducted similarly to the Professional and Semiprofessional events, however, in the instance of
big bass style tournaments (where anglers can launch from anywhere on the lake and but must
weigh in at a specific location) I had to attend the tournament registration to distribute surveys.
Small Open, Trail, NonLocal Club, Local Club, and Wildcat tournaments were surveyed

32
similarly by distributing the surveys as anglers were preparing their boats to Trailer. Therefore,
to adequately sample all of the different types of tournaments on Lake Guntersville I had to adapt
different strategies in order to maximize the number of anglers surveyed.
In our access point study I contacted on average 21.7 anglers per tournament and
received 5.7 returned interviews, compared to McKee (2013) who averaged 4.8 interviews per
roving creel. Of our returned surveys only 6% had been interviewed previously, however, I feel
this low number is not indicative of the anglers that were contacted multiple times but rather
those willing to complete the survey again.
IV. 2. Effort and Catch
I estimated that 272 tournaments occurred on Lake Guntersville from February 2013 to
January 2014, which is 79% more than the 58 tournaments there was reported to the Alabama
Bass Angler Information Team (BAIT) in 2013 (Abernathy 2013). Overall I found that 10,035
anglers participated in tournaments on Guntersville at this time which is 78% more than the
2,133 anglers which were reported to BAIT (Abernathy 2013). This discrepancy in both number
of tournaments and number of anglers per tournament is most likely a result of lack of
tournament officials participating in the program.
When compared to a tournament study on Sam Rayburn in 2008 I found that Lake
Guntersville has more overall tournaments (272) than Sam Rayburn (101), but Sam Rayburn had
many more total participants (19,784) than Guntersville (10,035) (Driscoll et al. 2010). This
discrepancy can be explained by the different tournament types which are attracted to each
reservoir. Sam Rayburn attracts many Large Open events which have over 1,000 participants in
each, while Guntersville attracts many more small Wildcat tournaments which average less than

33
ten anglers per tournament (Driscoll et al. 2010). Overall tournament effort estimates on Lake
Guntersville (89,000 angler hours; 3.2 angler hours per hectare) are comparable to those of Sam
Rayburn, Texas (135,145 angler hours; 2.9 angler hours per hectare) in 2012-2013, but neither
compare to the effort of Lake Fork (253,346 angler hours; 22.6 angler hours per hectare)
(Driscoll and Ashe 2013; Storey and Bennett 2014). Number of black bass weighed and released
on Lake Guntersville (22,931) was greater than Sam Rayburn (12,644) but less than Lake Fork
(32,064) (Driscoll and Ashe 2013; Storey and Bennett 2014). These levels of effort and catch at
Lake Guntersville demonstrate that it is comparable to other lakes which are known for high
tournament effort.
Effort and catch varied greatly between different tournament types at Lake Guntersville.
Large Open tournaments and Semiprofessional tournaments had the highest effort of all types.
This is expected due to the number of anglers in each of these events. The single Professional
event on Lake Guntersville had the lowest CPUE of all tournament types, however, the weather
was poor that weekend which could have resulted in reduced catch rates. Tournament types that
attracted mostly local anglers (Wildcats, Local Club, Small Open, and Trails) had the highest
CPUE, all of which were over one fish per hour of effort. When managing a tournament fishery
the number of fish caught and then released while culling should be considered because these
fish experience more stress than typical catch and release. I estimated that 18,872 bass were
caught and then released while culling by tournament anglers. The use of a castable umbrella rig
(Alabama Rig) was common on tournaments at Lake Guntersville with 40% of anglers reporting
throwing one during a tournament.
IV. 3. Expenditures
34
Total expenditures by tournament black bass anglers on Lake Guntersville were $4.6
million from February 2013 to January 2014. This estimate of tournament angling expenditures
is 34% of the $13.4 million value of the recreational fishery on Lake Guntersville in 2012 and
30% greater than the estimated value of tournament fishery on Guntersville found by McKee
(2013). I found that the average tournament trip on Lake Guntersville was $455 which is 56%
greater than that for general black bass anglers on Lake Guntersville in 2012 (McKee 2013).
Forty-eight per cent of tournament anglers were from out of state which is consistent with
findings of other studies (Schramm et al. 1991a). Overall out of state anglers made up 56% of
tournament expenditures on Lake Guntersville which totaled $2.6 million. Local tournament
anglers spent $708 thousand and nonlocal Alabama tournament anglers spent $1.3 million. From
these findings it is evident that Lake Guntersville is a popular fishery for out of state tournament
anglers, which also incur higher license fees and higher travel costs than local and many nonlocal
anglers.
Driscoll et al. (2010) found that on Sam Rayburn Reservoir, Texas from November 2007
to October 2008 that tournament angler expenditures were $18.4 million which was 75% more
than what I found on Lake Guntersville, however, tournament participation was also 60% greater
on Sam Rayburn. In both studies cost of vehicle fuel, boat fuel, and tournament entry fees made
up majority of the expenses incurred by tournament anglers (Driscoll et al. 2010).
Average tournament trip costs varied greatly by tournament type at Lake Guntersville
ranging from $103 for Wildcat to $1,568 for Professional tournaments. The difference in trip
costs between the tournament types can be attributed to the difference between these
tournaments and the anglers that participate in them. Higher trip costs were seen in tournaments

35
that attracted more non local anglers or higher entry fees such as Professional, Semi Professional,
Large Open, and Non-Local Club.
IV. 4. Tax Revenue
Overall tax revenue generated by tournament black bass angling at Lake Guntersville was
$222,268, of which $141 thousand went to the state of Alabama (64%) and $80 thousand (36%)
was dispersed to local city and county governments.
Lodging expenditures generated the greatest tax revenues overall ($88,142). Marshall and
Jackson Counties are within the Alabama Mountain Lakes Region which imposes an additional
1% lodging tax which goes to promote tourism within the State of Alabama. Jackson County
imposes an additional $1 per night lodging tax which goes to promote tourism within the county.
The Cities of Guntersville and Scottsboro received majority of the lodging expenditures at Lake
Guntersville and received $20,995 and $11,894 thousand in revenue respectively. The state of
Alabama generated $41,502 in tax revenue from tournament lodging expenditures at Lake
Guntersville.
Fuel expenditures generated the second largest tax revenues of $72,958 from $1.2 million
in expenditures. Fuel tax is based on cents per gallon so the average price per gallon of gasoline
in Alabama in 2013 of $3.34 per gallon was used to calculate tax rates for each municipality.
Majority of the fuel tax revenue went directly to the State of Alabama ($141,436) of which
approximately 6.6% is then redistributed to local county and city governments based on
population (55%) and the remaining revenue is distributed equally among the state’s 67 counties
(McKee 2013). Fuel expenditures related to tournament angling at Lake Guntersville resulted in
$658 being distributed to local governments. ADCNR receives $0.0015 per gallon of the $0.16

36
per gallon state fuel tax resulting in $626 of revenue from tournament bass angling on Lake
Guntersville (McKee 2013).
General sales generated the least revenue from tournament fishing expenditures. These
expenditures included groceries, restaurant meals, fishing tackle, launch fees, and repair or
maintenance purchases. Overall $820,694 in expenditures resulted in $61,168 in tax revenue for
the State and local governments. Most of these local general sales revenues went toward
education and general funds.
Currently tournament entry fees are not taxed on a state or local level, therefore one of
the largest expense categories for tournament anglers does not yield any tax revenue.
IV. 5. Consumer Surplus
To accurately estimate the value of a recreational fishery it is necessary to know how
much an angler would be willing to pay exceeding their actual expenditures on a visit. I
estimated this value using a TCM in which travel cost, opportunity cost of substitute site, and
angler income are necessary variables to estimate consumer surplus (Kling 1989l; Pearson 2003).
Other predicting variables were tested for significance and collinearity with the variables years
of tournament experience and number of days spent practicing remaining in the final model
(days spent practicing was removed from the TCM for in-state anglers because it was
insignificant). Travel cost was negatively related to number of tournament visits and angler
would make which I expected as number of visits should decrease as cost of travel increases. The
variables log of household income, years of tournament experience, and number of days spent
practicing were positively associated with visits in all models meaning an increase in these
variables would result in an increase in tournament visits to Lake Guntersville. Opportunity cost

37
of substitute site was positively correlated with visits in the global and out-of-state angler TCM
but was negatively correlated with visits in the in-state angler TCM, but was found insignificant
in all models. This negative relationship for substitute site for in-state anglers could be a result of
substitute sites being a greater distance away than Lake Guntersville (Tables 10-12).
Mean consumer surplus per tournament visit of $667 and $225 per day were considerably
higher than most studies which used a negative binomial model to estimate consumer surplus.
Lothrop (2012) found that mean consumer surplus for a striped bass fishery on Lewis Smith
Lake, Alabama was $77 per visit. Prado (2006) found mean consumer surplus for trout anglers in
the Lower Illinois River, Oklahoma to be $112 per angler day. Studies on The Snake River
Idaho, and Yellowstone National Park had higher consumer surplus values of $159 and $172
respectively, but were still not representative of our findings (Nowell and Kerkvliet 2000;
Kirkvliet et al. 2002).
Bilgic and Florkowski (2007) calculated the consumer surplus for the average bass angler
in the southeastern United States to be $161 per trip from the National Survey of Fishing,
Hunting, and Wildlife-Associated Recreation. Lake Guntersville is one of the most prestigious
black bass fisheries in the United States and I would expect anglers to be willing to pay more to
utilize this fishery (Hall et al. 2012). Tournament anglers are also known to be considerably
more invested in a fishery than general anglers and non-tournament black bass anglers which
would further increase their consumer surplus (Schramm et al 1991a). Therefore, our estimate of
$667 per visit and $225 per day are similar to another premium tournament bass fishery, Sam
Rayburn Reservoir ($292 per trip), and bass anglers from Lake Guntersville ($240 per day)
(Driscoll et al. 2010; McKee 2013).
38
Overall WTP for tournament black bass anglers was $1122 per visit in which consumer
surplus represents 59% of the total WTP for a tournament angler. This value for percent of total
WTP is similar with studies by Lothrop (2012) finding 57% and McKee (2013) finding
consumer surplus to be 70% of total WTP.
Out-of-state anglers’ consumer surplus was $909 per visit and (SE, $170) per day, which
results in a WTP of $1689 (consumer surplus represents 53% of WTP). As I would expect this is
higher than the average consumer surplus for a tournament angler on Lake Guntersville, because
there higher travel costs as an angler’s distance from the lake increases. In-state anglers have a
lower consumer surplus of $588 per visit (SE, $107) and $207 per day, which results in a WTP
of $881 (consumer surplus represents 67% of WTP). This is expected because of lower cost of
travel and higher probability of making single day tournament trips to Lake Guntersville.
From these models it is evident that tournament anglers on Guntersville have a
substantial investment in this fishery and are willing to pay much more than your average bass
angler to participate in tournaments at the lake.
IV. 6. Local Impact of Tournament Angling
It is known that tournament anglers make substantial expenditures in local communities
where tournament events are held (Schramm 1991a). For this reason I analyzed the different
tournament types and their economic contribution to the two cities present on Lake Guntersville,
Guntersville and Scottsboro. I found that in both cities that Large Open tournaments had the
greatest economic impact ($270 thousand in Guntersville; $483 thousand in Scottsboro) and
contribution to the local tax base ($9,809 in Guntersville; $13,919 in Scottsboro) despite only
seven of these events occurring from February 2013 to January 2014. Large Open tournaments in

39
Scottsboro made up 65% of total expenditures and 67% of total tax revenues, while only
accounting for 24% of expenditures and 22% of tax revenues in Guntersville. Semiprofessional
tournaments were the second highest contributor to expenditures ($232 thousand in Guntersville;
$120 thousand in Scottsboro) and tax revenues ($7,222 in Guntersville; $3,222 in Scottsboro) in
both cities. Both Large Open and Semiprofessional tournaments attract a large proportion of out
of state anglers (54% Large Open; 43% Semiprofessional) and have anglers that tend to stay
more than two nights for each event.
The City of Guntersville received a large proportion of its expenditures (14%) and tax
revenues (15%) from the single Professional tournament that was held on the lake from February
2013 to January 2014. This event was held at the Lake Guntersville State Park which is closer in
proximity to the City of Guntersville than the City of Scottsboro. Therefore, it was not
unexpected that this event would be a relatively low proportion of expenditures (2%) and tax
revenues (2%) for Scottsboro.
Our observations indicate that the greatest economic impact to the local communities
surrounding Lake Guntersville are from single large events with over one hundred participants.
This includes Professional, Semiprofessional, and Large Open tournaments where anglers
typically stay over two nights, and have a large proportion of out of state anglers. These large
events also have an indirect effect by publicizing the lake and attracting other tournaments, as
well as, recreational anglers to the fishery (McKee 2013).
IV. 7. Conclusions and Management Implications
Tournament black bass angling is an essential aspect of the recreational black bass
fishery on the Lake Guntersville. Tournament anglers are known to be more specialized than

40
general bass angler and incur much higher expenditures which I have documented in this study
(Schramm 1991a). These anglers not only fish tournaments on Lake Guntersville but also fish 18
days annually on the lake when not affiliated with a tournament. On average a tournament angler
fished 6.7 tournaments on Lake Guntersville annually and were willing to invest 2 practice days
of angling for each tournament fished.
From observing anglers at the many different tournaments it was evident that competition
was only a small part of the reason for fishing tournaments. For many small bass clubs coming to
Guntersville the tournaments was a social activity where anglers would stay multiple days and
the event would resemble a group fishing trip with the tournament being friendly competition.
Some of the clubs visiting the lake would have custom jerseys made for their club to distinguish
themselves from others on the water. This was the opposite for large semi-professional and
Professional tournaments where competition seemed to be the primary reason for attending the
events.
Large Open tournaments drew high participation from anglers through the use of large
prizes and encouraging amateur participation. As stated by McKee (2013) Large Open
tournaments could be used to increase angler effort during non-peak seasons. I found that the
Rat-L-Trap open tournament held in February 2013 drew 186 anglers to Lake Guntersville when
lake and fishing conditions were less than preferred by most anglers. These single events draw a
large economic impact and can be used to stimulate local businesses that rely on recreational
fishing during times of low angler effort.
I found that the majority of tournaments originated from four major boat ramps,
Goosepond, Waterfront grocery, Browns creek, and Lake Guntersville State Park. One sampling

41
day I encountered five tournaments using the same boat ramp. Most tournaments tend to start at
the same time (safe fishing light) and end in early afternoon, which could cause angler conflicts
if multiple tournaments are using the same area at the same time. To determine what tournament
events were occurring on Lake Guntersville resulted in the use of bait and tackle shops, posted
flyers, internet websites, and direct communication with anglers. Therefore, a permitting process
for black bass tournaments could help reduce angler conflict and help lake managers better
quantify and understand the effect of tournaments. Permitting for black bass tournaments are
already in place in many states including North Carolina, California, Illinois, Wisconsin, and
Iowa. Once identified that a tournament is occurring it could be posted to a public forum which
could directly increase angler participation at Lake Guntersville.
The greatest local economic impact from tournament black bass angling on Lake
Guntersville was seen in the Cities of Guntersville and Scottsboro. Both of these cities are
located nearby many access points along the lake and offer anglers many lodging opportunities
for multiple day trips. Lodging tax revenue was the greatest contributor to overall tax revenue
and large single event tournaments (Large Open, Professional, Semiprofessional) in which
anglers travelled from out of state and stayed multiple nights attributed most overall to
expenditures in each of the two cities. Therefore, Chambers of Commerce and tourism bureaus in
Guntersville and Scottsboro should focus on attracting large single event tournaments to the area.
These events create the greatest local direct economic impact of all tournament types and offer a
way to showcase the fishery which will indirectly lead to more angling effort and tournaments on
Lake Guntersville.

42
V. Literature Cited
Abernathy, D. L. 2013. Bass angler information team Annual Report. Alabama Department of
Conservation and Natural Resources, Federal Aid in Sport Fish Restoration, Project F-38,
Annual Report, Montgomery.
American Automobile Association. 2013. Your Driving Costs. American Automobile
Association. Available: https://newsroom.aaa.com/wp-
content/uploads/2013/04/YourDrivingCosts2013.pdf (February 2015).
Bilgic, A., and W. J. Florkowski. 2007. Application of a hurdle negative binomial count data
model to demand for bass fishing in the southeastern United States. Journal of Environmental
Management 83(4):478-490.
Bollen, K. A., and R. W. Jackman. 1990. Regression diagnostics: An expository treatment of
outliers and influential cases. Pages 257-291 in J. Fox and J. S. Long, editors. Modern Methods
of Data Analysis. Sage, Newbury Park, California.
Carlander, K. D., C. J. Dicostanzo, and J. J. Jessen. 1958. Sampling problems in creel census.
The Progressive Fish-Culturist 20(2):73-81.
Chen, R. J., K. M. Hunt, and R. B. Ditton. 2003. Estimating the economic impacts of a trophy
largemouth bass fishery: issues and applications. North American Journal of Fisheries
Management. 23(3):835-844.
Destination Exploration. 2012. 2012 Bassmaster Classic economic impact research.
Ditton, R. B., S. M. Holland, and D. K. Anderson. 2002. Recreational fishing as tourism.
Fisheries 27(3):17-24.
Driscoll, T., J. Leitz, and R. Myers. 2010. Annual economic value of tournament and non-
tournament angling at Sam Rayburn Reservoir. Texas Parks and Wildlife Department Inland
Fisheries Division, Management Data Series No. 256 (2010), Austin, Texas.
Driscoll, T., and D. Ashe. 2013. Statewide freshwater fisheries and management program 2012
survey report Sam Rayburn Reservoir. Federal Aid in Sport Fish Restoration Act Texas Federal
Aid Project F-221-M-3.
Duttweiller, M. W. 1985. Status of competitive fishing in the United States: trends and state
fisheries policies. Fisheries 10(5):5-7.
Englin, J. and S. Shonkwiler. 1995. Estimating total welfare using count data models: an
application to long-run recreation demand under conditions of endogenous stratification and
truncation. The Review of Economics and Statistics 77(1):104-112.

43
Hall, J., D. H. Jones, and K. Bitz. 2012. Bassmaster 100 best bass lakes. Bassmaster (May):68
Internal Revenue Service. 2012. Standard Mileage Rates for 2013. Internal Revenue Service.
Available: http://www.irs.gov/uac/Newsroom/2013-Standard-Mileage-Rates-Up-1-Cent-per-
Mile-for-Business,-Medical-and-Moving (February 2015).
Kerkvliet, J., C. Nowell, and S. Lowe. 2002. The economic value of the greater Yellowstone
blue-ribbon fishery. North American Journal of Fisheries Management 22:418-424
Kerr, S. J. and K. K. Kamke. 2003. Competitive Fishing in Freshwaters of North America.
Fisheries 28(3): 26-31.
Kling, C. L. 1989. A note on the welfare effects of omitting substitute prices and quantities from
travel cost models. Land Economics 65(3):290-296.
Lothrop R. L. 2012. Economic impact of striped bass angler visitation at Lewis Smith Lake,
Alabama. Master’s Thesis. Auburn University, Auburn, Alabama.
Malvestuto, S. P. 1996. Sampling the recreational creel. Pages 591-623 in B. R. Murphy and D.
W. Willis, editors. Fisheries techniques, 2nd edition. American Fisheries Society, Bethesda,
Maryland.
Martínez-Espiñeira, R. and J. Amoako-Tuffour. 2008. Recreation demand analysis under
truncation, overdispersion, and endogenous stratification: An application to Gros Morne National
Park. Journal of Environmental Management 88(4): 1320-1332.
McKee, C. E. 2013. Economic impact of recreational angler visitation to Lake Guntersville,
Alabama. Master’s Thesis. Auburn University, Auburn, Alabama.
Myles A. E. and J. Swaim. 2010. Economic impact of collegiate bass tournaments: experiences
from Auburn University. 2010 Annual Meeting, Southern Agricultural Economics Association.
Nowell, C., and J. Kerkvliet. 2000. The economic value of the Henry’s Fork Fishery.
Intermountain Journal of Science 6:285-292.
Ojumu, O., D. Hite, and D. Fields. 2009. Estimating demand for recreational fishing in Alabama
using travel cost model. 2009 Annual Meeting, Southern Agricultural Economics Association.
Palm Jr., R. C., and S. P. Malvestuto. 1983. Relationships between economic benefit and sport-
fishing effort on West Point Reservoir, Alabama- Georgia. Transactions of the American
Fisheries Society 112(1):71-78.
Parsons, George R. 2003. The travel cost model. Pages 269-329 in P.A. Champ, K. J. Boyle, and
T. C. Brown. A primer on nonmarket valuation. Kluwer Academic Publishers, Norwell,
Massachusetts.

44
Pollock, K. H., C. M Jones, and T. L. Brown. 1994. Angler survey methods and their
applications in fishery management. American Fisheries Society, Special Publication 25,
Bethesda, Maryland.
Prado, B. E. 2006. Economic valuation of the lower Illinois River trout fishery in Oklahoma
under current and hypothetical management plans. Doctoral dissertation. Oklahoma State
University, Stillwater.
Robson, D., and C. M. Jones. 1989. The theoretical basis of an access site angler survey design.
Biometrics 45(1):83-98.
SAS Institute Inc. 2009. SAS system for linear models. Release 9.2. Cary, North Carolina.
Schramm, H. L., M. L. Armstrong, A. J. Fedler, N. A. Funicelli, D. M. Green, J. L. Hahn, D. P.
Lee, R. E. Manns Jr., S. P. Quinn, and S. J. Waters. 1991a. Sociological, economic, and
biological aspects of competitive fishing. Fisheries 16(3):13-21.
Schramm, H. L., M. L. Armstrong, N. A. Funicelli, D. M. Green, D. P. Lee, R. E. Manns Jr.,B.
D. Taubert, and S. J. Waters. 1991b. The Status of competitive sport fishing in North America.
Fisheries 16(3): 4-12.
Schramm, H. L. and K. M. Hunt. 2007. Issues, benefits, and problems associated with fishing
tournaments in inland waters of the United States: a survey of fishery agency administrators.
Fisheries 32(5):234-243.
Shrestha, R. K., A. F. Seidl, and A. S. Moraes. 2002. Value of recreational fishing in the
Brazilian Pantanal: a travel cost analysis using count data models. Ecological Economics 42(1-
2):289-299.
Shupp, B., 1979. 1978 status of bass fishing tournaments in the United States. Fisheries 4(6):11-
19.
Sorg, C. F., and J. B. Loomis. 1986. Economic value of Idaho sport fisheries with an update on
valuation techniques. North American Journal of Fisheries Management 6(4):494-503.
Storey, K. W., and D. L. Bennett. 2014. Statewide freshwater fisheries and management program
2013 survey report Lake Fork. Federal Aid in Sport Fish Restoration Act Texas Federal Aid
Project F-221-M-4.
Stynes, D. J. and D. M. Donnelly. 1987. Simplifying the travel cost method. Transactions of the
American Fisheries Society 116(3):432-440.
U.S. Fish and Wildlife Service, and the U.S. Bureau of Census. 2011. 2011 National Survey of
Fishing, Hunting, and Wildlife-Associated Recreation. U.S. Government Printing Office,
Washington, D.C.

45
Wilde, G. R. and R. B. Ditton. 1994. A management-oriented approach to understanding
diversity among largemouth bass anglers. North American Journal of Fisheries Management
14(1):34-40.
Wilde, G. R., R. K. Riechers, and R. B. Ditton. 1998. Differences in attitudes, fishing motives,
and demographic characteristics between tournament and nontournament black bass anglers in
Texas. North American Journal of Fisheries Management 18(2):422-431.

46
VI. Tables
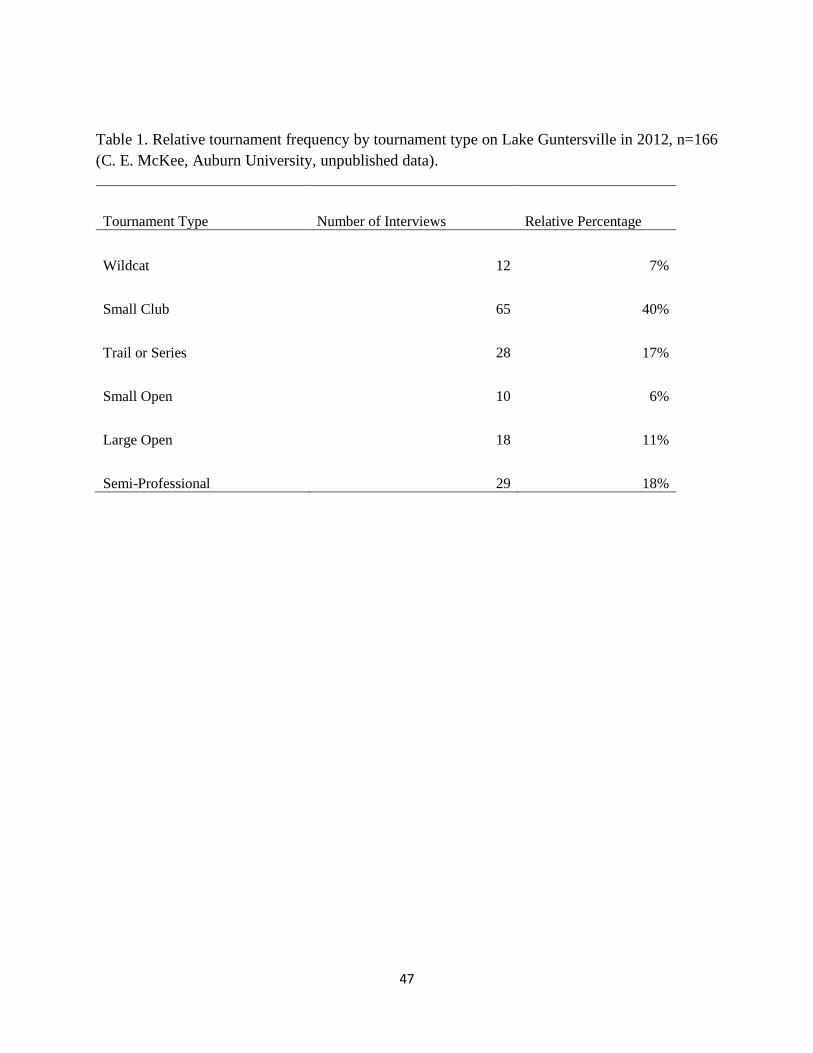
47
Table 1. Relative tournament frequency by tournament type on Lake Guntersville in 2012, n=166
(C. E. McKee, Auburn University, unpublished data).
Tournament Type Number of Interviews Relative Percentage
Wildcat 12 7%
Small Club 65 40%
Trail or Series 28 17%
Small Open 10 6%
Large Open 18 11%
Semi-Professional 29 18%

48
Table 2. Tax rates for the Cities of Guntersville and Scottsboro, Counties of Jackson, Marshall,
and Madison, and the State of Alabama.
Location Lodging General Sales Fuel
Guntersville 6% 4% 0.29940%
Scottsboro 5% 3% 0.59880%
Jackson 2% + $1 2% 0.89820%
Marshall 1% 1% 0.29940%
Madison 1% 2% 0.59880%
Alabama 4-5% 4% 5.68862%

49
Table 3: Number of tournaments sampled and average number of anglers per tournament (mean
± SE) by tournament type.
Tournament Type Tournaments Sampled Average Number of Anglers per Tournament
Wildcat 7 7 ± 2.3
Local Club 13 12.9 ± 1.59
Non-Local Club 18 15.6 ± 2.2
Trail/Series 16 24 ± 5.8
Small Open 12 13 ± 8.8
Large Open 5 466.8 ± 206.7
Semiprofessional 5 205.2 ± 22.1
Professional 1 352

50
Table 4: Descriptive variable averages for different tournament types. Trips are average number
of tournaments an angler of that type will take on Guntersville.
Tournament
Type
Number of
Tournaments
Number
of
Nights
Trips Practice
Days
Distance
Travelled
(km one way)
% of Anglers
from
out-of-state
Professional 1 5.37 3.02 3.52 621 80%
Semiprofessional 10 2.45 8.19 2.39 161 43%
Large Open 7 2.76 5.73 1.86 283 43%
Small Open 24 3.87 7.27 1.51 251 30%
Trail 47 1.47 10.43 1.7 134 24%
NonLocal Club 33 2.6 1.74 1.43 322 79%
Local Club 33 2.1 4.7 1.33 93 8%
Wildcat 117 0 36 0.77 29 0%

51
Table 5: Total angling effort (angler hours); total number of bass caught, released while culling
and weighed in; and catch per unit effort, released while culling per unit effort, and weighed in
per unit effort by tournament type on Lake Guntersville.
Tournament Type Effort Catch Released Weighed CPUE RPUE WPUE
Wildcat 6,206 12,326 3,055 2,576 1.99 0.49 0.42
Local Club 3,849 4,366 1,179 1,400 1.13 0.31 0.36
Non-Local Club 4,463 3,707 821 1,410 0.83 0.18 0.32
Trail/Series 7,922 8,200 2,991 3,350 1.04 0.38 0.42
Small Open 7,434 11,054 3,018 3,574 1.49 0.41 0.48
Large Open 32,258 14,034 4,023 3,360 0.44 0.12 0.10
Semiprofessional 21,920 13,810 3,267 6,123 0.63 0.15 0.28
Professional 5,632 1,918 518 1,138 0.34 0.09 0.20
Total 89,684 69,415 18,872 22,931 0.77 0.21 0.26

52
Table 6. Travel Cost, in thousands, for all tournament types occurring on Lake Guntersville
Tournament
Type
N,
expanded
Vehicle
Fuel
Boat
Fuel Lodge Grocery Meals Tackle Guide Launch Repair Licenses Entry
Total
Cost
Lower
95%
Upper
95%
Wildcat 1,127 32.2 35.8 .0 6.3 1.9 5.1 .0 .0 .0 2.9 32.2 116.5 82.31 150.63
Local Club 361 23.7 25.9 8.7 6.1 3.7 10.1 .0 1.6 3.2 1.7 25.3 109.9 90.93 128.79
Non-Local Club 486 53.3 41.9 60.0 14.6 16.5 17.1 .0 .8 .1 14.0 25.5 243.9 200.72 287.06
Trail 963 70.4 82.0 71.3 18.3 21.1 29.1 .0 11.5 10.8 9.9 80.6 405.0 341.67 468.28
Small Open 766 69.0 65.2 37.6 21.2 22.4 16.1 .0 .5 1.3 7.9 80.6 321.6 237.27 405.91
Large Open 3,722 324.5 225.2 330.5 124.3 99.5 122.2 .3 4.4 68.6 44.4 379.3 1,723.2 1,341.77 2,104.54
Semiprofessional 2,258 183.3 160.4 143.8 44.5 60.7 78.2 .0 2.2 27.7 37.5 359.4 1,097.6 952.62 1,242.59
Professional 352 59.3 51.5 79.2 29.4 29.4 35.5 .0 .1 8.3 12.8 246.4 552.0 485.05 619.02
Total 10,035 815.7 687.8 731.0 264.6 255.2 313.4 .4 21.3 119.9 131.2 1,229.3 4,569.6 3,732.33 5,406.81

53
Table 7. Travel cost in thousands by state of angler origin
State Total Percent
Alabama $1,981 43%
Arkansas $ 22 0%
Florida $ 274 6%
Georgia $ 483 10%
Illinois $ 25 1%
Indiana $ 162 4%
Kentucky $ 103 2%
Louisiana $ 82 2%
Maryland $ 14 0%
Michigan $ 74 2%
Minnesota $ 8 0%
Mississippi $ 66 1%
North Carolina $ 44 1%
Oregon $ 18 0%
Pennsylvania $ 32 1%
South Carolina $ 92 2%
Tennessee $1,005 22%
Virginia $ 21 0%
Wisconsin $ 8 0%
West Virginia $ 90 2%

54
Table 8. Tax revenue generated by tournament angler expenditures.
Location
Lodging
Tax
Lodging
Expenditures
Lodging
Tax Revenue
General
Sales
Tax
General Sales
Expenditures
General
Sales
Tax Revenue Fuel Tax Fuel Expenditures
Fuel Tax
Revenue
Total Tax
Revenue
Guntersville 6% $349,244 $20,955 4% $294,153 $11,766 0.29940% $367,683 $1,101 $33,822
Scottsboro 5% $237,882 $11,894 3% $294,499 $8,835 0.59880% $234,314 $555 $21,284
Jackson 2% + $1 $279,712 $9,822 2% $313,549 $6,271 0.89820% $274,708 $2,467 $18,561
Marshall 1% $394,223 $3,942 1% $91,267 $913 0.29940% $568,158 $1,701 $6,556
Madison 1% $2,644 $26 2% $22,834 $228 0.59880% $61,342 $367 $622
Alabama 4-5% $694,735 $41,502 4% $820,694 $33,155 5.68862% $1,173,809 $66,779 $141,436
Total $88,142 $61,168 $72,971 $222,281

55
Table 9. Distribution of tax revenue generated by tournament angling expenditures on Lake
Guntersville.
Location
Roads and
Bridges Education Tourism
General
Fund
Health and Human
Services TOTAL
Guntersville N/A $2,942 $5,832 $25,035 N/A $33,809
Scottsboro $555 $2,209 N/A $18,520 N/A $21,284
Jackson $2,467 $6,271 $9,822 $0 N/A $18,561
Marshall $1,701 $913 $3,942 $0 N/A $6,556
Madison $367 $228 $26 $0 N/A $622
Alabama $45,687 N/A $8,300 $24,901 $33,155 $112,044
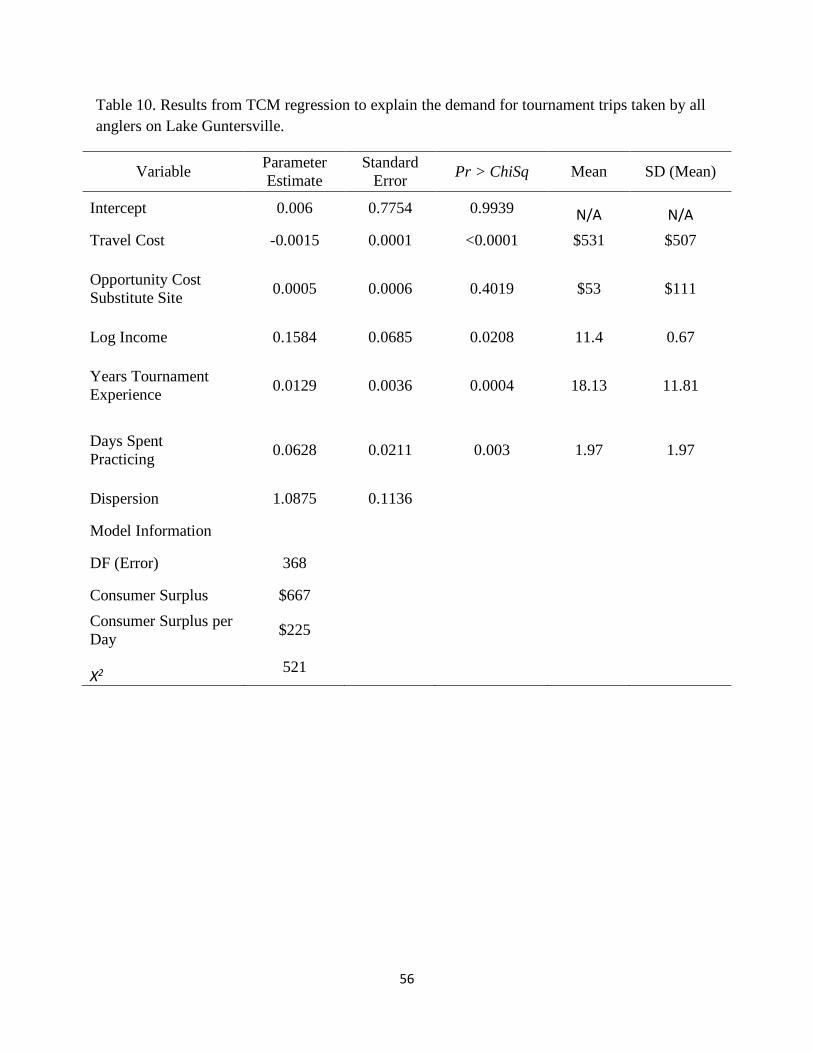
56
Table 10. Results from TCM regression to explain the demand for tournament trips taken by all
anglers on Lake Guntersville.
Variable Parameter
Estimate
Standard
Error Pr > ChiSq Mean SD (Mean)
Intercept 0.006 0.7754 0.9939 N/A N/A
Travel Cost -0.0015 0.0001 <0.0001 $531 $507
Opportunity Cost
Substitute Site 0.0005 0.0006 0.4019 $53 $111
Log Income 0.1584 0.0685 0.0208 11.4 0.67
Years Tournament
Experience 0.0129 0.0036 0.0004 18.13 11.81
Days Spent
Practicing 0.0628 0.0211 0.003 1.97 1.97
Dispersion 1.0875 0.1136
Model Information
DF (Error) 368
Consumer Surplus $667
Consumer Surplus per
Day $225
Χ2 521

57
Table 11. Results from TCM regression to explain the demand for tournament trips taken by out-
of-state anglers on Lake Guntersville.
Variable Parameter
Estimate
Standard
Error Pr > ChiSq Mean SD (Mean)
Intercept -1.4386 1.2675 0.2564 N/A N/A
Travel Cost -0.0011 0.0002 <0.0001 $780 $560
Opportunity Cost
Substitute Site 0.0001 0.0006 0.8506 $76 $150
Log Income 0.2384 0.1123 0.0337 11.48 0.61
Years Tournament
Experience 0.009 0.0054 0.0979 17.16 11.11
Days Spent
Practicing 0.1618 0.0366 <0.0001 2.11 1.93
Dispersion 0.7649 0.1486
Model Information
DF (Error) 175
Consumer Surplus $909
Consumer Surplus per
Day $292
Χ2 266
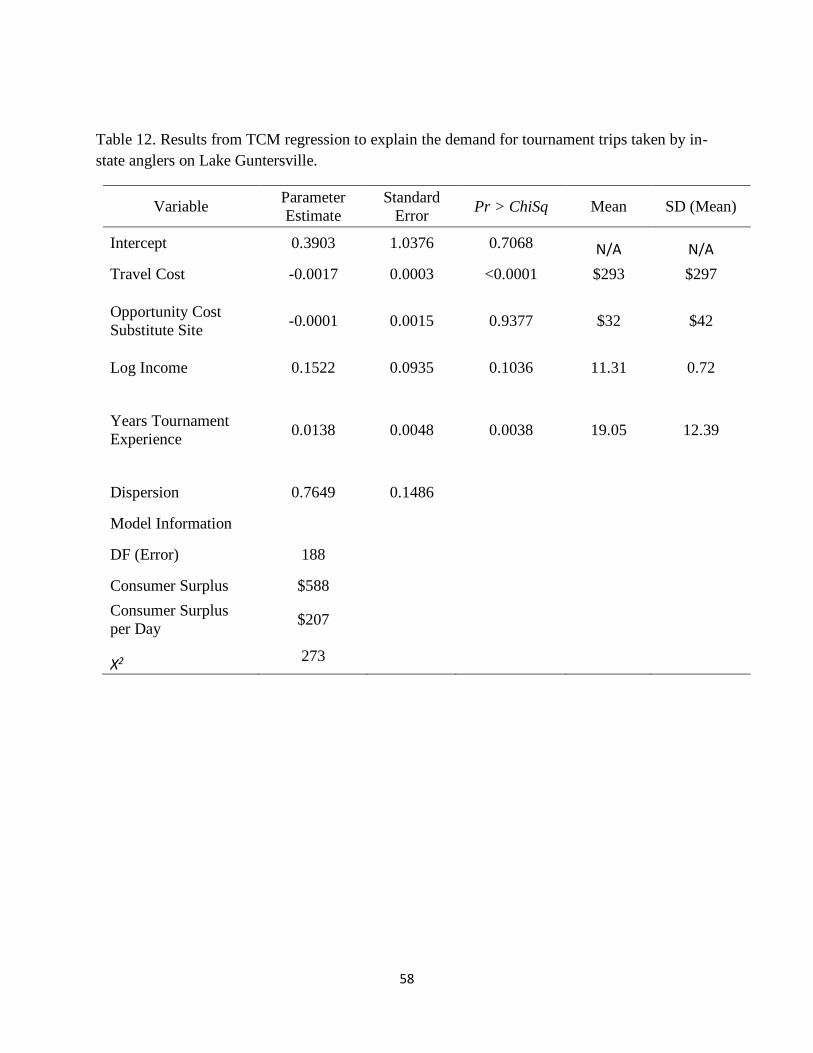
58
Table 12. Results from TCM regression to explain the demand for tournament trips taken by in-
state anglers on Lake Guntersville.
Variable Parameter
Estimate
Standard
Error Pr > ChiSq Mean SD (Mean)
Intercept 0.3903 1.0376 0.7068 N/A N/A
Travel Cost -0.0017 0.0003 <0.0001 $293 $297
Opportunity Cost
Substitute Site -0.0001 0.0015 0.9377 $32 $42
Log Income 0.1522 0.0935 0.1036 11.31 0.72
Years Tournament
Experience 0.0138 0.0048 0.0038 19.05 12.39
Dispersion 0.7649 0.1486
Model Information
DF (Error) 188
Consumer Surplus $588
Consumer Surplus
per Day $207
Χ2 273

59
VII. Figures

60
Figure 1. Map of Lake Guntersville the surrounding Counties of Marshall, Madison, and
Jackson, and Cities of Guntersville, and Scottsboro.
Jackson
DeKalbMarshall
Madison
Guntersville
Scottsboro
±0 8 16 24 324
Kilometers

61
Figure 2: Relative tournament frequency by tournament type on Lake Guntersville in 2012
n=166 (C. E. McKee, Auburn University, unpublished data).

62
Figure 3. Graphical representation of a demand curve (quantity demanded) and consumer surplus
𝑃1 is the maximum visit price that one is willing to pay and 𝑄1 is the maximum number of visits
a consumer will demand at a price of $0. �̅� is the equilibrium (mean) price paid and �̅� is the
equilibrium (mean) number of visits demanded by a typical (average) consumer. Consumer
surplus is the willingness-to-pay for a recreational visit above and beyond a person’s actual visit
expenditures and is the area below the recreational visit demand curve and above the equilibrium
visit cost (�̅�). Expenditures are actual purchases incurred by the person on the visit plus the
opportunity cost of time based on the respondent’s wage rate and the calculated roundtrip travel
time.

63
Figure 4. Tournaments known to occur and tournaments sampled on Lake Guntersville by
month.
0
5
10
15
20
25
30
35
Feb Mar Apr May Jun Jul Aug Sep Oct Nov Dec Jan
Tournaments Sampled Tournaments Known

64
Figure 5. Total angler expenditures on Lake Guntersville by tournament type in thousands
200
400
600
800
1,000
1,200
1,400
1,600
1,800
2,000

65
VIII. Appendices

66
VIII. 1. Tournament Angler Data Sheet

67
VIII. 2. Tournament Information Sheet
68
XIII. 3. Creel Survey Cover Page

69
XIII. 4. Mail-in Tournament Angler Creel Survey Form

70
XIII. 4. Mail-in Tournament Angler Creel Survey Form

71
XIII. 4. Mail-in Tournament Angler Creel Survey Form