economic summit recent decline in oil prices march 6, 2015 reza varjavand associate professor of...
TRANSCRIPT

Economic SummitRecent decline in oil
pricesMarch 6, 2015
Reza Varjavand
Associate Professor of Economics
GSM, Saint Xavier University
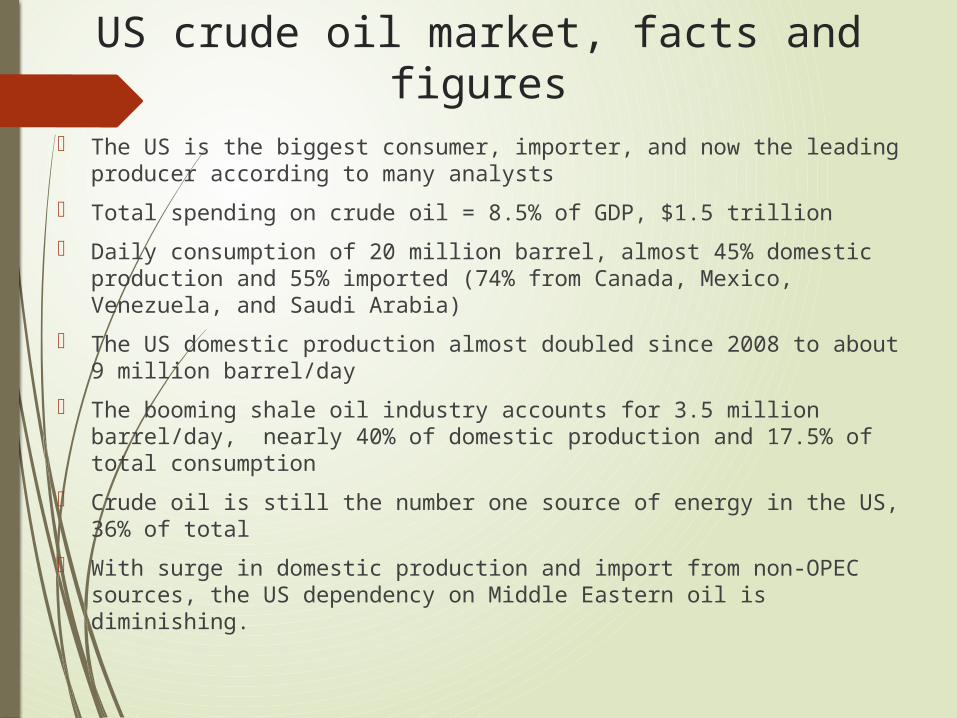
US crude oil market, facts and figures
The US is the biggest consumer, importer, and now the leading producer according to many analysts
Total spending on crude oil = 8.5% of GDP, $1.5 trillion
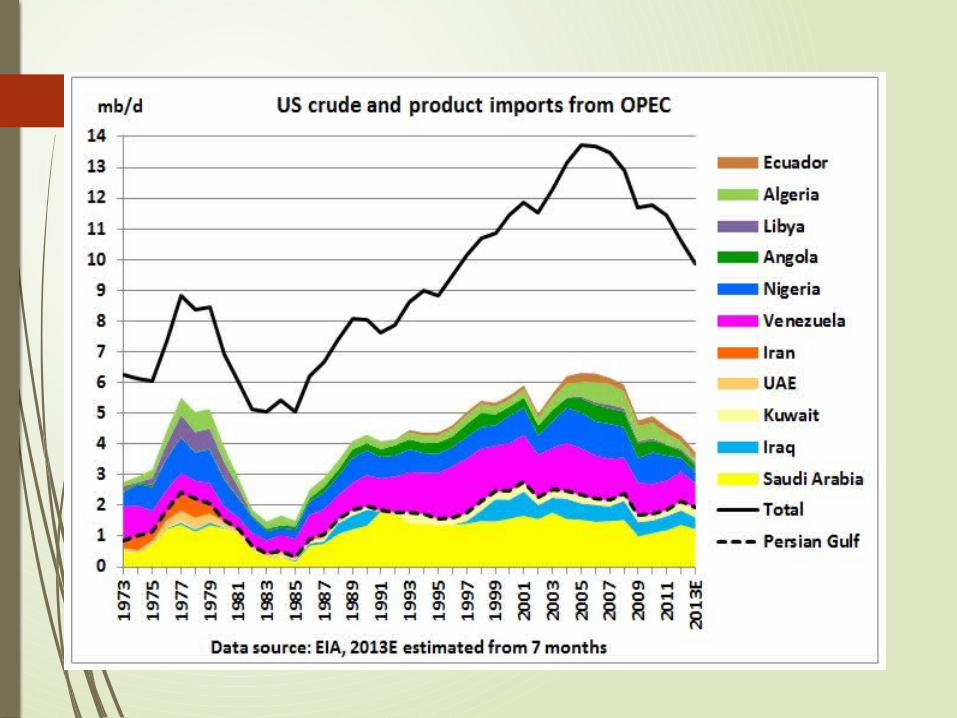
Daily consumption of 20 million barrel, almost 45% domestic production and 55% imported (74% from Canada, Mexico, Venezuela, and Saudi Arabia)
The US domestic production almost doubled since 2008 to about 9 million barrel/day
The booming shale oil industry accounts for 3.5 million barrel/day, nearly 40% of domestic production and 17.5% of total consumption
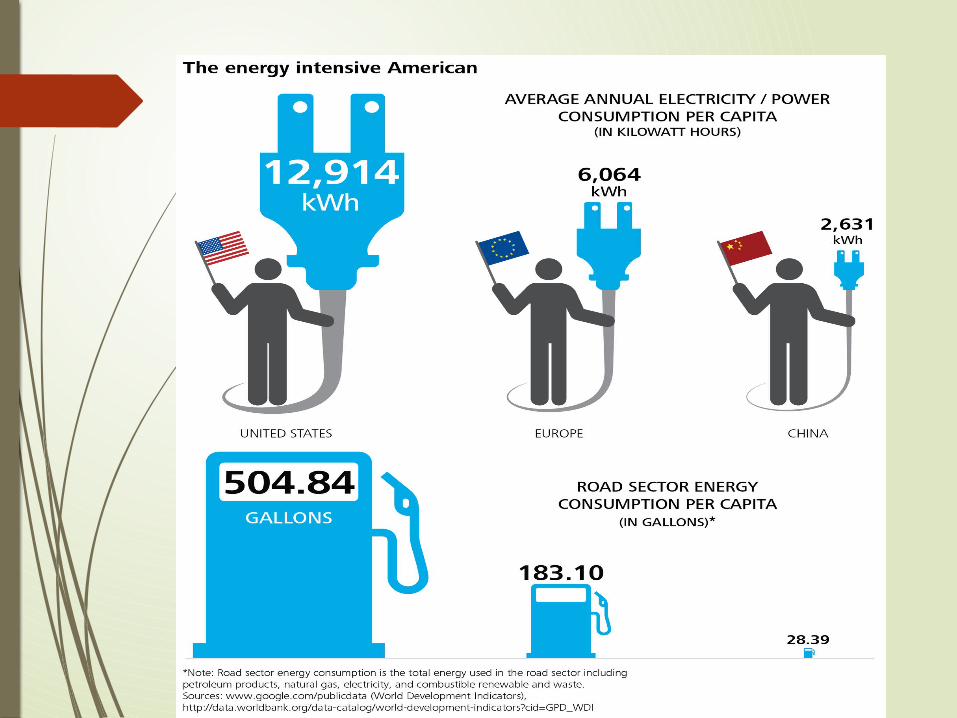
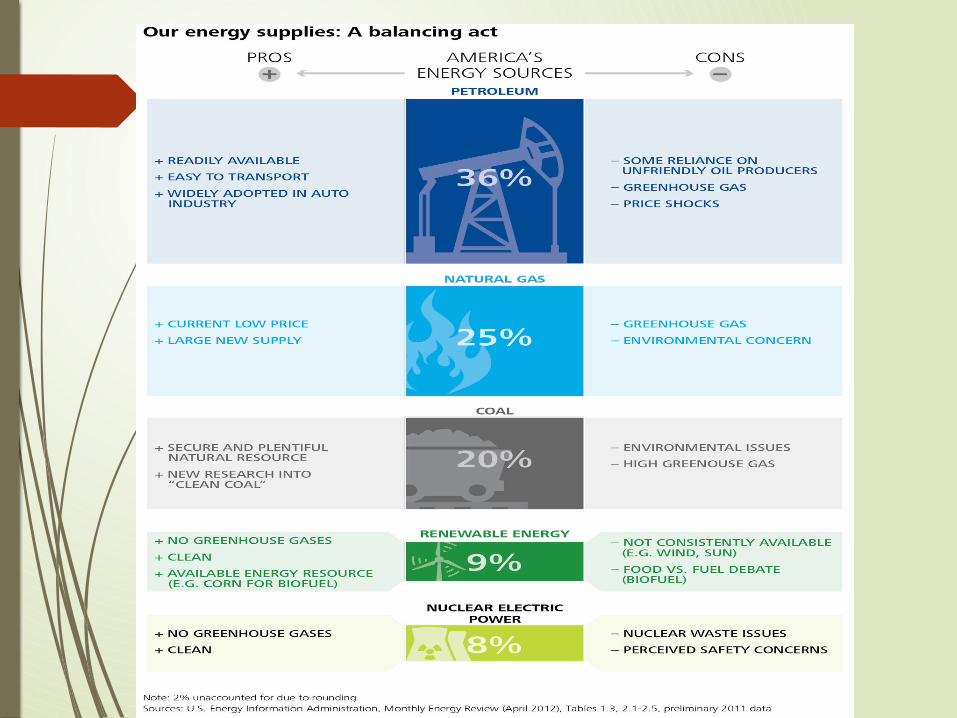
Crude oil is still the number one source of energy in the US, 36% of total
With surge in domestic production and import from non-OPEC sources, the US dependency on Middle Eastern oil is diminishing.
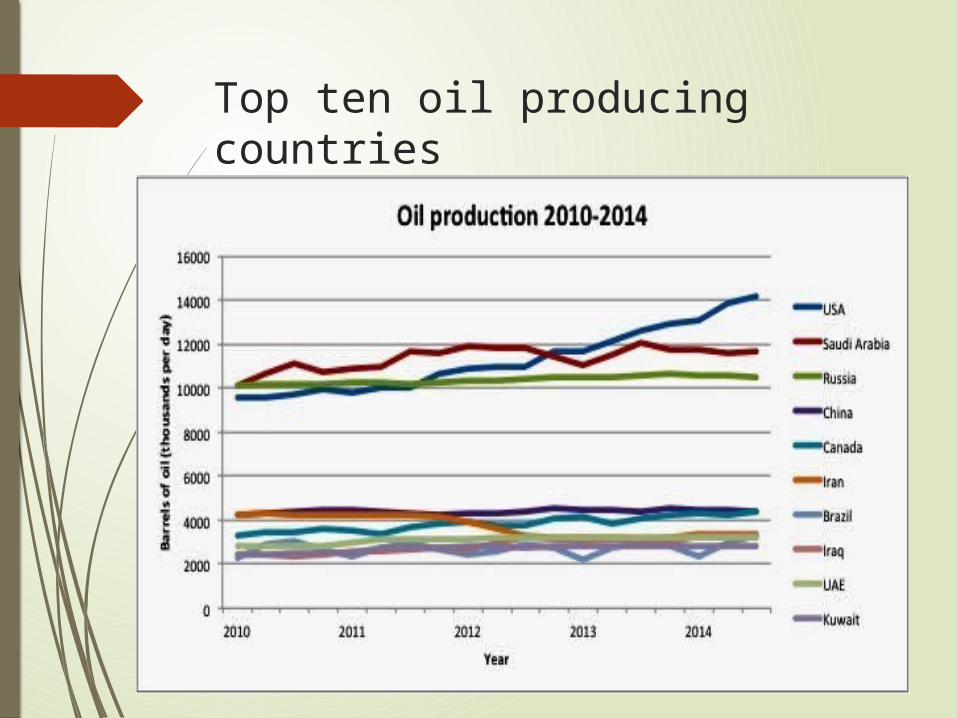
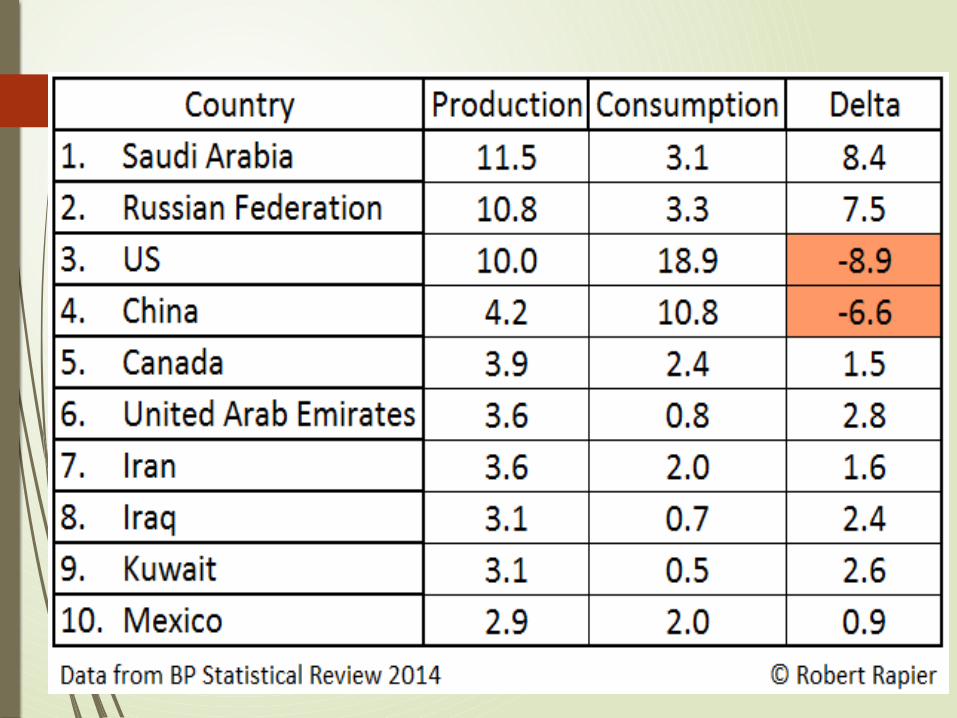
Top ten oil producing countries

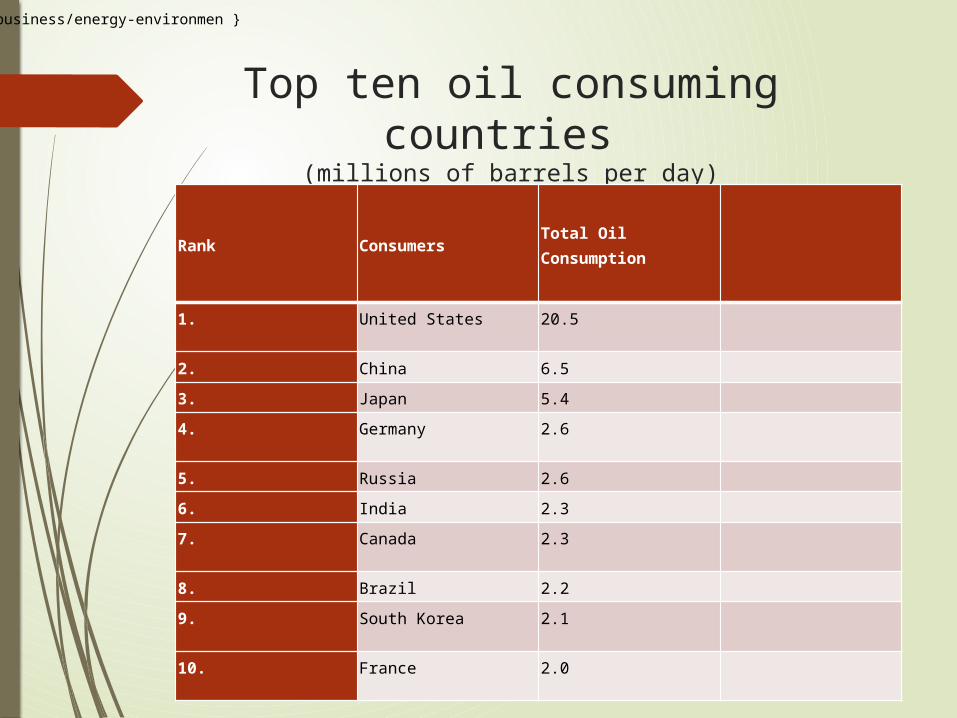
Top ten oil consuming countries (millions of barrels per day)
Rank ConsumersTotal Oil Consumption
1. United States 20.5
2. China 6.5
3. Japan 5.4
4. Germany 2.6
5. Russia 2.6
6. India 2.3
7. Canada 2.3
8. Brazil 2.2
9. South Korea 2.1
10. France 2.0
http://www.nytimes.com/video/business/energy-environmen }


OPEC VS the US, Shares of world oil production, 10 to 50%
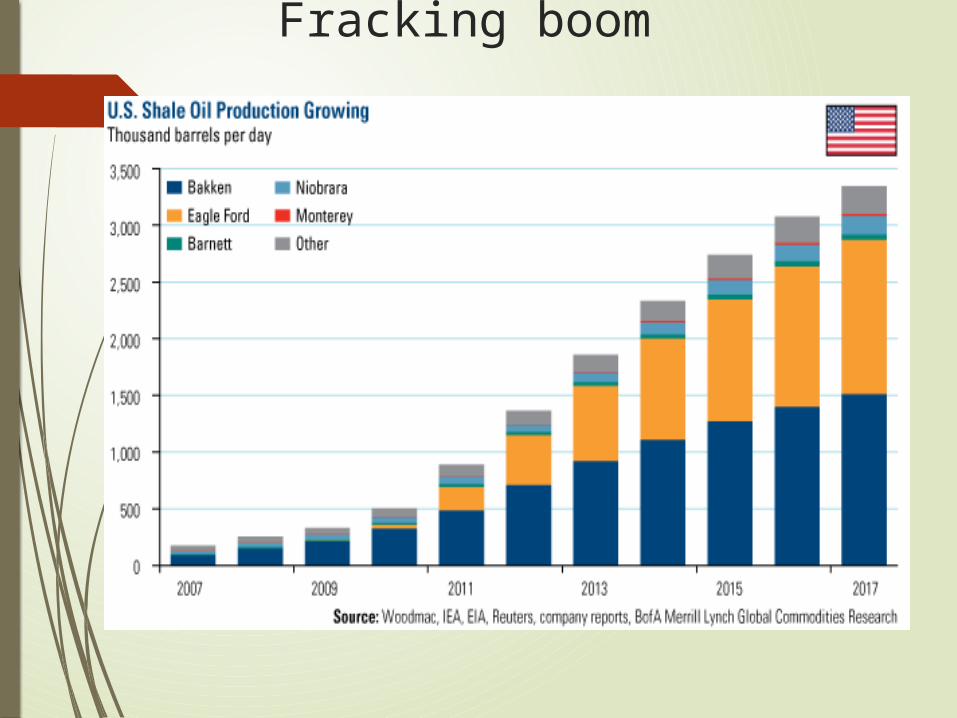
Fracking boom


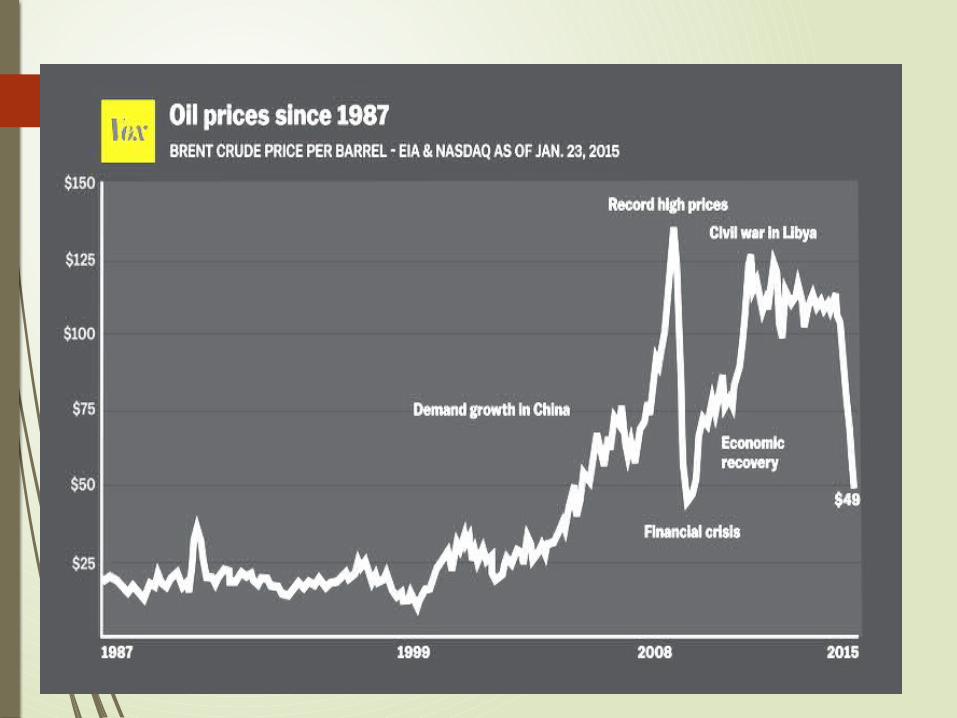
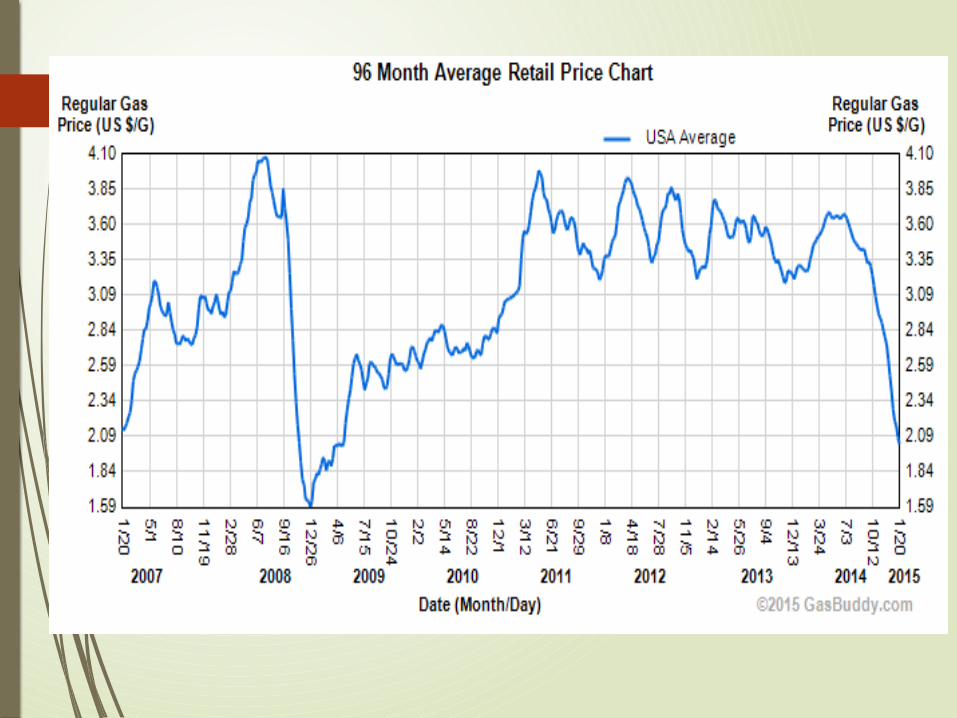
Recent decline in price of crude oil
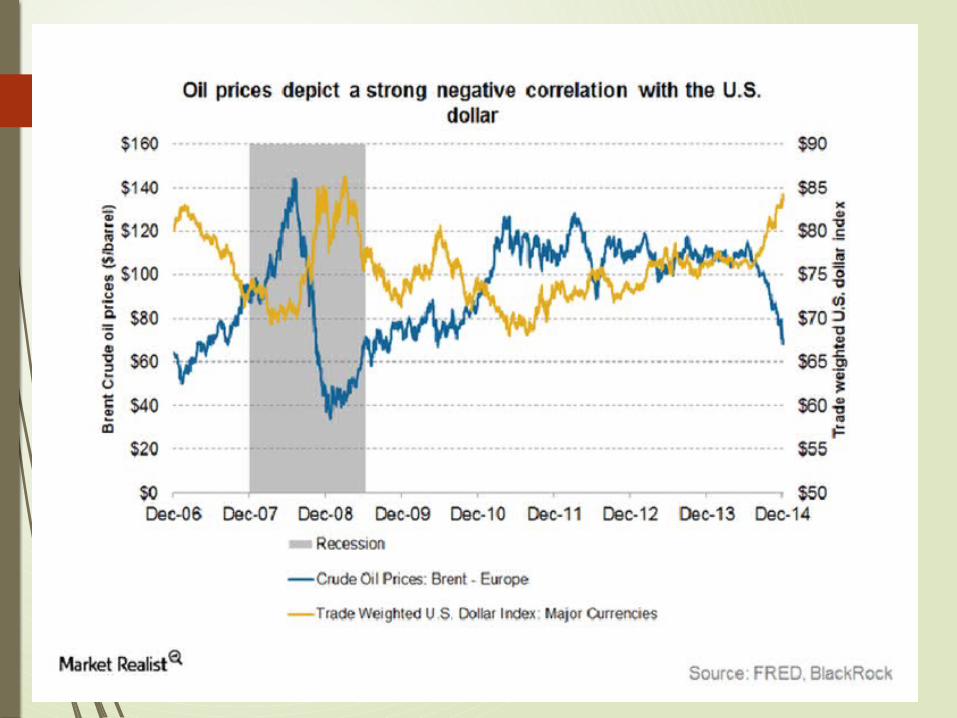
The contributing factors: Demand related Supply related Product related Strength of US dollar Changes in consumers priorities Popularity of services Environmental and fuel efficiency
concerns Geopolitical factors including conflict of
interests among OPEC nations

Latest crude oil price from NASDAQ


Effects of falling oil prices on the US economy
Dropping prices signify a mixed blessing for the economy, there are many gainers and a few losers.
US consumers are the biggest gainers, aggregate and per household
Manufacturing sectors: automobile, transportation, airline, and other businesses
Shale oil industry and its future economic viability Effects on different states and the US economy as
a whole
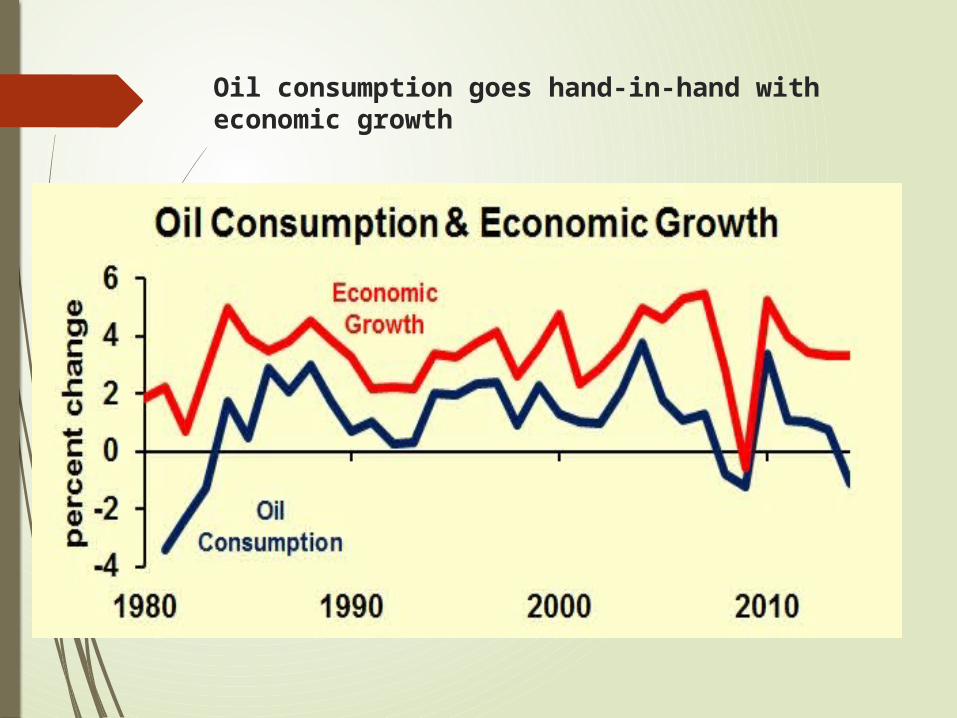
Oil consumption goes hand-in-hand with economic growth


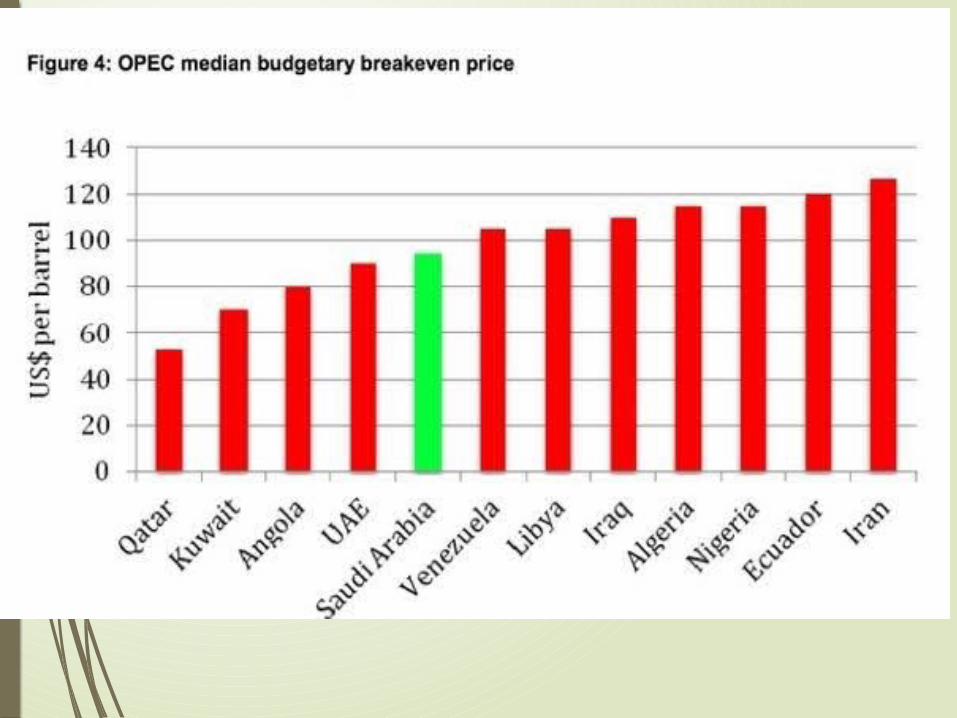
Breakeven Prices for different kinds of crude oil
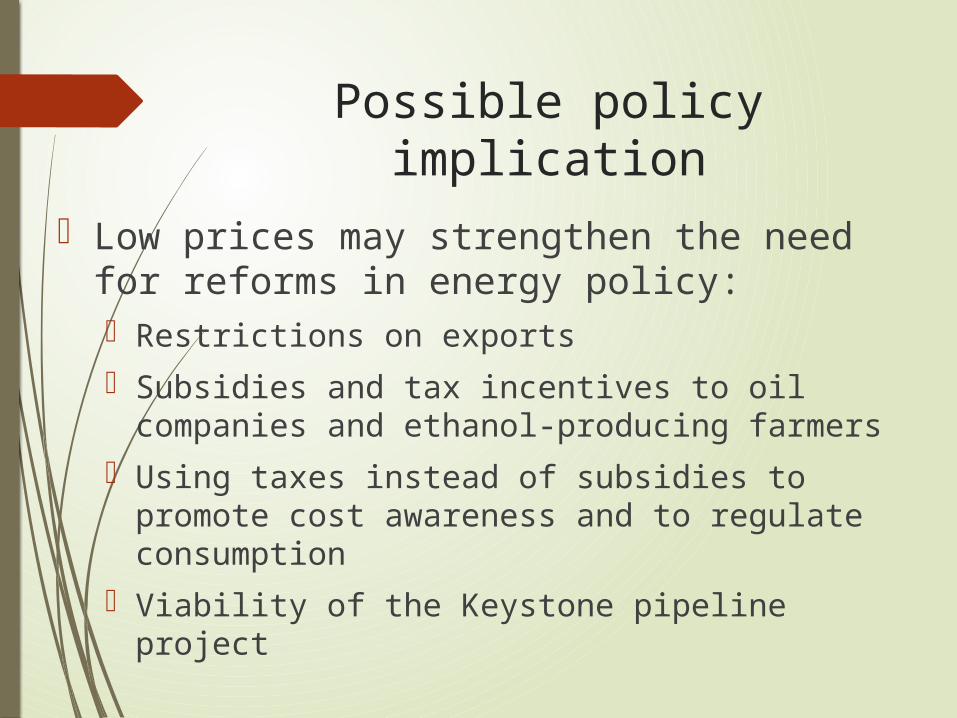
Possible policy implication
Low prices may strengthen the need for reforms in energy policy: Restrictions on exports Subsidies and tax incentives to oil companies
and ethanol-producing farmers Using taxes instead of subsidies to promote
cost awareness and to regulate consumption Viability of the Keystone pipeline project

Possibility of price rebound
Expectations of economic recovery worldwide
OPEC acting as an collaborative oligopoly (cartel) again, member nations may change their strategy and their attitudes toward one another
Law of demand and supply becomes relevant instead of geopolitical factors
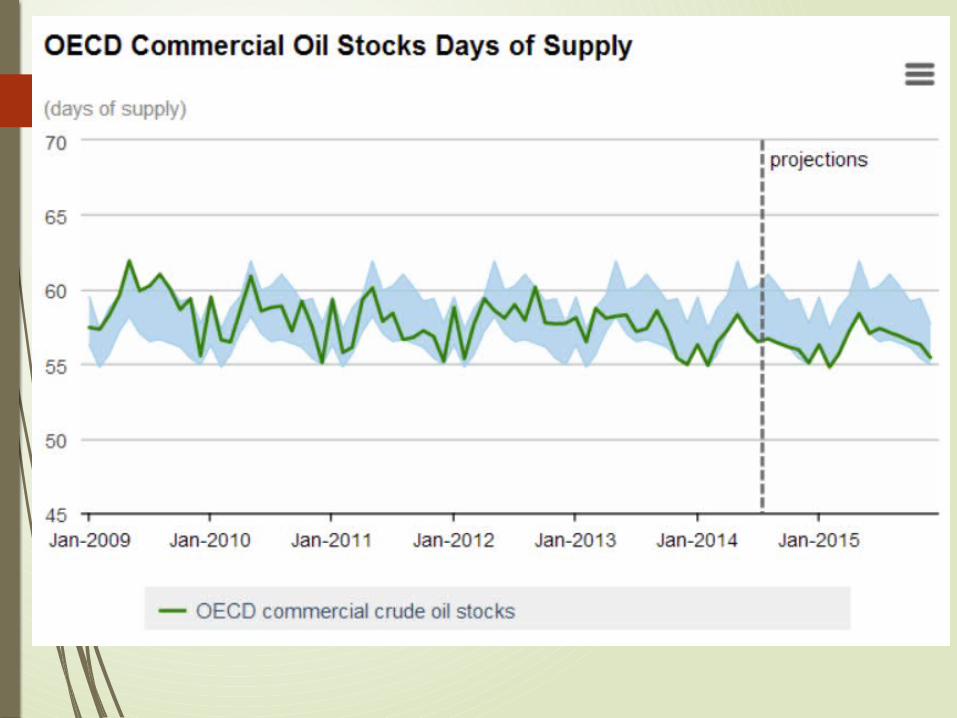
Increasing world's stockpiles of crude oil
Effects of low prices on oil-exporting nations
Saudi Arabia
Russia
Iran
Venezuela
Nigeria

Structure of crude oil market Size, about 90 million barrel/day production (each barrel
contains 42 gallons)
Stages of operation: Exploration, Development, and Production
The types of benchmark crude Oil: WTI, West Texas Intermediate, for the US domestic producers and Brent for the global market.
Key producers in global market: USA, Saudi Arabia, Russia, China, and Canada, the share of top ten producers = 64% of total.
OPEC share is currently 40% of the world market. Non-OPEC producers 48% and t he US share is about 12%,
7 Companies dominating the global oil market: BP, Gulf, Standard of CA, Chevron, Shell, Standard of NJ, Exxon.

Major Players in global oil market

Share of world oil production
50
%
PROJ.
OPEC countries
40
30
20
United States
10
0
’96
’00
’04
’08
’12
’16
Source: Energy Information Administration