economic viescientific, and technical services 7% management of companies and enterprises 1%...
TRANSCRIPT

Economic ViewMarch 29, 2017
Kalyan MadhavanFederal Home Loan Bank of Dallas

Disclaimer
1
Certain information included in this presentation speaks only as of a particular date or dates included in this presentation. The information in the presentation may have become out of date. The Federal Home Loan Bank of Dallas does not undertake an obligation, and disclaims any duty, to update any of the information in this presentation. The risks, uncertainties, and factors that could affect the Federal Home Loan Bank of Dallas and its financial results are discussed more fully in the Federal Home Loan Bank of Dallas’ reports filed with the Securities and Exchange Commission, which are available on www.fhlb.com
The data, scenarios and valuations provided to you in this presentation are for informational purposes only and are provided as an accommodation and without charge and are not intended for further distribution. The data, scenarios and valuations are estimates only and may not represent the actual or indicative terms at which new (or economically equivalent) transactions could be entered into or the actual or indicative terms at which existing (or economically equivalent) transactions could be prepaid, terminated, liquidated, assigned or unwound. The scenarios and valuations were derived using proprietary pricing models and estimates and assumptions about relevant future market conditions and other matters, all of which are subject to change without notice. The scenarios and valuations were prepared without specific information about your institution’s balance sheet composition, hedging strategies or financial assumptions and plans, any of which may affect the relevance of these valuations to your own analysis.
The Federal Home Loan Bank of Dallas makes no representations or warranties about the accuracy or suitability of any information in this presentation. This presentation is not intended to constitute legal, accounting, investment or financial advice or the rendering of legal, accounting, consulting, or other professional services of any kind. You should consult with your accountants, counsel, financial representatives, consultants and/or other advisors regarding the extent these scenarios and valuations may be useful to you and with respect to any legal, tax, business and/or financial matters or questions.

2
• Real Economy• U.S/Texas• Employment: Corpus and San Patricio
• Fed Moves and Inter-market moves• Oil and Corpus Christi• Water, Earth, Wind and Fire?• San Patricio: Demographics• Digital World- Sharing Economy, A.I
Agenda
3
If U.S/Texas were a home
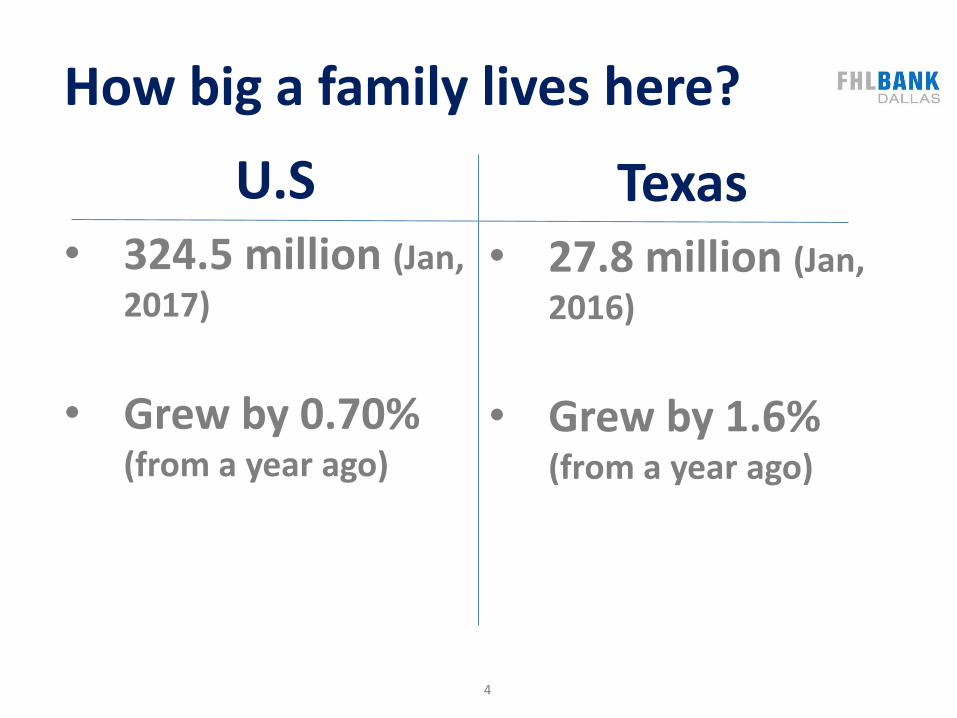
How big a family lives here?
• 324.5 million (Jan,
2017)
• Grew by 0.70% (from a year ago)
• 27.8 million (Jan,
2016)
• Grew by 1.6% (from a year ago)
U.S Texas
4

• $16.96 Trillion (as
of Q4 2016)
• Grew by 1.60% (Percent Change from Year Ago)
How much did the family earn?Real Gross Domestic Product
https://fred.stlouisfed.org/series/GDPC1
U.S Texas
• $1.63 Trillion (2016)
• Grew by 0.13% (Percent Change from Year Ago)
5

U.S, Private industries, 88%
U.S, Government,
12%
TX, 90%
TX, 10%
https://fred.stlouisfed.org/series/GDPC1
In which sector did they earn?
6

U.S: Real GDP % of Industry TypeAgriculture, forestry,
fishing, and
hunting1%
Mining2%Utilities
2%
Construction4%
Manufacturing13%
Wholesale trade7%
Retail trade7%
Transportation and warehousing
3%
Information
6%Finance and
insurance7%
Real estate and rental and leasing
15%
Professional, scientific, and technical
services
8%
Management of companies and
enterprises2%
Administrative and waste management
services
4%
Educational services1%
Health care and social assistance
9%
Arts, entertainment, and recreation
1%
Accommodation and food services
3%
Other services, except government
2%
7

Texas: Real GDP % of Industry TypeAgriculture,
forestry, fishing, and hunting
1%Mining13%
Utilities2%
Construction5%
Manufacturing
15%
Wholesale trade9%
Retail trade7%
Transportation and warehousing
4%Information
4%
Finance and insurance5%
Real estate and rental and leasing
11%
Professional, scientific, and technical
services7%
Management of companies and
enterprises1%
Administrative and waste
management services
4%
Educational services
1%Health care
and social assistance
6%
Arts, entertainment, and recreation
1%
Accommodation and food services
3%
Other services, except
government
2%
8

Sector Difference: Texas vs. U.S
0%
10%
0%
1%
1%
2%
0%
0%
-2%
-2%
-4%
-1%
-1%
0%
0%
-2%
0%
0%
0%
-2%
-6% -4% -2% 0% 2% 4% 6% 8% 10% 12%
Agriculture, forestry, fishing, and hunting
Mining
Utilities
Construction
Manufacturing
Wholesale trade
Retail trade
Transportation and warehousing
Information
Finance and insurance
Real estate and rental and leasing
Professional, scientific, and technical…
Management of companies and enterprises
Administrative and waste management…
Educational services
Health care and social assistance
Arts, entertainment, and recreation
Accommodation and food services
Other services, except government
Government
9

Back to 1970s level
What % is working/looking for work? (U.S Labor Participation Rate)
10
11
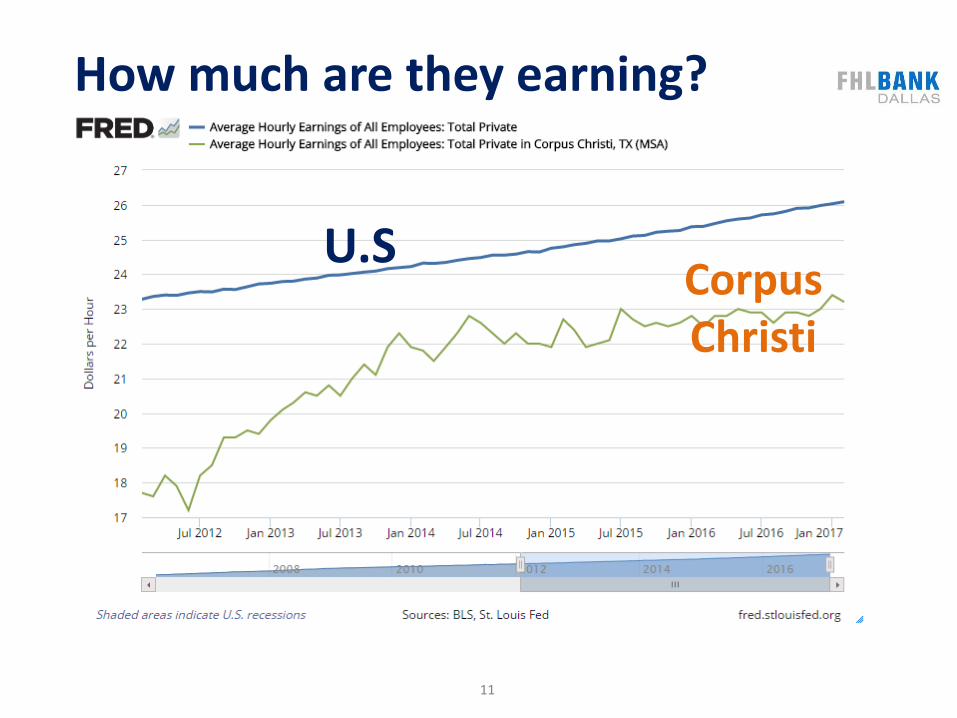
How much are they earning?
U.SCorpus Christi
12
Employment

13
4.9%
Unemployment rates by State, Jan 2017(Not seasonally adjusted)
https://geofred.stlouisfed.org/map
14
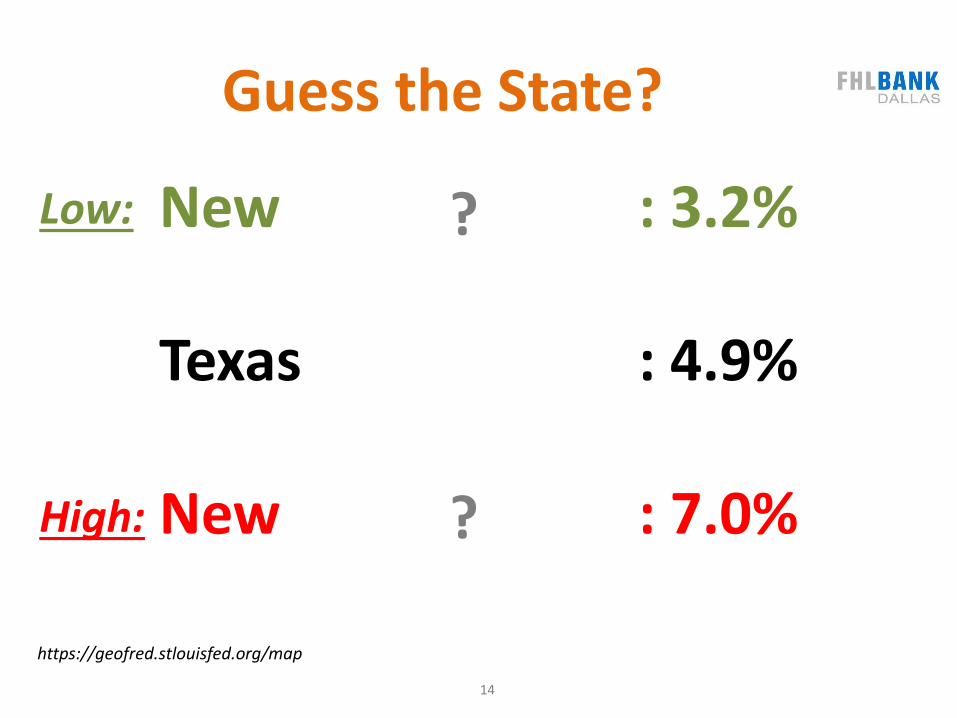
New Hampshire : 3.2%
Texas : 4.9%
New Mexico : 7.0%
?
?
https://geofred.stlouisfed.org/map
High:
Low:
Guess the State?
15
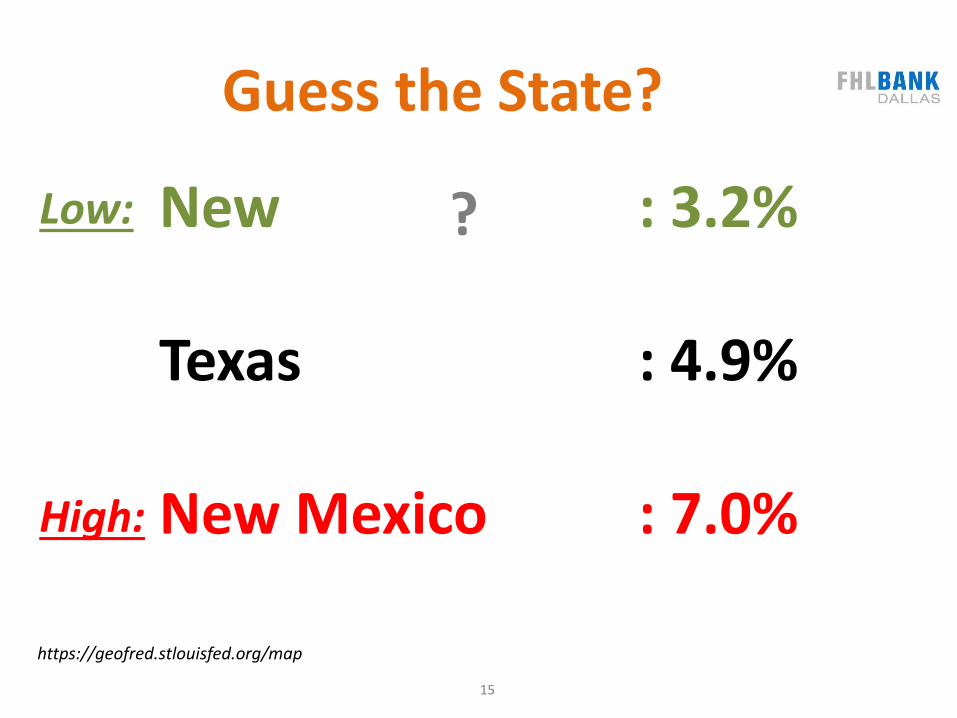
New Hampshire : 3.2%
Texas : 4.9%
New Mexico : 7.0%
https://geofred.stlouisfed.org/map
High:
Low: ?
Guess the State?

16
New Hampshire : 3.2%
Texas : 4.9%
New Mexico : 7.0%
https://geofred.stlouisfed.org/map
High:
Low:
Guess the State?
17
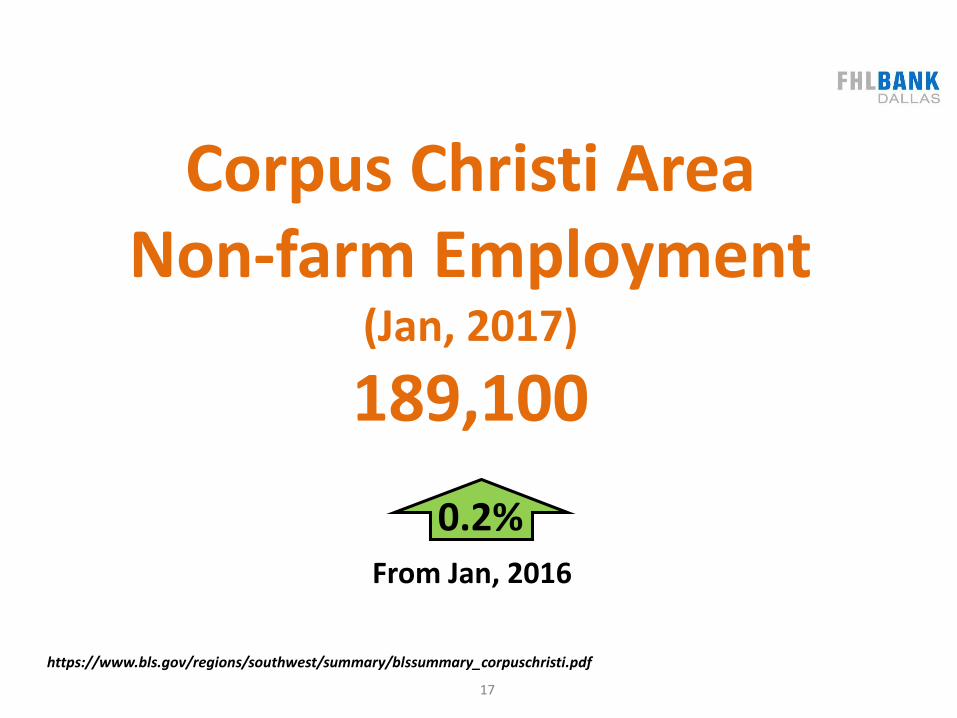
Corpus Christi AreaNon-farm Employment
(Jan, 2017)
189,100
0.2%From Jan, 2016
https://www.bls.gov/regions/southwest/summary/blssummary_corpuschristi.pdf

18
Corpus Christi Employment by Sector, Jan 2017
https://www.bls.gov/regions/southwest/summary/blssummary_corpuschristi.pdf

19
1.5%3.6%
-1.3%-4.1%
-5.5%
3.3%
0%
-0.3%
-5.3%
-3.8%
https://www.bls.gov/regions/southwest/summary/blssummary_corpuschristi.pdf
Sectors that grewJan 2016 to Jan 2017

20
1.5%3.6%
-1.3%-4.1%
-5.5%
3.3%
0%
-0.3%
-5.3%
-3.8%
https://www.bls.gov/regions/southwest/summary/blssummary_corpuschristi.pdf
Sectors that decreasedJan 2016 to Jan 2017
21
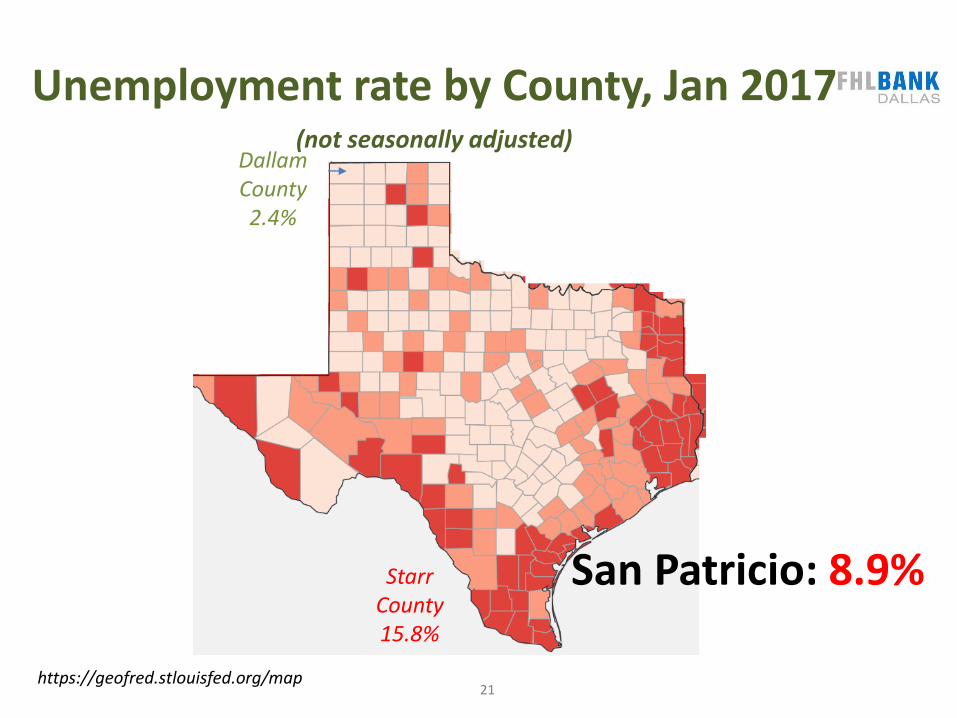
Starr County 15.8%
Dallam County2.4%
https://geofred.stlouisfed.org/map
San Patricio: 8.9%
Unemployment rate by County, Jan 2017(not seasonally adjusted)
22
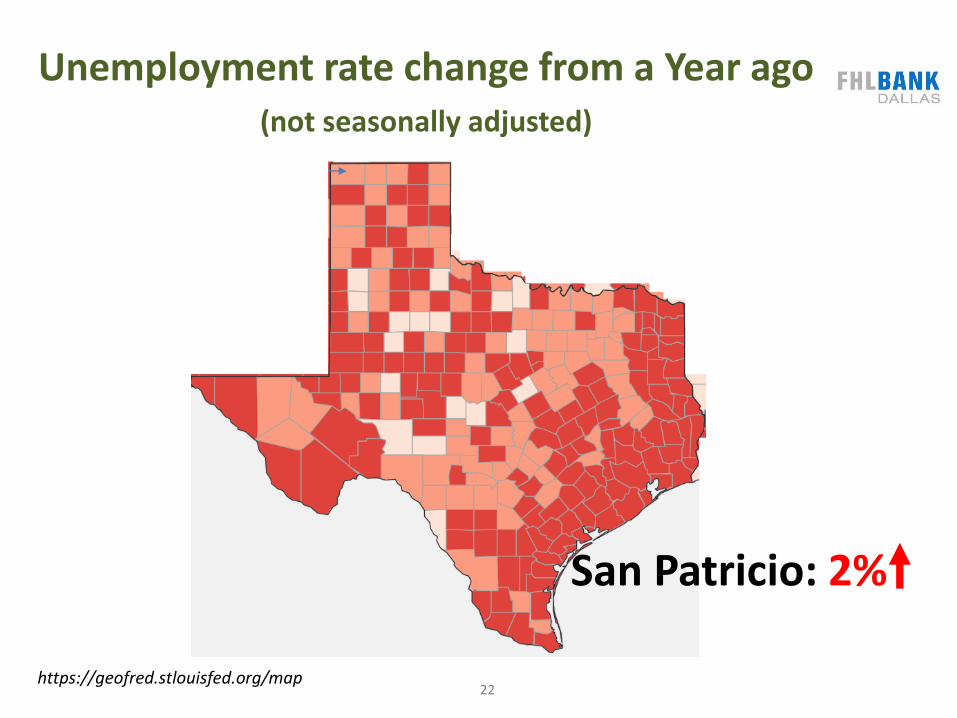
Unemployment rate change from a Year ago(not seasonally adjusted)
https://geofred.stlouisfed.org/map
San Patricio: 2%

23
Civilian Labor Force % Change from a Year agoJan 2017
https://geofred.stlouisfed.org/map
San Patricio: -1.75%
24
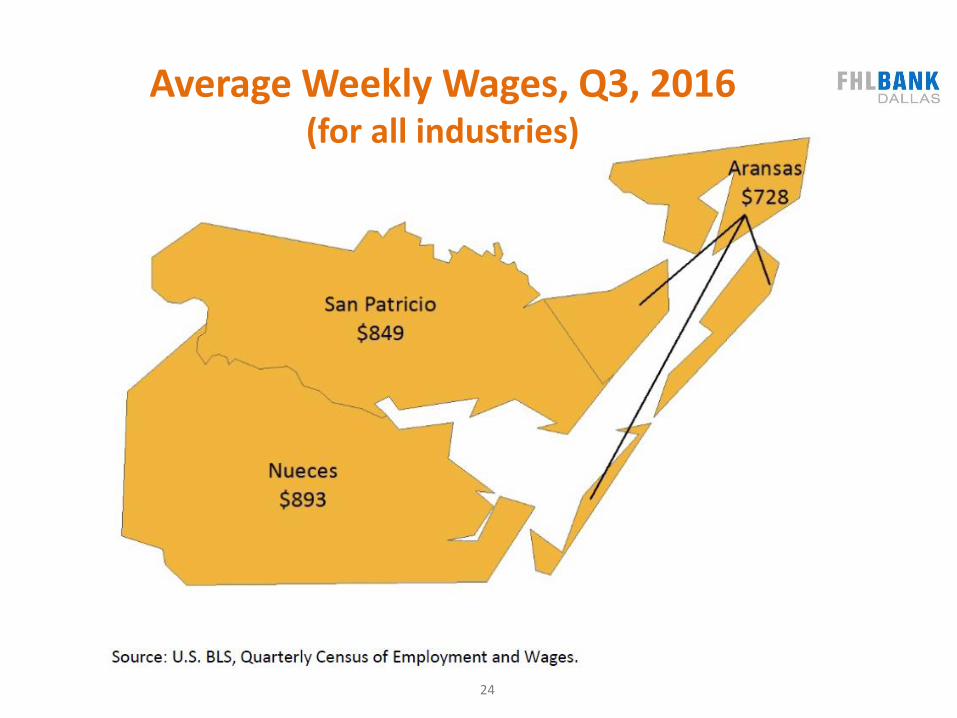
Average Weekly Wages, Q3, 2016(for all industries)

25
Equifax Subprime Credit population, Q4 2016
https://geofred.stlouisfed.org/map
San Patricio: 39%
Percentage of population sample with a credit score below 660

26
Equifax Subprime Credit population, Q4 2016
https://geofred.stlouisfed.org/map
Multi-family Rental Housing could be more important
Percentage of population sample with a credit score below 660

27
Fed Moves
28
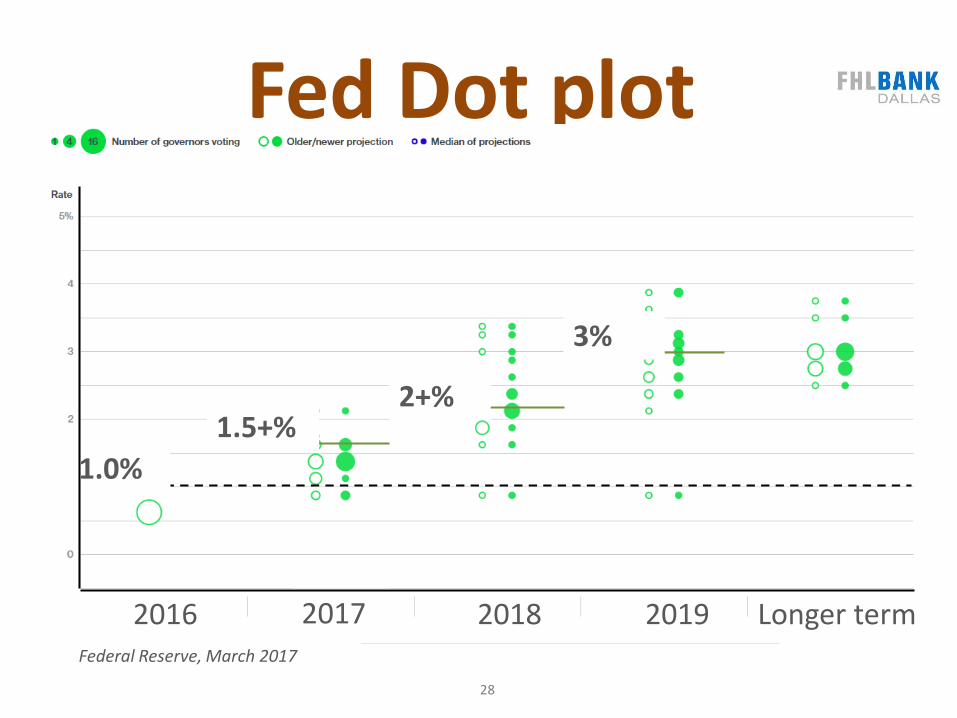
Fed Dot plot
2016 2017 2018 2019 Longer term
1.5+%2+%
3%
1.0%
Federal Reserve, March 2017

29
10%
38%
52%
70%
76%
82%
0%
10%
20%
30%
40%
50%
60%
70%
80%
90%
5/3/2017 6/14/2017 7/26/2017 9/20/2017 11/1/2017 12/13/2017
Probability of Fed Hikes
Hike # 1
July

30
9%
37%
53%
70%
77%
81%
0%
8%
22%
38%
47%
54%
0% 0%3%
12%
20%
26%
0%
10%
20%
30%
40%
50%
60%
70%
80%
90%
5/3/2017 6/14/2017 7/26/2017 9/20/2017 11/1/2017 12/13/2017
Hike # 2
July December
Probability of Fed Hikes

31
-
0.020
0.040
0.060
0.080
0.100
0.120
0.140
0.160
0.180
0.200
0.220
0.240
0.260
0.280
1.10
1.35
1.60
1.85
2.10
2.35
2.60
2.85
J-16 M-16 M-16 J-16 A-16 O-16 N-16 J-17 M-17 A-17
10 year TreasuryIs Copper and Gold hiding something?
10 Year treasury

32
0.140
0.150
0.160
0.170
0.180
0.190
0.200
0.210
0.220
0.230
0.240
1.10
1.35
1.60
1.85
2.10
2.35
2.60
2.85
J-16 M-16 M-16 J-16 A-16 O-16 N-16 J-17 M-17 A-17
10 year Treasury HGA comdty/XAU Curncy ratio
Copper/Gold Ratio
10 Year treasury
Is Copper and Gold hiding something?

33
3/27/2017, 2.359
y = 14.301x - 0.7167R² = 0.8812
1.00
1.10
1.20
1.30
1.40
1.50
1.60
1.70
1.80
1.90
2.00
2.10
2.20
2.30
2.40
2.50
2.60
2.70
2.80
0.150 0.155 0.160 0.165 0.170 0.175 0.180 0.185 0.190 0.195 0.200 0.205 0.210 0.215 0.220 0.225 0.230 0.235 0.240
10 Y
ear
Trea
sury
Rat
e
Copper to Gold Price ratio
High Correlation

34
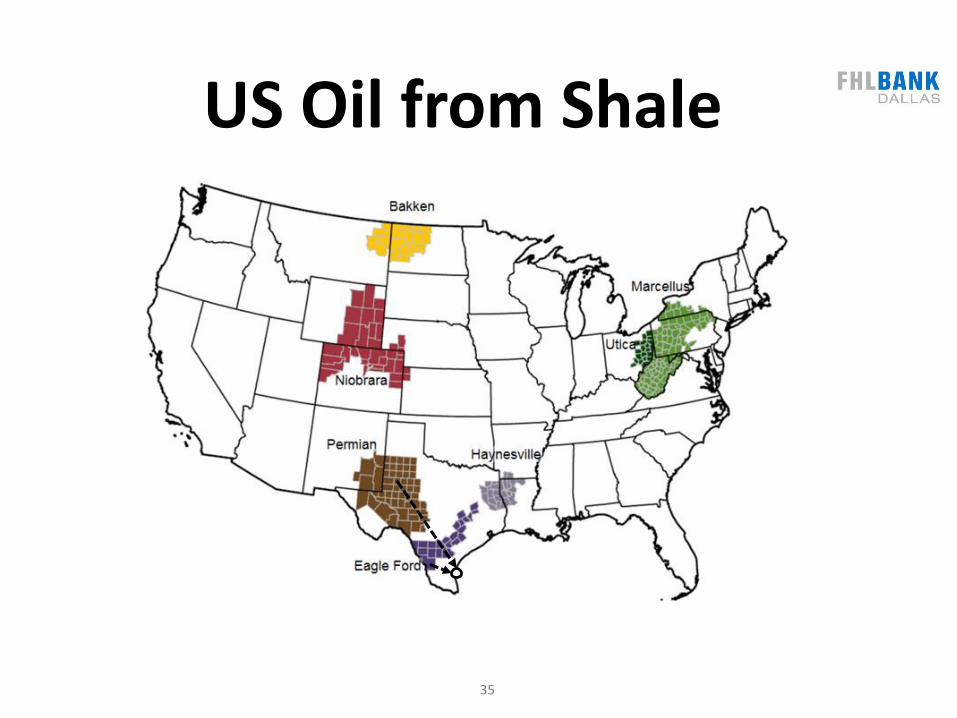
US Oil from Shale
35

WTI stabilizing around $50
$48
36
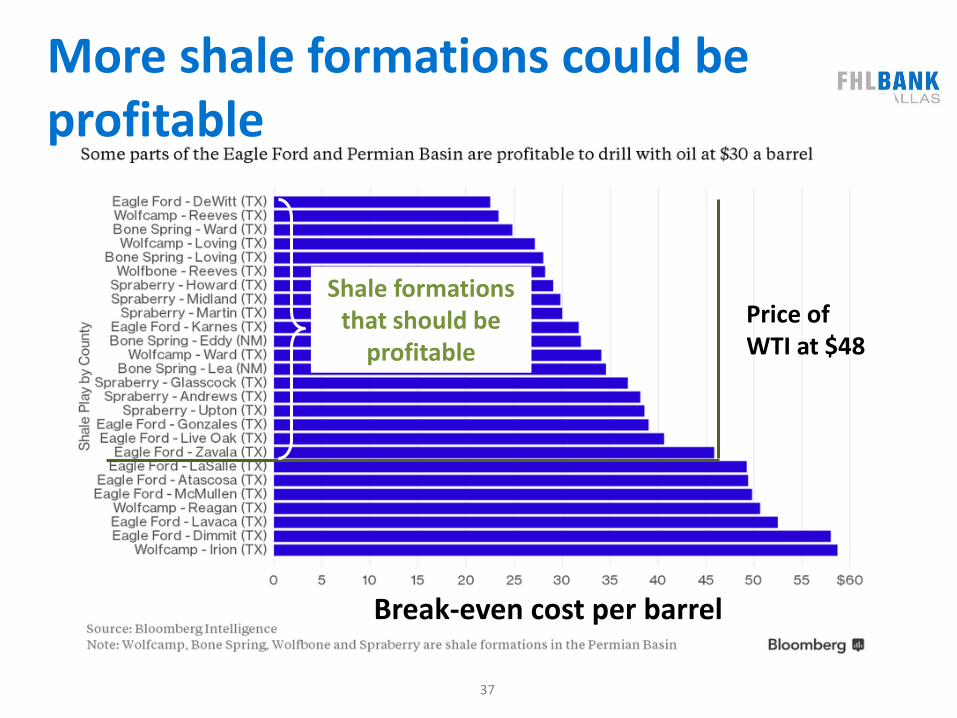
Price of WTI at $48
More shale formations could be profitable
Shale formations that should be
profitable
37
Break-even cost per barrel

39

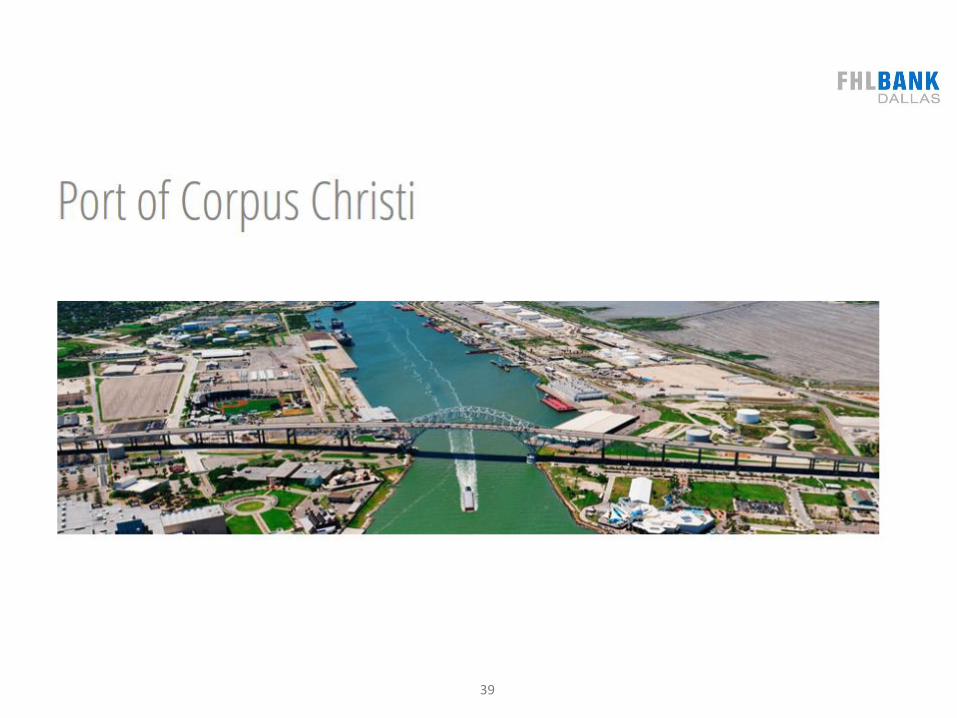
40
• 70 miles south of the shale play • Access to
• natural gas refining• Manufacturing • Agriculture industries
• Quick access to the Gulf of Mexico and the entire United States inland waterway system
• Access to overland transportation and direct connections to railroads

41
Port Corpus Christi renews agreement with Panama Canal
AuthorityDec 19, 2016
http://www.bizjournals.com/sanantonio/news/2016/12/19/port-corpus-christi-renews-panama-canal-agreement.html

42
• Seamless steel pipe manufacturing facility on a 253-acre site east of Gregory, Texas.
• Tianjin Pipe (Group) Corporation is planning to invest in excess of $1 billion through TPCO America
http://tpcoamerica.com/about-us.html
Local Economic Activity

43
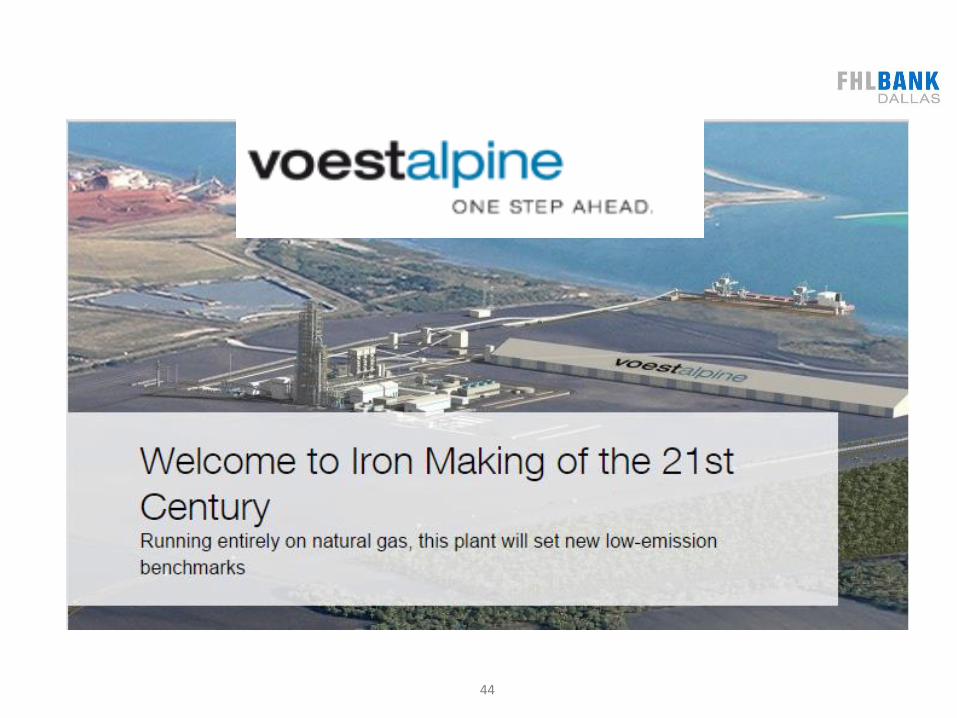
44

45
http://af.reuters.com/article/energyOilNews/idAFL2N1GZ29E
HOUSTON, March 22 (Reuters)
• Royal Dutch Shell plc, Chevron Corp and Exxon Mobil Corp bid in a government auction
• Prices up 76 percent over a year ago• The auction of offshore oil and gas parcels
received nearly $275 million in high bids, compared with $156.4 million a year ago.
Gulf of Mexico off-shore oil bids increase in price

46
• fuelfix.com/blog/2017/03/02/730-mile-epic-permian-to-corpus-pipeline-in-the-works/
Permian-to-Corpus pipeline in the works
• Plan to build a 730-mile-long crude oil and condensate pipeline from West Texas to Corpus Christi
• Will be operational by the first quarter of 2019
• From points in Permian Basin to an affiliate’s terminal in the Port of Corpus Christi

47
Widened Panama
canal
Pipelines from
Permian Basin
Proximity to
Population growth areas
Proximity to Shale play
Off-shore Energy
play
Inland Access for
Goods
Jigsaw pieces
fit well

Originally it was energy (whale oil)
from water..
From 2015 “Heart of the Sea” Movie
Sometime in 1850s

Old Thomas Nickerson: You know, I heard a man from Pennsylvania drilled a hole in the ground recently and found oil. That can't be true.Herman Melville: I heard it, too.
Old Thomas Nickerson:
Oil from the ground! Fancy that.
From 2015 “Heart of the Sea” Movie
In 1880s, whaling industry was the fifth largest sector of the
economy
https://www.theatlantic.com/business/archive/2012/02/the-spectacular-rise-and-fall-of-us-whaling-an-innovation-story/253355/
Later it was energy (petroleum)
from the earth

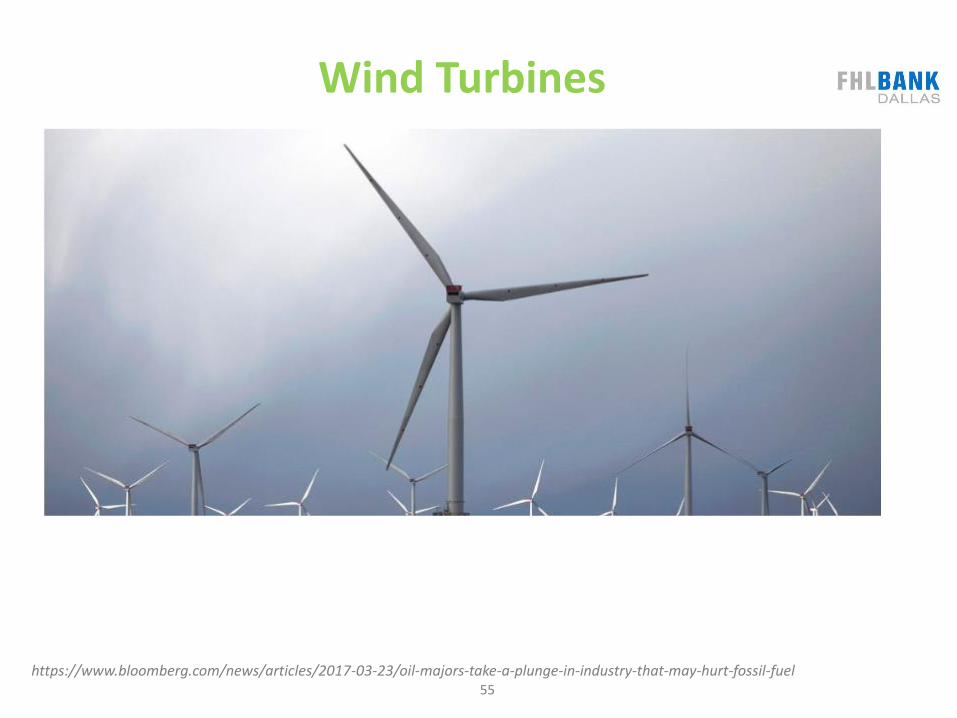
Could it also be from the wind?

54
Wind Power
https://www.eia.gov/state/maps.php?v=Renewable
Texas leads the nation in wind-powered generation
55
Wind Turbines
https://www.bloomberg.com/news/articles/2017-03-23/oil-majors-take-a-plunge-in-industry-that-may-hurt-fossil-fuel

56
Big Oil uses Rigs as Wind Turbines
https://www.bloomberg.com/news/articles/2017-03-23/oil-majors-take-a-plunge-in-industry-that-may-hurt-fossil-fuel
North Sea

… and energy from the eternal fire?

58
Solar Energy
https://www.eia.gov/state/maps.php?v=Renewable
North Carolina
California ?

Solar Energy
59
If we can
capture the solar energy hitting the earth
for 15 seconds each day
then
we can have as much energy as humanity uses in an entire day
There are 86,400 seconds in a daySource: Scientific American

Solar Energy
60
If we can
capture the solar energy hitting the earth
for 15 seconds each day
then
we can have as much energy as humanity uses in an entire day
There are 86,400 seconds in a daySource: Scientific American

61
dollars per watt
of
solar photovoltaic cells
has reduced
7% annually over last 30 years
Source: Scientific American
62
Population growth Projections
http://txsdc.utsa.edu/Resource
The Institute for Demographic and Socioeconomic Research is part of the College of Public Policy at The University of Texas at San Antonio

0%
5%
10%
15%
20%
25%
30%
35%
40%
45%
50%
55%
60%
65%
70%
2015 2020 2025 2030 2035 2040 2045
63
% Population growth from 2015
Texas 62%
http://txsdc.utsa.edu/Resource

0%
5%
10%
15%
20%
25%
30%
35%
40%
45%
50%
55%
60%
65%
70%
2015 2020 2025 2030 2035 2040 2045
64
% Population growth from 2015
Texas 62%
Corpus Christi: 19%
http://txsdc.utsa.edu/Resource

0%
5%
10%
15%
20%
25%
30%
35%
40%
45%
50%
55%
60%
65%
70%
2015 2020 2025 2030 2035 2040 2045
65
% Population growth from 2015
Texas 62%
Corpus Christi: 19%
Nueces: 22%
http://txsdc.utsa.edu/Resource

0%
5%
10%
15%
20%
25%
30%
35%
40%
45%
50%
55%
60%
65%
70%
2015 2020 2025 2030 2035 2040 2045
66
% Population growth from 2015
Texas 62%
Corpus Christi: 19%
Nueces: 22%
San Patricio: 5%
http://txsdc.utsa.edu/Resource

0%
5%
10%
15%
20%
25%
30%
35%
40%
45%
50%
55%
60%
65%
70%
2015 2020 2025 2030 2035 2040 2045
67
% Population growth from 2015
Texas 62%
Corpus Christi: 19%
Nueces: 22%
San Patricio: 5%
Challenge/Opportunity
http://txsdc.utsa.edu/Resource
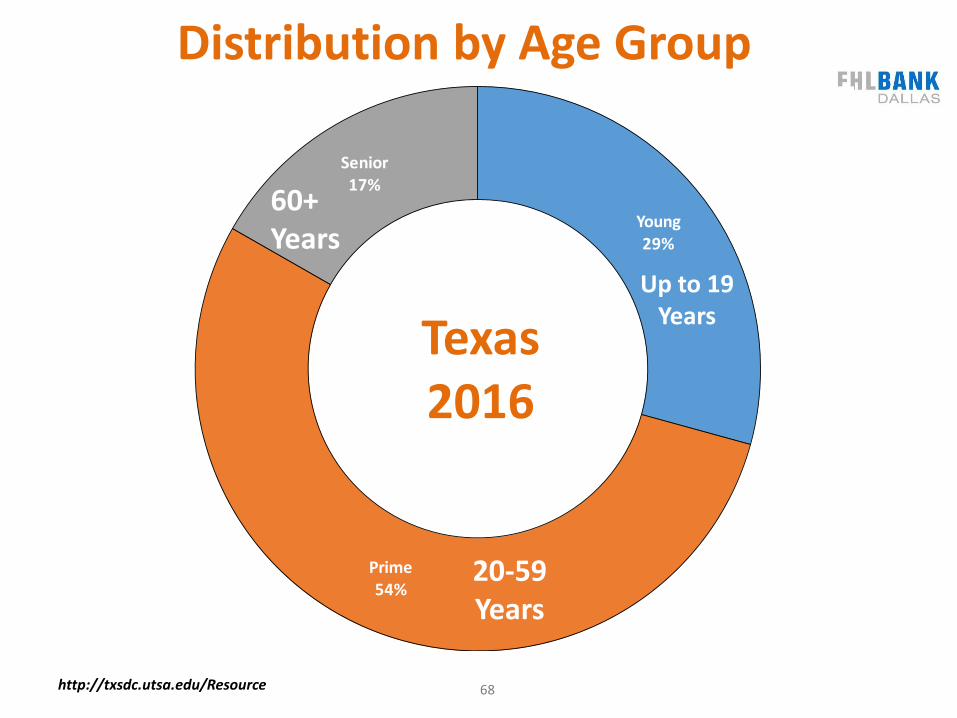
Young29%
Prime54%
Senior17%
68
Texas 2016
Up to 19 Years
20-59 Years
60+ Years
http://txsdc.utsa.edu/Resource
Distribution by Age Group

Young28%
Prime51%
Senior21%
69
Corpus Christi2016
Up to 19 Years
20-59 Years
60+ Years
http://txsdc.utsa.edu/Resource
Distribution by Age Group

Young30%
Prime49%
Senior21%
70
San Patricio
2016
Up to 19 Years
20-59 Years
60+ Years
http://txsdc.utsa.edu/Resource
Distribution by Age Group

71
How many prime-age folks are there for every young and
senior folk?
Ratio of Prime to Young + Senior

116%
105%
110%
94%
90%
95%
100%
105%
110%
115%
120%
Texas Corpus Christi Nueces San Patricio
72
Prime Age Group vs. [Young + Senior] Age Group
100%
http://txsdc.utsa.edu/Resource

73
Forecast of ratio of prime-age folks to young and senior folk

70%
75%
80%
85%
90%
95%
100%
105%
110%
115%
120%
2015 2020 2025 2030 2035 2040 2045
74
Forecast of Prime vs. [Young + Senior]
Corpus Christi
Nueces
San Patricio
Texas
75
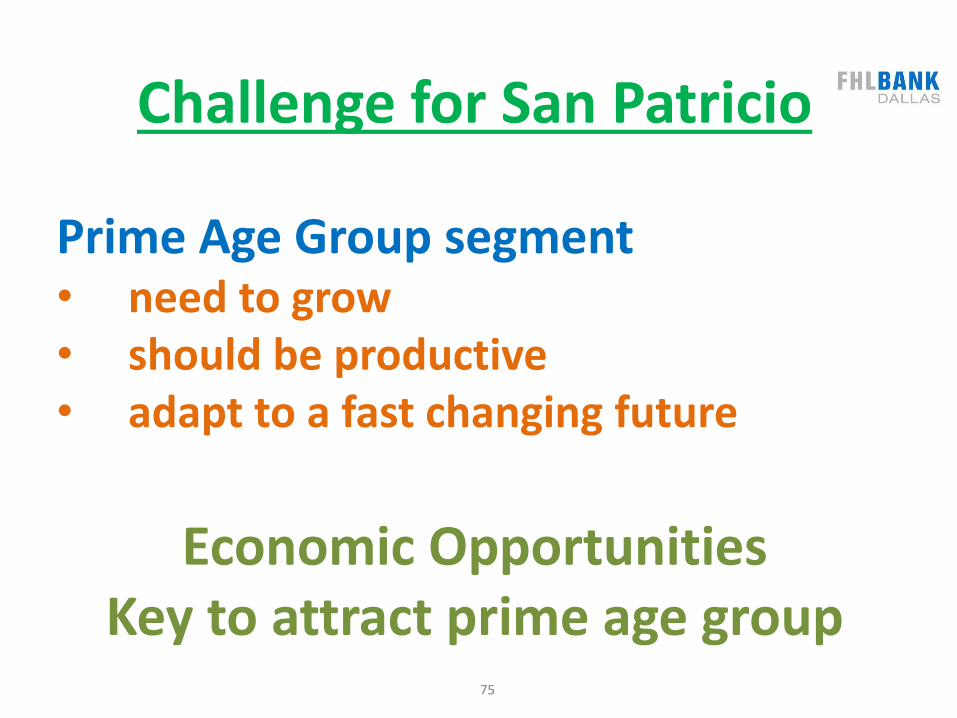
Challenge for San Patricio
Prime Age Group segment• need to grow• should be productive• adapt to a fast changing future
Economic Opportunities Key to attract prime age group

76
Digital World
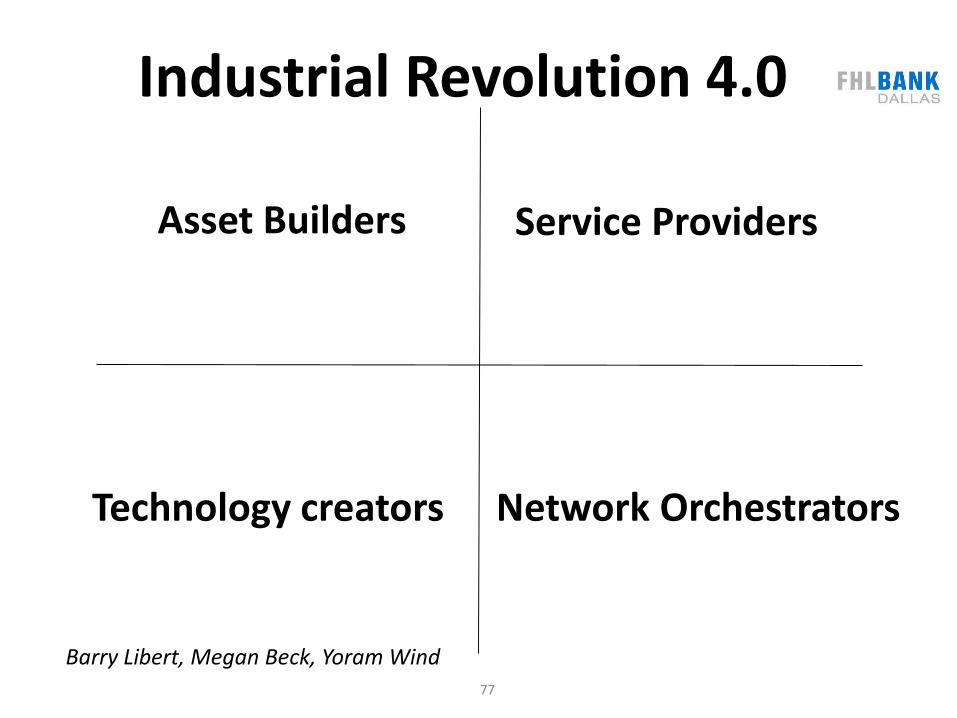
Asset Builders Service Providers
Technology creators Network Orchestrators
Barry Libert, Megan Beck, Yoram Wind
Industrial Revolution 4.0
77

Asset Builders Service Providers
Technology creators Network Orchestrators
Barry Libert, Megan Beck, Yoram Wind
Business Models
78

Asset Builders Service Providers
Technology creators Network Orchestrators
Barry Libert, Megan Beck, Yoram Wind
Business Models
79

Ownership vs Efficiency
OWNERSHIP
EFFI
CIE
NC
Y
Personal Group Public
Low
High
Novice
Specialist who manages the resource
Bureaucracy
Peer to Peer
80

Transportation Efficiency
OWNERSHIP
EFFI
CIE
NC
Y
Personal Public
Low
High
Uber
My car
Taxi
Public Bus
Group
81
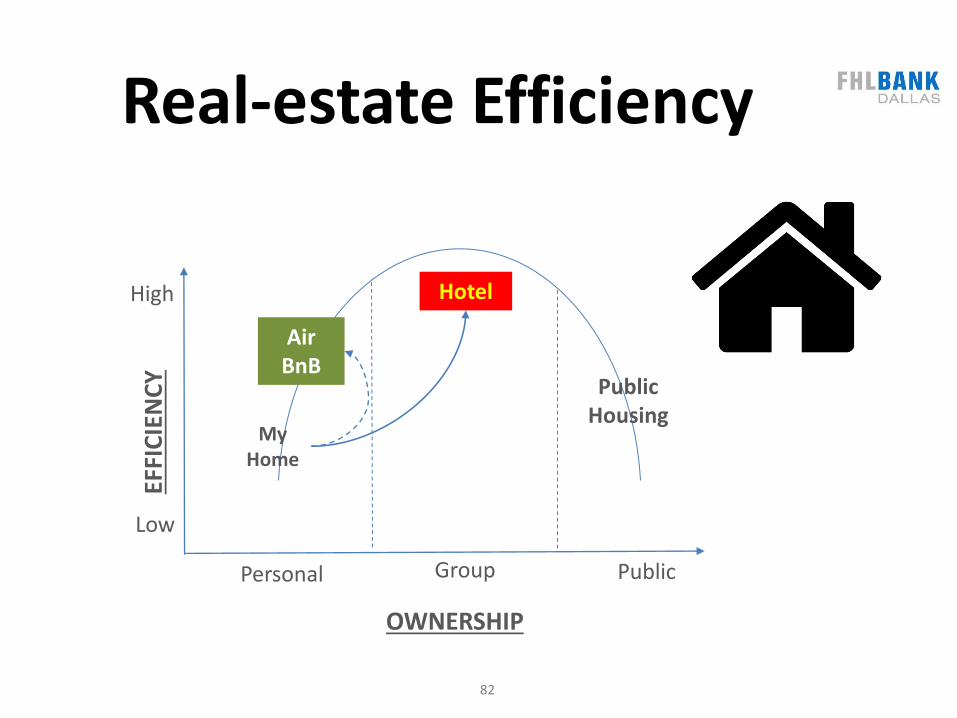
Real-estate Efficiency
OWNERSHIP
EFFI
CIE
NC
Y
Personal Public
Low
High
Air BnB
My Home
Hotel
Public Housing
Group
82
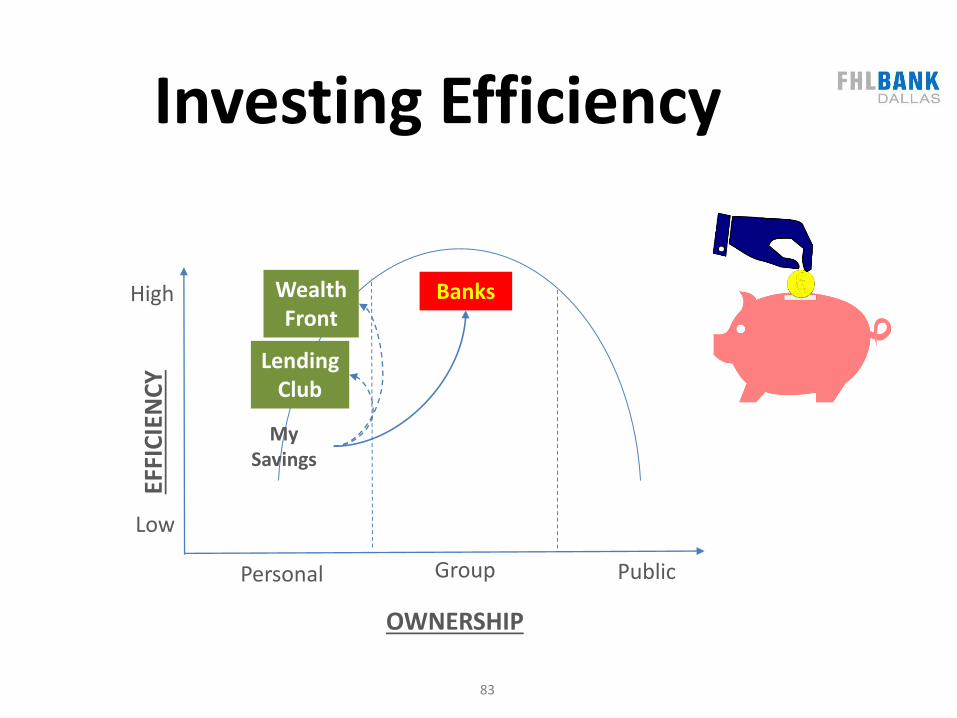
Investing Efficiency
OWNERSHIP
EFFI
CIE
NC
Y
Personal Public
Low
High
Lending Club
My Savings
BanksWealth Front
Group
83

Sharing Economy
Middle Men
84
Technology+
Today
You
85
Technology
Artificial Intelligence
+
Tomorrow
You
+
86

Technology
Artificial Intelligence
+
Near future
Imagine
87
You
88
Before 2007

89
Telephone
90
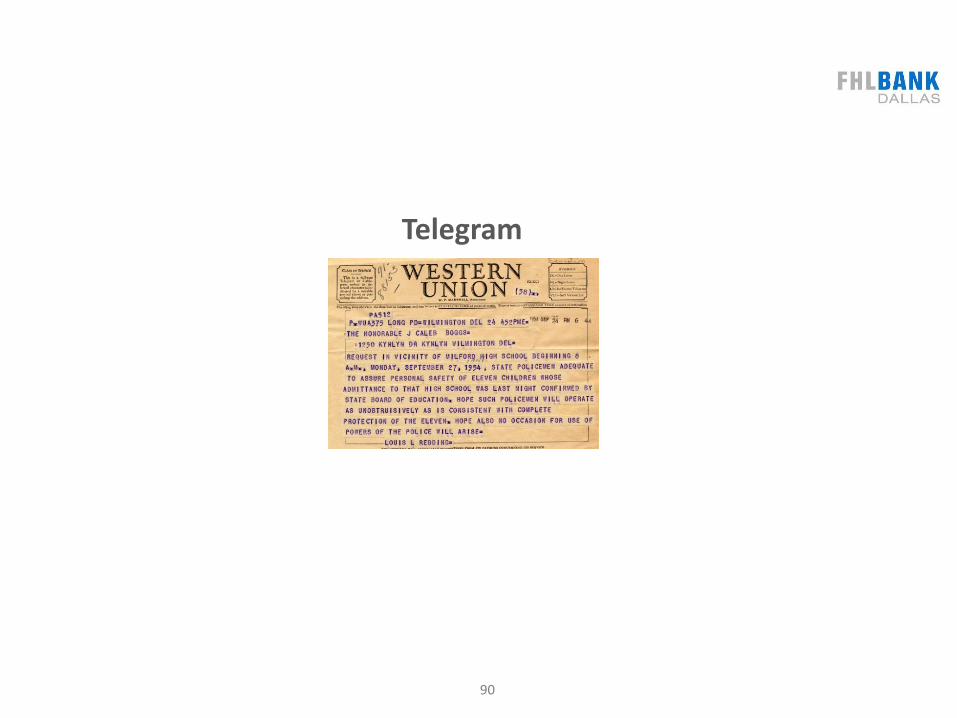
Telegram
91
Rolodex

92
Alarm Clock

93
Camera
94
Camcorder

95
Photo Album

96
Voice Recorder

97
Walkman

98
CD Player

99
Radio

100
Television

101
Compass

102
Wallet

103
Pedometer

104
Watch

105
Books

106
Flash light
107
Maps

108
Metronome

109
Karaoke Machine

110
Games

111
Computer

112
Document Scanner

113
Remote Control

114
Now

115
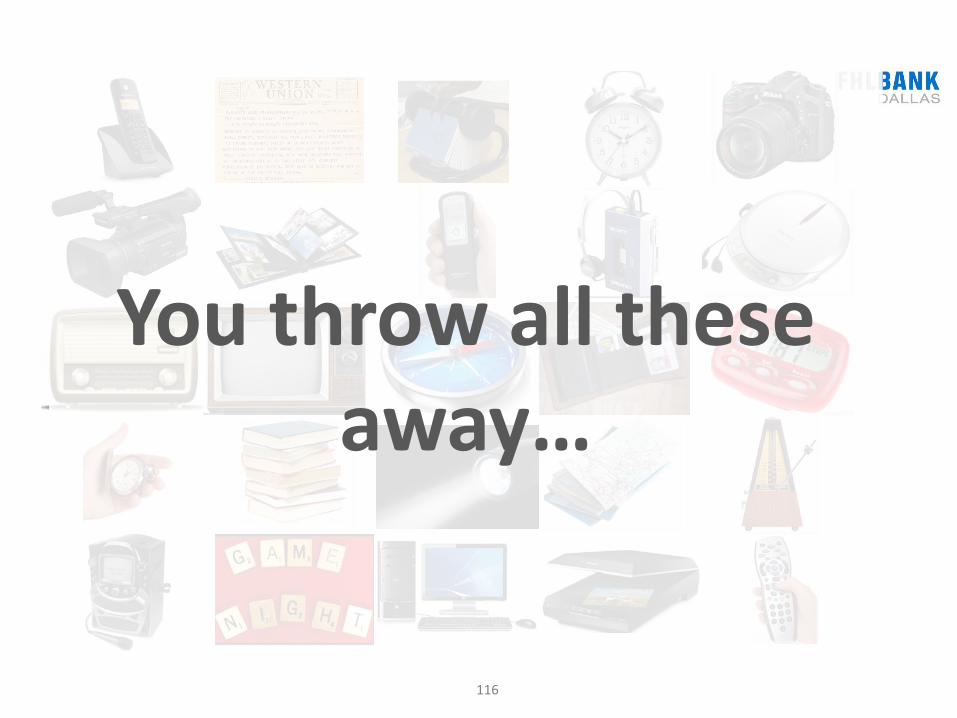
116
You throw all these away…

117
…and have one of this

118
It can be your assistant today

119
Who knows what technology can do in the fut re?

120

121

122
Uber’s self-driving truckdelivers 50,000 beers!
October, 2016
https://www.wired.com/2016/10/ubers-self-driving-truck-makes-first-delivery-50000-beers/
123
Uber’s self-driving truckdelivers 50,000 beers!
October, 2016
https://www.wired.com/2016/10/ubers-self-driving-truck-makes-first-delivery-50000-beers/

124
Society grows great when
old men plant trees whose shade
they know they shall never sit in
Anonymous Greek proverb

125
Society grows great when
men plant trees whose shade
they know they shall never sit in
Anonymous Greek proverb
126
Society grows great when
men plant trees whose shade
they know they shall never sit in
- Greek proverb

127