economic report february - central bank of nigeria economic report...embassies and development...
TRANSCRIPT

ECONOMIC REPORT
FOURTH QUARTER 2019
CENTRAL BANK OF NIGERIA

C e n t r a l B a n k o f N i g e r i a
Page ii
Economic Report Fourth Quarter 2019
The Central Bank of Nigeria Quarterly Economic Report is designed for the dissemination
of financial and economic information on the Nigerian economy on current basis. The
Report analyses developments in the financial, fiscal, real and external sectors of the
economy, as well as international economic issues of interest. The Report is directed at
a wide spectrum of readers including economists and financial analysts in government
and the private sector, as well as general readers.
Subscription to the Quarterly Economic Report is available without charge to institutions, corporations, embassies and development agencies. Individuals, on written request, can obtain any particular issue without a charge. Please direct all inquiries on the publication to the Director of Research, Central Bank of Nigeria, P.M.B. 187, Garki, Abuja, Nigeria.
The Quarterly Reports can also be freely downloaded from the CBN website: www.cbn.gov.ng

C e n t r a l B a n k o f N i g e r i a
Page iii
Economic Report Fourth Quarter 2019
Contents
1.0 Summary ....................................................................................................................................... 1
2.0 Financial Sector Developments .................................................................................................... 3
2.1 Monetary and Credit Developments ............................................................................................ 3
2.2 Currency-in-circulation (CIC) and Deposits at the CBN ................................................................. 7
2.3 Money Market Developments ...................................................................................................... 8
2.3.1 Interest Rate Developments ................................................................................................. 8
2.3.2 Commercial Papers (CPs) .................................................................................................... 10
2.3.3 Bankers’ Acceptances (BAs) ................................................................................................ 10
2.3.4 Open Market Operations .................................................................................................... 10
2.3.5 Primary Market ................................................................................................................... 10
2.3.6 Bonds Market ...................................................................................................................... 11
2.3.7 CBN Standing Facilities ........................................................................................................ 11
2.4 Deposit Money Banks’ Activities ................................................................................................. 12
2.5 Capital Market Developments .................................................................................................... 12
2.5.1 Secondary Market ............................................................................................................... 12
2.5.2 New Issues Market .............................................................................................................. 13
2.5.3 Market Capitalisation .......................................................................................................... 14
2.5.4 NSE All-Share Index ............................................................................................................. 14
3.0 Fiscal Operations ........................................................................................................................ 17
3.1 Federation Account Operations .................................................................................................. 17
3.2 The Fiscal Operations of the Three Tiers of Government ........................................................... 20
3.2.1 The Federal Government .................................................................................................... 20
3.2.2 Statutory Allocations to State Governments ...................................................................... 22
3.2.3 Statutory Allocations to Local Government Councils ......................................................... 22
4.0 Domestic Economic Conditions .................................................................................................. 23
4.1 Agricultural Sector ...................................................................................................................... 23
4.2 Agricultural Credit Guarrantee Scheme Operations ................................................................... 23
4.3 Commercial Agricultural Credit Scheme Operations .................................................................. 23
4.4 Industrial Production .................................................................................................................. 24

C e n t r a l B a n k o f N i g e r i a
Page iv
Economic Report Fourth Quarter 2019
4.5 Petroleum Sector ........................................................................................................................ 26
4.6 Consumer Prices ......................................................................................................................... 28
5.0 External Sector Developments ................................................................................................... 31
5.1 Foreign Exchange Flows .............................................................................................................. 31
5.2 Non-Oil Export Earnings by Exporters ......................................................................................... 33
5.3 Sectoral Utilisation of Foreign Exchange .................................................................................... 34
5.4 Foreign Exchange Market Developments ................................................................................... 34
5.5 Gross External Reserves .............................................................................................................. 37
6.0 Global Economic Outlooks.. ........................................................................................................ 39
6.1 Global Output.............................................................................................................................. 39
6.2 Global Inflation ............................................................................................................................ 40
6.3 Global Commodity Demand and Prices ...................................................................................... 41
6.4 International Financial Markets .................................................................................................. 41
6.5 Other International Economic Development and Meetings ....................................................... 42
6.6 Outlook for Nigeria in the First Quarter of 2020 ........................................................................ 43
Text Tables
Table 1: Growth in Monetary and Credit Aggregates .................................................................................................... 7
Table 2: Selected Interest Rates (Percent, Averages) .................................................................................................... 9
Table 3: Traded Securities on the Nigerian Stock Exchange (NSE) .............................................................................. 13
Table 4: New and Suplementary Listing on the Nigerian Stock Exchange ………………………………………………………………14
Table 5: Market Capitalisation and All Share Index (ASI) ............................................................................................ 15
Table 6: Gross Federation Account Revenue ............................................................................................................... 17
Table 7: Components of Gross Oil Revenue ................................................................................................................ 18
Table 8: Components of Gross Non-Oil Revenue ........................................................................................................ 19
Table 9: Summary of Federally-Collected Revenue Deductions and Transfers ........................................................... 20
Table 10: Federal Government Fiscal Operations ....................................................................................................... 21
Table 11: Disbursement of Credit Under the Commercial Agriculture Credit Scheme ............................................... 24
Table 12: Index of Industrial Production and Manufacturing Capacity Utilisation Rate ............................................. 26
Table 13: Average Crude Oil Prices in the International Oil Market ............................................................................ 27
Table 14: Consumer Price Index (November 2009 = 100) ........................................................................................... 29
Table 15: Headline Inflation Rate ................................................................................................................................ 29
Table 16: Foreign Exchange Flows Through the CBN .................................................................................................. 32
Table 17: Demand for and Supply of Foreign Exchange .............................................................................................. 35
Table 18: Exchange Rate Movements and Exchange Rate Premium .......................................................................... 36
Table 19: Gross External Reserves ............................................................................................................................... 38

C e n t r a l B a n k o f N i g e r i a
Page v
Economic Report Fourth Quarter 2019
Appendix Tables Table A1: Money and Credit Aggregates ....................................................................................................... 47
Table A2: Money and Credit Aggregates (Growth Rates) ......................................................................... 48
Table A3: Federal Government Fiscal Operations ........................................................................................ 49
Figures
Figure 1: Growth Rate of Narrow Money (M1) and Broad Money (M2) ..................................................... 4
Figure 2: Growth Rate of Aggregate Domestic Credit to the Economy .................................................. 6
Figure 3: Selected DMBs Interest Rates (Average) .......................................................................................... 9
Figure 4: Volume and Value of Traded Securities ......................................................................................... 13
Figure 5: Market Capitalisation and All-Share Index .................................................................................... 15
Figure 6: Components of Gross Federally-Collected Revenue ................................................................. 17
Figure 7: Gross Oil Revenue and Its Components ......................................................................................... 18
Figure 8: Gross Non-Oil Revenue and Its Components ................................................................................ 19
Figure 9: Federal Government Retained Revenue ....................................................................................... 21
Figure 10: Federal Government Expenditure .................................................................................................. 22
Figure 11: Index of Industrial Production (1990=100) .................................................................................... 26
Figure 12: Trends in Crude Oil Prices .................................................................................................................. 27
Figure 13: Consumer Price Index ........................................................................................................................ 28
Figure 14: Inflation Rate ........................................................................................................................................ 29
Figure 15: Foreign Exchange Flows Through the CBN .................................................................................. 32
Figure 16: Sectoral Utilisation of Foreign Exchange ...................................................................................... 34
Figure 17: Demand for and Supply of Foreign Exchange ........................................................................... 35
Figure 18: Average Exchange Rate Movements .......................................................................................... 36
Figure 19: Exchange Rate Premium .................................................................................................................. 37
Figure 20: Gross External Reserves ..................................................................................................................... 38

C e n t r a l B a n k o f N i g e r i a
Page vi
Economic Report Fourth Quarter 2019

C e n t r a l B a n k o f N i g e r i a
Page 1
Economic Report Fourth Quarter 2019
1.0 Summary1 The Bank maintained the monetary policy rate at 13.50 per cent in the period
under review. Broad money supply (M3), on quarter-on-quarter basis, grew by
4.1 per cent to N36,478.13 billion at end-November 2019, compared with 0.4
per cent and 8.1 per cent increase at the end of third quarter 2019 and fourth
quarter of 2018, respectively. The development reflected, wholly the 2.0 per
cent increase in net foreign assets, which more than offset the 1.2 and 10.6 per
cent decline in net domestic credit and other assets (net) of the banking
system, respectively. Over the level at end-December 2018, broad money
supply (M3) grew by 9.3 per cent at end-November 2019, compared with the
growth of 5.1 and 16.4 per cent at end of third quarter 2019 and fourth quarter
of 2018, respectively. The growth in (M3) reflected, wholly, the 28.8 per cent
increase in domestic credit (net), which more than offset the 22.8 per cent and
4.9 per cent decline in net foreign assets and other assets (net) of the banking
system, respectively. Narrow money supply (M1), on quarter-on-quarter basis,
fell by 1.7 per cent to N10,930.57 at end-November 2019, compared with the
decline of 0.4 per cent at the end of third quarter 2019.
Developments in banks’ deposit rates were mixed, while lending rates trended
downwards in the fourth quarter of 2019. With the exception of the average
savings and 7 days deposit rates, which rose from 3.69 per cent and 3.23 per
cent to 3.93 per cent and 3.30 per cent, respectively, all other deposit rates of
various maturities, fell from a range of 8.23 – 10.29 per cent at end-September
2019 to a range of 7.93 – 9.92 per cent at end-December 2019. The average
term deposit rate fell by 0.29 percentage point to 8.07 per cent at the end of
the review quarter.
The weighted average prime lending and maximum lending rates fell by 0.35
percentage point and 1.2 percentage point to 14.99 per cent and 29.98 per
cent at end-December 2019. Consequently, the spread between the weighted
average term deposit and maximum lending rates narrowed by 0.91
percentage point to 21.91 percentage points at the end of the review quarter.
Similarly, the margin between the average savings and maximum lending rates
narrowed by 1.44 percentage point to 26.05 percentage points at end-
December 2019.
The total value of money market assets outstanding in the fourth quarter of 2019
stood at N12.76 billion, showing an increase of 2.6 per cent, compared with the
increase of 2.9 per cent at the end of the third quarter of 2019. The
development was attributed, largely, to the 3.1 per cent increase in FGN Bonds
outstanding during the review quarter. Developments on the Nigerian Stock
Exchange (NSE) were bearish.
Federally collected revenue in the fourth quarter of 2019, fell below both the
provisional quarterly budget and receipts in the preceding quarter by 30.8 and
10.6 per cent, respectively. The development, was due, largely, to the shortfalls
in receipts from both oil and non-oil revenue components in the review quarter.
1 The November 2019 data on monetary aggregates and Fourth Quarter 2019 data on government
spending and foreign exchange flows were provisional.

C e n t r a l B a n k o f N i g e r i a
Page 2
Economic Report Fourth Quarter 2019
Provisional Federal Government retained revenue in the review quarter was
N938.72 billion, while total estimated expenditure amounted to N2,074.46 billion,
resulting in an estimated deficit of N1,135.74 billion.
Agricultural activities in the review quarter were dominated by the harvest of
cash and root crops. In the livestock sub-sector farmers engaged in the
fattening of cattle and stocking of poultry in anticipation of the end of the year
sales. The end-period headline inflation, on year-on-year basis for the fourth
quarter of 2019, stood at 11.98 per cent.
Foreign exchange inflow, through the CBN, rose by 6.1 per cent, while outflow
fell by 3.9 per cent, relative to their levels in the third quarter of 2019. Total non-
oil export proceeds received by banks fell by 37.8 per cent, compared with the
level at the end of third quarter 2019. The average naira exchange rate vis-à-
vis the US dollar depreciated at the inter-bank, BDC segment, and the I&E
Window. The average exchange rate at the ’Investors’ and ‘Exporters’ window,
the BDC and the Inter-bank segments of the market were N362.83/US$,
N359.42/US$ and N306.95/US$, respectively, in the review quarter. At US$38.07
billion, the gross external reserves fell by 6.4 per cent, compared with the level
at end of third quarter 2019.
World crude oil demand and supply were estimated at 100.95 mbd and 99.32
mbd, respectively, in the fourth quarter of 2019, compared with 100.63 mbd and
99.26 mbd demanded and supplied in the third quarter of 2019. Nigeria’s crude
oil production, including condensates and natural gas liquids, was estimated at
an average of 1.92 mbd in the review quarter, compared with 1.91 mbd in the
preceding quarter. The average price of Nigeria’s reference crude, the Bonny
Light (370 API), was US$64.87 per barrel in the fourth quarter of 2019, compared
with US$64.25 per barrel in the third quarter of 2019. Movement in oil prices were
driven, mainly, by optimism of a trade agreement between the US and China,
as well as the improved outlook for global oil demand amid better-than-
expected economic performance of some major economies in the review
period.
Major international developments and meetings of importance to the domestic
economy in the review quarter included: The meeting of the Ministers of
Finance and Central Bank Governors Presidential Task Force on the ECOWAS
Single Currency took place in Abuja, and a team from Moody’s Ratings Agency
visited the CBN on November 7, 2019, as part of Nigeria’s 2019 Review of
Sovereign Credit Rating Exercise from November 5 – 8, 2019.

C e n t r a l B a n k o f N i g e r i a
Page 3
Economic Report Fourth Quarter 2019
2.0 Financial Sector Developments2 The Bank maintained its monetary policy stance in the review period,
keeping the Monetary Policy Rate at 13.50 per cent. Over the level at
end-September 2019, broad money supply (M3), grew by 4.1 per cent
at end-November 2019, reflecting, wholly the 2.0 per cent increase in
net foreign assets of the banking system. Narrow money supply (M1)
fell by 1.7 per cent, due, largely, to 3.8 per cent decline in its demand
deposits component. The value of money market assets outstanding
rose above the level in the preceding quarter. Activities on the
Nigerian Stock Exchange (NSE) indicated bearish developments
during the fourth quarter of 2019.
2.1 Monetary and Credit Developments The Bank maintained its monetary policy stance in the review
period, retaining the Monetary Policy Rate at 13.50 per cent.
The key monetary aggregates trended upward at end-
November 2019. Broad money supply (M3), on quarter-on-
quarter basis, grew by 4.1 per cent to N36,478.13 billion at end-
November 2019, compared with 0.4 per cent and 8.1 per cent
increase at end of third quarter of 2019 and the corresponding
quarter of 2018, respectively. The development reflected,
wholly, the 2.0 per cent increase in net foreign assets, which
more than offset the 1.2 and 10.6 per cent decline in net
domestic credit and other assets (net) of the banking system,
respectively.
Relative to the level at end-December 2018, broad money
supply (M3) grew by 9.3 per cent at end-November 2019,
compared with the growth of 5.1 and 16.4 per cent at end of
third quarter 2019 and fourth quarter 2018, respectively. The
growth in (M3) reflected, wholly, the 28.8 per cent increase in
domestic credit (net), which more than offset 22.8 and 4.9 per
cent decline in net foreign assets and other assets (net) of the
banking system, respectively.
At N10,930.57, narrow money supply (M1), on quarter-on-
quarter basis, fell by 1.7 per cent at end-November 2019,
compared with the decline of 0.4 per cent at the end of third
quarter 2019, but was in contrast to the 9.2 per cent growth at
end of fourth quarter of 2018. The development reflected
2 The monetary aggregate numbers used for the third quarter 2019 report are provisional.
Growth in monetary
aggregates was
significant in the
review period.

C e n t r a l B a n k o f N i g e r i a
Page 4
Economic Report Fourth Quarter 2019
wholly, the 3.8 per cent decline in demand deposits of the
banking system. Over the level at end-December 2018, narrow
money supply (M1) fell by 7.0 per cent at end-November 2019,
compared with the decline of 5.4 per cent at end-September
2019, but contrasted with the 5.2 per cent growth at end-
December 2018, reflecting the 6.0 and 7.2 per cent fall in
currency outside banks and the demand deposits,
respectively.
Relative to the level at end-September 2019, quasi-money
grew by 5.7 per cent to N17,484.80 billion at end-November
2019, compared with 3.5 per cent at the end of fourth quarter
2018, but in contrast to the decline of 1.1 per cent at the end
of third quarter 2018. The development reflected, wholly, the
increase in time and savings deposits of commercial banks.
Over the level at end-December 2018, quasi-money grew by
14.2 per cent at end-November 2019, compared with the 8.1
per cent growth at end-September 2019. The development
was due to the rise in time, savings and foreign currency
deposits of commercial banks. (Figure 1, Table 1).
Figure 1: Growth Rate of Narrow Money (M1) and Broad Money (M3)3
Source: CBN
3 QM1 and QM2 represent quarter-on-quarter changes, while CM1 and CM2
represent cumulative changes (year-to-date) in narrow and broad money supply,
respectively.
-8
-6
-4
-2
0
2
4
6
8
10
12
-10
-5
0
5
10
15
20
Q4-
17
Q1-
18
Q2-
18
Q3-
18
Q4-
18
Q1-
19
Q2-
19
Q3-
19
No
vem
ber
-19
Qu
arte
rly
(%)
Cu
mu
lati
ve (
%)
QM1 (RHS) QM2 (RHS) CM1 (LHS) CM2 (LHS)
C e n t r a l B a n k o f N i g e r i a
Page 5
Economic Report Fourth Quarter 2019
Aggregate credit to the domestic economy (net), on quarter-
on-quarter basis, fell by 1.2 per cent to N35,513.08 billion at end
November 2019, in contrast to the 11.1 per cent and 4.4 per
cent growth at the end of third quarter 2019 and fourth quarter
of 2018, respectively, reflecting, wholly, the 12.9 per cent
decrease in claims on the Federal Government. Over the level
at end-December 2018, aggregate credit to the domestic
economy grew by 28.8 per cent at end-November 2019,
compared with the 30.3 and 6.3 per cent growth at the end of
third quarter 2019 and fourth quarter of 2018, respectively. The
development reflected, 87.0 and 16.3 per cent increase in net
claims on the Federal Government and claims on the private
sector, respectively.
Net claims on the Federal Government declined by 12.9 per
cent to N9,100.34 billion at end-November 2019, in contrast to
the growth of 37.8 per cent and 41.4 per cent at the end of
third quarter 2019 and fourth quarter of 2018, respectively. The
development reflected, largely, decreased holdings of
government securities by the CBN in the review period. Relative
to the level at end-December 2018, claims on the Federal
Government grew by 87.0 per cent at end-November 2019,
compared with the growth of 114.8 per cent and 33.7 per cent
at end of third quarter 2019 and fourth quarter of 2018,
respectively.
On quarter-on-quarter basis, banking system’s credit to the
private sector rose by 3.6 per cent to N26,412.74 billion at end-
November 2019, compared with the growth of 2.9 per cent at
end of third quarter 2019, but contrasted with the decline of 1.1
per cent at the end of fourth quarter of 2018. The development
was attributed to 2.6 per cent and 1.1 per cent increase in
claims on the core private sector, and claims on State and
Local Governments, respectively.
Over the level at end-December 2018, banking system’s credit
to the private sector increased by 16.3 per cent at end-
November 2019, compared with 12.2 per cent and 1.9 per cent
growth at end of third quarter 2019 and fourth quarter of 2018,
respectively (Figure 2, Table 1).
Banking system’s
credit to the Federal
Government fell in the
review period.

C e n t r a l B a n k o f N i g e r i a
Page 6
Economic Report Fourth Quarter 2019
Figure 2: Growth Rate of Aggregate Domestic Credit to the Economy4
Source: CBN
Foreign assets (net) of the banking system grew by 2.0 per cent
to N14,194.60 billion at end-November 2019, in contrast to the
24.7 per cent and 2.2 per cent decline at the end of third
quarter 2019 and fourth quarter of 2018, respectively. The rise in
NFA, relative to the level in the preceding quarter, was as a
result of the increase in foreign asset holdings of the banking
system. Over the level at end-December 2018, net foreign
assets of the banking system fell by 22.8 per cent at end-
November 2019, compared with the decline of 24.4 per cent at
end of third quarter 2019. It however, contrasted with the
increase of 18.5 per cent in the fourth quarter of 2018.
At end-November 2019, other assets (net) of the banking
system rose by 10.6 per cent to negative N13,229.56 billion,
compared with 6.9 per cent and 12.2 per cent increase at the
end of third quarter 2019 and fourth quarter of 2018,
respectively. The development was due to the decrease in
unclassified assets of the CBN and commercial banks. Over the
level at end-December 2018, other assets (net) of the banking
system fell by 4.9 per cent at end-November 2019, compared
with the 17.4 per cent decline at the end of third quarter 2019.
4 QCP, QCG and QAC represent quarter-on-quarter changes, while CCP, CCG and
CAC represent cumulative changes (year-to-date) in credit to the private sector,
credit to the government and aggregate domestic credit, respectively.
-40
-20
0
20
40
60
80
-40
-20
0
20
40
60
80
100
120
140
Q4-
17
Q1-
18
Q2-
18
Q3-
18
Q4-
18
Q1-
19
Q2-
19
Q3-
19
No
v-1
9
Qu
arte
rly
(%)
Cu
mu
lati
ve (
%)
QCP (RHS) QCG (RHS) QAC (RHS)
CCP (LHS) CCG (LHS) CAC (LHS)
Foreign assets (net)
of the banking
system rose at the
end of the review
period.

C e n t r a l B a n k o f N i g e r i a
Page 7
Economic Report Fourth Quarter 2019
Table 1: Growth in Monetary and Credit Aggregates (Per cent) Over the
Preceding Quarter*
Sep-18 Dec-18 Mar-19 Jun-19 Sep-19 Nov-19
Domestic Credit (Net) 3.3 4.4 15.1 1.9 11.1 -1.2
Claims on Federal Government (Net) 4.7 41.4 59.1 -2.1 37.8 -12.9
Claims on Private Sector 3.1 -1.1 5.7 3.2 2.9 3.6
Claims on Other Private Sector 5.3 -0.3 5.6 3.7 2.7 2.6
Foreign Assets (Net) 2.6 -2.2 -8.6 9.8 -24.7 2.0
Other Assets (Net) -1.3 -12.2 -16.7 8.1 -6.9 -10.6
Broad Money Supply (M3) 5.1 8.1 1.4 3.2 0.4 4.1
Quasi-Money 4.9 3.5 3.8 5.3 -1.1 5.7
Narrow Money Supply (M1) 0.5 9.2 -6.9 2.0 -0.4 -1.7
Memorandum Items:
Reserve Money (RM) 7.0 4.9 1.6 11.6 -6.4 5.0 Source: CBN
*figures are provisional
2.2 Currency-in-circulation and Deposits at the CBN
Currency-in-circulation (CIC) at end-November 2019, rose by
9.9 per cent to N2,203.27 billion, in contrast to the decline of 0.4
per cent at end of third quarter 2019. The development, relative
to the level in the preceding quarter, reflected, mainly, the
increase in its currency outside banks component, and
seasonal factors.
Total deposits at the CBN amounted to N14,350.54 billion at
end-November 2019, indicating an increase of 3.6 per cent
above the level at end of third quarter 2019. The rise was
attributed to 14.3 per cent and 3.1 per cent increase in the
deposits of the Federal Government and the commercial
banks, respectively. Of the total deposits at the CBN, the shares
of the Federal Government, banks and private sector deposits
were 47.4 per cent, 35.9 per cent and 16.7 per cent,
respectively.
Reserve money grew by 5.0 per cent to N7,353.36 billion at end-
November 2019, in contrast to the decrease of 13.5 per cent at
the end of third quarter of 2019. The development reflected the
increase in federal government and banks’ deposits with the
CBN.
Reserve money (RM)
rose in the review
period.

C e n t r a l B a n k o f N i g e r i a
Page 8
Economic Report Fourth Quarter 2019
2.3 Money Market Developments Developments in the money market were stable, as the market
was largely liquid during the review quarter. Activities that
boosted liquidity were mainly inflow from repayment of matured
CBN bills, maturing Federal Government (FGN) Bonds and
Nigerian Treasury Bills (NTBs), as well as fiscal disbursements to the
three tiers of Government, while provisioning and settlement of
foreign exchange purchases, auctioning of CBN bills, FGN Bonds
and Nigerian Treasury Bills (NTBs) moderated liquidity.
Total value of money market assets outstanding in the fourth
quarter of 2019 stood at N13.04 billion, showing an increase of
4.8 per cent, compared with the increase of 2.9 per cent at the
end of the third quarter of 2019. The development was
attributed, largely, to the 6.2 per cent increase in FGN Bonds
outstanding during the review quarter.
2.3.1 Interest Rates Developments
Interest rates moved in tandem with the level of banking system
liquidity during the review period. Developments in banks’
deposit rates were mixed, while lending rates trended
downwards in the fourth quarter of 2019. Apart from the
average savings and 7 days deposit rates which rose from 3.69
per cent and 3.23 per cent to 3.93 per cent and 3.30 per cent,
respectively, all other deposit rates of various maturities, fell
from a range of 8.23 – 10.29 per cent at end-September 2019
to a range of 7.93 – 9.92 per cent at end-December 2019. The
average term deposit rate fell by 0.29 percentage point to 8.07
per cent at the end of the review quarter.
The weighted average prime lending and maximum lending
rates fell by 0.35 percentage point and 1.2 percentage point
to 14.99 per cent and 29.98 per cent at end-December 2019.
Consequently, the spread between the weighted average
term deposit and maximum lending rates narrowed by 0.91
percentage point to 21.91 percentage points at the end of the
review quarter. Similarly, the margin between the average
savings and maximum lending rates narrowed by 1.44
percentage point to 26.05 percentage points at end-
December 2019.
The money market
was largely liquid in
the review period.
Interest rates moved in
tandem with the level
of banking system
liquidity during the
review period.

C e n t r a l B a n k o f N i g e r i a
Page 9
Economic Report Fourth Quarter 2019
At the inter-bank segment, the weighted average inter-bank
call rate, which stood at 8.80 per cent at end-September 2019,
fell significantly by 5.4 percentage points to 3.40 per cent at
end-December 2019. Similarly, the Nigeria inter-bank offered
rate (NIBOR), for the 30-day tenor, fell from 12.60 per cent in the
preceding quarter to 12.31 per cent at end-December 2019.
Also, the weighted average rate at the Open-Buy-Back (OBB)
segment fell significantly by 4.5 percentage points to 5.77 per
cent (Figure 3, Table 2).
Figure 3: Selected DMBs Interest Rates (Average)
Source: CBN
Table 2: Selected Interest Rates (Per cent, Averages)
Q4-17 Q1-18 Q2-18 Q3-18 Q4-18 Q1-19 Q2-19 Q3-19 Q4-19
Average Term Deposits 8.77 8.34 8.66 8.51 8.61 8.86 8.73 8.36 8.07
Prime Lending 17.66 17.31 17.03 16.69 16.45 15.67 15.80 15.34 14.99
Interbank 24.02 18.98 10.29 5.83 8.45 14.32 8.38 8.80 3.40
Maximum Lending 31.30 31.61 31.34 30.93 30.66 30.62 31.04 31.18 29.98
Source: CBN
0.0
2.5
5.0
7.5
10.0
12.5
15.0
17.5
20.0
22.5
25.0
0.02.55.07.5
10.012.515.017.520.022.525.027.530.032.535.0
Q4-17 Q1-18 Q2-18 Q3-18 Q4-18 Q1-19 Q2-19 Q3-19 Q4-19
Per
cen
t p
er A
nn
um
Per
cen
t p
er A
nn
um
Prime Interbank Maximum Average Term Deposits (RHS)
Inter-bank call rate
fell in Q4 2019

C e n t r a l B a n k o f N i g e r i a
Page 10
Economic Report Fourth Quarter 2019
2.3.2 Commercial Paper (CP)
Commercial Paper (CP) outstanding held by banks stood at
N35.28 billion at the end of the fourth quarter of 2019, showing
a decrease of 4.4 per cent below the N39.91 billion recorded
at the end of the preceding quarter. The development was
due, largely, to the fall in investments in CP by merchant banks
during the review quarter. Thus, CP constituted 0.27 per cent of
the total value of money market assets outstanding in the
review period, compared with 0.30 per cent, recorded in the
preceding quarter.
2.3.3 Bankers’ Acceptances (BAs)
Bankers’ Acceptances (BAs) outstanding stood at N5.84 billion
in the fourth quarter of 2019, showing a significant increase of
302.8 per cent above the level at the end of the preceding
quarter. The development was attributed, wholly, to a rise in
investment in BAs by commercial banks during the review
period. Consequently, BAs accounted for 0.04 per cent of the
total value of money market assets outstanding at the end of
the fourth quarter of 2019, compared with 0.02 per cent at the
end of the third quarter of 2019.
2.3.4 Open Market Operations
The Bank intervened through direct Open Market Operations
(OMO) auctions, to influence liquidity in the system during the
fourth quarter of 2019. The tenors to maturity of the instruments
ranged from 82 days to 364 days. Total amount offered,
subscribed to and allotted, stood at N3,738.61 billion, N5,875.74
billion and N3,773.76 billion, respectively. The bid rates ranged
from 10.54 per cent to 14.42 per cent, while the stop rates
ranged from 11.50 per cent to 13.40 per cent. Repayment of
matured CBN bills amounted to N6,130.25 billion, translating to
a net injection of N2,356.49 billion.
2.3.5 Primary Market
At the Government securities market, NTBs and FGN Bonds
were issued at the primary market on behalf of the Debt
Management Office (DMO), during the review period. NTBs of
91- 182- and 364-day tenors, amounting to N716.26 billion,
N3,020.41 billion and N716.26 billion were offered, subscribed to
and allotted, respectively, at the auctions held in the fourth
quarter of 2019. Total subscription and allotment at the 91-day
Banks’ holdings of
BAs increased in
Q4 of 2019.

C e n t r a l B a n k o f N i g e r i a
Page 11
Economic Report Fourth Quarter 2019
auction, were N336.10 billion and N72.43 billion, respectively.
The bid rates ranged from 3.00 per cent to 12.00 per cent, while
the stop rates ranged from 4.00 per cent to 11.08 per cent.
For the 182-day auction, total subscription and allotment were
N337.12 billion and N70.30 billion, respectively. The bid rates
ranged from 4.20 per cent to 13.00 per cent, while the stop rates
dropped from a high of 11.60 per cent to 5.00 per cent. Total
subscription and allotment at the 364-day auction were
N2,346.50 billion and N573.54 billion, respectively, with bid rates
ranging from 5.00 per cent to 17.00 per cent, while stop rates
ranged from 5.50 per cent to 13.20 per cent.
2.3.6 Bonds Market
Tranches of the 5-, 10-, and 30-year FGN Bonds were offered
for sale in the review period. The term to maturity of the bonds
ranged from 3 years 4 months to 29 years 4 months. Total
amount offered, subscribed to, and allotted were N450.00
billion, N796.77 billion and N554.00 billion, respectively. In
addition, N121.10 billion was allotted on a non-competitive
basis and N264.40 billion matured for repayment during the
review period. The bid rates on all tenors ranged from 9.00 per
cent to 15.12 per cent, while the marginal rates ranged from
11.00 per cent to 14.60 per cent. The auctions were impressive,
due to renewed investors’ confidence in the market.
2.3.7 CBN Standing Facilities The banks continued to access the CBN’s Standing Facilities to
square up their positions either by borrowing from the standing
lending facility (SLF) or depositing their excess liquidity at the
standing deposit facility (SDF) of the CBN at the end of each
business day.
Total request for the Standing Lending Facility (SLF), inclusive of
direct SLF (N949.91 billion) and Intra-day lending facilities -ILF
(N352.64 billion) that were converted to overnight repo during
the review quarter, stood at N1,302.55 billion, compared with
N6,203.28 billion in the preceding quarter.
Daily average transaction value amounted to N23.26 billion in
56 transaction days, with total interest earned at N767.13 billion,
compared with the daily average of N100.05 billion in 62
transaction days, with a total of N4.21 billion, as interest earned
Tranches of FGN Bonds
of various maturities
were offered for sale in
the Q4 of 2019.

C e n t r a l B a n k o f N i g e r i a
Page 12
Economic Report Fourth Quarter 2019
at the end of the preceding quarter.
Total standing deposit facility (SDF) granted during the review
period was N1,931.76 billion, with daily average of N32.20
billion, compared with N2,081.14 billion, in the third quarter of
2019. The cost incurred on SDF in the review quarter amounted
to N0.66 billion, compared with N0.63 billion in the preceding
quarter.
2.4 Banks’ Activities The total assets and liabilities of commercial banks stood at
N40,874.60 billion at end-November 2019, representing 3.2 per
cent increase above the level at end-September 2019. Funds
were sourced, largely, from increased unclassified and foreign
liabilities, and mobilisation of time, savings and foreign currency
deposits. The funds were used, mainly, for acquisition of
unclassified and foreign assets, and to boost reserves.
At N22,967.73 billion, banks’ credit to the domestic economy,
at end-November 2019, showed an increase of 3.8 per cent,
compared with the level at end-September 2019. The
development reflected, largely, the 4.7 per cent and 3.6 per
cent rise in claims on the Federal Government and the private
sector, respectively, in the review period.
Total specified liquid assets of the commercial banks was
N14,664.56 billion at end-November 2019, representing 60.6 per
cent of the total current liabilities. At that level, the liquidity ratio
was 2.9 percentage points and 43.3 percentage points above
the level at end-September 2019 and the stipulated minimum
ratio of 30.0 per cent, respectively. The loans-to-deposit ratio,
at 62.9 per cent, was 0.7 percentage point higher than the level
at end-September 2019, but 17.1 percentage points lower than
the prescribed maximum of 80.0 per cent.
2.5 Capital Market Developments
2.5.1 Secondary Market
Available data showed that activities on the Nigerian Stock
Exchange (NSE) were bearish during the fourth quarter of 2019,
as the All Share Index (ASI) and aggregate market capitalisation
fell at the end of the review period. The turnover volume and
value of traded securities rose by 14.4 per cent and 23.8 per
Liquidity ratio was
above the prescribed
minimum, while the
Loan-to-deposit ratio
was below the
prescribed maximum
in November 2019.

C e n t r a l B a n k o f N i g e r i a
Page 13
Economic Report Fourth Quarter 2019
cent to 18.7 billion shares and N232.41 billion, respectively, in
201,076 deals, compared with 16.3 billion shares and N187.7
billion, respectively, in 218,415 deals, recorded in the third
quarter of 2019.
Developments in the market were driven, largely, by portfolio
switch from money market to capital market, following the CBN
policy barring individuals and local corporates from investing in
OMO bills, which crashed the Treasury bill rates, amid profit-
taking, as investors took advantage of low prices, ahead of the
year-end rally (Figure 4, Table 3).
Figure 4 : Volume and Value of Traded Securities
Source: NSE
Table 3: Traded Securities on the Nigerian Stock Exchange (NSE)
Q4-17 Q1-18 Q2-18 Q3-18 Q4-18 Q1-19 Q2-19 Q3-19 Q4-19
Volume (Billion) 28.7 43.8 23.1 16.3 18.9 20.7 25.5 16.3 18.7
Value (N Billion) 339.4 439.7 359 205 211.2 208.7 303 187.7 232.41
Source: NSE
2.5.2 New Issues Market/Supplementary Listings
There were two (2) new equity listings during the review period
(Table 4).
0
50
100
150
200
250
300
350
400
450
500
0
5
10
15
20
25
30
35
40
45
50
Q4
-17
Q1
-18
Q2
-18
Q3
-18
Q4
-18
Q1
-19
Q2
-19
Q3
-19
Q4
-19
Val
ue
(N
Bill
ion
)
Vo
lum
e (B
illio
n)
Volume of traded securities (LHS) Value of securities (RHS)

C e n t r a l B a n k o f N i g e r i a
Page 14
Economic Report Fourth Quarter 2019
Table 4: New and Supplementary Listing on the Nigerian Stock Exchange
S/N Company Additional Shares (Units) Reasons Listing
1 WAPIC Insurance Plc 15.16 Billion Ordinary Shares Right Issue New Listing
2 C&I Leasing Plc 539.0 Million Ordinary Shares Right Issue New Listing
2.5.3 Market Capitalisation
The aggregate market capitalisation for all listed securities
(equities and debts) fell by 1.6 per cent to N25.9 trillion at the
end of the fourth quarter of 2019, compared with N26.3 trillion
at end-September 2019. Similarly, market capitalisation for the
equities segment declined by 3.9 per cent to N13.0 trillion and
constituted 50.1 per cent of the aggregate market
capitalisation, compared with N13.5 trillion and 51.3 per cent at
end-September 2019.
2.5.4 NSE All-Share Index
The All-Share Index, which opened at 27,630.56 at the
beginning of the quarter, fell by 2.9 per cent to 26,842.07 at
end-December 2019. The sectoral indices showed a mixed
trend in the review period. Specifically, the NSE-Lotus, NSE-Oil
and Gas, NSE-Consumer Goods, NSE-Pension, NSE-Banking,
and NSE-Insurance indices rose by 2.5 per cent, 9.7 per cent,
4.5 per cent, 6.1 per cent, 3.7 per cent and 8.5 per cent,
respectively, to 1,834.76, 262.54, 592.85, 1,054.06, 356.84 and
125.82, while the NSE-Premium, NSE-AseM and NSE-Industrial fell
by 6.8 per cent, 5.1 per cent and 0.7 per cent, to 2,116.22,
734.99 and 1,075.60, respectively, at end-December 2019.

C e n t r a l B a n k o f N i g e r i a
Page 15
Economic Report Fourth Quarter 2019
Figure 5: Market Capitalisation and All-Share Index
Source: NSE
Table 5: Market Capitalisation and All Share Index (NSE)
Q4-17 Q1-18 Q2-18 Q3-18 Q4-18 Q1-19 Q2-19 Q3-19 Q4-19
Market Capitalisation (N trillion) 22.9 24.869 23.9 22.3 21.9 22.3 25.7 26.3 25.89
All-Share Index (Equities) 38,243.19 41,504.51 38,278.55 32,766.37 31,430.50 31,041.42 29,966.87 27,630.56 26,842.07
Source: NSE
-
5,000.00
10,000.00
15,000.00
20,000.00
25,000.00
30,000.00
35,000.00
40,000.00
45,000.00
0.00
5.00
10.00
15.00
20.00
25.00
30.00
Q4-
17
Q1-
18
Q2-
18
Q3-
18
Q4-
18
Q1-
19
Q2-
19
Q3-
19
Q4-
19
Ind
ex
NB
illio
n
Market Capitalization (LHS) All-Share Index (RHS)

C e n t r a l B a n k o f N i g e r i a
Page 16
Economic Report Fourth Quarter 2019
C e n t r a l B a n k o f N i g e r i a
Page 17
Economic Report Fourth Quarter 2019
3.0 Fiscal Operations5 Federally collected revenue in the fourth quarter of 2019, fell below
both the quarterly budget and the receipts in the preceding quarter
by 30.8 per cent and 10.6 per cent, respectively. Provisional Federal
Government retained revenue in the review quarter was N938.72
billion, while total estimated expenditure amounted to N2,074.46
billion, resulting in an estimated deficit of N1,135.74 billion.
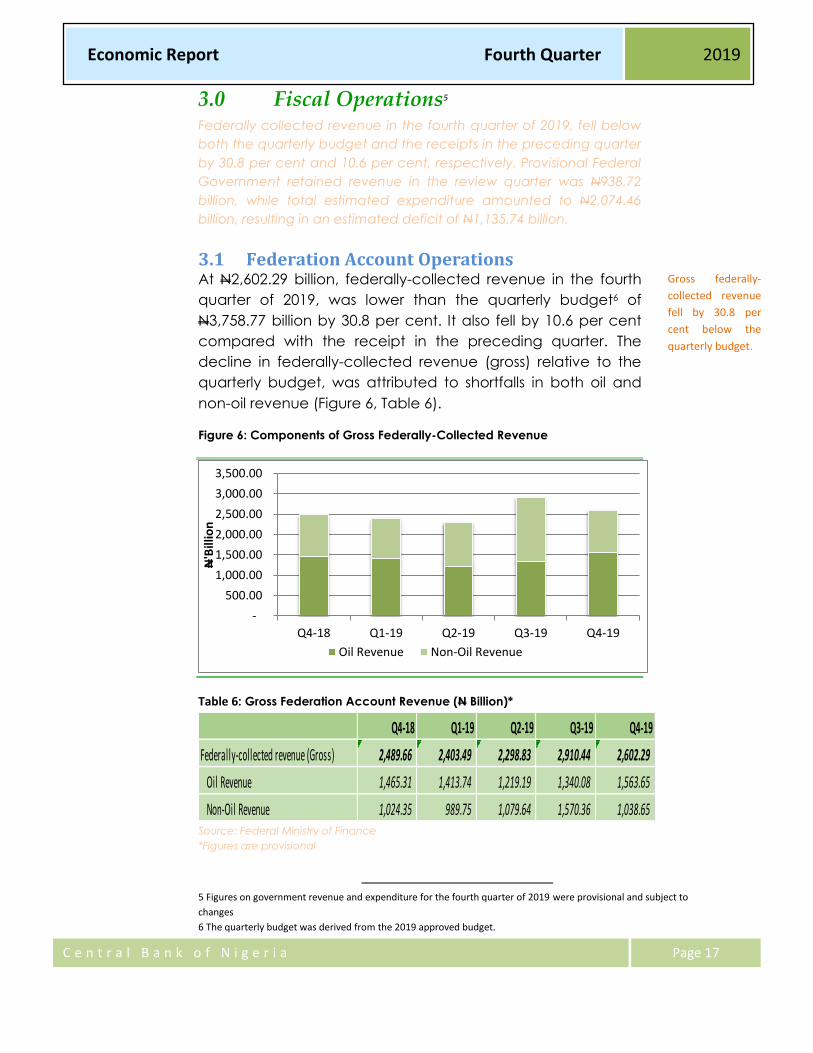
3.1 Federation Account Operations At N2,602.29 billion, federally-collected revenue in the fourth
quarter of 2019, was lower than the quarterly budget6 of
N3,758.77 billion by 30.8 per cent. It also fell by 10.6 per cent
compared with the receipt in the preceding quarter. The
decline in federally-collected revenue (gross) relative to the
quarterly budget, was attributed to shortfalls in both oil and
non-oil revenue (Figure 6, Table 6).
Figure 6: Components of Gross Federally-Collected Revenue
Table 6: Gross Federation Account Revenue (N Billion)*
Q4-18 Q1-19 Q2-19 Q3-19 Q4-19
Federally-collected revenue (Gross) 2,489.66 2,403.49 2,298.83 2,910.44 2,602.29
Oil Revenue 1,465.31 1,413.74 1,219.19 1,340.08 1,563.65
Non-Oil Revenue 1,024.35 989.75 1,079.64 1,570.36 1,038.65 Source: Federal Ministry of Finance
*Figures are provisional
5 Figures on government revenue and expenditure for the fourth quarter of 2019 were provisional and subject to
changes 6 The quarterly budget was derived from the 2019 approved budget.
-
500.00
1,000.00
1,500.00
2,000.00
2,500.00
3,000.00
3,500.00
Q4-18 Q1-19 Q2-19 Q3-19 Q4-19
N'B
illio
n
Oil Revenue Non-Oil Revenue
Gross federally-
collected revenue
fell by 30.8 per
cent below the
quarterly budget.
C e n t r a l B a n k o f N i g e r i a
Page 18
Economic Report Fourth Quarter 2019
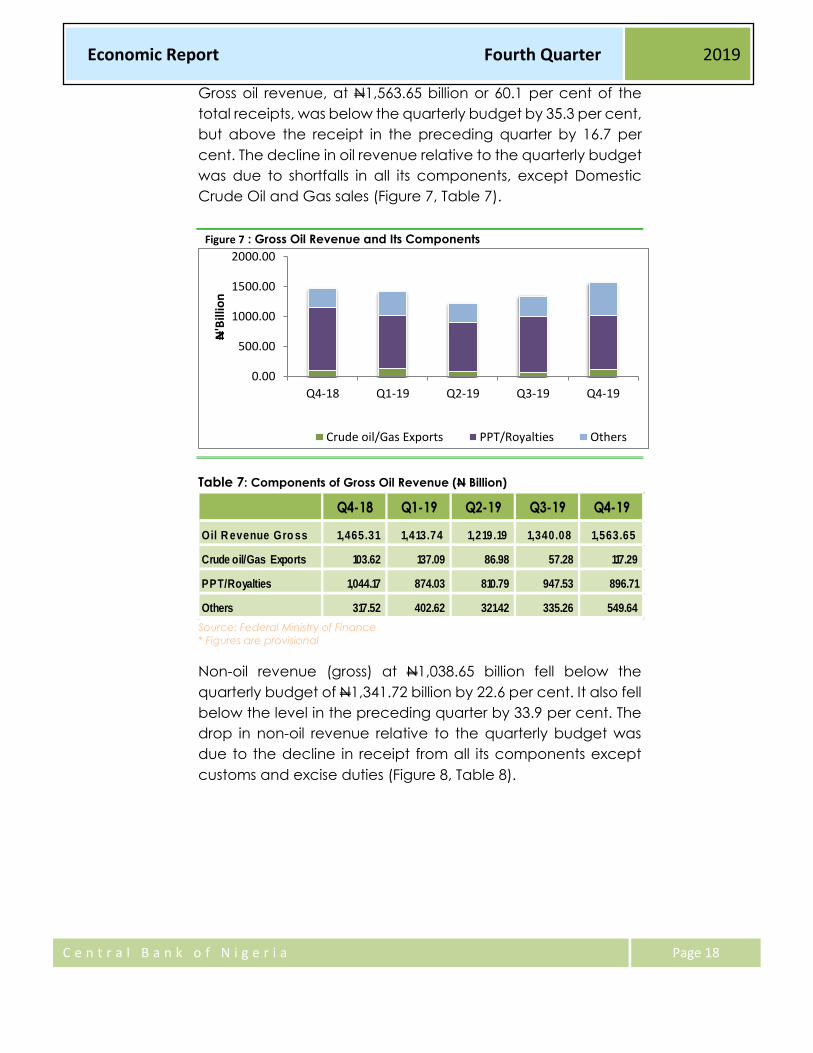
Gross oil revenue, at N1,563.65 billion or 60.1 per cent of the
total receipts, was below the quarterly budget by 35.3 per cent,
but above the receipt in the preceding quarter by 16.7 per
cent. The decline in oil revenue relative to the quarterly budget
was due to shortfalls in all its components, except Domestic
Crude Oil and Gas sales (Figure 7, Table 7).
Figure 7 : Gross Oil Revenue and Its Components
Table 7: Components of Gross Oil Revenue (N Billion)
Q4-18 Q1-19 Q2-19 Q3-19 Q4-19
Oil R evenue Gro ss 1,465.31 1,413.74 1,219.19 1,340.08 1,563.65
Crude oil/Gas Exports 103.62 137.09 86.98 57.28 117.29
PPT/Royalties 1,044.17 874.03 810.79 947.53 896.71
Others 317.52 402.62 321.42 335.26 549.64
Source: Federal Ministry of Finance
* Figures are provisional
Non-oil revenue (gross) at N1,038.65 billion fell below the
quarterly budget of N1,341.72 billion by 22.6 per cent. It also fell
below the level in the preceding quarter by 33.9 per cent. The
drop in non-oil revenue relative to the quarterly budget was
due to the decline in receipt from all its components except
customs and excise duties (Figure 8, Table 8).
0.00
500.00
1000.00
1500.00
2000.00
Q4-18 Q1-19 Q2-19 Q3-19 Q4-19
N'B
illio
n
Crude oil/Gas Exports PPT/Royalties Others

C e n t r a l B a n k o f N i g e r i a
Page 19
Economic Report Fourth Quarter 2019
Figure 8: Gross Non-Oil Revenue and Its Components
Table 8: Components of Gross Non-Oil Revenue (N Billion)*
Q4 - 18 Q1- 19 Q2 - 19 Q3 - 19 Q4 - 19
N on- Oil R evenue 1,0 2 4 .3 5 9 8 9 .75 1,0 79 .6 4 1,570 .3 6 1,0 3 8 .6 5
Value-Added Tax (VAT) 276.41 301.62 295.49 290.87 287.95
Corporate Tax 347.15 297.21 332.61 651.43 355.97
Customs & Excise Duties 196.37 190.96 214.93 210.77 220.70
Others/1 204.43 199.97 236.61 417.29 174.02
1/Includes FGN Independent Revenue, Education Tax, NITDF & Customs
Federation/Non-Federation Account Levies (Port, Sugar, ETLS, Steel, CISS & Cement
Levies)
Source: Federal Ministry of Finance
* Figures are provisional
After the statutory deductions and transfers of N517.67 billion
and N450.46 billion, respectively, a net sum of N1,634.17 billion
was retained in the Federation Account for distribution. Of this
amount, the Federal Government received N786.35 billion,
State and Local governments received N398.85 billion and
N307.49 billion, respectively, while the balance of N141.47
billion was transferred to the 13.0% Derivation Fund for
distribution among the oil-producing states.
In addition, the Federal Government received N41.46 billion,
while the State and Local governments received N138.22 billion
and N96.75 billion, respectively, from the VAT Pool Account.
0.00
500.00
1000.00
1500.00
2000.00
Q4-18 Q1-19 Q2-19 Q3-19 Q4-19
N'B
illio
n
Corporate Tax Customs & Excise Duties
A net sum of N1,634.17
billion of the gross
federally-collected
revenue was distributed
among the three tiers of
government and the
13.0% Derivation Fund
for oil producing states.

C e n t r a l B a n k o f N i g e r i a
Page 20
Economic Report Fourth Quarter 2019
Table 9: Summary of Federally-Collected Revenue Deductions and Transfers
(N Billion)*
Q4 2018 Q1 2019 Q2 2019 Q3 2019 Q4 2019
Total Deductions 1/ 288.34 435.51 292.68 443.68 517.67
Oil Rev enue Deductions 245.80 394.20 248.66 379.68 475.39
Non-Oil Rev enue Deductions 42.54 41.31 44.02 64.00 42.28
Total Transfers 469.78 489.52 520.28 696.53 450.46
Federal Gov t. Ind. Rev enue 90.03 112.83 110.89 205.05 81.30
VAT Pool Account 265.35 289.55 283.67 279.24 276.43
Others 2/ 114.40 87.14 125.71 212.24 92.72
1/ Refer to Table 1 for breakdown of deductions
2/Includes Federat ion and Non-Federat ion Special Levies, Education Tax & NITDEF Source: Office of the Accountant General of the Federation (OAGF) and Federal
Ministry of Finance
* Figures are provisional
The sum of N8.70 billion was drawn-down from the Non-oil
Excess Account and distributed as follows: Federal
Government, N3.99 billion; State governments, N2.02 billion,
Local governments, N1.56 billion and 13.0% Derivation Fund,
N1.13 billion.
Similarly, the sum of N55.85 billion was shared as Exchange Gain
in the following proportion: Federal Government, N25.62 billion;
State governments, N12.99 billion; Local governments, N10.02
billion; and 13.0% Derivation Fund, N7.22 billion.
Thus, the total statutory and VAT revenue allocation to the three
tiers of government in the fourth quarter of 2019, amounted to
N1,975.15 billion, compared with the quarterly budget of
N3,272.00 billion.
3.2 The Fiscal Operations of the Three Tiers of Government 3.2.1 The Federal Government
Provisional data indicated that the Federal Government
retained revenue for the fourth quarter of 2019 amounted to
N938.72 billion. This was below both the quarterly budget and
the receipt in the preceding quarter by 55.6 per cent and 46.0
per cent, respectively. Of the total revenue, Federation
Account accounted for 83.8 per, cent, while Federal
Government Independent Revenue, VAT, Exchange Gain and
Non-oil Excess, accounted for 8.7 per cent, 4.4 per cent, 2.7 per
cent, and 0.4 per cent, respectively (Figure 9).
At N938.72 billion, the
estimated FGN retained
revenue in Q4 2019 was
lower than the quarterly
budget by 55.6 per cent.

C e n t r a l B a n k o f N i g e r i a
Page 21
Economic Report Fourth Quarter 2019
Figure 9: Federal Government Retained Revenue
Table 10: Federal Government Fiscal Operations (N Billion)*
Q4-18 Q1-19 Q2-19 Q3-19 Q4-19
Retained Revenue 1,144.47 1,111.68 978.39 1,738.81 938.72
Expenditure 2,017.63 2,514.02 2,388.86 2,414.03 2,074.46
Current Surplus(+)/Deficit(-) (213.89) (812.00) (626.91) (252.98) (575.21)
Primary Surplus(+)/Deficit(-) (526.02) (633.97) (1,046.33) 136.48 (744.06)
Overall Balance: Surplus(+)/Deficit(-) (873.16) (1,402.34) (1,410.47) (675.21) (1,135.74)
Source: Fiscal Liquidity Assessment Committee (FLAC), Ministry of Finance &
the Office of the Accountant General of the Federation
*Figures are provisional
The estimated Federal Government expenditure for the fourth
quarter of 2019, at N2,074.46 billion, was below the quarterly
budget estimate of N2,595.94 billion by 20.1 per cent. It also fell
by 14.1 per cent compared with the level in the preceding
quarter. A breakdown of the total expenditure, showed that
the recurrent component accounted for 73.0 per cent, while
capital and statutory transfers accounted for 21.3 per cent and
5.7 per cent, repectively. A further breakdown of the recurrent
expenditure showed that the non-debt component
accounted for 74.1 per cent, while debt service payments was
25.9 per cent.
Federation Acct.83.8%
VAT Pool Acct.4.4%
FGN Ind. Rev.8.7%
Exchange Gain2.7%
Excess Non-Oil0.4%

C e n t r a l B a n k o f N i g e r i a
Page 22
Economic Report Fourth Quarter 2019
Figure 10: Federal Government Expenditure
Thus, the fiscal operations of the Federal Government resulted
in an estimated deficit of N1,135.74 billion, compared with the
proportionate quarterly budget deficit of N479.62 billion..
3.2.2 Statutory Allocations to State Governments
At N701.90 billion, the total allocation to state governments
from the Federation Account, including the 13.0% Derivation
Fund and the VAT Pool Account was lower than the quarterly
budget by 40.4 per cent.
A breakdown showed that receipts from the Federation
Account was N563.69 billion (80.3%), while the share from VAT
pool account stood at N138.22 billion (19.7%). The receipts from
the Federation and VAT Pool Accounts fell below the quarterly
budget estimate by 42.1 per cent and 32.5 per cent,
respectively.
3.2.3 Statutory Allocations to Local Government Councils
Total allocations to local governments from the Federation and
VAT Pool Accounts in the fourth quarter of 2019 stood at
N415.82 billion. This was below the quarterly budget by 38.3 per
cent. Of the total amount, allocation from the Federation
Account was N319.07 billion (76.7%), while the VAT Pool
Account stood at N96.75 billion (23.3%).
Recurrent73.0%
Capital21.3%
Transfers5.7%
The fiscal operations
of the FG resulted in
an estimated overall
deficit of N1,135.74
billion in Q4 2019.
.

C e n t r a l B a n k o f N i g e r i a
Page 23
Economic Report Fourth Quarter 2019
4.0 Domestic Economic Conditions Agricultural activities in the review quarter were dominated by the
harvest of cash and root crops. In the live-stock sub-sector, farmers
engaged in the fattening of cattle and stocking of poultry in
anticipation of the end of the year sales. The end-period headline
inflation, on year-on-year and 12-month moving average bases in the
fourth quarter of 2019, stood at 11.98 per cent and 11.40 per cent,
respectively.
4.1 Agricultural Sector Agricultural activities in the fourth quarter of 2019 centered on
the harvest of cash and root crops. Farmers in the Northern part
of the country continued with the preparation of land and
nurseries for vegetables as well as pre-planting operations for
dry season farming. In the livestock sub-sector, farmers
engaged in the fattening of cattle and stocking of poultry in
anticipation of the end of the year sales.
4.2 Agricultural Credit Guarantee Scheme A total of N778.3 million loans was guaranteed to 5,182 farmers
under the Agricultural Credit Guarantee Scheme (ACGS) in the
fourth quarter of 2019. This represented a decrease of 35.9 and
8.7 per cent below the levels in the preceding quarter and the
corresponding period of 2018, respectively. Sub-sectoral
analysis showed that food crops obtained the largest share in
the total, with N300.0 million (38.5 %) guaranteed to 1,910
beneficiaries. This was followed by the livestock sub-sector,
N162.4 million (20.9 %) guaranteed to 607 beneficiaries; mixed
crops, N146.6 million (18.8 %) in respect of 1,905 beneficiaries;
while cash crops, fisheries and “Others” got N89.4 million (11.5
%), N52.4 million (6.7 %) and N27.4 million (3.6 %) guaranteed to
469, 158 and 133 beneficiaries, respectively.
Analysis by state, showed that 31 states and the Federal Capital
Territory benefited from the Scheme in the review quarter, with
highest and lowest sums of ₦133.4 million (17.1 %), and ₦2.3
million (0.3 per cent) were guaranteed to Adamawa and
Gombe states, respectively.
4.3 Commercial Agricultural Credit Scheme (CACS) At end-December 2019, the total amount released, since
inception by the CBN under the Commercial Agriculture Credit

C e n t r a l B a n k o f N i g e r i a
Page 24
Economic Report Fourth Quarter 2019
Scheme (CACS) to the participating banks for disbursement,
amounted to N622.99 billion for 600 projects, while the total
amount repaid since inception stood at N387.27 billion at end-
December 2019, compared with N368.0 billion (Table 11).
Table 11: Disbursement and Repayment of Credit under the Commercial
Agriculture Credit Scheme (CACS) as at December 20, 2019
Source: CBN
4.4 Industrial Production7 Data from the Nigeria Bureau of Statistics (NBS) indicated that
the industrial sector showed an improvement in the fourth
quarter of 2019, on account of continued expansion in
manufacturing activities. This was due to the border protection
policy of the Federal Government, and increase in new orders
as a result of anticipated rise in demand during the festive
season. Furthermore, there were improvements in the electricity
and mining sub-sectors. Consequently, industrial production in
the review quarter indicated an increase over the level in the
preceding quarter. At 119.8 (2010=100), the estimated index of
industrial production rose by 3.7 per cent above the level in the
preceding quarter. The increase was attributed to a pick-up in
demand on account of the forthcoming end-year festivities.
The estimated Index of manufacturing production, at 185.1
7 Indices are staff estimates and subject to changes and revision
Industrial activities
improved in the
review quarter, due
to a marginal
increase in
employment, output
and new orders.
S/N Participating Banks Total No. of Projects Amount Disbursed (N billion) Amount Repaid (N billion)
1 UBA Plc 52 83.53 56.8
2 Zenith Bank 78 126.94 83.3
3 First Bank of Nigeria Plc 104 52.99 44.8
4 Unity Bank Plc 31 34.80 13.9
5 Union Bank Plc 41 28.99 21.5
6 Stanbic IBTC Plc 47 29.95 19.7
7 Sterlling Bank 43 72.43 28.9
8 Access Bank Plc 26 36.66 30.3
9 Fidelity Bank Plc 18 24.67 14.3
10 Polaris Bank Limited 10 13.77 11.7
11 FCMB Plc. 29 18.53 11.6
12 Ecobank 10 6.38 6.4
13 GTBank 29 39.85 24.4
14 Diamond Bank Plc 23 4.85 4.2
15 Heritage Bank 14 6.81 2.4
16 Citibank Plc 2 3.00 3.0
17 Keystone Bank 23 31.70 8.5
18 WEMA Bank Plc 14 3.24 1.3
19 Jaiz Bank Plc 3 2.06 0.0
20 Suntrust BanK Ltd 3 1.85 0.3
TOTAL 600 622.99 387.22
C e n t r a l B a n k o f N i g e r i a
Page 25
Economic Report Fourth Quarter 2019
(2010=100), increased by 2.2 per cent in the fourth quarter of
2019, compared with 181.2 recorded in the preceding quarter.
The improvement was due, largely, to increase in demand as a
result of preparation for the festive season (Figure11).
The estimated index of mining production, at 89.2 (2010=100),
rose in the fourth quarter of 2019 from 87.0 attained in the
preceding quarter. This indicated a 1.4 per cent increase,
driven by the marginal improvement in crude oil and gas
production. (Figure 11, Table 12).
Electricity generation improved during the period under review.
At 3,630.5 MW/h, average estimated electricity generation rose
by 2.5 per cent, compared with 3,542.5 MW/h attained in the
preceding quarter. The slight improvement was attributed to
increase in gas supply to the thermal stations, relative stability
in the national grid, as well as, improved water management
at the hydro power stations.
At 3,324.2 MW/h, average estimated electricity consumption
increased by 2.1 per cent, compared with 3,255.8 MW/H
attained in the preceding quarter. The development was
attributed to improvement in transmission and distribution
networks which improved electricity supply to consumers.
Average electricity
generation and
consumption improved
in the review quarter.

C e n t r a l B a n k o f N i g e r i a
Page 26
Economic Report Fourth Quarter 2019
Figure 11 : Indices of Industrial Production (2010=100) 8
0
20
40
60
80
100
120
140
160
180
200
Q4-18 Q1-19 Q2-19 Q3-19 Q4-19
Ind
ex
Mining All Sectors Manufacturing
Source: Staff Estimate
Table 12: Indices of Industrial Production
Q4-18 Q1-19 Q2-19 Q3-19 Q4-19
All Sectors (1990=100) 95.80 108.62 109.10 115.50 119.80
Manufacturing 188.6 183.7 184.2 181.2 185.1
Mining 89.1 77.5 78.2 87.0 89.2
Source: Staff Estimate
4.5 Petroleum Sector Nigeria’s crude oil production, including condensates and
natural gas liquids, averaged 1.92 mbd in the review quarter.
This represented an increase of 0.5 per cent, compared with
1.91 mbd produced in the preceding quarter. The increase in
production was attributed to reduced incidences of pipeline
vandalism and restiveness in the oil producing areas. Allocation
of crude oil for domestic consumption was 0.45 mbd or 41.4
million barrels in the review period.
The average spot price of Nigeria’s reference crude oil, the
Bonny Light (37° API) rose from US$64.25/b in the third quarter of
2019, to US$64.87/b in the fourth quarter of 2019. This
represented an increase of 1.0 per cent above the level in the
preceding quarter but a decline of 7.2 per cent below the level
8 Index measurement (2010=100) from first quarter 2015
Crude oil and natural
gas production
increased in the fourth
quarter of 2019.
Crude oil export increased
in Q4 2019.
Average crude oil prices,
including the Bonny Light
(37° API) rose in the
international crude oil
market in Q4 2019.

C e n t r a l B a n k o f N i g e r i a
Page 27
Economic Report Fourth Quarter 2019
in the corresponding period of 2018. The movement in oil prices
were driven, mainly, by optimism of a trade agreement
between the US and China, as well as the improved outlook for
global oil demand amid better-than-expected economic
performance of some major economies in the review period.
The UK Brent at US$63.44/b, Forcados at US$64.83/b and WTI at
US$57.22/b exhibited similar trend as the Bonny Light.
The average price of OPEC basket of fourteen selected crude
streams at US$62.18/b was, however, lower than its previous
quarter’s value of US$62.30p/b by 0.2 per cent and lower than
its value in the corresponding period of 2018 by 8.5 per cent
(Figure 12, Table 13).
Figure 12: Trends in Crude Oil Prices
Source: Reuters
Table 13: Average Crude Oil Prices in the International Oil Market (US$ Barrel)
Q4-17 Q1-18 Q2-18 Q3-18 Q4-18 Q1-19 Q2-19 Q3-19 Q4-19
Bonny Light 62.48 68.55 75.43 76.5 69.89 64.75 71.3 64.25 64.87
OPEC Basket 59.35 64.76 71.88 74.10 67.98 62.72 68.40 62.30 62.18
Source: Reuters
0
10
20
30
40
50
60
70
80
90
Q4-17 Q1-18 Q2-18 Q3-18 Q4-18 Q1-19 Q2-19 Q3-19 Q4-19
US$
per
bar
rel
Bonny Light OPEC Basket

C e n t r a l B a n k o f N i g e r i a
Page 28
Economic Report Fourth Quarter 2019
4.6 Consumer Prices9 The all-items composite Consumer Price Index (CPI), at end-
December 2019, was estimated at 307.5 (November 2009=100),
indicating 3.0 per cent and 12.0 per cent increase over the
levels in September 2019 and the corresponding period of 2018,
respectively. The development was attributed, largely, to
increase in both food and non-food categories.
The urban All-items CPI (November 2009=100) stood at 313.6 at
end-December 2019, representing 3.1 per cent and 12.6 per
cent increase over the levels at end-September 2019 and end-
December 2018, respectively. The rural all-items CPI (November
2009=100), was 302.4 at end-December 2019, representing 2.8
per cent and 11.4 per cent increase, compared with the levels
at the end of the preceding quarter and the corresponding
period of 2018, respectively (Figure 13, Table 14).
The composite food index (with a weight of 50.7 per cent) was
estimated at 339.9 per cent in the fourth quarter of 2019,
compared with the 327.2 per cent and 292.2 per cent in the
preceding quarter and the corresponding period of 2018,
respectively.
Figure 13: Consumer Price Index
Source: NBS
9 New CPI with November 2009 = 100, as base and new weight, based on the
2003/2004 Nigeria Living Standard Survey (NLSS), was released by the National
Bureau of Statistics (NBS) on October 18, 2010.
200210220230240250260270280290300310320
Q4-
17
Q1-
18
Q2-
18
Q3-
18
Q4-
18
Q1-
19
Q2-
19
Q3-
19
Q4-
19
Ind
ex
Composite Urban Rural
The general price level
increased in Q4 2019
below the level in the
preceding quarter.

C e n t r a l B a n k o f N i g e r i a
Page 29
Economic Report Fourth Quarter 2019
Table 14: Consumer Price Index (November 2009=100)
Q4-17 Q1-18 Q2-18 Q3-18 Q4-18 Q1-19 Q2-19 Q3-19 Q4-19
Composite 246.4 252.4 260.5 268.4 274.6 280.8 289.7 298.6 307.5
Urban 249.3 255.6 263.8 272 278.5 285 294.4 304.1 313.6
Rural 244.1 249.9 257.8 265.5 271.4 277.4 285.9 294.1 302.4 Source: NBS
Headline inflation stood at 11.98 per cent at end-December
2019, compared with 11.24 per cent and 11.44 per cent at the
end of the preceding quarter and the corresponding period of
2018, respectively. The 12-Month Moving Average (12MMA)
inflation, for the fourth quarter of 2019, was 11.40 per cent,
compared with 11.27 per cent and 12.10 per cent in the
preceding quarter and the corresponding period of 2018,
respectively (Figure 14, Table 15).
Figure 14: Inflation Rate
Source: NBS
Table15: Headline Inflation Rate (%)
Q4-17 Q1-18 Q2-18 Q3-18 Q4-18 Q1-19 Q2-19 Q3-19 Q4-19
12-Month Moving Average 16.50 15.60 14.37 13.20 12.10 11.40 11.30 11.27 11.40
Year-on-Year 15.37 13.34 11.23 11.28 11.44 11.25 11.22 11.24 11.98
Source: NBS
5.00
7.00
9.00
11.00
13.00
15.00
17.00
19.00
Q4-
17
Q1-
18
Q2-
18
Q3-
18
Q4-
18
Q1-
19
Q2-
19
Q3-
19
Q4-
19
Per
cen
t
12-Month Average Year-on-Year
The headline inflation
(y-o-y) stood at 11.98
per cent in Q4 2019.

C e n t r a l B a n k o f N i g e r i a
Page 30
Economic Report Fourth Quarter 2019

C e n t r a l B a n k o f N i g e r i a
Page 31
Economic Report Fourth Quarter 2019
5.0 External Sector Developments10 On quarter-on-quarter basis, foreign exchange inflow, through the
CBN, rose by 6.1 per cent, while outflow through Bank fell by 3.9 per
cent, relative to their levels in the third quarter of 2019. Total non-oil
export proceeds received by banks fell by 37.8 per cent, compared
with the level at end-September 2019. The average exchange rate at
the ’Investors’ and ‘Exporters’ window, the BDC and the Inter-bank
segments of the market were N362.83/US$, N359.42/US$ and
N306.95/US$, respectively, in the review quarter. At US$38.18 billion,
the gross external reserves fell by 6.4 per cent, compared with the
level at end-September 2019.
5.1 Foreign Exchange Flows Aggregate foreign exchange inflow into the CBN amounted to
US$13.29 billion, showing an increase of 6.1 per cent over the
level in the third quarter of 2019, but decreased by 15.9 per
cent below the level in the corresponding period of 2018. The
development, relative to the preceding quarter reflected,
mainly, the rise in non-oil receipts.
Aggregate outflow from the CBN was US$15.57 billion,
indicating decrease of 3.9 per cent and 2.7 per cent below the
levels in the preceding quarter of 2019 and the corresponding
period of 2018, respectively. The decline in outflow, relative to
the preceding quarter, reflected, mainly, the decline in third
party MDAs transfers and interbank utilisation. Overall, foreign
exchange flows, through the Bank in the review period, resulted
in a net outflow of US$2.27 billion, compared with net outflow
of US$3.67 billion and US$0.19 billion in the preceding quarter
and the corresponding period of 2018, respectively (Figure 15,
Table 16).
10 Data on foreign exchange flows through the CBN and the Economy, as well as foreign
exchange utilisation for the fourth quarter of 2019 are provisional and subject to change.
Foreign exchange inflow
into the CBN rose, while
outflow from the Bank
declined, resulting in a
net outflow of US$2.27
billion in Q4 of 2019.

C e n t r a l B a n k o f N i g e r i a
Page 32
Economic Report Fourth Quarter 2019
Figure 15: Foreign Exchange Flows through the CBN
Source: CBN
Table 16: Foreign Exchange Flows through the CBN (US$ million)
Q1-18 Q2-18 Q3-18 Q4-18 Q1-19 Q2-19 Q3-19 Q4-19
Inflow 14,194.10 13,817.56 12,949.01 15,815.40 18,384.02 13,830.98 12,536.38 13,294.93
Outflow 9,651.78 13,296.38 16,931.36 16,002.49 16,302.16 10,066.75 16,204.22 15,565.02
Netflow 4,542.32 521.18 (3,982.36) (187.09) 2,081.86 3,764.22 (3,667.84) (2,270.09)
Source: CBN
Aggregate foreign exchange inflow into the economy
amounted to US$36.36 billion in the fourth quarter of 2019,
indicating an increase of 17.3 per cent and 19.0 per cent
above the levels in the preceding quarter and the
corresponding period of 2018, respectively. The development
was as a result of the 6.1 per cent and 24.9 per cent increase in
inflow through the CBN and autonomous sources, respectively.
Oil sector receipts, at US$3.83 billion (10.5 per cent of the total),
declined by 13.4 per cent and 6.2 per cent below the levels at
the end of the preceding quarter and the corresponding
period of 2018, respectively.
Non-oil public sector inflow, at US$9.47 billion (26.1 per cent of
the total) in the review period, rose by 16.6 per cent above the
level at the end of the third quarter of 2019 but declined by 19.3
per cent below the level in the corresponding period of 2018.
Autonomous inflow, at US$23.06 billion in the fourth quarter of
2019, rose by 24.9 per cent and 56.4 per cent compared with
-10,000
-5,000
0
5,000
10,000
15,000
20,000
Q4-17 Q1-18 Q2-18 Q3-18 Q4-18 Q1-19 Q2-19 Q3-19 Q4-19
US$
mill
ion
Inflow Outflow Netflow
Autonomous inflow
into the economy rose
by 5.0 per cent in Q4
2019.

C e n t r a l B a n k o f N i g e r i a
Page 33
Economic Report Fourth Quarter 2019
the levels at the end of the preceding quarter and the
corresponding period of 2018, respectively. Inflow from
autonomous sources accounted for 63.4 per cent of the total.
At US$16.54 billion, aggregate foreign exchange outflow from
the economy declined by 2.5 per cent and 4.7 per cent below
the levels in the preceding quarter and the corresponding
period of 2018, respectively. The development, relative to the
preceding quarter was driven, mainly, by 3.9 per cent
decrease in outflow from the CBN. Thus, foreign exchange flows
through the economy, resulted in a net inflow of US$19.45 billion
in the review quarter, compared with US$13.68 billion and
US$12.83 billion in the preceding quarter and the
corresponding period of 2018, respectively.
5.2 Non-Oil Export Earnings by Exporters Total non-oil export earnings received through the banks during
the review period amounted to US$0.96 billion, representing a
decrease of 37.8 per cent and 12.7 per cent relative to the
levels at the end of the preceding quarter and corresponding
period of 2018, respectively. The development, relative to the
preceding quarter’s level, was attributed, largely, to the 86.2
per cent and 65.7 per cent decline in receipts from minerals
sector and food products to US$52.26 million and US$50.53
million, respectively. Sectoral analysis showed that proceeds
from the agricultural, manufactured products and the
industrial sector fell by 27.3, 15.6 and 2.8 per cent, respectively,
below the levels in the preceding quarter to US$345.86 million,
US$108.85 million and US$402.73 million, respectively. Receipts
from the transport sector increased by 33.3 per cent over the
level in the preceding quarter to US$0.08 million. The decrease
in the non-oil export receipts was driven, majorly, by minerals
(processed and unprocessed) and food products including
fish, alcoholic and non-alcoholic drinks and other food items.
The shares of the various sectors in non-oil export proceeds
were: industrial sector, 42.0 per cent; agricultural products, 36.0
per cent; manufactured products, 11.3 per cent; minerals, 5.4
per cent; and food products, 5.3 per cent.
Total non-oil export
earnings by exporters
fell in Q4 2019.

C e n t r a l B a n k o f N i g e r i a
Page 34
Economic Report Fourth Quarter 2019
5.3 Sectoral Utilisation of Foreign Exchange Aggregate sectoral foreign exchange utilisation in the fourth
quarter of 2019 stood at US$11.43 billion, indicating a decrease
of 17.4 per cent below the level at the end of the third quarter
of 2019, but rose by 2.0 per cent above the level in the
corresponding period of 2018. The invisible sector accounted
for the bulk (64.3%) of total foreign exchange disbursed in the
review quarter, followed by the industrial sector (15.1%). Others
were: manufactured products, 8.3 per cent; minerals and oil,
6.5 per cent; food products, 3.8 per cent; transport, 1.4 per
cent; and agricultural sector, 0.6 per cent (Figure16).
Figure 16: Sectoral Utilisation of Foreign Exchange Source: CBN
Source: CBN
5.4 Foreign Exchange Market Developments A total of US$9.98 billion was sold by the CBN to authorised
dealers in the fourth quarter of 2019. This represented 0.4 per
cent decrease, compared with the level in the third quarter of
2019. The development, relative to the preceding quarter,
reflected, mainly, the decline in foreign exchange sales to the
BDCs, interbank, swaps transactions and wholesale forwards in
the review quarter.
Of the total, foreign exchange sales to BDCs, Interbank, Swaps,
Secondary Market Intervention Sales (SMIS) Intervention and
Wholesale Forward Intervention fell by 11.2 per cent, 10.1 per
cent, 8.0 per cent, 3.5 per cent and 2.3 per cent to US$0.40
0.7
1.1
4.5
6.2
4.9
13.1
69.5
0.6
1.4
3.8
8.3
6.5
15.1
64.3
0.0 10.0 20.0 30.0 40.0 50.0 60.0 70.0 80.0
Agricultural
Transport
Food
Manufactures
Minerals & Oil
Industrial
Invisibles
percent of total
Q4-19 Q3-19 Q2-19
The invisible sector
accounted for the
bulk of the total
foreign exchange
disbursed in Q4 2019.
Supply of foreign
exchange to
authorised dealers fell
in Q4 2019.

C e n t r a l B a n k o f N i g e r i a
Page 35
Economic Report Fourth Quarter 2019
billion, US$1.65 billion, US$1.24 billion, US$0.31 and US$3.34
billion, respectively, while sales to the I&E window and SME
intervention, rose above their levels in the preceding quarter by
17.7 per cent and 1.0 per cent to US$2.62 billion and US$0.43
billion, respectively. Foreign exchange forwards disbursed at
maturity recorded no transaction during the period under
review (Figure 17, Table 17).
Figure 17: Supply of Foreign Exchange
0.00
2.00
4.00
6.00
8.00
10.00
12.00
Q4-18 Q1-19 Q2-19 Q3-19 Q4-19
US$ b
illion
Forex Sales at rDAS/Interbank Supply of Swaps
Supply of Forex to BDC Total Forex Supply
Source: CBN
Table 17: Demand for and Supply of Foreign Exchange (US$ billion)
Q4-18 Q1-19 Q2-19 Q3-19 Q4-19
Forex Sales at rDAS/Interbank 0.82 0.36 0.33 0.33 0.31
Supply of Swaps 0.13 0.66 0.09 0.47 0.40
Supply of Forex to BDC 2.98 2.44 3.33 3.54 3.34
Wholesale Forward 0.00 0.31 1.18 1.50 1.24
Supply to I & E 2.09 0.83 0.08 2.02 2.62
SMIS Intervention 0.00 0.70 1.93 1.84 1.64
SME Intervention 0.00 0.13 0.40 0.43 0.43
Disbursement at maturity 3.15 1.47 0.00 0.00 0.00
Total Forex Supply(BDC and rDAS) 9.18 6.90 7.33 10.11 9.98 Source: CBN
The CBN sustained its interventions at both the Inter-bank and
the BDC segments of the foreign exchange market in the
review quarter. Consequently, average exchange rate of the
naira vis-à-vis the US dollar at the Inter-bank segment, was
N306.95/US$, representing a depreciation of 0.01 per cent and
0.08 per cent in the preceding quarter and the corresponding
The average naira
exchange rate vis-à-vis
the US depreciated at the
inter-bank, BDC segment,
and the I&E Window in
Q4 2019.

C e n t r a l B a n k o f N i g e r i a
Page 36
Economic Report Fourth Quarter 2019
period of 2018, respectively. Also, at the BDC segment, the
average exchange rate, depreciated by 0.08 per cent relative
to the level in the preceding quarter to N359.42/US$, but
appreciated by 0.8 per cent relative to the corresponding
period of 2018. Similarly, at N362.83/US$, the average
exchange rate at the “Investors” and “Exporters” (I&E) window
depreciated by 0.2 per cent, relative to the level in the
preceding quarter, but appreciated by 0.4 per cent,
compared with the level in the corresponding period of 2018.
Consequently, the premium between the average inter-bank
and BDC rates widened by 0.1 percentage point to 17.1 per
cent, relative to the level in the preceding quarter. The
premium between the average exchange rates at the
“Investors” and “Exporters” window and the BDC segment also
widened by 0.11 percentage point to 0.96 per cent in the
review quarter, from 0.85 per cent at the end of the third
quarter of 2019 (Figure 18, Table 18).
Figure 18: Average Exchange Rate Movements
306.55
306.60
306.65
306.70
306.75
306.80
306.85
306.90
306.95
307.00
356.00
357.00
358.00
359.00
360.00
361.00
362.00
363.00
364.00
365.00
Q4-18 Q1-19 Q2-19 Q3-19 Q4-19
Av. I & E Av. BDC Av. Interbank (RHS)
N/U
S$
Source: CBN

C e n t r a l B a n k o f N i g e r i a
Page 37
Economic Report Fourth Quarter 2019
Table 18: Exchange Rate Movements and Exchange Rate Premium
Average Exchange Rate (N/US$) Q4-17 Q1-18 Q2-18 Q3-18 Q4-18 Q1-19 Q2-19 Q3-19 Q4-19
Investors and Exporters Window 360.47 360.38 360.80 362.49 364.21 362.07 360.72 362.20 362.83
BDC 362.83 362.58 361.84 359.27 362.34 359.97 360.00 359.14 359.42
Interbank 305.96 305.81 305.77 306.03 306.70 306.84 306.95 306.93 306.95
Premium (%)
I&E/Interbank N/A N/A 18.0 18.4 18.3 18.3 17.5 18.0 18.2
BDC/Interbank 19.50 18.59 18.30 17.40 0.50 0.80 17.14 17.00 17.10
Source: CBN
Figure 19: Exchange Rate Premium
Source: CBN
5.5 Gross Official External Reserves Gross external reserves were US$38.07 billion at end-December
2019. This indicated a net decrease of 6.4 per cent, compared
with the level in the third quarter of 2019. The external reserves
position would cover 5.2 months of import of goods and
services or 9.1 months of import of goods only, based on the
estimated value of import for the third quarter of 2019. A
breakdown of the external reserves by ownership showed that
the share of Federation reserves was US$0.32 billion (0.9%);
Federal Government reserves, US$6.09 billion (16.0%); and the
CBN reserves, US$31.65 billion (83.1%) of the total (Figure 20,
Table 19).
16.0
16.5
17.0
17.5
18.0
18.5
Q2
-18
Q3
-18
Q4
-18
Q1
-19
Q2
-19
Q3
-19
Q4
-19
Per
ce
nt
Interbank/BDC
Interbank/BDC
Gross external
reserves fell in the
fourth quarter of
2019.

C e n t r a l B a n k o f N i g e r i a
Page 38
Economic Report Fourth Quarter 2019
Figure 20 : Gross Official External Reserves
0
5,000
10,000
15,000
20,000
25,000
30,000
35,000
40,000
45,000
50,000
Q4
-17
Q1
-18
Q2
-18
Q3
-18
Q4
-18
Q1
-19
Q2
-19
Q3
-19
Q4
-19
US
$ m
illi
on
Source: CBN
Table 19: Gross Official External Reserves (US$ million)
Q3-18 Q4-18 Q1-19 Q2-19 Q3-19 Q4-19
External Reserves 42,609.0 42.542.82 44,793.1 44,747.0 40,897.2 38,073.0
Source: CBN
C e n t r a l B a n k o f N i g e r i a
Page 39
Economic Report Fourth Quarter 2019
6.0 Global Economic Outlooks 6.1 Global Output Global growth remained lackluster in the quarter under review,
mostly driven by heightened uncertainty surrounding
geopolitics and trade. Some of the pressing issues slowing down
growth include: the delay in resolving Brexit; increasing barriers
to trade amongst countries, notably the US-China trade
tensions; persistent macroeconomic strains on emerging
market economies that may be attributed to idiosyncratic and
structural factors; and aging demographics in some advanced
economies.
According to the IMF World Economic Outlook (WEO) for
October 2019, global growth for 2019 had been downgraded
to 3.0 percent from 3.2 per cent earlier projected in July 2019.
This was the weakest growth recorded since the financial crisis
of 2009. Global growth in 2020 was projected to improve slightly
to 3.4 per cent, reflecting primarily, an expected improvement
in economic performance in a number of emerging markets in
Latin America and the Middle East. In the emerging and
developing Europe, growth was expected to be 2.4 per cent in
2019 and expected to moderate to 2.1. In the euro area,
growth was projected at 1.2 per cent in 2019 but was expected
to pick up slightly to 1.4 per cent in 2020 on the back of
improved external demand. In the United States, growth was
expected to be 2.4 per cent in 2019, and expected to
moderate to 2.1 per cent in 2020, reflecting a possible shift in
the expansionary fiscal stance prevalent in 2019 to neutral in
2020.
Meanwhile, growth in the euro area was projected at 1.2 per
cent in 2019 but expected to pick up slightly to 1.4 per cent in
2020. The United Kingdom was also set to expand by1.2 per
cent in 2019 and 1.4 per cent in 2020 assuming that Brexit was
completed successfully. Japan’s economy was projected to
grow by 0.9 per cent in 2019, but to fall to 0.5 per cent in 2020
as temporary fiscal measures were expected to offset part of
the anticipated decline in private consumption as a result of
the increase in the consumption tax rate in October 2019. In
Emerging and Developing Asia, growth was projected at 5.9

C e n t r a l B a n k o f N i g e r i a
Page 40
Economic Report Fourth Quarter 2019
per cent in 2019 and 6.0 per cent in 2020. China, growth was
projected at 6.1 per cent in 2019 and 5.8 per cent in 2020, while
India’s economy was projected to grow at 6.1 per cent in 2019,
picking up to 7.1 per cent in 2020. This was due to lagged
effects of monetary policy easing, a reduction in corporate
income tax rates, recent measures to address corporate and
environmental regulatory uncertainty, and government
programmes to support rural consumption.
In Sub-Saharan Africa, growth was projected at 3.2 per cent in
2019 and 3.6 per cent in 2020, as strong growth in some non-
resource-intensive countries partially offset the lackluster
performance of the region’s largest economies. Nigeria’s
growth was projected to increase from 1.9 per cent in 2018 to
2.3 per cent in 2019, as a result of the impact of recovering oil
production and prices, economic diversification from the oil
sector to agricultural sector, and growth in the financial sector.
6.2 Global Inflation Preliminary data on global inflation for the fourth quarter of 2019
revealed mixed results. While some advanced and emerging
market economies were expected to close the year with lower
inflation, especially on account of moderating energy prices,
other countries experienced higher levels of inflation. Inflation
in the Eurozone at end-November 2019 was 1.0 per cent, a
substantial decline from the year-end inflation rate of 1.5 per
cent in 2018. Similarly, inflation in the United Kingdom declined
from 2.1 per cent in December 2018 to 1.5 per cent at end-
November 2019. Inflationary pressures, however, picked up in
Japan as prices increased from 0.3 per cent in December 2018
to 0.5 per cent at end-November 2019. Similarly, inflation in the
United States, increased to 2.1 per cent at end-November 2019
from 1.9 per cent in December 2018.
In major emerging markets, there were mixed developments.
The headline inflation rate in China increased significantly from
1.9 per cent in December 2018 to 4.5 percent at end-
November 2019. Inflation in India, also, rose from 2.1 per cent in
2018 to 5.54 per cent at end-November 2019. Inflation in Brazil,
however, declined slightly to 3.3 per cent at end-November
2019 from 3.8 per cent in December 2018.

C e n t r a l B a n k o f N i g e r i a
Page 41
Economic Report Fourth Quarter 2019
Among the developing economies, inflation in Nigeria trended
upwards slightly from 11.4 per cent at end-of-year 2018 to 11.9
per cent as at November 2019. Ghana was, however, set to
close the year with a lower headline inflation rate from 9.4 per
cent in December 2018 to 8.2 per cent at end-November 2019.
6.3 Global Commodity Demand and Prices Global crude oil supply in the review quarter was estimated at
99.32 mbd, representing an increase of 1.0 per cent above the
level in the preceding quarter. World crude oil demand was
projected at 100.95 mbd in the fourth quarter of 2019,
indicating an increase of 0.3 per cent compared with the level
in the third quarter of 2019. The increase in world crude oil
demand was driven, largely, by rising industrial activities,
seasonal heating and transportation fuel needs in China,
Indonesia, Brazil, among others. Particularly, demand growth
was recorded for jet/kerosene, naphtha and diesel in the
review quarter.
6.4 International Financial Markets Developments in major international stock markets were bullish
in the fourth quarter of 2019. In North America, the United States
S&P 500, the Canadian S&P/TSX Composite index and Mexico
Bolsa indices increased by 8.5 per cent, 2.4 per cent and 1.2
per cent, respectively.
In South America, the Brazilian Bovespa Stock, Argentine Merval
index and Colombian COLCAP indices increased by 10.4 per
cent, 43.4 per cent and 5.4 per cent, respectively. In Europe,
the FTSE 100, France CAC 40 and the German DAX indices
increased by 5.9 per cent, 5.3 per cent and 7.7 per cent,
respectively. In Asia, Japan’s Nikkei 225, Shanghai Stock
Exchange-A and the Indian BSE Sensex indices rose by 8.7 per
cent, 5.0 per cent and 6.7 per cent, respectively, during the
period.
In the foreign exchange market, the performance of ten (10)
out of the sixteen (16) currencies surveyed appreciated against
the US dollar, despite the downturn in global manufacturing,
sustained downward pressure on oil prices and lingering
uncertainty around BREXIT. The movement in the regional
currencies exchange rates were as follows:

C e n t r a l B a n k o f N i g e r i a
Page 42
Economic Report Fourth Quarter 2019
• Africa: The South African rand, Kenyan shillings and the
Egyptian pound appreciated against the US dollar by
38.0 per cent, 17.0 and 1.7 per cent, respectively while
the Ghanaian cedi depreciated by 5.7 per cent. The
Nigerian Naira remains unchanged.
• North America: The Canadian dollar and Mexican peso
appreciated against the U.S. dollar by 1.3 per cent and
4.3 per cent, respectively.
• South America: The Colombian peso appreciated
against the U.S. dollar by 5.6 per cent, while the Brazilian
real and Argentine peso depreciated by 4.5 per cent
and 3.8 per cent, respectively.
• Europe: The Pound Sterling, Euro and Russian rubble
appreciated against the US dollar by 7.4 per cent, 3.0
per cent and 4.8 per cent, respectively.
• Asia: The Chinese yuan appreciated by 2.3 per cent,
while the Japanese yen and Indian rupee depreciated
against the U.S. Dollar by 1.0 per cent and 0.7 per cent,
respectively.
6.5 Other International Economic Developments and Meetings Other major international economic developments and
meetings of importance to the domestic economy in the fourth
quarter of 2019 included: The meeting of the Ministers of
Finance and Central Bank Governors Presidential Task Force on
the ECOWAS Single Currency took place in Abuja, Nigeria from
December 6-7, 2019 after the Technical Committee Meeting
held on December 2 -4, 2019.
Some of the issues discussed included:
• The ECOWAS Convergence Report for the First Half of
2019;
• The report of the meeting of the Working Group on the
Symbol for the ECOWAS Single Currency and a name for
the ECOWAS Central Bank;
• The report on the creation of the ECOWAS Monetary
Union in 2020: Assessment of Progress and Gaps; and

C e n t r a l B a n k o f N i g e r i a
Page 43
Economic Report Fourth Quarter 2019
• The terms of reference for hosting of the ECOWAS
Central Bank.
A team from Moody’s Ratings Agency visited the CBN on
November 7, 2019, as part of Nigeria’s 2019 Review of Sovereign
Credit Rating Exercise from November 5 – 8, 2019. The team was
informed that the Monetary Policy Rate (MPR) was 13.5 per
cent and that the position of the monetary policy mix reflected
the Bank’s tight stance with the focus of achieving the Bank’s
objective of price stability. Several interventions had also been
deployed including direct interventions in the agricultural and
manufacturing sectors to create jobs, moderate
unemployment and jump start growth in some key sectors.
Overall, the objectives of price and exchange stability
remained the bank policy mix.
Furthermore, a team from Fitch Ratings Agency led by Mr.
Mahin Dissanayake visited the CBN on November 14, 2019, as
part of Nigeria’s 2019 Review of Sovereign Credit Rating
Exercise from November 14 – 15, 2019. Deliberations centered
on macroeconomic developments, monetary policy, Inflation
target, exchange rate, and banking sector.
6.6 Outlook for Nigeria in the First Quarter of 2020 The outlook for Nigeria’s economy for the first quarter of 2020,
amidst weakening global demand and inflationary pressures
stemming from VAT increase is cautiously optimistic as the
economy was projected to grow by about 2.35 per cent. This
was premised on the continued growth in the oil and non-oil
sector, early passage of the 2020 budget; expansion of
activities in the manufacturing and non-manufacturing sector
as indicated by the PMI; sustained stability in the exchange rate
and continued interventions in critical sectors of the economy.
Productivity in the real sector was expected to be supported
by government spending on infrastructure and CBN
interventions in growth-stimulating sectors. Specifically, the
renewed focus of the CBN in improving credit delivery to the
agricultural and manufacturing sub-sectors as well as Micro,
Small and Medium Enterprises (MSMEs), would moderate
unemployment and sustain the growth trajectory. In addition,
the FGN border protection policy was expected to encourage
and stimulate domestic production, and subsequently create
C e n t r a l B a n k o f N i g e r i a
Page 44
Economic Report Fourth Quarter 2019
employment opportunities. However, headwinds that could
undermine these expectations include: under utilisation in the
labour market due to weak aggregate demand; a build-up in
inflationary pressures resulting from the VAT increase and
border protection. Specifically, headline inflation was
expected to accelerate to 12.68 per cent in the first quarter of
2020.
The outlook for the external sector may remain challenging due
to the likely decline in domestic oil production as well as decline
in foreign direct investments (FDI). These developments are
attributed to slowed global recovery, uncertainty related to the
U.S. 2020 presidential elections, and a sustained balance of
payments deficit. However, a modest positive performance,
supported by exchange rate stability, a “phase-one” US-China
trade deal, and CBN’s initiatives towards the diversification of
the economy by increasing its export base in the external
sector, remained feasible.
The fiscal space was expected to be enhanced on the back of
increased government revenue occasioned by the recently
passed Finance Bill, increase in VAT and crude oil prices, were
expected to average at US$61.00 per barrel in 2020, above the
proposed budget benchmark of US$57.0 per barrel. In addition,
the pace of capital releases was expected to have a positive
impact on the economy. However, depressed global oil
demand, output cuts imposed by OPEC and rising debt service
obligation were major threats to the economy.
The financial sector was expected to remain resilient in the final
quarter of 2020, on account of the CBN’s commitment towards
ensuring financial system stability, deeper inclusion through
credit delivery, as well as intensifying financial literacy and
consumer protection programmes. The renewed policies
aimed at enhancing the Payments and cash-less initiative were
expected to sustain improved efficiency, safety and
confidence in the Nigerian payments system.

C e n t r a l B a n k o f N i g e r i a
Page 45
Economic Report Fourth Quarter 2019
APPENDIX TABLES

C e n t r a l B a n k o f N i g e r i a
Page 46
Economic Report Fourth Quarter 2019

C e n t r a l B a n k o f N i g e r i a
Page 47
Economic Report Fourth Quarter 2019
Table A1: Money and Credit Aggregates
Sep-18 Dec-18 Mar-19 Jun-19 Sep-19 Nov-19
Domestic Credit (Net) 26,408.42 27,574.32 31,736.89 32,341.48 35,938.33 35,513.08
Claims on Federal Government (Net) 3,440.99 4,866.09 7,742.16 7,583.24 10,451.82 9,100.34
Central Bank (Net) (91.46) 342.21 3,215.42 2,754.06 5,674.86 4,100.77
Banks 3,532.45 4,523.88 4,526.74 4,829.18 4,776.96 4,999.57
Claims on Private Sector 22,967.43 22,708.23 23,994.74 24,758.24 25,486.51 26,412.74
Central Bank 6,431.58 6,574.67 7,678.57 8,504.88 8,139.41 8,444.58
Banks 16,535.85 16,133.54 16,316.16 16,253.36 17,347.10 17,968.16
Claims on Other Private Sector 21,173.75 21,109.72 22,284.77 23,117.87 23,746.75 24,356.36
Central Bank 5,730.19 5,873.28 6,870.79 7,740.84 7,265.26 7,274.69
Banks 15,443.56 15,236.44 15,413.99 15,377.03 16,481.49 17,081.66
Claims on State and Local Government 1,341.87 1,553,64 1,618.85 1,595.81 1,585.08 1,602.74
Central Bank 656.53 656.53 716.67 719.47 719.47 716.24
Banks 685.34 897.11 902.18 876.33 865.61 886.50
Claims on Non-financial Public Enterprises
Central Bank
DMBs
Foreign Assets (Net) 18,815.94 18,397.82 16,816.80 18,471.24 13,911.34 14,149.60
Central Bank 18,277.81 18,181.45 16,292.64 17,569.37 14,578.25 14,833.42
Banks 538.13 216.37 524.16 901.87 (666.91) (638.82)
Other Assets (Net) (14,373.31) (12,612.89) (14,722.61) (15,908.67) (14,805.35) (13,229.56)
Money Supply (M3) 30,851.05 33,359.25 33,831.08 34,904.05 35,044.31 36,478.13
Quasi-Money 1/ 14,802.98 15,316.02 15,890.94 16,737.58 16,549.16 17,484.80
Money Supply (M1) 10,757.69 11,752.56 10,943.88 11,161.25 11,120.80 10,930.57
Currency Outside Banks 1,601.89 1,912.98 1,780.61 1,650.87 1,623.87 1,799.10
Demand Deposits 2/ 9,155.79 9,839.58 9,163.26 9,510.38 9,496.93 9,131.48
Money Supply (M2) 25,560.66 27,068.58 26,834.82 27,898.83 27,669.96 28,415.37
CBN Bills held by Non-Bank Sectors 5,290.39 6,290.67 6,996.26 7,005.22 7,374.36 8,062.76
Money Supply (M3) 30,851.05 33,359.25 33,831.08 34,904.05 35,044.31 36,478.13
Memorandum Items:
Reserve Money (RM) 6,802.56 7,135.73 7,246.28 8,088.46 7,000.25 7,353.36
Currency in Circulation (CIC) 1,926.38 2,329.71 2,153.22 2,014.07 2,005.60 2,203.27
Banks' Deposit with CBN 4,876.17 4,806.02 5,093.06 6,074.39 4,994.65 5,150.09
Source: CBN
1/ Quasi money consist of Time, Savings and Foreign Currency Deposit at Deposit Money Banks excluding Taking from Discount Houses.
2/ Demand Deposit consist of State, Local and Parastatals Deposits at CBN, State, Local Government and Private Sector Deposits as well
as Demand Deposits of non-financial Public Enterprises at Deposit Money Banks.

C e n t r a l B a n k o f N i g e r i a
Page 48
Economic Report Fourth Quarter 2019
Table A2: Money and Credit Aggregates (Growth Rates)* Sep-18 Dec-18 Mar-19 Jun-19 Sep-19 Nov-19
Domestic Credit (Net) 3.3 4.4 15.1 1.9 11.1 -1.2
Claims on Federal Government (Net) 4.7 41.4 59.1 -2.1 37.8 -12.9
Claims on Private Sector 3.1 -1.1 5.7 3.2 2.9 3.6
Claims on Other Private Sector 5.3 -0.3 5.6 3.7 2.7 2.6
Claims on State and Local Government -17.6 15.8 4.2 -1.4 -0.7 1.1
Claims on Non-financial Public Enterprises
Foreign Assets (Net) 2.6 -2.2 -8.6 9.8 -24.7 2.0
Other Assets (Net) -1.3 -12.3 16.7 8.1 -6.9 -10.6
Money Supply (M3) 5.1 8.1 1.4 3.2 0.4 4.1
Quasi-Money 1/ 4.9 3.5 3.8 5.3 -1.1 5.7
Money Supply (M1) 0.5 9.3 -6.9 2.0 -0.4 -1.7
Currency Outside Banks 5.4 19.4 -6.9 -7.3 -1.6 10.8
Demand Deposits 2/ -0.3 7.5 -6.9 3.8 -0.1 -3.8
Total Money Assets (M2) 3 5.9 -0.9 4.0 -0.8 2.7
CBN Bills held by Non-Bank Sectors 16.8 18.9 11.2 0.1 5.3 9.3
Money Supply (M3) 5.1 8.1 1.4 3.2 0.4 4.1
Memorandum Items:
Reserve Money (RM) 7 4.9 1.6 11.6 -6.4 5.0
Currency in Circulation (CIC) 1.4 20.9 1.6 11.6 -6.4 5.0
DMBs Demand Deposit with CBN 9.3 -10.5 -7.6 6.5 0.1 9.9
Domestic Credit (Net) 1.8 6.3 15.1 17.3 30.3 28.8
Claims on Federal Government (Net) -5.4 33.7 59.1 55.8 114.8 87.0
Claims on Private Sector 3 1.9 5.7 9.0 12.2 16.3
Claims on Other Private Sector 2.2 1.9 5.6 9.5 12.5 15.4
Claims on State and Local Governments -13.1 0.6 4.2 2.7 2.0 3.2
Claims on Non-financial Public Enterprises
Foreign Asset (Net) 21.2 18.5 8.6 0.4 -24.4 -22.8
Other Asset (Net) 12.5 1.3 -16.7 -26.1 -17.4 -4.9
Money Supply (M3) 7.6 16.4 1.4 4.6 5.1 9.4
Quasi-Money 1/ 14.2 18.1 3.8 9.3 8.1 14.2
Money Supply (M1) -3.7 5.2 -6.9 -5.0 -5.4 -7.0
Currency Outside Banks -10.1 7.3 -6.9 -13.7 -15.1 -6.0
Demand Deposits 2/ -2.5 4.8 -6.9 -3.4 -3.5 -7.2
Money Supply (M2) 1.18 12.1 -0.9 3.1 2.2 5.0
CBN Bills held by Non-Bank Sectors 24.31 38.9 11.2 11.4 17.2 28.2
Money Supply (M3) 7.6 16.4 1.4 4.6 5.1 9.4
Memorandum Items:
Reserve Money (RM) 10.88 10.1 1.6 13.4 -1.9 3.1
Currency in Circulation (CIC) -5.47 8 -7.6 -13.6 -13.9 -5.4
DMBs Demand Deposit with CBN 9 11.10 6.00 26.4 3.9 7.2
Percentage Change Over Preceding Quarter
Percentage Change Over Preceding December
Source: CBN 1/ Quasi money consist of Time, Savings and Foreign Currency Deposit at Deposit Money Banks excluding Taking from Discount Houses. 2/ Demand Deposit consist of State, Local and Parastatals Deposits at CBN, State, Local Government and Private Sector Deposits as well as Demand Deposits of non-financial
Public Enterprises at Deposit Money Banks.
*All figures are provisional.

C e n t r a l B a n k o f N i g e r i a
Page 49
Economic Report Fourth Quarter 2019
Table A3: Federal Government Fiscal Operations (N billion) *
Q4-18 Q1-19 Q2-19 Q3-19 Q4-19
Retained Revenue 1,144.47 1,111.68 978.41 1,738.81 938.72
Federation Account 828.66 709.03 716.29 866.79 786.35
VAT Pool Account 39.80 43.43 42.55 41.89 41.46
FGN Independent Revenue 90.03 112.83 110.89 205.05 81.30
Excess oil - - 36.33 - -
Excess non-oil 2.32 6.40 - 0.92 3.99
Exchange gain 56.00 1.16 0.69 1.44 25.62
Others 127.66 238.83 71.66 622.73 -
Expenditure 2,017.63 2,514.02 2,388.86 2,414.03 2,074.46
Recurrent 1,358.36 1,943.93 1,605.30 1,991.79 1,513.94
Capital 545.15 455.23 668.26 305.43 442.21
Transfers 114.11 114.87 115.30 116.81 118.31
Overall Balance: Surplus(+)/Deficit(-) (873.16) (1,402.34) (1,410.45) (675.21) (1,135.74)
*Fourth Quarter 2019 figures are provisional.

C e n t r a l B a n k o f N i g e r i a
Page 50
Economic Report Fourth Quarter 2019