economic profile - · pdf filethe economic contribution of washington state’s...
TRANSCRIPT
THE ECONOMIC CONTRIBUTION OF
WASHINGTON STATE’S PETROLEUM
REFINING INDUSTRY IN 2011
1. Report Overview
This report quantifies the impact of
Washington's five major petroleum re-
finers on the state’s economy in 2011.
In 2011, the refiners directly provided
1,986 full-time jobs, paying an annual
average wage of $120,276. In addition,
the refiners employed, at high wages,
2,919 contract workers on an average
day, doing maintenance, capital repair
and capital replacement. The refiners
indirectly created additional Washington
state jobs in industries from which they
purchased goods and services, including
transportation, construction, utilities and
business services. Spending of the in-
come earned in these direct and indirect
jobs created even more jobs.
The sum of all these effects was more
than 26,000 jobs and almost $1.7 billion
in personal income for Washington State
in 2011. From this activity, state and
local government received $48.0 million
in sales and use taxes and $120.5 million
in business and occupation taxes.
Also, downstream industries, which
distributed refined petroleum products,
paid $416 million in wages to 16,214
workers in 2010. Excise taxes collected
Economic Profile August 2012
by the state from these industries ex-
ceeded $256 million in 2011.
Because of Washington's unique tax
structure, a Washington refinery’s state
and local tax burden in 2008 was more
than quadruple the state and local tax
burden of a comparable refinery located
in California.
The report updates the economic im-
pact analyses of petroleum refining for
2003, 2005, 2007 and 2009 previously
prepared by the Washington Research
Council (WRC 2004, 2006, 2009 and
2011), drawing upon a survey of Wash-
ington refiners conducted by the Council
in 2012 (Appendix A) and the WRC-
REMI model of the Washington State
economy (Appendix C).
2. Summary of Findings on Refiners
Washington's five refineries provide
3.5 percent of the United States' refining
capacity. In 2011 they processed
536,000 barrels of crude oil per day.
Gasoline, diesel oil, and jet fuel are the
largest finished product categories, rep-
resenting 43 percent, 23 percent, and 14
percent, respectively, of total produc-
tion, with gasoline production averaging
ACKNOWLEDGEMENTS
Washington Research Council has produced this report with funding from the Western
States Petroleum Association. Washington state's economy is simulated using the Washing-
ton Research Council-Regional Impact Modeling, Inc. (WRC-REMI) model, based on a de-
tailed survey of the five oil refiners operating in Washington. The results of this analysis are
the sole responsibility of the Washington Research Council, a nonprofit organization com-
mitted to objective analysis of economic and public policy issues in Washington State.
Typo corrected 4/8/13
Page 2 August 2012
246,200 barrels per day.
According to the refiners survey, the
five major refineries employed 1,986
workers in 2011, paying them an aver-
age annual wage of $120,276—more
than twice the Washington state average.
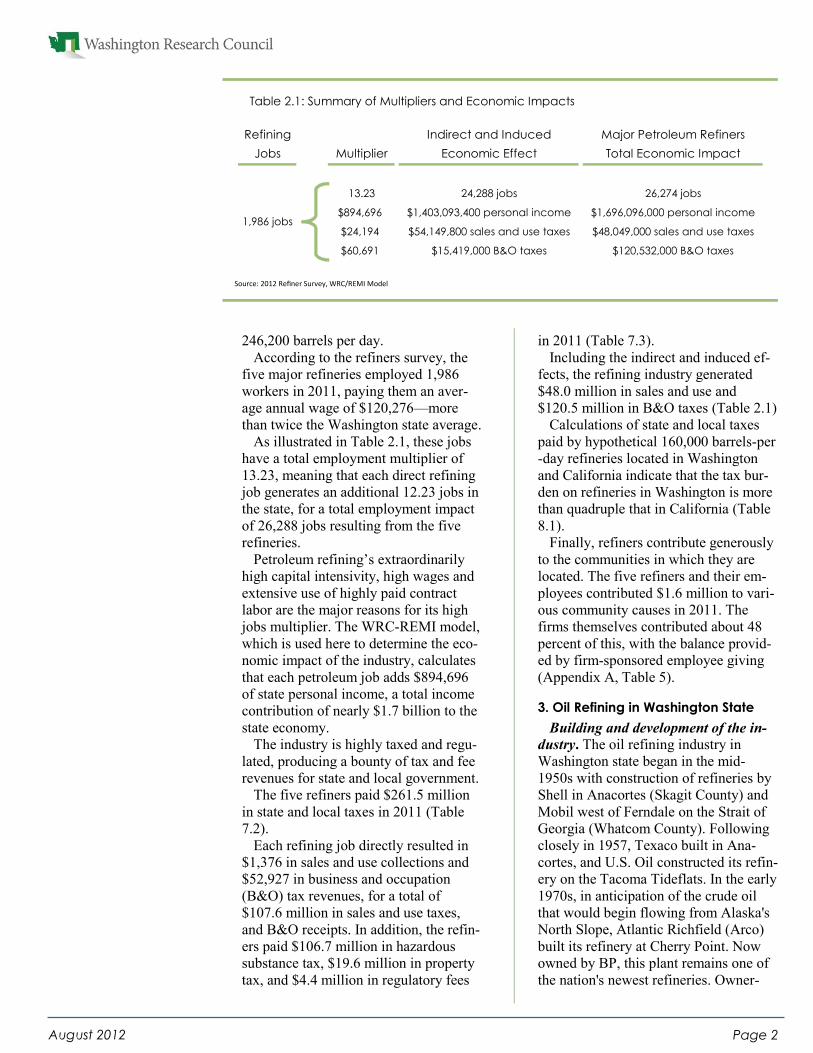
As illustrated in Table 2.1, these jobs
have a total employment multiplier of
13.23, meaning that each direct refining
job generates an additional 12.23 jobs in
the state, for a total employment impact
of 26,288 jobs resulting from the five
refineries.
Petroleum refining’s extraordinarily
high capital intensivity, high wages and
extensive use of highly paid contract
labor are the major reasons for its high
jobs multiplier. The WRC-REMI model,
which is used here to determine the eco-
nomic impact of the industry, calculates
that each petroleum job adds $894,696
of state personal income, a total income
contribution of nearly $1.7 billion to the
state economy.
The industry is highly taxed and regu-
lated, producing a bounty of tax and fee
revenues for state and local government.
The five refiners paid $261.5 million
in state and local taxes in 2011 (Table
7.2).
Each refining job directly resulted in
$1,376 in sales and use collections and
$52,927 in business and occupation
(B&O) tax revenues, for a total of
$107.6 million in sales and use taxes,
and B&O receipts. In addition, the refin-
ers paid $106.7 million in hazardous
substance tax, $19.6 million in property
tax, and $4.4 million in regulatory fees
in 2011 (Table 7.3).
Including the indirect and induced ef-
fects, the refining industry generated
$48.0 million in sales and use and
$120.5 million in B&O taxes (Table 2.1)
Calculations of state and local taxes
paid by hypothetical 160,000 barrels-per
-day refineries located in Washington
and California indicate that the tax bur-
den on refineries in Washington is more
than quadruple that in California (Table
8.1).
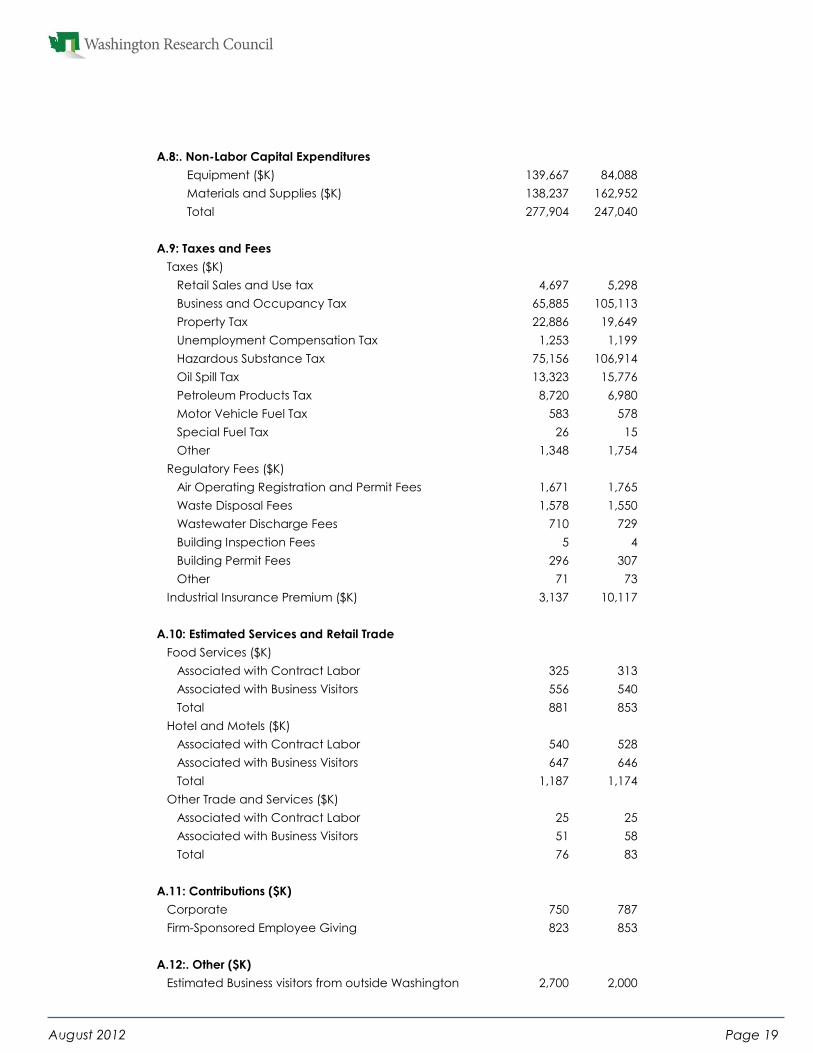
Finally, refiners contribute generously
to the communities in which they are
located. The five refiners and their em-
ployees contributed $1.6 million to vari-
ous community causes in 2011. The
firms themselves contributed about 48
percent of this, with the balance provid-
ed by firm-sponsored employee giving
(Appendix A, Table 5).
3. Oil Refining in Washington State
Building and development of the in-
dustry. The oil refining industry in
Washington state began in the mid-
1950s with construction of refineries by
Shell in Anacortes (Skagit County) and
Mobil west of Ferndale on the Strait of
Georgia (Whatcom County). Following
closely in 1957, Texaco built in Ana-
cortes, and U.S. Oil constructed its refin-
ery on the Tacoma Tideflats. In the early
1970s, in anticipation of the crude oil
that would begin flowing from Alaska's
North Slope, Atlantic Richfield (Arco)
built its refinery at Cherry Point. Now
owned by BP, this plant remains one of
the nation's newest refineries. Owner-
Refining Indirect and Induced Major Petroleum Refiners
Jobs Multiplier Economic Effect Total Economic Impact
13.23 24,288 jobs 26,274 jobs
$894,696 $1,403,093,400 personal income $1,696,096,000 personal income
$24,194 $54,149,800 sales and use taxes $48,049,000 sales and use taxes
$60,691 $15,419,000 B&O taxes $120,532,000 B&O taxes
1,986 jobs
Table 2.1: Summary of Multipliers and Economic Impacts
Source: 2012 Refiner Survey, WRC/REMI Model
Page 3 August 2012
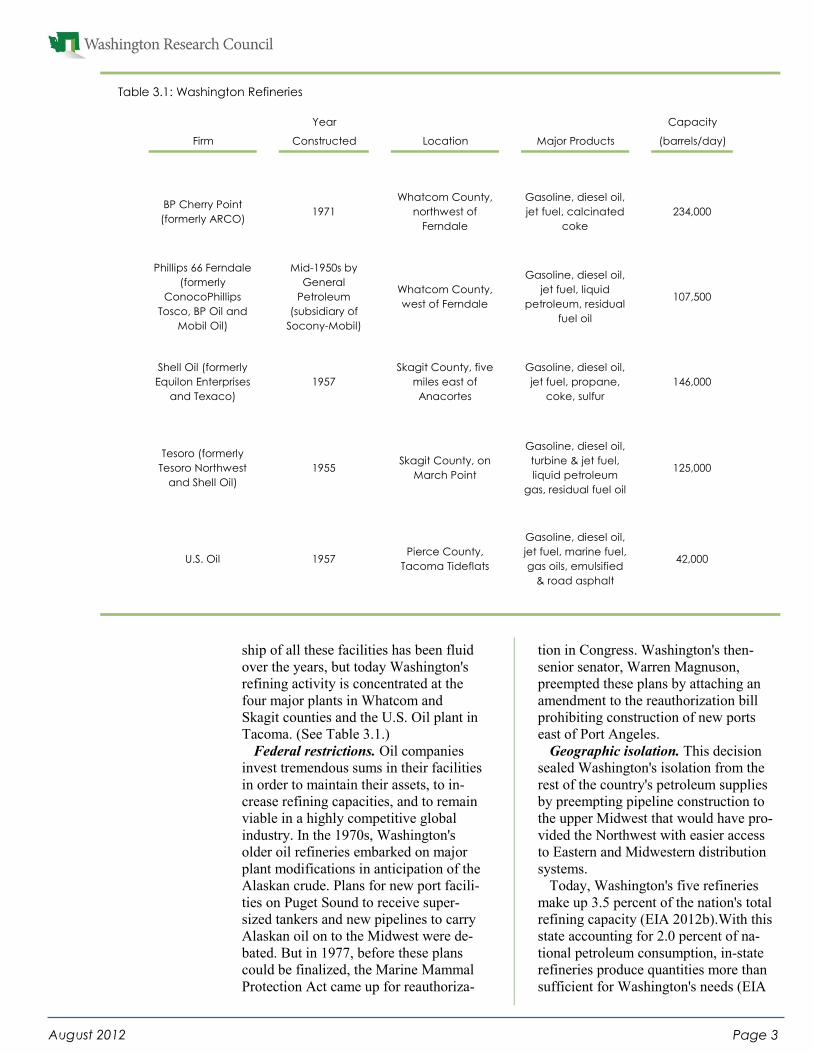
ship of all these facilities has been fluid
over the years, but today Washington's
refining activity is concentrated at the
four major plants in Whatcom and
Skagit counties and the U.S. Oil plant in
Tacoma. (See Table 3.1.)
Federal restrictions. Oil companies
invest tremendous sums in their facilities
in order to maintain their assets, to in-
crease refining capacities, and to remain
viable in a highly competitive global
industry. In the 1970s, Washington's
older oil refineries embarked on major
plant modifications in anticipation of the
Alaskan crude. Plans for new port facili-
ties on Puget Sound to receive super-
sized tankers and new pipelines to carry
Alaskan oil on to the Midwest were de-
bated. But in 1977, before these plans
could be finalized, the Marine Mammal
Protection Act came up for reauthoriza-
tion in Congress. Washington's then-
senior senator, Warren Magnuson,
preempted these plans by attaching an
amendment to the reauthorization bill
prohibiting construction of new ports
east of Port Angeles.
Geographic isolation. This decision
sealed Washington's isolation from the
rest of the country's petroleum supplies
by preempting pipeline construction to
the upper Midwest that would have pro-
vided the Northwest with easier access
to Eastern and Midwestern distribution
systems.
Today, Washington's five refineries
make up 3.5 percent of the nation's total
refining capacity (EIA 2012b).With this
state accounting for 2.0 percent of na-
tional petroleum consumption, in-state
refineries produce quantities more than
sufficient for Washington's needs (EIA
Year Capacity
Firm Constructed Location Major Products (barrels/day)
BP Cherry Point
(formerly ARCO)1971
Whatcom County,
northwest of
Ferndale
Gasoline, diesel oil,
jet fuel, calcinated
coke
234,000
Phillips 66 Ferndale
(formerly
ConocoPhillips
Tosco, BP Oil and
Mobil Oil)
Mid-1950s by
General
Petroleum
(subsidiary of
Socony-Mobil)
Whatcom County,
west of Ferndale
Gasoline, diesel oil,
jet fuel, liquid
petroleum, residual
fuel oil
107,500
Shell Oil (formerly
Equilon Enterprises
and Texaco)
1957
Skagit County, five
miles east of
Anacortes
Gasoline, diesel oil,
jet fuel, propane,
coke, sulfur
146,000
Tesoro (formerly
Tesoro Northwest
and Shell Oil)
1955Skagit County, on
March Point
Gasoline, diesel oil,
turbine & jet fuel,
liquid petroleum
gas, residual fuel oil
125,000
U.S. Oil 1957Pierce County,
Tacoma Tideflats
Gasoline, diesel oil,
jet fuel, marine fuel,
gas oils, emulsified
& road asphalt
42,000
Table 3.1: Washington Refineries
Page 4 August 2012
2012c).
Dependence on in-state refining. Oth-
er areas of the country—the Midwest
and the East—are connected to a larger
distribution system that allows their
short-term petroleum supply disruptions
to be accommodated more easily than
those in the West or in Washington state,
in particular. The West, which is not
connected to the Midwest pipeline sys-
tems, gets its crude primarily from the
Gulf of Mexico through pipelines from
Texas to the California markets, and
from Alaska's North Slope by tanker into
Anacortes and Cherry Point. To a lesser
extent, Washington refineries also re-
ceive crude from Alberta, Canada, by
pipeline.
Nationally, plant obsolescence and
federal and state regulations requiring
cleaner products and production process-
es have resulted in a reduction in the
number of operable U.S. petroleum re-
fineries from 301 in 1982 to 144 at the
beginning of 2012. Those refineries that
remain, however, are more efficient,
with nearly as much total refining capac-
ity as was available in 1982. Over the
decade prior to the 2001–03 recession,
the increased demands of a growing
population and economy and an increas-
ing array of “boutique” fuels required by
federal and state regulations strained
capacities, with price effects felt
throughout the country. The 2001–03
recession provided a respite, but capaci-
ty constraints returned at mid decade as
the economy recovered. The situation
was exacerbated by hurricane damage to
refineries along the Gulf Coast. More
recently, high crude oil prices and re-
duced demand due to the “great reces-
sion” have combined to squeeze refinery
margins.
The constrained supply-demand rela-
tionship combines with the West Coast's
isolation to produce an economy in
Washington that is unusually dependent
on its in-state refining capacity. It is this
industry and its relationship with the
larger Washington state economy that
are described in the sections that follow.
4. Industry Impact Analysis
To quantify the impact of Washington
State's refineries on its economy, we use
the WRC-REMI model to simulate a
permanent increase in refinery employ-
ment of roughly 15 percent and measure
the resulting changes in total state em-
ployment, personal income, and gross
product. Dividing these resulting chang-
es by the change in refinery employment
gives “multipliers” that are then applied
to the industry's total employment to
calculate total economic impact. For
example, in 2011 the five refineries had
1,986 employees. With a multiplier of
13.23, the total impact of the refineries
was 26,274 jobs. Similarly, the refinery
activities resulted in $894,696 of state
personal income for every direct job, or
a total statewide of $1.7 million in per-
sonal income.
The economic impacts of petroleum
refining in Washington, however, are
broader than those of most other sectors
of the economy. If petroleum prices go
up, the effects are felt in the price of
food and other essential consumer
goods, the costs of commuting, and the
cost of moving goods to market for busi-
nesses throughout the economy. And,
unlike products from other sectors, alter-
native petroleum supplies or substitute
products are not readily available in the
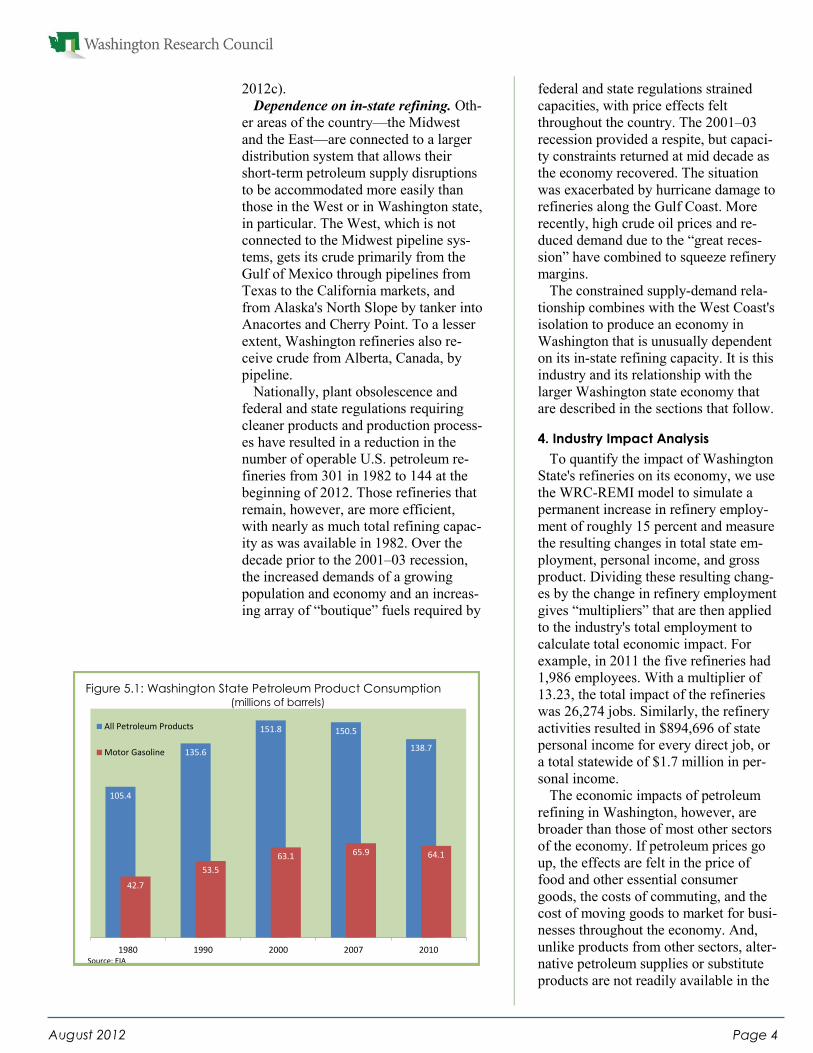
105.4
135.6
151.8 150.5
138.7
42.7
53.5
63.1 65.9 64.1
1980 1990 2000 2007 2010
All Petroleum Products
Motor Gasoline
Source: EIA
Figure 5.1: Washington State Petroleum Product Consumption (millions of barrels)
Page 5 August 2012
case of an emergency. In order to fully
appreciate the economic value of the
petroleum refining industry in Washing-
ton, the dire economic consequences
possible in a catastrophic scenario must
be acknowledged. Foreign product
would have to be imported, increased
dock and terminal capability would be
required, product prices would increase
in response to diminished supply availa-
bility and stability, and these increases
would be felt throughout the economy.
In the sections that follow, Washing-
ton's petroleum refining industry is de-
scribed under equilibrium conditions by
summarizing consumption (Section 5),
production (Section 6), and the direct
purchases of the five major industry re-
finers (Section 7). Based on these data,
the WRC-REMI model calculates the
effect of the five refineries on jobs, in-
come, retail sales and use, and B&O
taxes statewide (Section 9).
Section 8 presents a comparison of
taxes paid by hypothetical 160,000 bar-
rels-per-day refineries located in Wash-
ington and California.
Finally, in Section 10 we provide em-
ployment, wage, and tax contribution
information on the portions of the trans-
portation, wholesaling, and retailing sec-
tors that operate downstream of the re-
fining process. These petroleum-related
activities combine to assure that petrole-
um products get to their markets in
Washington state and beyond. Although
they would exist regardless of the pres-
ence of in-state refining, their inclusion
here helps to give a complete picture of
the petroleum industry in Washington
state.
5. Petroleum Product Consumption in
Washington
Washington households and business-
es consumed nearly 139 million barrels
of finished petroleum products in 2010,
up 38 percent from 1980, according to
the Energy Information Administration
(EIA). (See Figure 5.1). Washington’s
2010 consumption was 2.0 percent of
the U.S. total and about 14 percent of
EIA's western Petroleum Administration
for Defense (PAD) District V, which
18
21
24
27
30
33
$1,200
$1,400
$1,600
$1,800
$2,000
$2,200
1990 1992 1994 1996 1998 2000 2002 2004 2006 2008 2010
Real State GDP Per Barrel (Left Axis)
Barrels Per Capita (Right Axis)
Source: EIA
Transportation79.5%
Commercial2.0%
Electric Power0.03%
Industrial16.1%
Residential2.4%
Figure 5.2: Washington Petroleum Consumption Trends
Figure 5.3: 2010 Consumption By Sector
Source: EIA
Page 6 August 2012
encompasses Washington, Oregon, Cali-
fornia, Nevada, Alaska, and Hawaii.
PAD District V represented 14 percent
of total U.S. consumption in 2010 (EIA
2012c).
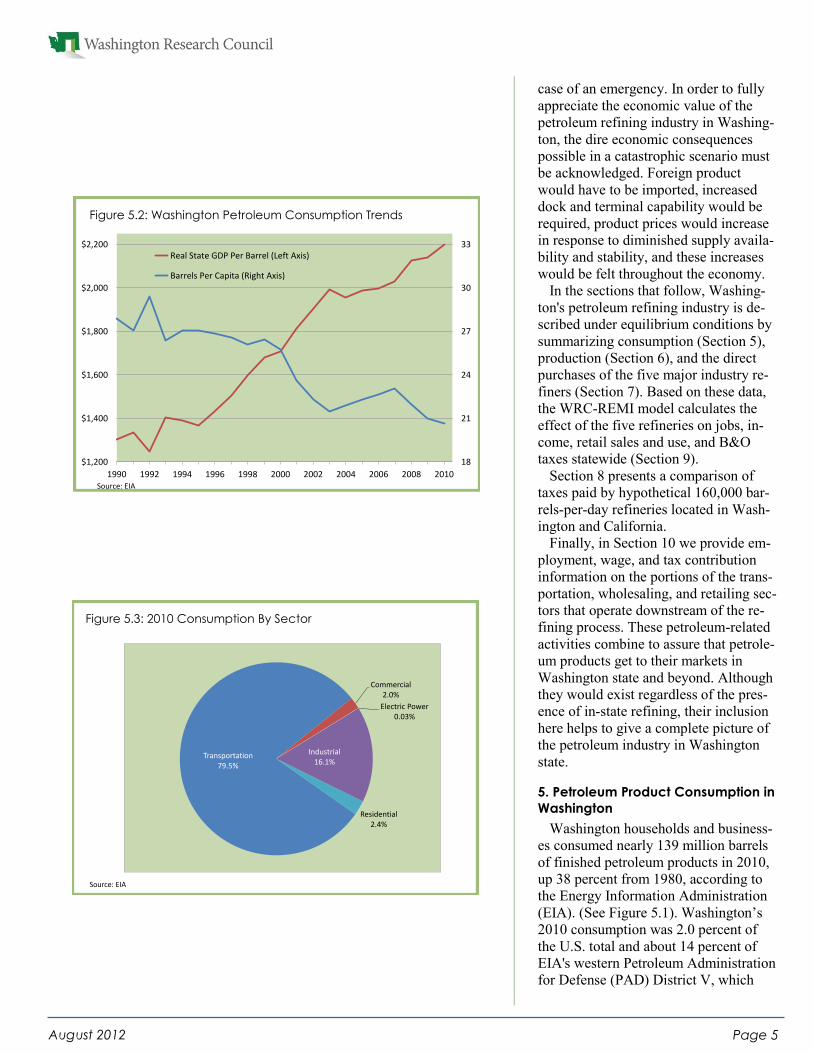
As a result of increasing fuel efficien-
cy, per-capita petroleum product con-
sumption in Washington declined from
1990 to 2010, while gross state product
per barrel of petroleum increased by 69
percent (See Figure 5.2).
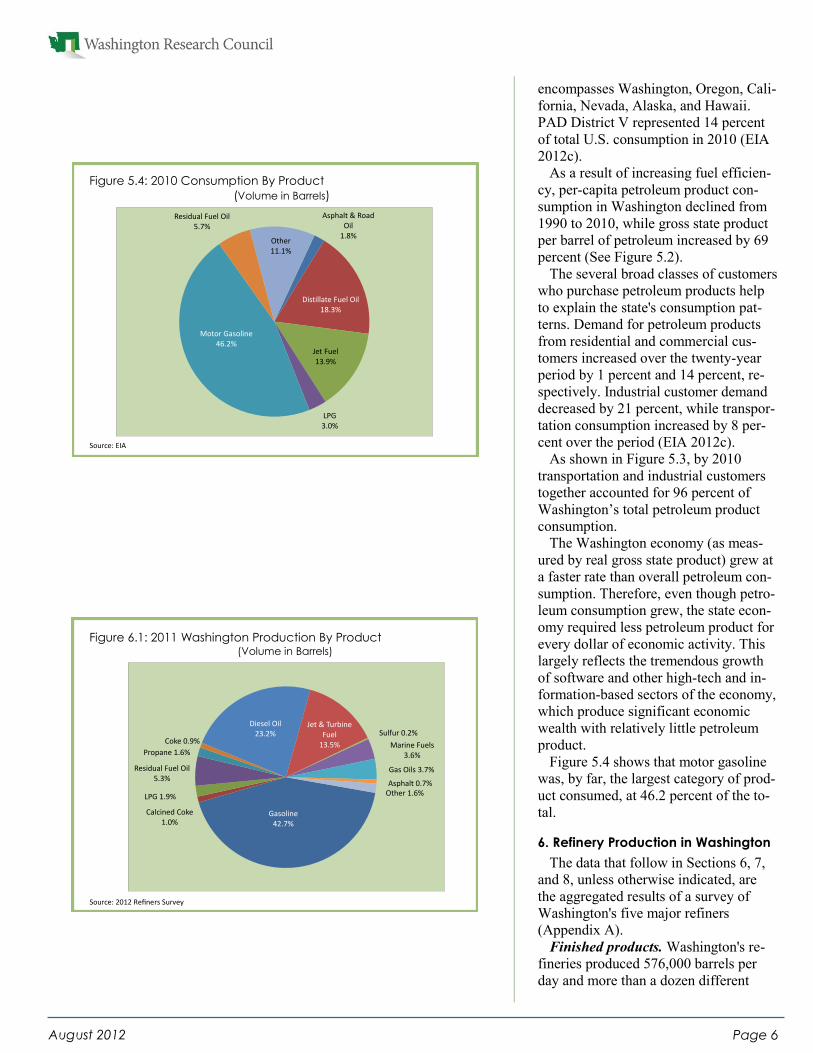
The several broad classes of customers
who purchase petroleum products help
to explain the state's consumption pat-
terns. Demand for petroleum products
from residential and commercial cus-
tomers increased over the twenty-year
period by 1 percent and 14 percent, re-
spectively. Industrial customer demand
decreased by 21 percent, while transpor-
tation consumption increased by 8 per-
cent over the period (EIA 2012c).
As shown in Figure 5.3, by 2010
transportation and industrial customers
together accounted for 96 percent of
Washington’s total petroleum product
consumption.
The Washington economy (as meas-
ured by real gross state product) grew at
a faster rate than overall petroleum con-
sumption. Therefore, even though petro-
leum consumption grew, the state econ-
omy required less petroleum product for
every dollar of economic activity. This
largely reflects the tremendous growth
of software and other high-tech and in-
formation-based sectors of the economy,
which produce significant economic
wealth with relatively little petroleum
product.
Figure 5.4 shows that motor gasoline
was, by far, the largest category of prod-
uct consumed, at 46.2 percent of the to-
tal.
6. Refinery Production in Washington
The data that follow in Sections 6, 7,
and 8, unless otherwise indicated, are
the aggregated results of a survey of
Washington's five major refiners
(Appendix A).
Finished products. Washington's re-
fineries produced 576,000 barrels per
day and more than a dozen different
Asphalt & Road Oil
1.8%
Distillate Fuel Oil18.3%
Jet Fuel13.9%
LPG3.0%
Motor Gasoline46.2%
Residual Fuel Oil5.7%
Other11.1%
Figure 5.4: 2010 Consumption By Product
(Volume in Barrels)
Source: EIA
Gasoline42.7%
Calcined Coke 1.0%
LPG 1.9%
Residual Fuel Oil5.3%
Propane 1.6%
Coke 0.9%
Diesel Oil23.2%
Jet & Turbine Fuel
13.5%
Sulfur 0.2%
Marine Fuels 3.6%
Gas Oils 3.7%
Asphalt 0.7%Other 1.6%
Figure 6.1: 2011 Washington Production By Product (Volume in Barrels)
Source: 2012 Refiners Survey
Page 7 August 2012
products in 2011. Gasoline, at nearly
246,200 barrels per day in 2011, is by
far the largest product category, ac-
counting for 43 percent of the total. Die-
sel oil and jet fuel are the next largest at
23 percent and 14 percent, respectively
(See Figure 6.1).
Gasoline accounted for about 45 per-
cent of the refineries’ total $24.2 billion
in output value in 2011. Again, diesel oil
and jet fuel are next, accounting for 26
percent and 14 percent, respectively.
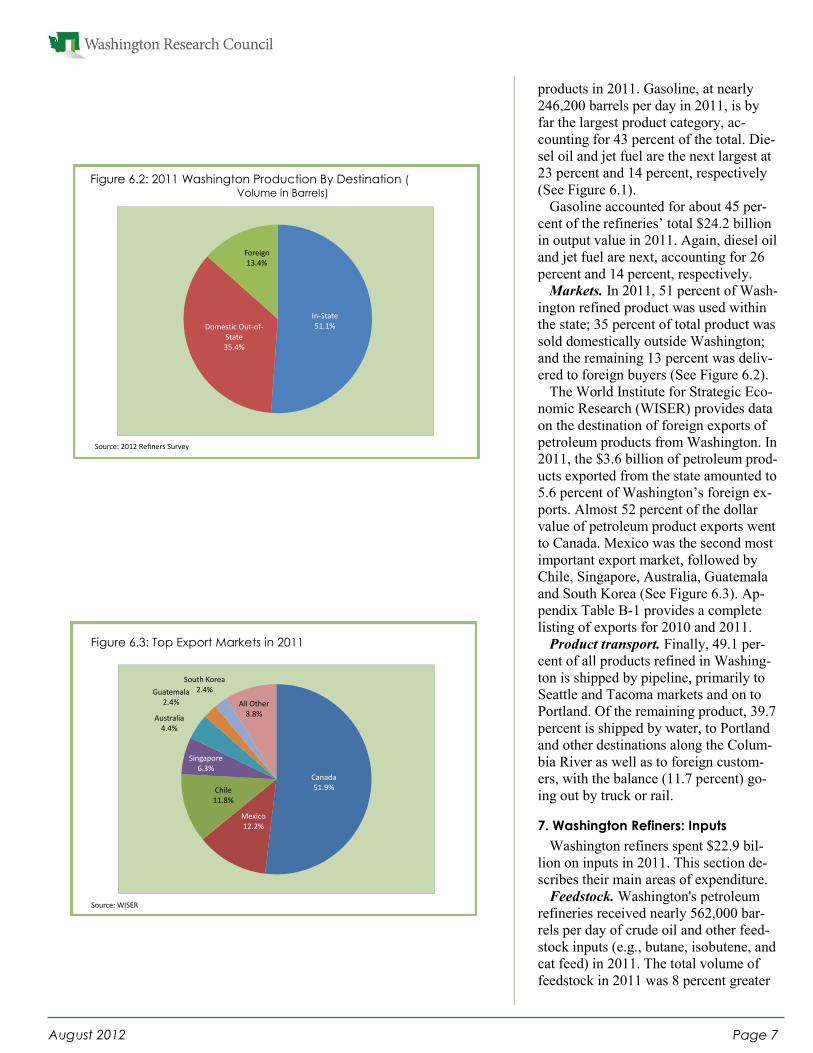
Markets. In 2011, 51 percent of Wash-
ington refined product was used within
the state; 35 percent of total product was
sold domestically outside Washington;
and the remaining 13 percent was deliv-
ered to foreign buyers (See Figure 6.2).
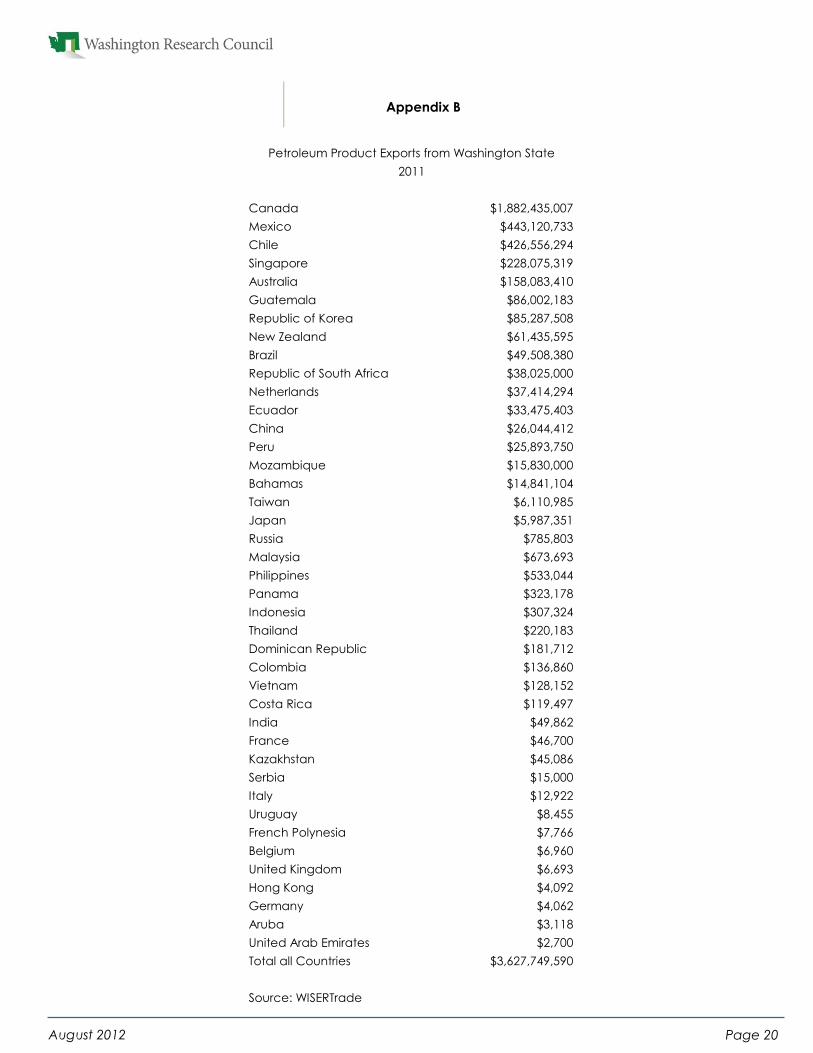
The World Institute for Strategic Eco-
nomic Research (WISER) provides data
on the destination of foreign exports of
petroleum products from Washington. In
2011, the $3.6 billion of petroleum prod-
ucts exported from the state amounted to
5.6 percent of Washington’s foreign ex-
ports. Almost 52 percent of the dollar
value of petroleum product exports went
to Canada. Mexico was the second most
important export market, followed by
Chile, Singapore, Australia, Guatemala
and South Korea (See Figure 6.3). Ap-
pendix Table B-1 provides a complete
listing of exports for 2010 and 2011.
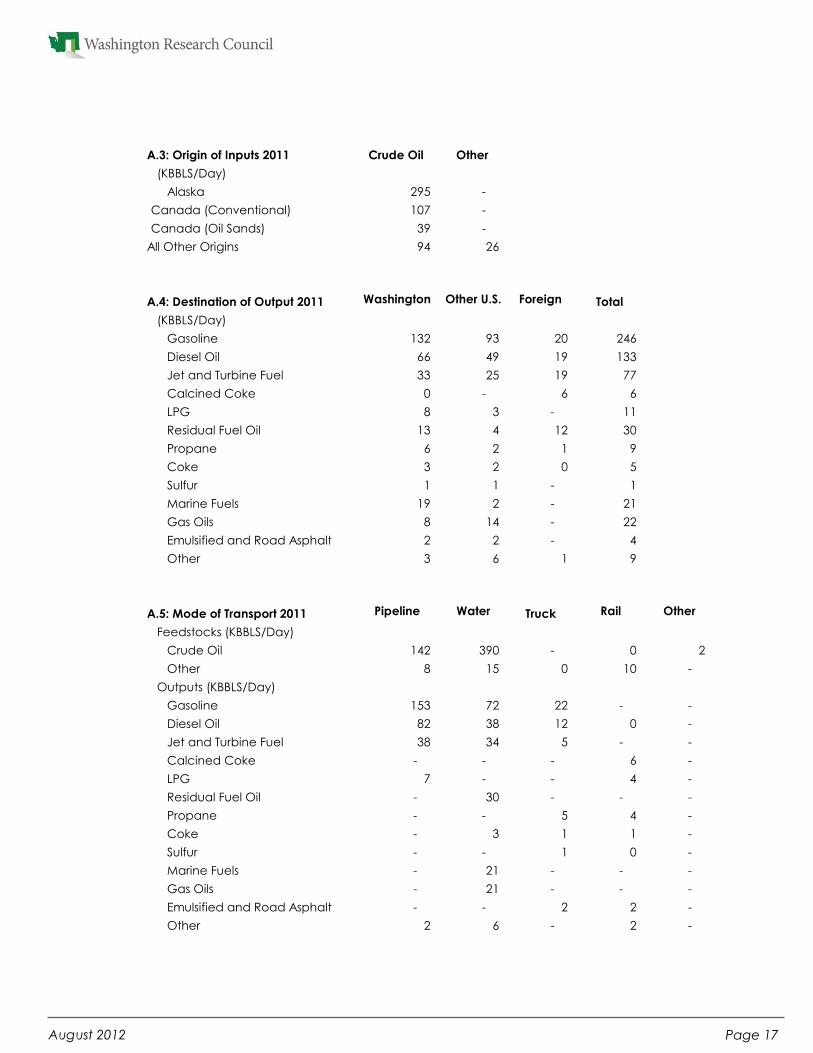
Product transport. Finally, 49.1 per-
cent of all products refined in Washing-
ton is shipped by pipeline, primarily to
Seattle and Tacoma markets and on to
Portland. Of the remaining product, 39.7
percent is shipped by water, to Portland
and other destinations along the Colum-
bia River as well as to foreign custom-
ers, with the balance (11.7 percent) go-
ing out by truck or rail.
7. Washington Refiners: Inputs
Washington refiners spent $22.9 bil-
lion on inputs in 2011. This section de-
scribes their main areas of expenditure.
Feedstock. Washington's petroleum
refineries received nearly 562,000 bar-
rels per day of crude oil and other feed-
stock inputs (e.g., butane, isobutene, and
cat feed) in 2011. The total volume of
feedstock in 2011 was 8 percent greater
Canada51.9%
Mexico12.2%
Chile11.8%
Singapore6.3%
Australia4.4%
Guatemala2.4%
South Korea2.4%
All Other8.8%
Figure 6.3: Top Export Markets in 2011
Source: WISER
In-State51.1%Domestic Out-of-
State35.4%
Foreign13.4%
Figure 6.2: 2011 Washington Production By Destination ( Volume in Barrels)
Source: 2012 Refiners Survey
Page 8 August 2012
than 2010, when the Tesoro refinery was
shut down for 6 months following the
April 2 fire. Feedstock costs, however,
grew by a much greater 43 percent from
$14.83 billion in 2010 to $21.14 billion
in 2011 (See Table 7.1). The cost per
barrel of crude explains most of this in-
crease, as it increased significantly over
the period.
In 2011, 73 percent of crude oil came
into the refineries by water; the majority
of this (55 percent of the crude oil total)
came from Alaska. Other origins of wa-
terborne crude oil included Russia,
Oman, California and Canada. Almost
all of the remaining 27 percent came
through pipeline from Alberta, Canada.
Of the Canadian crude oil, 27 percent
was derived from oil sands, while 73
percent was conventional.
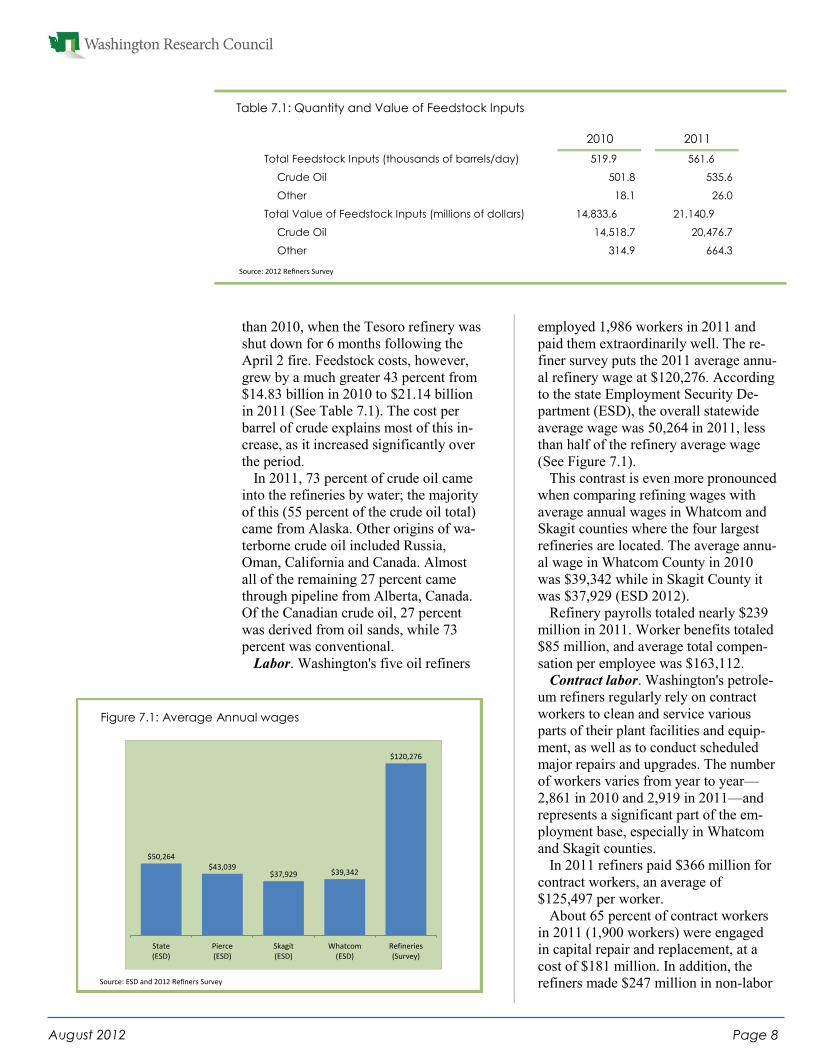
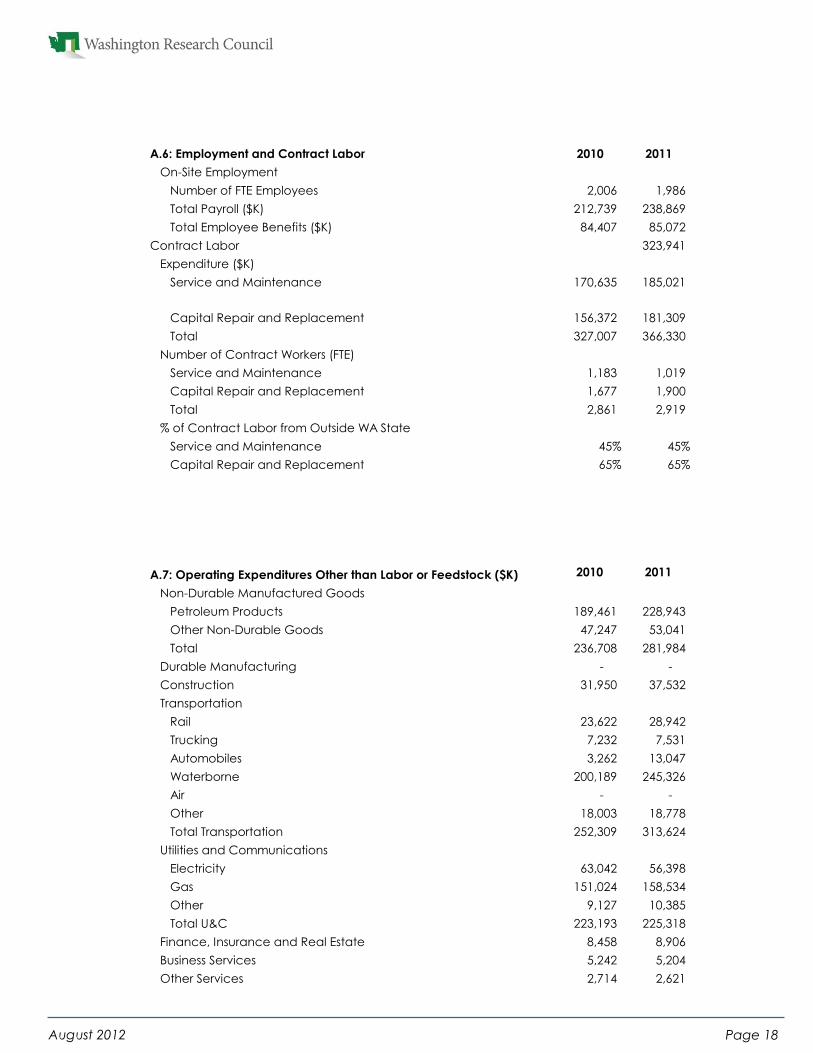
Labor. Washington's five oil refiners
employed 1,986 workers in 2011 and
paid them extraordinarily well. The re-
finer survey puts the 2011 average annu-
al refinery wage at $120,276. According
to the state Employment Security De-
partment (ESD), the overall statewide
average wage was 50,264 in 2011, less
than half of the refinery average wage
(See Figure 7.1).
This contrast is even more pronounced
when comparing refining wages with
average annual wages in Whatcom and
Skagit counties where the four largest
refineries are located. The average annu-
al wage in Whatcom County in 2010
was $39,342 while in Skagit County it
was $37,929 (ESD 2012).
Refinery payrolls totaled nearly $239
million in 2011. Worker benefits totaled
$85 million, and average total compen-
sation per employee was $163,112.
Contract labor. Washington's petrole-
um refiners regularly rely on contract
workers to clean and service various
parts of their plant facilities and equip-
ment, as well as to conduct scheduled
major repairs and upgrades. The number
of workers varies from year to year—
2,861 in 2010 and 2,919 in 2011—and
represents a significant part of the em-
ployment base, especially in Whatcom
and Skagit counties.
In 2011 refiners paid $366 million for
contract workers, an average of
$125,497 per worker.
About 65 percent of contract workers
in 2011 (1,900 workers) were engaged
in capital repair and replacement, at a
cost of $181 million. In addition, the
refiners made $247 million in non-labor
$50,264 $43,039
$37,929 $39,342
$120,276
State(ESD)
Pierce(ESD)
Skagit(ESD)
Whatcom(ESD)
Refineries(Survey)
Figure 7.1: Average Annual wages
Source: ESD and 2012 Refiners Survey
Total Feedstock Inputs (thousands of barrels/day) 519.9 561.6
Crude Oil
Other
Total Value of Feedstock Inputs (millions of dollars) 14,833.6 21,140.9
Crude Oil
Other
14,518.7 20,476.7
314.9 664.3
2010 2011
501.8 535.6
18.1 26.0
Table 7.1: Quantity and Value of Feedstock Inputs
Source: 2012 Refiners Survey
Page 9 August 2012
operating expenditures. Purposes includ-
ed safety and environmental compliance,
efficiency improvements and capacity
expansion.
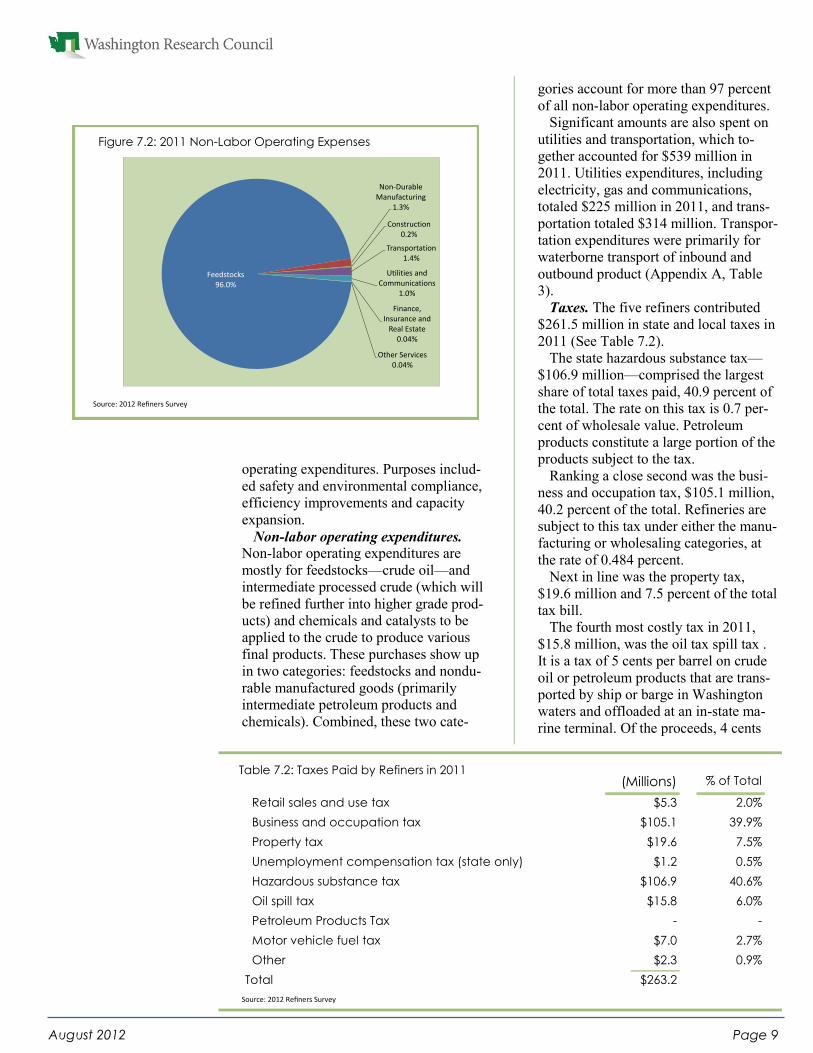
Non-labor operating expenditures.
Non-labor operating expenditures are
mostly for feedstocks—crude oil—and
intermediate processed crude (which will
be refined further into higher grade prod-
ucts) and chemicals and catalysts to be
applied to the crude to produce various
final products. These purchases show up
in two categories: feedstocks and nondu-
rable manufactured goods (primarily
intermediate petroleum products and
chemicals). Combined, these two cate-
gories account for more than 97 percent
of all non-labor operating expenditures.
Significant amounts are also spent on
utilities and transportation, which to-
gether accounted for $539 million in
2011. Utilities expenditures, including
electricity, gas and communications,
totaled $225 million in 2011, and trans-
portation totaled $314 million. Transpor-
tation expenditures were primarily for
waterborne transport of inbound and
outbound product (Appendix A, Table
3).
Taxes. The five refiners contributed
$261.5 million in state and local taxes in
2011 (See Table 7.2).
The state hazardous substance tax—
$106.9 million—comprised the largest
share of total taxes paid, 40.9 percent of
the total. The rate on this tax is 0.7 per-
cent of wholesale value. Petroleum
products constitute a large portion of the
products subject to the tax.
Ranking a close second was the busi-
ness and occupation tax, $105.1 million,
40.2 percent of the total. Refineries are
subject to this tax under either the manu-
facturing or wholesaling categories, at
the rate of 0.484 percent.
Next in line was the property tax,
$19.6 million and 7.5 percent of the total
tax bill.
The fourth most costly tax in 2011,
$15.8 million, was the oil tax spill tax .
It is a tax of 5 cents per barrel on crude
oil or petroleum products that are trans-
ported by ship or barge in Washington
waters and offloaded at an in-state ma-
rine terminal. Of the proceeds, 4 cents
% of Total
Retail sales and use tax $5.3 2.0%
Business and occupation tax $105.1 39.9%
Property tax $19.6 7.5%
Unemployment compensation tax (state only) $1.2 0.5%
Hazardous substance tax $106.9 40.6%
Oil spill tax $15.8 6.0%
Petroleum Products Tax - -
Motor vehicle fuel tax $7.0 2.7%
Other $2.3 0.9%
Total $263.2
(Millions)Table 7.2: Taxes Paid by Refiners in 2011
Source: 2012 Refiners Survey
Feedstocks96.0%
Non-Durable Manufacturing
1.3%
Construction0.2%
Transportation1.4%
Utilities and Communications
1.0%
Finance, Insurance and
Real Estate0.04%
Other Services0.04%
Figure 7.2: 2011 Non-Labor Operating Expenses
Source: 2012 Refiners Survey
Page 10 August 2012
are paid into the oil spill administration
account and 1 cent into the oil spill re-
sponse account. When (as is currently
the case) the oil spill response account is
fully funded, the 1 cent tax is suspended;
when the account is short of funds, the
tax is resumed. The 1 cent response tax
was last collected during the 18-month
period from April 1, 2008 to September
30, 2009. Through a credit, the tax is
effectively eliminated for crude oil or
petroleum products exported from the
state.
The petroleum products tax—$7.0 mil-
lion reportedly paid in 2011 and 2 per-
cent of the total—is another tax unique
to the petroleum industries. Revenues
from this tax are dedicated to the pollu-
tion liability insurance program, which
assists owners of underground storage
tanks in obtaining insurance for upgrad-
ing and replacing tanks and preventing
leaks. This tax is suspended when the
pollution liability insurance program
account balance exceeds a trigger value.
The trust fund balance reached the trig-
ger in the first quarter of 2010. The tax
was suspended on April 1 of that year
and remains suspended today.
The refineries reported paying $5.3
million in sales and use taxes in 2011.
Currently the sales and use tax rate paid
by the two Skagit County refineries is
8.2 percent; the rate paid by the two
Whatcom County refineries is 8.5 per-
cent; and the rate paid by the Tacoma
refinery is 9.5 percent.
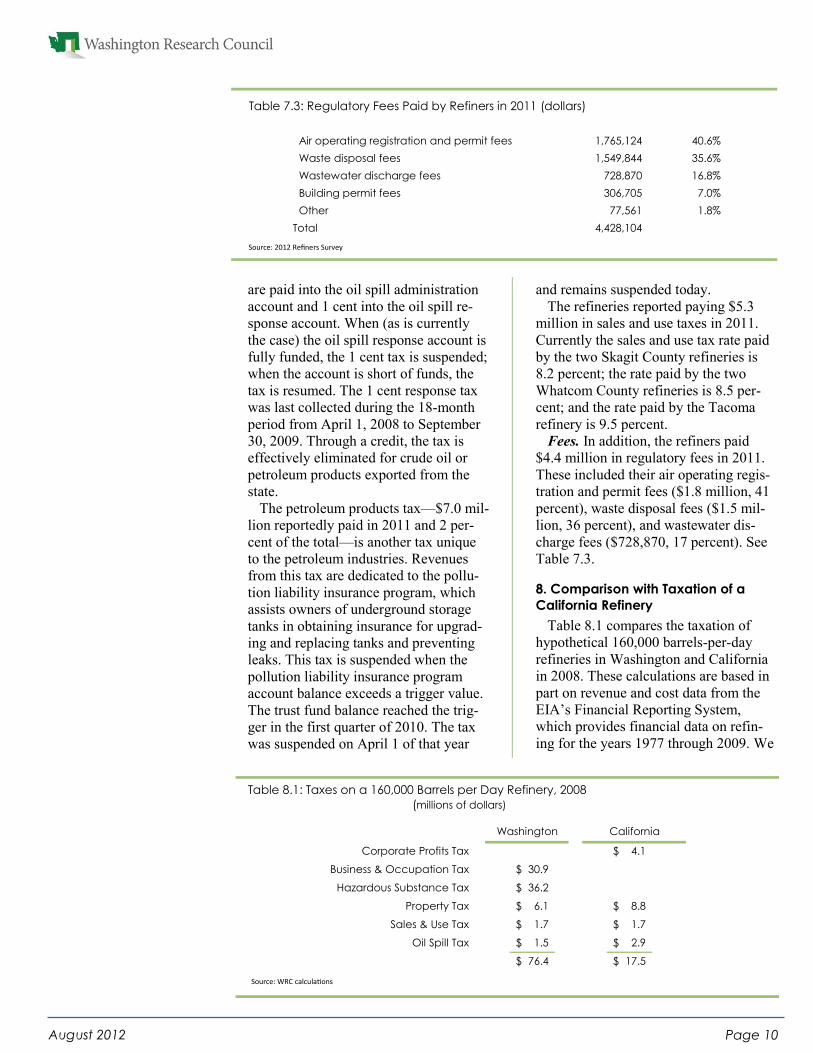
Fees. In addition, the refiners paid
$4.4 million in regulatory fees in 2011.
These included their air operating regis-
tration and permit fees ($1.8 million, 41
percent), waste disposal fees ($1.5 mil-
lion, 36 percent), and wastewater dis-
charge fees ($728,870, 17 percent). See
Table 7.3.
8. Comparison with Taxation of a
California Refinery
Table 8.1 compares the taxation of
hypothetical 160,000 barrels-per-day
refineries in Washington and California
in 2008. These calculations are based in
part on revenue and cost data from the
EIA’s Financial Reporting System,
which provides financial data on refin-
ing for the years 1977 through 2009. We
Corporate Profits Tax 4.1$
Business & Occupation Tax 30.9$
Hazardous Substance Tax 36.2$
Property Tax 6.1$ 8.8$
Sales & Use Tax 1.7$ 1.7$
Oil Spill Tax 1.5$ 2.9$
76.4$ 17.5$
Washington California
Air operating registration and permit fees 1,765,124 40.6%
Waste disposal fees 1,549,844 35.6%
Wastewater discharge fees 728,870 16.8%
Building permit fees 306,705 7.0%
Other 77,561 1.8%
Total 4,428,104
Table 7.3: Regulatory Fees Paid by Refiners in 2011 (dollars)
Source: 2012 Refiners Survey
Table 8.1: Taxes on a 160,000 Barrels per Day Refinery, 2008
(millions of dollars)
Source: WRC calculations
Page 11 August 2012
have chosen 2008, rather than 2009, as
the comparison year because refineries
were unprofitable in 2009 (EIA 2011,
Table T 19).
We focus on six major taxes. One of
these taxes—the corporate income tax—
is levied in California but not in Wash-
ington. Two of these taxes—the business
and occupation tax and the hazardous
substance tax—are levied in Washington
but not in California. The remaining
three taxes—the sales and use tax, the
property tax and the oil spill tax—are
levied in both states.
The overall 2008 tax burden in Wash-
ington, $76.4 million, is more than four
times the burden in California, $17.5
million. This is largely due to the fact
that the Washington refinery pays con-
siderably more in B&O and hazardous
substance taxes than the California refin-
ery pays in corporate income tax.
Corporate income tax. California’s
primary business tax is a corporate in-
come tax. To avoid the complications
inherent in state-level income taxation of
multi-state businesses, we assume that
the corporation owning the refinery does
business only in California. California’s
corporate income tax rate is 8.84 per-
cent. Based on EIA data for 2008, we
estimate the taxable income for a
160,000 barrels-per-day refinery to be
$46.0 million and the corporate income
tax due to be $4.1 million.
B&O tax. The B&O tax is Washing-
ton’s primary business tax. It is a tax on
a business’s gross receipts. Our 160,000
barrel per day refinery has refined prod-
uct sales of $6.4 billion. This results in a
B&O tax obligation of $30.9 million at
the manufacturing/wholesaling rate of
0.484 percent. This is seven times the
corresponding obligation under the Cali-
fornia income tax.
The B&O tax is a tax on gross income,
without any deductions for the costs of
producing the goods or services sold,
while the corporate income tax is a tax
on net income, after deduction of these
costs. The B&O tax tends to be burden-
some, compared to a corporate income
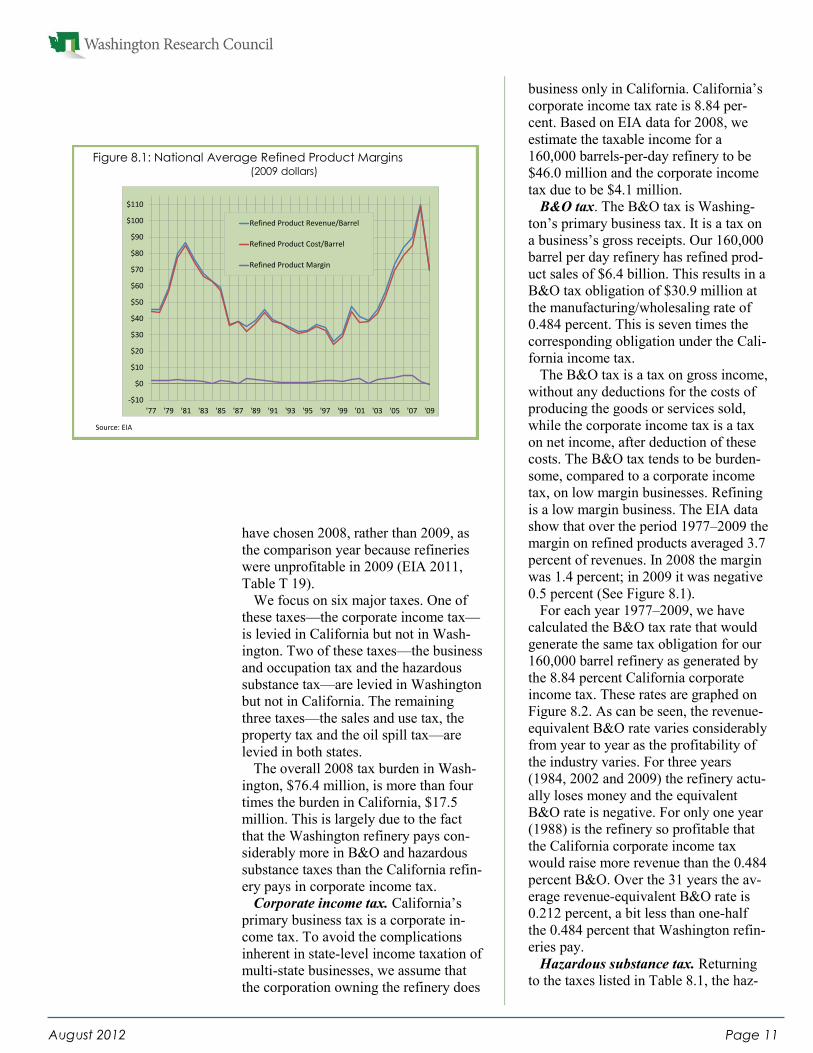
tax, on low margin businesses. Refining
is a low margin business. The EIA data
show that over the period 1977–2009 the
margin on refined products averaged 3.7
percent of revenues. In 2008 the margin
was 1.4 percent; in 2009 it was negative
0.5 percent (See Figure 8.1).
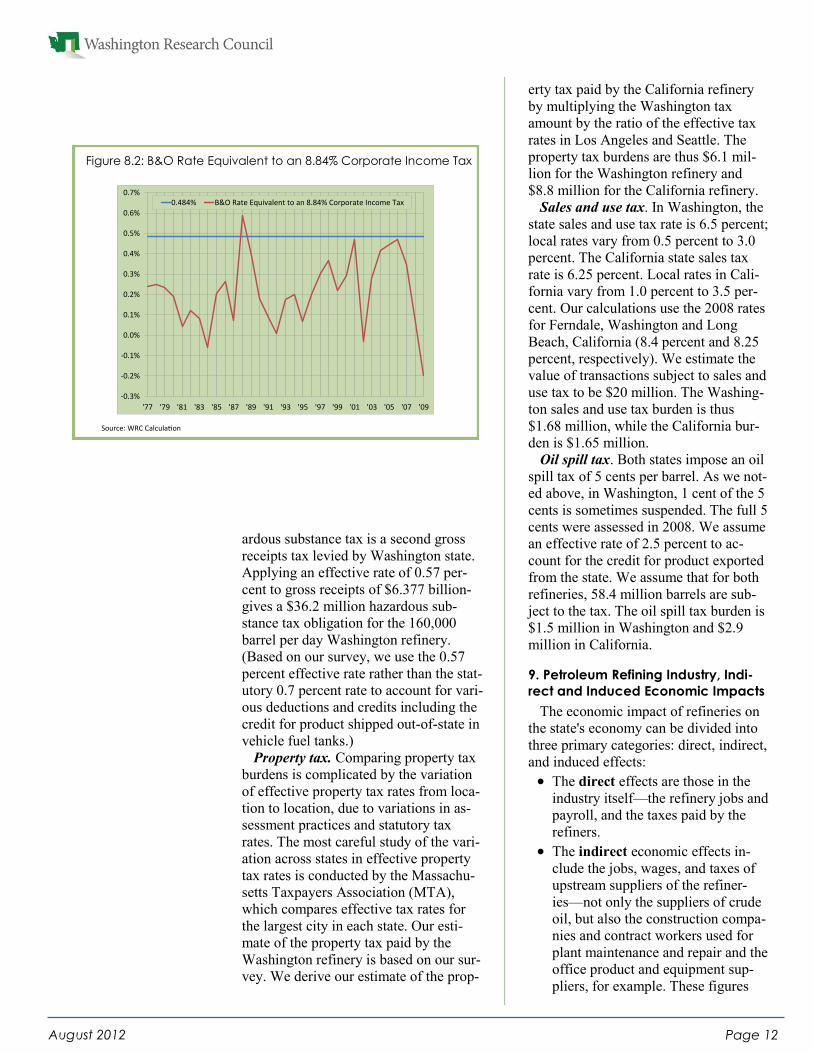
For each year 1977–2009, we have
calculated the B&O tax rate that would
generate the same tax obligation for our
160,000 barrel refinery as generated by
the 8.84 percent California corporate
income tax. These rates are graphed on
Figure 8.2. As can be seen, the revenue-
equivalent B&O rate varies considerably
from year to year as the profitability of
the industry varies. For three years
(1984, 2002 and 2009) the refinery actu-
ally loses money and the equivalent
B&O rate is negative. For only one year
(1988) is the refinery so profitable that
the California corporate income tax
would raise more revenue than the 0.484
percent B&O. Over the 31 years the av-
erage revenue-equivalent B&O rate is
0.212 percent, a bit less than one-half
the 0.484 percent that Washington refin-
eries pay.
Hazardous substance tax. Returning
to the taxes listed in Table 8.1, the haz-
-$10
$0
$10
$20
$30
$40
$50
$60
$70
$80
$90
$100
$110
'77 '79 '81 '83 '85 '87 '89 '91 '93 '95 '97 '99 '01 '03 '05 '07 '09
Refined Product Revenue/Barrel
Refined Product Cost/Barrel
Refined Product Margin
Figure 8.1: National Average Refined Product Margins (2009 dollars)
Source: EIA
Page 12 August 2012
ardous substance tax is a second gross
receipts tax levied by Washington state.
Applying an effective rate of 0.57 per-
cent to gross receipts of $6.377 billion-
gives a $36.2 million hazardous sub-
stance tax obligation for the 160,000
barrel per day Washington refinery.
(Based on our survey, we use the 0.57
percent effective rate rather than the stat-
utory 0.7 percent rate to account for vari-
ous deductions and credits including the
credit for product shipped out-of-state in
vehicle fuel tanks.)
Property tax. Comparing property tax
burdens is complicated by the variation
of effective property tax rates from loca-
tion to location, due to variations in as-
sessment practices and statutory tax
rates. The most careful study of the vari-
ation across states in effective property
tax rates is conducted by the Massachu-
setts Taxpayers Association (MTA),
which compares effective tax rates for
the largest city in each state. Our esti-
mate of the property tax paid by the
Washington refinery is based on our sur-
vey. We derive our estimate of the prop-
erty tax paid by the California refinery
by multiplying the Washington tax
amount by the ratio of the effective tax
rates in Los Angeles and Seattle. The
property tax burdens are thus $6.1 mil-
lion for the Washington refinery and
$8.8 million for the California refinery.
Sales and use tax. In Washington, the
state sales and use tax rate is 6.5 percent;
local rates vary from 0.5 percent to 3.0
percent. The California state sales tax
rate is 6.25 percent. Local rates in Cali-
fornia vary from 1.0 percent to 3.5 per-
cent. Our calculations use the 2008 rates
for Ferndale, Washington and Long
Beach, California (8.4 percent and 8.25
percent, respectively). We estimate the
value of transactions subject to sales and
use tax to be $20 million. The Washing-
ton sales and use tax burden is thus
$1.68 million, while the California bur-
den is $1.65 million.
Oil spill tax. Both states impose an oil
spill tax of 5 cents per barrel. As we not-
ed above, in Washington, 1 cent of the 5
cents is sometimes suspended. The full 5
cents were assessed in 2008. We assume
an effective rate of 2.5 percent to ac-
count for the credit for product exported
from the state. We assume that for both
refineries, 58.4 million barrels are sub-
ject to the tax. The oil spill tax burden is
$1.5 million in Washington and $2.9
million in California.
9. Petroleum Refining Industry, Indi-
rect and Induced Economic Impacts
The economic impact of refineries on
the state's economy can be divided into
three primary categories: direct, indirect,
and induced effects:
The direct effects are those in the
industry itself—the refinery jobs and
payroll, and the taxes paid by the
refiners.
The indirect economic effects in-
clude the jobs, wages, and taxes of
upstream suppliers of the refiner-
ies—not only the suppliers of crude
oil, but also the construction compa-
nies and contract workers used for
plant maintenance and repair and the
office product and equipment sup-
pliers, for example. These figures
-0.3%
-0.2%
-0.1%
0.0%
0.1%
0.2%
0.3%
0.4%
0.5%
0.6%
0.7%
'77 '79 '81 '83 '85 '87 '89 '91 '93 '95 '97 '99 '01 '03 '05 '07 '09
0.484% B&O Rate Equivalent to an 8.84% Corporate Income Tax
Source: WRC Calculation
Figure 8.2: B&O Rate Equivalent to an 8.84% Corporate Income Tax
Page 13 August 2012
were captured in the survey complet-
ed by the five refiners. The indirect
economic effects also include the
jobs, wages, and taxes of suppliers’
suppliers; of the suppliers’ suppliers’
suppliers; and so on up the supply
chain.
Finally, the induced effects are the
jobs, income, and taxes contributed
by firms in industries that supply
daily consumables and services—
e.g., food, dry cleaning, banking—to
workers holding the direct and indi-
rect jobs.
The relationship between the direct
jobs, income, and tax effects in an indus-
try and their indirect and induced effects
are captured by multipliers, which are
calculated using the WRC-REMI model
of the Washington state economy.
The employment multiplier for the
petroleum refining industry is 13.23.
Applying this multiplier to the 1,986
direct refinery jobs in 2011 gives a total
state employment impact of 26,274 jobs.
This is an unusually large employment
multiplier. In comparison, the 2002
Washington state Input-Output Study
(2008) calculates that the employment
multiplier for manufacturing/
construction overall is 2.52. Part of this
difference arises because the WRC-
REMI is more comprehensive than the
simple input-output model. Foremost
among the impact channels omitted from
the simple input-output model are in-
migration and investment. When we run
the WRC-REMI model with these chan-
nels turned off, the employment multi-
plier for petroleum refining is reduced to
6.74. When we run such a WRC-REMI
simulation for the larger petroleum and
coal products manufacturing sector (the
“three-digit” sub-sector of manufactur-
ing that contains the petroleum refining
industry) the employment multiplier is
4.46. This is actually less than the 9.56
multiplier that the Washington Input-
Output Model gives for petroleum and
coal products manufacturing. (This 9.56
is the highest employment multiplier
found by the 2002 Input-Output Study.)
Several additional factors contribute to
the industry's large multiplier. First, pe-
troleum refiners pay high wages. As a
result, the employment induced by refin-
ery employee spending is relatively
great. Second, the petroleum industry
ranks high in the ratio of in-state sup-
plied intermediate inputs (including con-
tract labor) to employee income. For this
reason, indirect employment is relatively
high. And some of these indirect jobs
(contract labor, in particular) pay unusu-
ally high wages.
The WRC-REMI model calculates that
each refining job results in an additional
$894,696 of state personal income. At
2011 employment levels, the industry
adds $1.8 billion to state personal in-
come.
In 2011 state and local sales and use
taxes averaged $0.0270 for each dollar
of state personal income. With the in-
come multiplier of $894,696, each petro-
leum refining job results in $24,194 in
state and local sales taxes or a total of
$48.0 million.
The refiners directly paid $105.1 mil-
lion in B&O taxes in 2011. In 2009 state
B&O taxes averaged $0.00106 for each
dollar of personal income. Multiplying
this rate into $1,452.9 million—the in-
crease in state personal income we as-
cribe to the 1,986 refinery jobs net of the
wages and benefits of the refinery work-
ers—gives $15.4 million additional in-
duced and indirect B&O tax revenue, for
a total of $120.5 million, or $60,691 per
direct job.
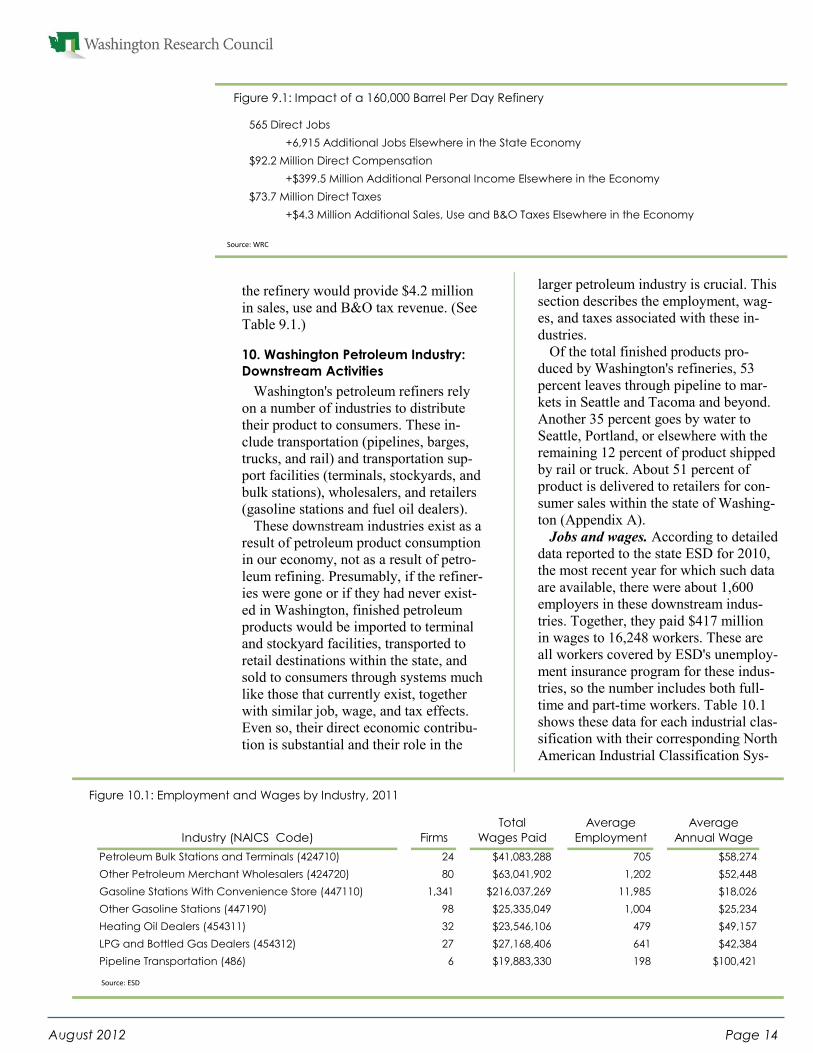
These impacts can be expressed in
terms of the hypothetical Washington
refinery producing 160,000 barrels of
product a day that was analyzed in Sec-
tion 8. In 2011, this refinery would have
provided 552 jobs, and these workers
would have received $66.4 million in
wages and salaries and $23.6 million in
benefits. In addition to the direct jobs
and income, the refinery would generate
6,747 jobs and $389.9 million in person-
al income elsewhere in the state’s econ-
omy. The refinery itself would pay
$72.6 million in state and local taxes. In
addition to these direct taxes, the indi-
rect and induced activities generated by
Page 14 August 2012
the refinery would provide $4.2 million
in sales, use and B&O tax revenue. (See
Table 9.1.)
10. Washington Petroleum Industry:
Downstream Activities
Washington's petroleum refiners rely
on a number of industries to distribute
their product to consumers. These in-
clude transportation (pipelines, barges,
trucks, and rail) and transportation sup-
port facilities (terminals, stockyards, and
bulk stations), wholesalers, and retailers
(gasoline stations and fuel oil dealers).
These downstream industries exist as a
result of petroleum product consumption
in our economy, not as a result of petro-
leum refining. Presumably, if the refiner-
ies were gone or if they had never exist-
ed in Washington, finished petroleum
products would be imported to terminal
and stockyard facilities, transported to
retail destinations within the state, and
sold to consumers through systems much
like those that currently exist, together
with similar job, wage, and tax effects.
Even so, their direct economic contribu-
tion is substantial and their role in the
larger petroleum industry is crucial. This
section describes the employment, wag-
es, and taxes associated with these in-
dustries.
Of the total finished products pro-
duced by Washington's refineries, 53
percent leaves through pipeline to mar-
kets in Seattle and Tacoma and beyond.
Another 35 percent goes by water to
Seattle, Portland, or elsewhere with the
remaining 12 percent of product shipped
by rail or truck. About 51 percent of
product is delivered to retailers for con-
sumer sales within the state of Washing-
ton (Appendix A).
Jobs and wages. According to detailed
data reported to the state ESD for 2010,
the most recent year for which such data
are available, there were about 1,600
employers in these downstream indus-
tries. Together, they paid $417 million
in wages to 16,248 workers. These are
all workers covered by ESD's unemploy-
ment insurance program for these indus-
tries, so the number includes both full-
time and part-time workers. Table 10.1
shows these data for each industrial clas-
sification with their corresponding North
American Industrial Classification Sys-
Total Average Average
Industry (NAICS Code) Firms Wages Paid Employment Annual Wage
Petroleum Bulk Stations and Terminals (424710) 24 $41,083,288 705 $58,274
Other Petroleum Merchant Wholesalers (424720) 80 $63,041,902 1,202 $52,448
Gasoline Stations With Convenience Store (447110) 1,341 $216,037,269 11,985 $18,026
Other Gasoline Stations (447190) 98 $25,335,049 1,004 $25,234
Heating Oil Dealers (454311) 32 $23,546,106 479 $49,157
LPG and Bottled Gas Dealers (454312) 27 $27,168,406 641 $42,384
Pipeline Transportation (486) 6 $19,883,330 198 $100,421
565 Direct Jobs
+6,915 Additional Jobs Elsewhere in the State Economy
$92.2 Million Direct Compensation
+$399.5 Million Additional Personal Income Elsewhere in the Economy
$73.7 Million Direct Taxes
+$4.3 Million Additional Sales, Use and B&O Taxes Elsewhere in the Economy
Figure 9.1: Impact of a 160,000 Barrel Per Day Refinery
Figure 10.1: Employment and Wages by Industry, 2011
Source: ESD
Source: WRC
Page 15 August 2012
tem (NAICS) codes.
Among the downstream industries
there are three broad tiers of employ-
ment and pay:
Pipeline transport employs a few
highly paid workers—198 workers
make about $100,421 per year on
average.
Bulk stations and terminals, whole-
salers, and fuel oil dealers employ
about 3,027 workers and pay an av-
erage of nearly $51,200 per worker
per year.
Gasoline stations generate a large
wage bill with a lot of lower-wage
and part-time jobs. In 2011, this in-
dustry's 1,439 employers paid total
wages of $241.42 million to 12,989
workers.
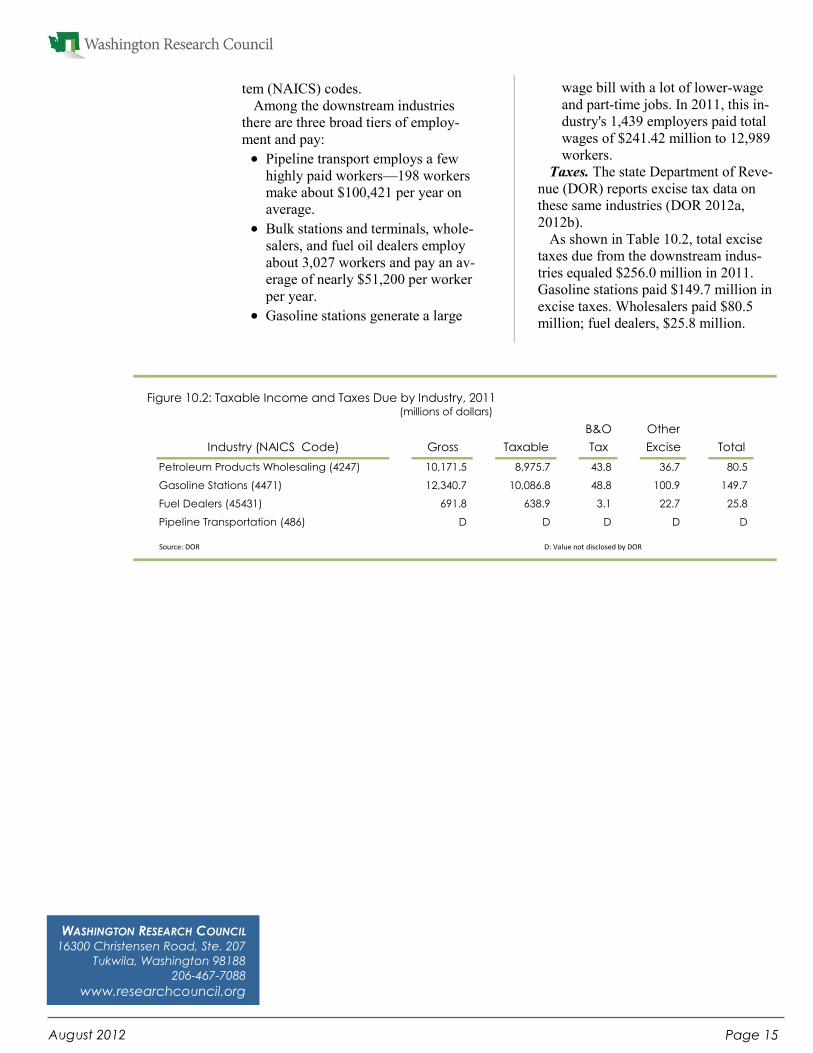
Taxes. The state Department of Reve-
nue (DOR) reports excise tax data on
these same industries (DOR 2012a,
2012b).
As shown in Table 10.2, total excise
taxes due from the downstream indus-
tries equaled $256.0 million in 2011.
Gasoline stations paid $149.7 million in
excise taxes. Wholesalers paid $80.5
million; fuel dealers, $25.8 million.
B&O Other
Industry (NAICS Code) Gross Taxable Tax Excise Total
Petroleum Products Wholesaling (4247) 10,171.5 8,975.7 43.8 36.7 80.5
Gasoline Stations (4471) 12,340.7 10,086.8 48.8 100.9 149.7
Fuel Dealers (45431) 691.8 638.9 3.1 22.7 25.8
Pipeline Transportation (486) D D D D D
Figure 10.2: Taxable Income and Taxes Due by Industry, 2011 (millions of dollars)
Source: DOR D: Value not disclosed by DOR
WASHINGTON RESEARCH COUNCIL 16300 Christensen Road, Ste. 207
Tukwila, Washington 98188
206-467-7088
www.researchcouncil.org
Page 16 August 2012
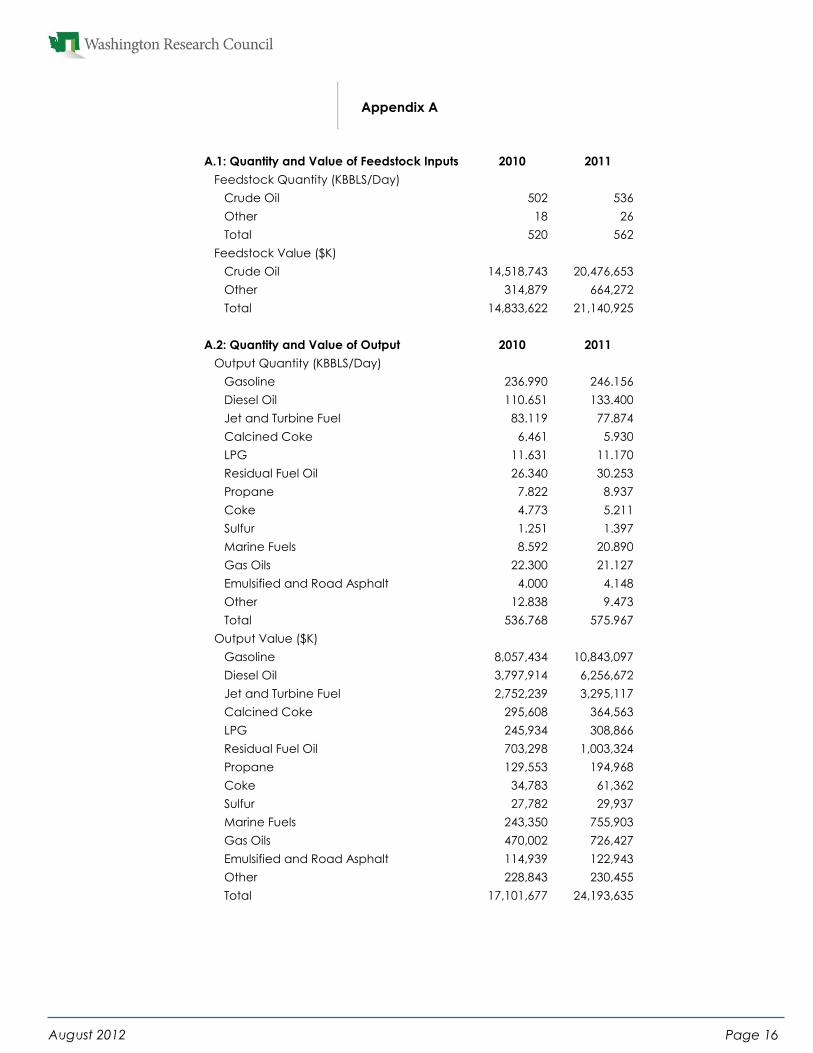
Appendix A
A.1: Quantity and Value of Feedstock Inputs 2010 2011
Feedstock Quantity (KBBLS/Day)
Crude Oil 502 536
Other 18 26
Total 520 562
Feedstock Value ($K)
Crude Oil 14,518,743 20,476,653
Other 314,879 664,272
Total 14,833,622 21,140,925
A.2: Quantity and Value of Output 2010 2011
Output Quantity (KBBLS/Day)
Gasoline 236.990 246.156
Diesel Oil 110.651 133.400
Jet and Turbine Fuel 83.119 77.874
Calcined Coke 6.461 5.930
LPG 11.631 11.170
Residual Fuel Oil 26.340 30.253
Propane 7.822 8.937
Coke 4.773 5.211
Sulfur 1.251 1.397
Marine Fuels 8.592 20.890
Gas Oils 22.300 21.127
Emulsified and Road Asphalt 4.000 4.148
Other 12.838 9.473
Total 536.768 575.967
Output Value ($K)
Gasoline 8,057,434 10,843,097
Diesel Oil 3,797,914 6,256,672
Jet and Turbine Fuel 2,752,239 3,295,117
Calcined Coke 295,608 364,563
LPG 245,934 308,866
Residual Fuel Oil 703,298 1,003,324
Propane 129,553 194,968
Coke 34,783 61,362
Sulfur 27,782 29,937
Marine Fuels 243,350 755,903
Gas Oils 470,002 726,427
Emulsified and Road Asphalt 114,939 122,943
Other 228,843 230,455
Total 17,101,677 24,193,635
Page 17 August 2012
A.3: Origin of Inputs 2011 Crude Oil Other
(KBBLS/Day)
Alaska 295 -
Canada (Conventional) 107 -
Canada (Oil Sands) 39 -
All Other Origins 94 26
A.4: Destination of Output 2011 Washington Other U.S. Foreign Total
(KBBLS/Day)
Gasoline 132 93 20 246
Diesel Oil 66 49 19 133
Jet and Turbine Fuel 33 25 19 77
Calcined Coke 0 - 6 6
LPG 8 3 - 11
Residual Fuel Oil 13 4 12 30
Propane 6 2 1 9
Coke 3 2 0 5
Sulfur 1 1 - 1
Marine Fuels 19 2 - 21
Gas Oils 8 14 - 22
Emulsified and Road Asphalt 2 2 - 4
Other 3 6 1 9
A.5: Mode of Transport 2011 Pipeline Water Truck Rail Other
Feedstocks (KBBLS/Day)
Crude Oil 142 390 - 0 2
Other 8 15 0 10 -
Outputs (KBBLS/Day)
Gasoline 153 72 22 - -
Diesel Oil 82 38 12 0 -
Jet and Turbine Fuel 38 34 5 - -
Calcined Coke - - - 6 -
LPG 7 - - 4 -
Residual Fuel Oil - 30 - - -
Propane - - 5 4 -
Coke - 3 1 1 -
Sulfur - - 1 0 -
Marine Fuels - 21 - - -
Gas Oils - 21 - - -
Emulsified and Road Asphalt - - 2 2 -
Other 2 6 - 2 -
Page 18 August 2012
A.6: Employment and Contract Labor 2010 2011
On-Site Employment
Number of FTE Employees 2,006 1,986
Total Payroll ($K) 212,739 238,869
Total Employee Benefits ($K) 84,407 85,072
Contract Labor 323,941
Expenditure ($K)
Service and Maintenance 170,635 185,021
Capital Repair and Replacement 156,372 181,309
Total 327,007 366,330
Number of Contract Workers (FTE)
Service and Maintenance 1,183 1,019
Capital Repair and Replacement 1,677 1,900
Total 2,861 2,919
% of Contract Labor from Outside WA State
Service and Maintenance 45% 45%
Capital Repair and Replacement 65% 65%
A.7: Operating Expenditures Other than Labor or Feedstock ($K) 2010 2011
Non-Durable Manufactured Goods
Petroleum Products 189,461 228,943
Other Non-Durable Goods 47,247 53,041
Total 236,708 281,984
Durable Manufacturing - -
Construction 31,950 37,532
Transportation
Rail 23,622 28,942
Trucking 7,232 7,531
Automobiles 3,262 13,047
Waterborne 200,189 245,326
Air - -
Other 18,003 18,778
Total Transportation 252,309 313,624
Utilities and Communications
Electricity 63,042 56,398
Gas 151,024 158,534
Other 9,127 10,385
Total U&C 223,193 225,318
Finance, Insurance and Real Estate 8,458 8,906
Business Services 5,242 5,204
Other Services 2,714 2,621
Page 19 August 2012
A.8:. Non-Labor Capital Expenditures
Equipment ($K) 139,667 84,088
Materials and Supplies ($K) 138,237 162,952
Total 277,904 247,040
A.9: Taxes and Fees
Taxes ($K)
Retail Sales and Use tax 4,697 5,298
Business and Occupancy Tax 65,885 105,113
Property Tax 22,886 19,649
Unemployment Compensation Tax 1,253 1,199
Hazardous Substance Tax 75,156 106,914
Oil Spill Tax 13,323 15,776
Petroleum Products Tax 8,720 6,980
Motor Vehicle Fuel Tax 583 578
Special Fuel Tax 26 15
Other 1,348 1,754
Regulatory Fees ($K)
Air Operating Registration and Permit Fees 1,671 1,765
Waste Disposal Fees 1,578 1,550
Wastewater Discharge Fees 710 729
Building Inspection Fees 5 4
Building Permit Fees 296 307
Other 71 73
Industrial Insurance Premium ($K) 3,137 10,117
A.10: Estimated Services and Retail Trade
Food Services ($K)
Associated with Contract Labor 325 313
Associated with Business Visitors 556 540
Total 881 853
Hotel and Motels ($K)
Associated with Contract Labor 540 528
Associated with Business Visitors 647 646
Total 1,187 1,174
Other Trade and Services ($K)
Associated with Contract Labor 25 25
Associated with Business Visitors 51 58
Total 76 83
A.11: Contributions ($K)
Corporate 750 787
Firm-Sponsored Employee Giving 823 853
A.12:. Other ($K)
Estimated Business visitors from outside Washington 2,700 2,000
Page 20 August 2012
Canada $1,882,435,007
Mexico $443,120,733
Chile $426,556,294
Singapore $228,075,319
Australia $158,083,410
Guatemala $86,002,183
Republic of Korea $85,287,508
New Zealand $61,435,595
Brazil $49,508,380
Republic of South Africa $38,025,000
Netherlands $37,414,294
Ecuador $33,475,403
China $26,044,412
Peru $25,893,750
Mozambique $15,830,000
Bahamas $14,841,104
Taiwan $6,110,985
Japan $5,987,351
Russia $785,803
Malaysia $673,693
Philippines $533,044
Panama $323,178
Indonesia $307,324
Thailand $220,183
Dominican Republic $181,712
Colombia $136,860
Vietnam $128,152
Costa Rica $119,497
India $49,862
France $46,700
Kazakhstan $45,086
Serbia $15,000
Italy $12,922
Uruguay $8,455
French Polynesia $7,766
Belgium $6,960
United Kingdom $6,693
Hong Kong $4,092
Germany $4,062
Aruba $3,118
United Arab Emirates $2,700
Total all Countries $3,627,749,590
Source: WISERTrade
Petroleum Product Exports from Washington State
2011
Appendix B
Page 21 August 2012
Appendix C
The Washington Research Council uses a model of the Washington State
economy constructed especially for WRC by Regional Economic Models,
Inc. Because it allows supply and demand to respond to changes in prices
and wages, and permits substitution among factors of production, the WRC-
REMI model is more elaborate than the standard input-output models com-
monly employed to estimate regional economic impacts (Treyz 1993).
The standard input-output model fails to model the numerous capacity
constraints within the economy, the processes that set prices for goods and
services and the responses of consumers and producers to changes in these
prices. In the input-output model, industry and labor supply are perfectly
elastic—so prices and wage rates do not matter.
Prices and wages do matter in the WRC-REMI model. The model divides
the state into two subregions: The Seattle Metropolitan District (King, and
Snohomish Counties) and the balance of the state. There are 66 private in-
dustrial sectors within each subregion, as well as four governmental sectors.
Within each subregion the model tracks inter-industry transactions, much as
an input output model would.
Unlike an input-output model, however, the WRC-REMI model incorpo-
rates a number of significant behavioral responses to changes in prices and
costs: The wage rate depends on the supply and demand for labor, migration
and labor force participation rates respond to changes in wage rates, and con-
sumer purchases of specific goods and services respond to changes in rela-
tive prices and personal income. In addition, producers substitute among pro-
duction factors in response to changes in relative factor costs, market shares
respond to changes in regional production costs, and investment rises in re-
sponse to increases in output.
This report uses version PI+ 1.3.56 of the WRC-REMI model.
Page 22 August 2012
References
Chase, Robert A., Philip J. Bork, and Rich-
ard S. Conway Jr. 1993.Washington
State Input-Output 1987 Study. Olym-
pia, Wash.: Office of Financial Manage-
ment Forecasting Division.
Minnesota Taxpayers Association (MTA).
2009. 50-State Property Tax Comparison
Study: Payable Year 2008.
State of Washington Office of Financial
Management. 2008. 2002 Washington
Input-Output Model. Olympia, Wash.:
Office of Financial Management. http://
www.ofm.wa.gov/economy/io/
default.asp
Treyz, George. 1993. Regional Economic
Modeling: A Systematic Approach to
Economic Forecasting and Policy Analy-
sis. Norwell, Mass.: Kluwer Academic
Publishers.
U.S. Department of Energy. Energy Infor-
mation Administration (EIA). 2003.
2003 California Gasoline Price Study:
Final Report. http://www.eia.doe.gov/
pub/oil_gas/petroleum/
analysis_publications/caprice/
caprice.pdf
———. 2004. Challenging Times for Mak-
ing Refinery Capacity Decisions. Power-
Point presentation. http://
www.eia.doe.gov/pub/oil_gas/
petroleum/presentations/2004/npra2004/
npra2004_files/frame.htm
———. 2011. Performance Profiles of Ma-
jor Energy Producers 2009. February 25.
http://205.254.135.7/finance/
performanceprofiles/
———. 2012a. Potential Impacts of Reduc-
tions in Refinery Activity on Northeast
Petroleum Product Markets. February
http://205.254.135.7/petroleum/
refinerycapacityhttp://www.eia.gov/
analysis/petroleum/nerefining/update/
———. 2012b. Refinery Capacity Report
2012. June 22. http://205.254.135.7/
petroleum/refinerycapacity/
———. 2012c. State Energy Data System
1960–2010 Estimates. June 29. http://
www.eia.gov/state/seds/
———. Energy Information Administra-
tion, Office of Oil and Gas. N.d. Oil
Market Basics. http://www.eia.doe.gov/
pub/oil_gas/petroleum/
analysis_publications/
oil_market_basics/default.htm
Washington Research Council (WRC).
2004. Washington State’s Petroleum
Refining Industry Economic Contribu-
tion.
———. 2006. The Economic Contribution
of Washington State’s Petroleum Refin-
ing Industry in 2005.
———. 2009. The Economic Contribution
of Washington State’s Petroleum Refin-
ing Industry in 2007.
———. 2010. The Economic Contribution
of Washington State’s Petroleum Refin-
ing Industry in 2009.
Washington State Department of Revenue
(DOR). 2012a. Quarterly Business Re-
view: Calendar Year, 2010.
———. 2012b. Detailed Tax Data by In-
dustry and Tax Classification. http://
dor.wa.gov/content/AboutUs/
StatisticsAndReports/line_code_detail/
default.aspx
Washington State Employment Security
Department. 2011. Quarterly Census of
Employment and Wages, 2010 Annual
Averages. https://fortress.wa.gov/esd/
employmentdata/reports-publications/
industry-reports/quarterly-census-of-
employment-and-wages
Washington State Tax Structure Study
Committee. 2002. Tax Alternatives for
Washington State: A Report to the Leg-
islature. Olympia: Washington State
Department of Revenue.