economic policy uncertainty and stock market participation · the news-based index of economic...
TRANSCRIPT
Economic Policy Uncertainty and Stock Market Participation#
Enikő Gábor-Tóth Dimitris Georgarakos
Deutsche Bundesbank and CEU European Central Bank and University of Leicester
First version: 26 July 2017
This version: 21 February 2018
Abstract
Does economic policy uncertainty affect household stockholding? To answer this question we create a novel measure of household exposure to economic policy uncertainty news by combining survey information on the hours a household spends in reading newspapers and the frequency of such news in the popular press during a household’s pre-interview period. After controlling for household fixed effects, month-year fixed effects and time-varying cognitive skills, we find that households with a higher exposure to economic policy uncertainty news are less likely to invest in stocks held directly or through mutual funds. This effect is independent from the market volatility index and household (first-moment) expectations about the stock market index.
JEL Classifications: D14, D81, G11
Keywords: Economic policy uncertainty; household finance; stockholding; text analysis
# We would like to thank Thorsten Beck, Nick Bloom, Michael Ehrmann, Tullio Jappelli, Spyros Paliginis, Ploutarchos Sakellaris, Martin Schneider and seminar participants in the University of Tilburg, the European Central Bank, the Household Finance and Consumption Network meeting in the Central Bank of Cyprus, the ECB-Banque de France conference on Household Finance and the CRETE conference for helpful suggestions and comments. The opinions expressed in the paper are those of the authors and do not necessarily reflect the views of the European Central Bank, the Deutsche Bundesbank or of the eurosystem.
Georgarakos (corresponding author): dimitris.georgarakos [at] ecb.int ; European Central Bank, Sonnemannstrasse 20, 60314 Frankfurt am Main, Germany.
1
1. Introduction
The uncertainty induced by fiscal, monetary and regulatory policies has important
repercussions for economic activity and is considered a leading factor behind the post-crisis
sluggish recovery. Existing studies have mainly examined the effects of policy-related
uncertainty on the investment decisions of institutional investors and firms (e.g. Bloom et al.
2016). On the other hand, far less is known about the impact of policy uncertainty on
households, how this uncertainty is actually reaching them and what types of uncertainty might
be most relevant for household investment. For example, while the VIX index has been
extensively used as a measure of uncertainty for financial markets, households might be more
reactive to types of uncertainty that are immediately exposed to, such as uncertainty about
economic policy.
This paper examines whether and how economic policy uncertainty influences households
in the United States and quantifies its impact on their investment choices. To that effect, we
propose a novel measure of direct exposure to economic policy uncertainty that is household-
specific. In particular, we combine information on the hours households spend in reading
newspapers and the frequency of articles denoting policy-related uncertainty in the popular press,
measured according to a widely used news-based index. Next, we use our measure to investigate
whether economic policy uncertainty affects household stock market participation as well as
ownership of other assets such as government and corporate bonds. Thus, we shed light on the
link between risk and uncertainty that households consider when making investment decisions.
The news-based index of economic policy uncertainty (EPU) that we utilize draws from
the seminal work of Baker et al. (2016, BBD henceforth).1 The index is constructed based on the
1 We use the terms ‘economic policy uncertainty’, ‘policy uncertainty’ and ‘policy-related uncertainty’ interchangeably throughout the paper. We refer to EPU to denote the news-based index introduced by BBD.

2
word count of articles denoting uncertainty about fiscal, monetary and regulatory policies in the
popular press and it is calculated over the period prior to every household interview. BBD use
information on firms’ revenues dependence on government spending to measure firm exposure
to EPU and examine its consequences for firms’ investment, hiring and stock market volatility.2
In addition, Gulen and Ion (2016) consider firms which face higher irreversible investment costs
to be more affected by EPU, as they have a stronger incentive to wait until background
uncertainty diminishes. Instead, we examine the extent to which policy-related uncertainty
influences household financial decisions. To this end, we consider the time households spend in
reading news as a direct channel through which households are likely to get exposed to policy
uncertainty.
We use longitudinal data from the US Health and Retirement Study and its supplement, the
Consumption and Activities Mail Survey that interview a nationally representative sample of
households fifty years and older. These households possess the largest share of assets in the
United States and their investment decisions are likely to have broader aggregate implications.3
As we discuss in detail in the data section, the surveys we use provide an ideal set-up for
addressing the research question at hand. Importantly, they offer all necessary information on
household financial assets and various demographic and behavioral indicators that earlier studies
have shown to affect stockholding.4 A distinctive feature of the data is that information is
collected on respondents’ time use, and in particular, on time spend in reading the news (from
2 In an early contribution, Guiso and Parigi (1999) use as a proxy for uncertainty subjective information from a survey of firm owners and CEO’s regarding the future demand of their own firm’s product. Instead, Bloom et al. (2007) proxy for firm uncertainty by share price volatility. 3 According to the 2007-2010 US Surveys of Consumer Finances, this age group of households owns 78% of gross equities and 75% of net wealth held by the total population. 4 Data from the Health and Retirement Study have been extensively used in empirical household finance literature. For example, Hong et al. (2004), Rosen and Wu (2004), and Bogan (2008) examine, respectively, the effects of sociability, reported health, and Internet use on stockholding decisions. Christelis et al. (2013) use data from the same survey combined with comparable data from Europe to examine differences in household portfolios across the Atlantic.
3
paper and online). We match the survey data with the EPU index calculated over the months
preceding each household interview and exploit the fact that the underlying policy uncertainty
varies randomly across households assigned in different interview months.
Our paper makes a number of empirical contributions. First, we propose a household-
specific measure of direct exposure to the news-based policy uncertainty that can be used to
examine the role of economic policy uncertainty for various household decisions. Second, we
investigate the effects of news-based policy uncertainty on household stockholding. We estimate
that a one standard deviation increase in the EPU index implies a 6% net decrease on the
unconditional probability of owning stocks held directly or through mutual funds. As theory
draws a distinction between choices regarding future outcomes with a known probability
distribution (risk) and future outcomes linked to unknown probabilities (uncertainty), this finding
provides empirical support for ambiguity aversion. That is, agents demand an ambiguity
premium (over and above the classic risk premium) to hold assets with uncertain returns (see
Epstein and Schneider 2010; Gollier 2011; and the empirical findings in Dimmock et al. 2016).
In addition, we examine participation in other financial asset categories. We find that
fluctuations in EPU do not have an impact on ownership of stocks held through individual
retirement accounts (IRAs), consistent with existing evidence on considerable household inertia
in reshuffling retirement portfolios. As regards bonds, we estimate a strong negative impact of
EPU on ownership of corporate bonds, while we find no effect on government bonds.
Third, our data record household stock market expectations, thus allowing us to estimate
the effect of policy-related uncertainty net of the effect of expectations about the level of the

4
stock market index (first-moment effect). Disentangling the two in a direct way has not been
possible in earlier applications using micro data on firms.5
Finally, we exploit our micro-level data to address whether certain population subgroups
respond differently to policy-related uncertainty. In particular, when we consider groups with
different education we find that the negative effect of exposure to EPU on stock market
participation mainly comes from the less educated households. This provides suggestive
evidence for the so-called ‘competence hypothesis’, according to which agents tend to be more
ambiguity averse towards tasks for which they feel less competent.
We take a number of steps in order to ensure that our estimation strategy uncovers genuine
effects. These steps are discussed in detail in the relevant section, yet one can summarize them
briefly as follows. First, we identify the effect of interest through the interaction term of time
every household spends in reading the news and the EPU news-based index during that
household’s pre-interview period. The index varies randomly across households surveyed in a
baseline interview year, depending on the month in which they are interviewed. Information on
time reading newspapers is collected in every wave shortly prior to the period over which the
EPU index is calculated (i.e. it is pre-determined relative to follow-up fluctuations in EPU).
Thus, both components of the interaction term exhibit cross-sectional and temporal variation.
This allows us to estimate a double fixed effects model that takes into account both household
fixed effects (accounting for any household-specific, time invariant household unobserved
attributes) and month of interview-year fixed effects (accounting for any aggregate factors that
vary by month, including the EPU index in levels). Further to this, we take into account a
5 For example, BBD control for expectations by using a measure of forecasted federal purchases.

5
number of household-specific time-varying characteristics, such as cognitive skills measured in
every wave.
Second, we take into account interaction terms of hours reading news with various time-
varying aggregate indicators (S&P 500, VIX, CPI, GDP growth, Oil prices, etc.) and show that
the estimate of interest remains unaffected. In addition, we estimate placebo regressions in which
we use the EPU index computed over news published in Swedish, instead of US major
newspapers.
Third, we examine whether hours reading news correlate with unobserved time-varying
household characteristics. We find that our baseline estimate is robust in a very rich specification
that takes into account all time-varying controls that existing household finance literature has
shown to be relevant for stock investing (e.g. cognition, health, risk aversion, optimism,
sociability, engagement in voluntary activities, Internet use, etc.). Furthermore, we interact the
EPU index with hours spent in reading books, which represents a similar activity to newspaper
reading and the two should be equally affected by household (time-varying) unobservables.
Reassuringly, we estimate an insignificant effect of the interaction of hours reading books with
the EPU index, which reflects the limited – through book reading – exposure to news-based
uncertainty. Moreover, we use an IV estimation in which we instrument the news uncertainty
index in the popular press with a measure of uncertainty deduced from the Federal Reserve’s
Beige Book (i.e. a source of information that households are assumed not having direct exposure
to). While the two measures are correlated, it is unlikely that uncertainty recorded in the Beige
Book impacts stockholding through household unobservables.
Fourth, we use information on how closely respondents report to follow stock market
developments in every wave to account for those who spend more hours in reading the news

6
because they consider investing in stocks. Moreover, we re-estimate our baseline specification by
taking the lagged value of hours reading newspapers from the previous wave and interact this
with contemporaneous values of the EPU index and our findings are not affected. Instead, when
we interact hours reading newspapers with lagged values of the EPU index taken from the pre-
interview period of the previous wave (i.e. a period that should not be relevant for current asset
choices), our main estimate turns, as one would expect, insignificant.
The remainder of the paper is organized as follows. Section 2 reviews the related literature.
Section 3 describes the data used. Section 4 provides details on the empirical strategy, while
Section 5 discusses the baseline results. Section 6 shows results from a number of robustness
checks and Section 7 provides additional findings on the relationship between EPU and
ownership of stock IRAs and corporate and government bonds. Finally, Section 8 concludes.
2. Related literature
The concept of uncertainty can be traced back to the insights of Knight (1921), who draws
a theoretical distinction between future events with a known probability distribution (‘risk’) over
a set of events for which these probabilities are unknown (‘uncertainty’). Recent studies
document that uncertainty varies over time and postulate that this variation can be viewed either
as exogenous or as a response to business cycle fluctuations (Bloom 2009; Bloom 2014; Jurado
et al. 2015; Ludvigson et al. 2015). These studies provide evidence on the depressing short-run
aggregate economic consequences of an increase in uncertainty and suggest various possible
mechanisms at work. In some of these models, uncertainty depresses real activity through the
real options effect. By raising the option value of waiting, it affects either firms’ incentives
leading them to delay their investment and hiring (Bloom 2009; Bernanke 1983) or triggers a

7
cautious response from households who raise their precautionary saving that ultimately dampens
household consumption (Romer 1990; Fernández-Villaverde et al. 2011; Bloom 2014).6
Despite the extensive literature exploring linkages between uncertainty and aggregate
economic outcomes and the theoretical models providing relevant micro-foundations, there is
limited empirical micro evidence on the effects of fluctuations in uncertainty on firms and
households. Using the run-up to the 1998 German general elections, Giavazzi and McMahon
(2012) find that increased political uncertainty contributed to higher household saving. Julio and
Yook (2012) use data on firms and find that political uncertainty reduces firm investment. Di
Maggio et al. (2016) develop a county-level uncertainty index based on excess returns of
publicly listed firms and show that it has an impact on household borrowing. Leahy and Whited
(1996), Guiso and Parigi (1999) and Bloom et al. (2007) examine firm level data and document a
strong negative relationship between uncertainty and investment. In these papers uncertainty is
either proxied with firm level stock-price volatility or measured based on a self-reported
distribution of expectations about future demand.
Our paper uses a household-specific measure of economic policy uncertainty that draws on
the frequency counts of news in the popular press. The measure has been recently utilized to
explore the relationship between firm-level investment and uncertainty related to policy and
regulatory conditions (see BBD and Gulen and Ion 2016). Firms that are more dependent on
government spending or that face some irreversible investment costs are assumed to be exposed
6 Gilchrist et al. (2014) point to financial frictions as the main mechanism through which uncertainty can lead to lower investment. Pastor and Veronesi (2012) measure movements in stock prices after a policy change announcement, while BBD suggest that the slow recovery from the Great Recession is associated with higher policy uncertainty during the period 2007 to 2009. Although a large body of literature examines the negative repercussions of uncertainty, there are also studies pointing into the fact that uncertainty may have a positive effect on long-run growth. In these models, uncertainty stimulates research and development when firms faced with heightened uncertainty are more eager to innovate (Bar-Ilan and Strange 1996; Kraft et al. 2013).

8
more to policy-related uncertainty. Both papers document a negative relationship between
aggregate policy uncertainty and average firm investment. Instead, we consider a channel (i.e.
time reading newspapers) of direct household exposure to news in the press.7
Our study also contributes to the growing household finance literature that has examined
how various socio-economic factors influence stock market participation, but has not assessed
the role of economic policy uncertainty (Guiso and Sodini 2013 provide a recent thorough
review). When faced with decisions that involve risk and uncertainty agents tend to be ambiguity
averse (i.e. they prefer choices with known over unknown probabilities of future outcomes; see
Ellsberg 1961). As a result, agents require an ambiguity premium to hold assets with uncertain
returns (over and above the classic risk premium), which increases with aversion toward
uncertainty (see Maccheroni et al. 2013; Gollier 2011, and Izhakian and Benninga 2011). In the
presence of uncertainty, stock market participation should be lower than predicted by standard
portfolio models, and there should be a negative relationship between uncertainty and
participation in the stock market (Epstein and Schneider 2010; Easley and O’Hara 2009).
Dimmock et al. (2016) introduce in a US household survey questions based on Ellsberg urns to
measure individuals’ ambiguity aversion. They find that more ambiguity averse individuals are
less likely to invest in stocks and that they hold under-diversified portfolios.
3. Data
We use data from the Health and Retirement Study (HRS), a nationally representative,
longitudinal survey offering detailed information on various household demographic
7 Aguiar et al. (2016) is one of the few studies that exploits household data on time use to examine the time allocation into various activities. They find that leisure and home-production absorbs most of the foregone market work hours during the Great Recession.

9
characteristics as well as on their incomes and wealth.8 The HRS was launched in 1992 and
interviews every other year about 20,000 Americans aged 50 and over. The survey interviews are
conducted over several months in the course of a year and, importantly, households are assigned
to interview months independently from the prevailing policy uncertainty. As we explain below,
this random allocation of households across interview months helps to identify the effect of
interest. We augment the information from the HRS with data from the Consumption and
Activities Mail Survey (CAMS), a supplemental survey sent by mail to a random sub-sample of
HRS respondents in the fall of the year following the main interview. Since 2001, CAMS
collects information on individual time use with reference to various activities and on household
consumption patterns.
Respondents participating in CAMS are explicitly asked to report the “hours spent last
week in reading newspapers or magazines” (i.e. including reading from papers and online),
which represents a direct channel of ‘exposure’ to the EPU news-based index. They are also
requested to report separately the hours spent last week in: “reading books”; “watching programs
or movies/ videos on TV”; “using the computer”; as well as the hours devoted in other activities
such as working, socializing with friends, engaging in voluntary activities, entertaining and
sleeping.9
The HRS (supplemented with CAMS) is the dataset that best serves our purposes because
it collects high quality data on asset investment, time spent in reading newspapers and, the
design of the survey allows us to credibly identify the effect of interest. Moreover, one should
note that households aged more than fifty years old in the US hold a significant fraction of total
population resources. Therefore, it is instructive to investigate the extent to which policy
8 Hauser and Willis (2004) provide a detailed overview of the survey. 9 In the robustness section, we check whether EPU influences stockholding through hours spent in various activities.

10
uncertainty influences their investment choices. We make use of all available waves of the HRS
matched with CAMS, that is all seven waves from 2002 (matched with 2001 CAMS) to 2014
(matched with 2013 CAMS). 10 Table 1 shows summary statistics of the various household socio-
economic characteristics used in the regression analysis as well as of the hours spent per month
in various activities.
We supplement the HRS data with information on the economic policy uncertainty that
every household is exposed to in the period preceding the main interview. We employ the EPU
index developed by BBD.11 The index is calculated on a monthly basis utilizing information only
from news publications. Thus, it conforms naturally to the hours spent in reading newspapers,
which represent a direct channel through which households are exposed to news-based economic
policy uncertainty.
Based on computer automated search algorithms, the index quantifies references to
uncertainty as found in news articles from ten major newspapers: USA Today, the Miami Herald,
the Chicago Tribune, the Washington Post, the Los Angeles Times, the Boston Globe, the San
Francisco Chronicle, the Dallas Morning News, The New York Times, and the Wall Street
Journal. An article is considered relevant for the construction of this measure if it contains
keywords related to all three categories: economy, uncertainty and policy. Specifically, for an
article to be included in the sample, it has to contain at least one word from “economy,
economic”; one word denoting uncertainty “uncertain, uncertainty”; and at least one policy term
10 For our analysis, we mostly rely on the HRS files created by the RAND Center for the Study of Aging. 11 We use the monthly EPU downloaded from http://www.policyuncertainty.com/ (version February 28, 2017). This index is also used in the baseline analysis of BBD (2016) combined with two other indicators to construct a broader, overall policy-related economic uncertainty measure. The latter is calculated as a weighted average of the news-based index, tax code expiration data, and economic forecasters’ disagreement about policy relevant variables: the CPI and future government spending. For our analysis, the index of main interest is the first component since it focuses on the written news media as a messenger (see Alexopoulos and Cohen 2009), to convey information on underlying economic policy uncertainty.

11
from the list “regulation, deficit, legislation, congress, white house, Federal Reserve, the Fed,
regulations, regulatory, deficits, congressional, legislative, and legislature”. The index has been
adjusted for the changing volume of news over time.12
The EPU index aims to measure the portion of the overall economic uncertainty attributed
to the political and regulatory system. The index has been found to spike near tight presidential
elections, wars and terrorist attacks, the failure of Lehman Brothers, the 2011 debt-ceiling
dispute and other major disputes over fiscal policy (for details see BBD).13
4. Empirical strategy
The design of the survey offers an almost ideal setup to construct a measure of exposure
to economic policy uncertainty news that is household-specific. For better exposition of the
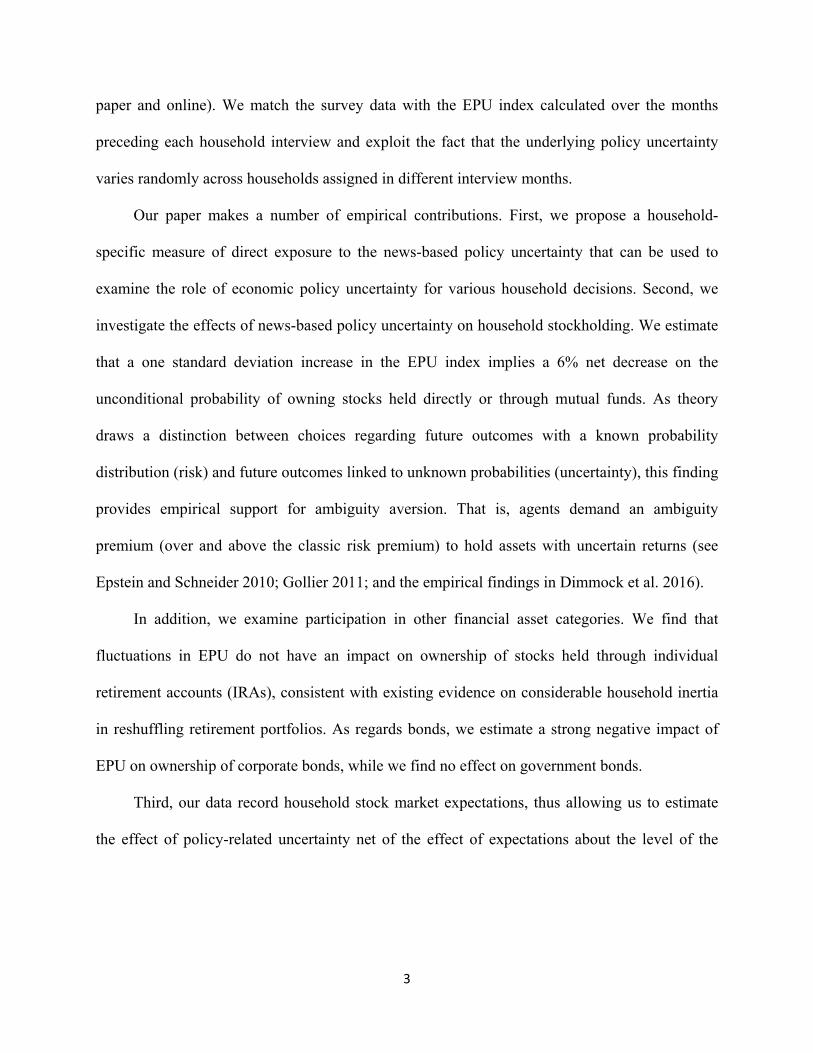
survey design, Figure 1 shows a timeline of the interview phases. First, the survey records, in the
fall of a given year (e.g. in 2001), the hours (per week) that households spend in reading
newspapers. Second, starting in the first months of the follow-up year (2002), the survey contacts
again households for the baseline interview. The baseline interviews, in which households
indicate stock ownership and other asset investment, take place in different months in the course
of the year. One should note that the month of the interview is exogenous to prevailing EPU. We
exploit this random allocation of households in different interview months and calculate for each
household the EPU index denoting the frequency counts of economic policy uncertainty news in
the popular press over the months preceding the interview.
12 For each of the ten newspapers, the number of selected articles each month is scaled by the total number of articles in the respective newspaper and month. These individual series are subsequently normalized to unit standard deviation over the period January 1985 to December 2009 and summed within each month. The resulting multi-paper index is then normalized to have an average value of 100 over the period January 1985 to December 2009. 13 BBD perform numerous robustness checks to validate the index. They show that the index conveys independent information on uncertainty, over and above the VIX index (a frequently used indicator of uncertainty computed from financial market data) and forecasts from the Survey of Professional Forecasters of government purchases.

12
We measure every household’s exposure to economic policy uncertainty news by
defining the product of the hours (per month) spent in reading the news times the (monthly) EPU
index measured over the period prior to the month of the interview. The hours spent in reading
newspapers are recorded shortly prior to the months over which EPU is computed, thus they
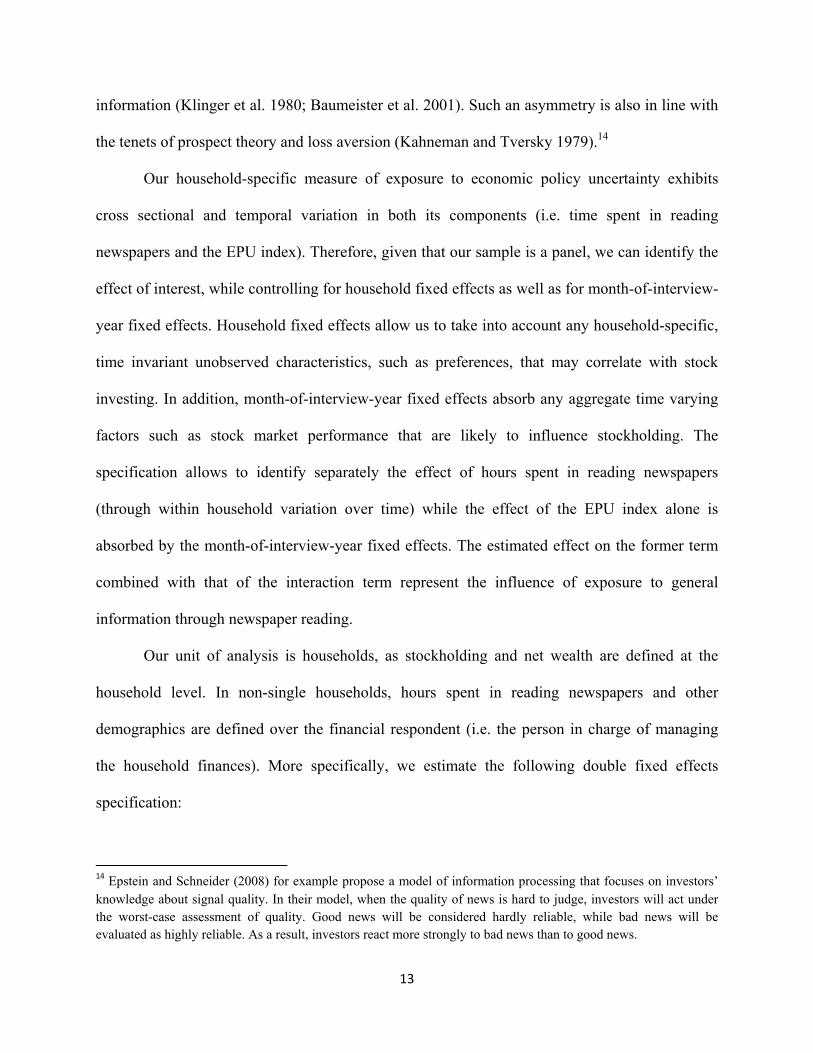
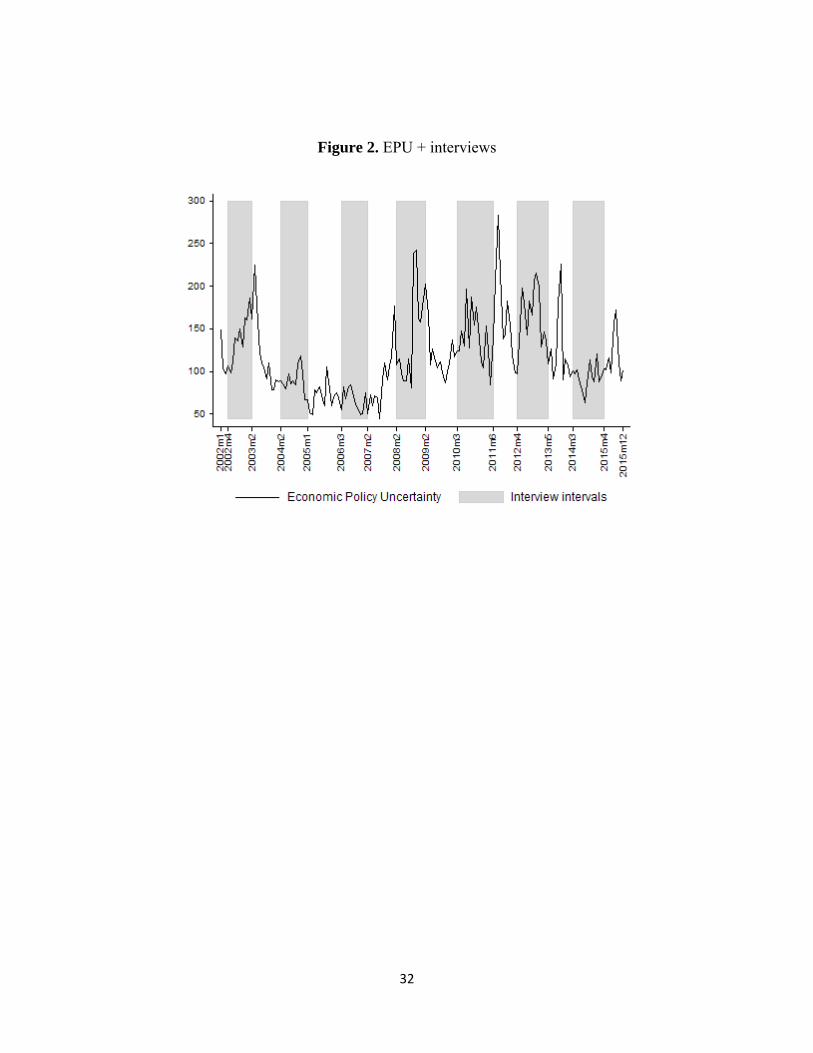
should not be determined by follow-up variation in the EPU. In Figure 2 we depict the EPU since
2001 and the interview months over which our sample spans. We also show summary statistics
of the EPU over this period between interview and non-interview months (see Appendix Table
A.1).
Our measure implies that between two households that spend the same amount of time in
reading newspapers, the one that is matched with a higher EPU over the months prior to the
(randomly assigned) interview month is exposed more to economic policy uncertainty news.
Likewise, between two households that are interviewed in the same month (and thus are matched
with the same EPU prior to their interviews), the one that spends more time in reading the news
is assumed to be exposed more to economic policy uncertainty news. This notion follows the fact
that two agents who are exposed to the same amount of information respond asymmetrically to
negative and positive news.
Individuals’ propensity to weight more the negative than the positive news has been
widely documented in political science and psychology research. For example, Soroka (2006)
shows that public concern tends to respond asymmetrically to positive and negative news and
negative news receive more weight when attitudes are formed. Experimental studies also find
evidence that the effect of a unit increase in negative news is larger than that of a unit decrease.
Information pertaining to bad events receives more thorough and elaborate processing than
information about good events, which in turn may lead to paying more attention to unfavorable
13
information (Klinger et al. 1980; Baumeister et al. 2001). Such an asymmetry is also in line with
the tenets of prospect theory and loss aversion (Kahneman and Tversky 1979).14
Our household-specific measure of exposure to economic policy uncertainty exhibits
cross sectional and temporal variation in both its components (i.e. time spent in reading
newspapers and the EPU index). Therefore, given that our sample is a panel, we can identify the
effect of interest, while controlling for household fixed effects as well as for month-of-interview-
year fixed effects. Household fixed effects allow us to take into account any household-specific,
time invariant unobserved characteristics, such as preferences, that may correlate with stock
investing. In addition, month-of-interview-year fixed effects absorb any aggregate time varying
factors such as stock market performance that are likely to influence stockholding. The
specification allows to identify separately the effect of hours spent in reading newspapers
(through within household variation over time) while the effect of the EPU index alone is
absorbed by the month-of-interview-year fixed effects. The estimated effect on the former term
combined with that of the interaction term represent the influence of exposure to general
information through newspaper reading.
Our unit of analysis is households, as stockholding and net wealth are defined at the
household level. In non-single households, hours spent in reading newspapers and other
demographics are defined over the financial respondent (i.e. the person in charge of managing
the household finances). More specifically, we estimate the following double fixed effects
specification:
14 Epstein and Schneider (2008) for example propose a model of information processing that focuses on investors’ knowledge about signal quality. In their model, when the quality of news is hard to judge, investors will act under the worst-case assessment of quality. Good news will be considered hardly reliable, while bad news will be evaluated as highly reliable. As a result, investors react more strongly to bad news than to good news.

14
, , , ∗ log ,
log , , , , , ,
where , , is a binary indicator denoting ownership of stocks held directly or through mutual
funds for household i that is interviewed in month m during the baseline interview year t.
, is the average EPU evaluated over the months between January and the month prior to
the interview month m for every household (i.e. ∑ ,, .15 The hours per month that
the financial respondent of household i spends in reading newspapers is recorded in the fall prior
to baseline interview year (during which EPU is calculated) and is denoted by
, .16 , , consists of an array of household-specific, time-
varying characteristics, recorded in the month of the interview. The specification also accounts
for individual fixed effects ( which take into consideration all household-specific, time
invariant unobserved factors. Moreover, it controls for month-year-of-interview fixed effects,
which absorb any time-varying by month-year-of-interview factors ( , , including , .
Standard errors are double clustered at the household and month-year-of-interview level to allow
for possible cross-sectional and serial correlation dependence in the error term , , .
5. Results
Baseline regression results from different specifications are shown in Table 2. We first
estimate a basic specification that includes the interaction term of interest, the hours reading
15 In the robustness section we show results from alternative specifications in which we define average EPU over three months and one month prior to every household interview. 16 Hours reading news and hours spent in other activities (later used in robustness specifications) have been censored at the top 1% of the respective distributions to eliminate the influence of outliers.

15
newspapers as well as a full set of household and time fixed effects.17 We find that higher
exposure to EPU makes stockholding less probable and the relevant effect is statistically
significant at 1%. In particular, we estimate that a one-standard deviation increase over the mean
EPU implies a 1.8 p.p. lower probability of owning stocks directly or through mutual funds for a
typical household with an average reading news time.18 Given that 29% of households in the
sample own such assets, the estimated effect implies a more than 6% net contribution to the
unconditional ownership probability.
While it is beyond the scope of our study, one could also calculate the net implied effect
of hours reading news by taking into account the estimates of both the interaction and the
respective level term. According to these, an assumed one-standard deviation increase in the
hours reading news, given a mean EPU, implies a 0.2 p.p. higher probability of owning stocks.
Next, we augment specification (1) by adding a set of household-specific, time-varying
cognitive indicators. There is cross-sectional evidence that cognitive abilities and financial
sophistication influence stockholding (see Christelis et al. 2010 and van Rooij et al. 2011,
respectively). Moreover, while it is reasonable to assume that a household that spends more time
in reading newspapers than another household should be exposed to more information contained
in newspaper articles, one may argue that the two households also differ in their ability to
process the same amount of information.
In view of the above, one should note that our fixed effects specification takes into account
fixed unobserved differences (e.g. in IQ) across respondents. In addition, we explicitly control
for time-varying cognitive indicators that are shown in the reading research and cognitive
17 Given that we estimate a model with household fixed effects, we implicitly take into account a standard set of determinants used in (cross sectional) household finance studies, such as age, gender, race, religious denomination and education. 18 The calculation is based on mean (standard deviation) EPU of 120 (45) and the mean (monthly) reading news time of 20 hours.

16
psychology literature to be strong predictors for cognitive performance and reading
comprehension.19
More specifically, we take into account as a measure of memory capacity, a word recall
score denoting the number of words correctly recalled by the respondent out of a list of ten that is
read by the interviewer. Furthermore, we control for respondents’ mathematical skills by means
of a numeracy score, denoting the number of correct answers to five successive subtractions of
the same number. Apart from these two measures we also take into account independent
information based on interviewers’ post-interview assessment as regards respondents’ general
understanding of questions and ability to recall information during the interview. We find that
(time-varying) word recall ability associates positively with stockholding, nevertheless the
inclusion of cognitive indicators does not alter the estimated relationship of interest.
In specification (3) we further add various time-varying demographic characteristics such
as household size and labor status. In addition, we account for self-reported health and
limitations in ADLs, as there is evidence to suggest that those in poor health are less likely to
invest in stocks (Rosen and Wu 2004). To control for psychological outlook, we also include a
dummy for feeling depressed most of the time over the week prior to the interview. We take into
consideration the sociability indicator of Hong et al. (2004), namely whether respondents know
their neighbors, as social interactions can induce stockholding by lowering information-related
costs. In a similar vein, we enrich our specification with a dummy denoting regular Internet
usage because there is evidence that it encourages stock ownership by facilitating access to
19 This literature provides evidence that reading comprehension associates with readers’ decoding skills (ability to read text accurately) and language comprehension (e.g. García and Cain 2014). In our estimation we take into account interviewer's assessment on every respondent’s overall understanding of questions during interview. There is also evidence for an association between performance on reading tasks and memory (Gersten et al. 2001), that we account for by the score in a memory test and the interviewer’s assessment on respondent’s memory performance.

17
financial information (Bogan 2008). In order to capture possible differences due to region-
specific factors we include dummies representing the nine US Census divisions. We also control
for whether respondents participate in voluntary organizations as a measure of social engagement
and whether they intend to leave any bequests.
In addition to the aforementioned demographic characteristics, specification (4) accounts
for household economic resources. In particular, we control for household net income and net
total wealth by means of dummies representing quartiles of the respective distributions. While
estimates on various socio-economic characteristics display the expected signs they are mostly
statistically insignificant as we control for household fixed effects and standard errors are
clustered at a higher than the household level.20 In any case, controlling for this very rich set of
characteristics leaves the estimated relationship of interest virtually unaffected.
In specification (5), we control in addition for household stock market expectations.21 It
is instructive to take into account expectations, as the effect we identify may reflect
heterogeneity in expectations about the stock market prospects and not in uncertainty about
economic policy per se.22 The expectations question is asked in every survey except from the
2002 and 2014 waves where it is asked only over a random sub-sample of surveyed households.
In addition, there are many missing values (in roughly one third of the responses) across all
survey years.23 As a result, specification (5) is estimated over a considerably smaller sample
20 In the robustness section, we also present results with additional controls for risk aversion, social capital and optimism. 21 Respondents are asked to report the percent chance in one year time the “mutual funds shares invested in blue chip stocks like those in the Dow Jones Industrial Average will be worth more than they are today” (i.e. at the time of the interview). 22 BBD use information on forecasted federal purchases to account for firm future expectations. Our data allows us instead to control directly for household-specific stock market expectations. 23 This follows the fact that a higher than usual number of respondents does not know to answer this question, while a significant fraction of those answering 50% indicate afterwards that they reported so because they were unsure about the chances (and thus are classified as missing).

18
compared to the baseline one, but our main results remain resilient to this drop in the sample
size. We also find that higher stock market expectations associate positively with stockholding.
Results from this specification point into the fact that household-specific uncertainty
(second-moment) about economic policy has an independent effect on stockholding from
household (first-moment) expectations regarding the stock market index level. Our finding
provides support to the notion that the measure of exposure to EPU represents the uncertainty
component and not a level effect of an (expected) negative macroeconomic shock. The
distinction is important because shocks that slow down economic activity typically entail a first-
moment (level) and a second-moment (uncertainty) component. While the former refers to
changes in the level of various economic indicators, the latter relates to un-forecastable changes
in the volatility of these indicators (see Bloom 2009, 2014).24
Last, as we use micro data and our measure of exposure to economic policy uncertainty is
household-specific, we can re-estimate the effect of interest for certain population subgroups. In
particular, we group households according to the education of their financial respondent into
college and less than college educated (27% and 73% of the sample, respectively). When we re-
estimate our baseline specification (4) for each of these two groups we find that the interaction
term of interest is significant only among the less than college educated.25 While this evidence is
based on two unbalanced samples, it seems to corroborate the so-called ‘competence hypothesis’
(Heath and Tversky 1991). According to this, agents tend to be more ambiguity averse towards
24 There is growing evidence that uncertainty rises during recessions, pointing to a feedback effect from recessions to uncertainty (see Bloom 2014 and Jurado et al. 2015). For example, at the start of the Great Recession, the series of negative events in financial markets represented bad news for the economy and also raised uncertainty. The ensued economic downturn and the policy responses to the worsening of economic conditions reinforced uncertainty, which in turn amplified the initial market shock (Bloom 2017). 25 The estimated coefficients (standard errors) we derive on the interaction and the hours reading news terms for the non-college educated are -.0202 (.0093) and .0983 (.0438), respectively. The corresponding estimates for the college educated are -.0148 (.0165) and .0808 (.0766). The entire set of results in the two groups are available from the authors upon request.

19
tasks for which they feel less competent (as the less educated are likely to view complex
investments such as stocks).
6. Robustness
In this section, we perform a number of robustness checks that provide additional support
to our baseline findings. The first set of robustness checks examines the possibility of omitted
aggregate factors (other than EPU), that, if they were interacted with hours spent in reading
newspapers, they would have rendered the interaction term of interest insignificant. As
discussed, any time-varying aggregate factors are absorbed by month-year-of-interview fixed
effects. Nevertheless, some factors may still play a role through their interaction with hours
households spend in reading the news.
To mitigate this concern we re-estimate our baseline specification with a full set of
household controls (specification (4), Table 2), while taking into account the interaction term of
interest and a number of time-varying aggregate factors interacted with hours reading
newspapers.26 Results are shown in Table 3, while Table A.2 in the Appendix provides details on
each of the indicators used. In the first specification, we add an interaction term of hours reading
news with the S&P 500 index, to check whether stock market performance has an incremental
effect on the likelihood of those who read news to invest in stocks. Adding this interaction term
leaves our estimate of interest virtually unaffected.
Next, we interact the number of hours reading newspapers with the VIX index (i.e. the
30-day implied volatility index on the S&P 500 index options), which represents a common
26 For symmetry, we assign each of these factors in an analogous way we assigned EPU to households. For example, real GDP growth is defined for every household as the average real GDP growth evaluated over the months running from January of the survey year to the month prior to the interview.

20
measure of uncertainty related to equity returns. The VIX correlates with EPU as both indices
capture a common uncertainty component, nevertheless, as BBD show, the latter index measures
additional uncertainty due to economic policy that is not captured by the former. When we
control for both interaction terms, we find that the interaction term of the hours reading news
with EPU is qualitatively unchanged and significant at 10%, while that with VIX is highly
insignificant. This result suggests that the estimated effect on stockholding channeled through
newspaper reading mainly regards the economic uncertainty due to government and regulatory
policies and not due to equity market volatility per se.
Furthermore, we consider interaction terms of hours reading news with various other
indicators such as professional forecaster disagreement about future CPI, oil prices, real GDP
growth, federal funds rates and CPI. In all these cases, the inclusion of additional interaction
terms leaves the baseline estimate of interest broadly unaffected.
In addition, we estimate a placebo regression in which we consider the EPU index
calculated for Swedish newspapers (see Armelius et al. 2017). While this index displays a
correlation of almost .5 with its counterpart one for the US, it does not have any independent
explanatory power when it is interacted with hours that US households spend in reading
(presumably domestic) newspapers.
The second set of robustness checks explores whether the interaction of the EPU index
with the hours allocated into a number of (other than reading newspapers) activities has an
independent effect on stockholding. As discussed, an advantage of our measure of household
exposure to economic policy uncertainty is that it is constructed by combining two indicators that
are conceptually well connected (i.e. the number counts of economic policy uncertainty news
that appear in the US popular press and the number of hours spent in reading newspapers).

21
Nevertheless, we wish to examine whether EPU could influence household stock investing
through the time spent in other activities.
To this end, we re-estimate our baseline specification (specification (4), Table 2) by
controlling for, one at a time, interaction terms of the hours spent in various activities with EPU.
Results are shown in Table 4. First, in specification (1), we interact the hours spent in reading
books with the EPU. Reading books represents an activity that is quite similar to newspaper
reading and they should both correlate with a comparable set of household unobservables (e.g.
time-varying intellectual curiosity). Nevertheless, the former activity should imply much less
exposure to economic policy uncertainty news than the latter. Indeed, the estimated coefficient of
the interaction term between time spent in reading books and the EPU is relatively small and
highly insignificant (p-value = .69). Moreover, one should note that the corresponding level term
is insignificant. These results lend further support to our baseline estimate capturing genuine
effects.
Next, we experiment with interaction terms between the EPU and hours spent in ‘using
the computer’ or ‘watching programs or movies/ videos on TV’ and neither of them is
significant. While one cannot assume out some exposure to economic policy uncertainty news
through these activities, it is quite unlikely to be as direct and strong as it is through newspaper
reading (which may well regard online articles). Likewise, we find no significant effects when
we interact EPU with hours working, hours socializing with friends, hours involved in voluntary
activities, hours entertaining and hours sleeping.27
27 Hours socializing with friends include hours spend in visiting friends, talking with friends over the phone, and helping friends, neighbors, or relatives who do not live with the respondent. Hours involved in voluntary work include hours doing voluntary work for charitable and other organizations, attending religious services, and attending meetings of clubs or religious groups. Hours entertaining include hours playing cards or games, attending concerts or movies, singing or playing a musical instrument, and doing art projects.

22
In the third set of robustness checks we add to our extended baseline specification (4) in
Table 2 some additional household-specific covariates that may influence our results through
their within-household variation over time. The first covariate regards an (inverse) risk aversion
indicator. We recover this from a series of questions involving income gambles with mean
preserving spreads which allow us to construct a four-scale indicator denoting willingness to
assume higher risks.28 HRS does not ask these questions since 2008 and onwards, while in the
pre-2008 waves the questions are not always asked to both members in couples. We facilitate a
sufficient number of observations on the risk aversion indicator by considering the value of the
partner when the indicator is missing for the financial respondent in couples and by taking the
minimum reported risk aversion over the years for which the relevant indicator is missing. In
Table 5, specification (1) we show results when we add the (inverse) risk aversion indicator. We
find that the estimate on the (time-varying) willingness to assume higher risks displays the
expected sign but it is statistically insignificant, while our baseline estimate remains unaffected.
The second covariate regards a social capital indicator. Trust and social capital in general
have been shown to influence stockholding as they reflect households’ perceived likelihood of
being cheated by financial intermediaries (see Guiso et al. 2008 and Georgarakos and Pasini
2011). Literature on social capital has established that trust in other people tends to change
slowly over time, given that social capital entails a large inherited component of social values
and norms (Tabellini 2010). Thus, household fixed effects in our specification should have
captured most of the heterogeneity in trust. As HRS does not ask how much respondents trust
other people in general, we control in our baseline specification for participation in voluntary
organizations as a measure of social engagement. For robustness, we add to the baseline
28 We use the variable on risk aversion that has been constructed in the RAND version of the HRS.

23
specification charity donations as an indirect measure of social capital.29 Controlling for (time-
varying) charitable contributions leaves our main results unaffected (Table 5, specification (2)).
Last, we use as an indicator of (time-varying) optimism the self-reported probability to
survive upon age 75 (which is the common age threshold with reference to which households
across all survey years are asked to report their life expectancy). Our findings are unaffected
when we re-estimate our baseline specification over financial respondents younger than 75 and
take into account individual life expectancy (Table 5, specification (3)).
The fourth set of robustness checks looks into the possibility households that consider
investing in stocks to increase the hours reading the news in the popular press. To this end, we
use information from a special question that asks households to report how closely they follow
the stock market.30 As it is shown in Table 5, specification (4), taking into account changes in
household propensity to follow stock market across waves leaves our estimates on the interaction
term of interest and on the hours reading news unaffected.
Another way to address this issue as well as the possibility that the hours reading news
vary due to fluctuations in EPU is to apply an IV estimation. In this context, an instrument
should correlate with EPU (i.e. be relevant) but should not immediately affect how many hours
households read the news or correlate with household time-varying unobserved characteristics
that affect stockholding. To this end, we use as an instrument an uncertainty indicator based on
text analysis of the Federal Reserve Bank report known as the Beige Book.31 The Beige Book is
29 The survey asks whether the respondent (or his spouse) has “donated any money, property, or possessions totalling $500 or more to religious or other charitable organizations”. 30 Survey respondents are asked to report “how closely do you follow stock market: very closely, somewhat, or not at all?”. The question is not asked in 2002 and 2006 surveys; we fill in these gaps by using the reported values in 2004 and 2008, respectively. 31 We use the BBD text-based uncertainty indicator for the Beige Books which they construct to show that it correlates strongly with the EPU index. This alternative index counts the frequency of “uncertain” in each Beige Book report and is subsequently normalized to account for the varying length of the reports and rescaled to preserve

24
prepared and published before the regularly scheduled FOMC meetings, summarizing the views
of market experts, business contacts and other relevant sources on current economic conditions.
We assume that the uncertainty contained in Beige Book correlates with economic policy
uncertainty news published in the popular press, but it represents an exogenous source of
information that presumably does not influence the hours that households read news.
Table 6 shows results from the IV estimation of the double fixed effects baseline model
(specification (4), Table 2) in which uncertainty contained in Beige Book is used as an
instrument for EPU. The derived F-statistic from the first-stage regression is 118.6 (i.e. well
above the rule of thumb threshold of 10 used to assess the strength of an instrument). According
to the IV estimate from the second-stage regression an assumed one-standard deviation increase
over the mean EPU, and for average reading news hours, implies a 2.3 p.p. lower likelihood of
owning stocks directly or through mutual funds (i.e. comparable to the estimated magnitude from
the baseline specification).
As an additional robustness check, we re-estimate our baseline specification by using the
lagged value of hours reading newspapers from the previous wave that a household participates
in and interacting it with contemporaneous values of the EPU index.32 Results are shown in
Table 7, specification (1). Despite the drop in the estimation sample, our findings are hardly
affected. This suggests that the effects we identify do not reflect some short-term variation in
reading hours (that could be linked to a change in stock ownership status or to short-term
fluctuations in EPU), but, more likely, some time-persistent cross-household heterogeneity.
average frequency count per report. Given that these reports are published eight times per year we apply linear interpolation to deduce a monthly-based index. 32 This means that we use hours reading reported (at least) two years before a given interview year. As a result, observations from the first wave (2002) and from households interviewed in only two waves cannot be used in the estimation.

25
On the other hand, we also experiment with an interaction term that matches hours
reading newspapers with placebo values of the EPU index taken from the pre-interview period of
the same household in the previous survey wave. In this case we find that the estimate of interest
turns out to be, as expected, quantitatively unimportant and statistically insignificant (Table 7,
specification (2)).
The last set of robustness checks reflects on the calculation of the EPU attributed to
individual households in our sample. In our baseline specifications we calculated the EPU as the
monthly average over the months between January of the HRS baseline survey year and the
month prior to every household interview. We re-estimate our baseline specifications exploiting
two alternative calculations for the EPU that is assigned to each household. The first regards the
monthly average of the EPU calculated over the three months prior to each household interview.
The second uses the EPU only from the month prior to the interview. We employ these two
alternative measures and re-estimate the entire set of five specifications shown in Table 2. The
respective results for the three-month and one-month EPU are shown on the left and right hand
side panels of Table A.3 and are broadly comparable to those we have discussed above.
7. Economic policy uncertainty and other financial asset holdings
In this section, we examine whether household exposure to policy uncertainty also affects
ownership of stock IRAs and bonds. Note that recent studies have pointed into an asymmetry in
household management towards different stockholding types (see Bilias et al. 2010). On the one
hand, households tend to trade relatively frequently directly held stocks. On the other hand,
households exhibit significant inertia in adjusting the risk composition of their retirement
portfolios over long periods in time (see Ameriks and Zeldes 2004). Consistent with considerable

26
inertia in managing retirement portfolios, we find no effects of exposure to EPU on stock IRAs
(results are shown on specification (1), Table 8).
Bonds typically represent a less risky investment alternative to stocks. Nevertheless, the
influence of economic policy uncertainty on bondholding can be quite different for different
types of bonds. The data allows us to distinguish between household investments in two types of
bonds, namely government bonds and corporate bonds. US government bonds can be viewed as
safe investments that should be little affected by policy-related uncertainty. By contrast,
corporate bonds could be influenced by policy uncertainty to the extent to which prevailing
uncertainty is likely to impact the issuing corporations. Moreover, corporate bonds represent
more specialized and information intensive assets compared to government bonds. According to
results shown on specification (2) of Table 8 we do not find a significant association between
exposure to EPU and ownership of government bonds. On the other hand, we find that greater
exposure to EPU reduces significantly the likelihood of holding corporate bonds. The implied
effect due to a one standard deviation increase in EPU over mean EPU and for a household with
average news reading time is -1 p.p. Given that only 6.6% of households own corporate bonds,
the implied contribution of the assumed increase in EPU on the unconditional ownership
probability is about 15%.
8. Conclusions
We use US survey data on households older than fifty years of age (i.e. a group that
possesses a significant fraction of society’s financial resources) to examine whether and how
prevailing policy uncertainty influences their decision to hold certain financial asset types. To
this end, we create a novel measure of household exposure to economic policy uncertainty by

27
combining information on the time households spend in reading the news with the occurrence of
words denoting policy uncertainty in articles published in the popular press. We measure the
latter using the BBD text uncertainty index calculated over the months preceding each household
interview. The fact that both components of our measure vary across households and time allows
estimating a double fixed effects model that takes into account both household-specific and time-
varying unobserved heterogeneity.
We find that households that are exposed more to policy uncertainty are less likely to
own stocks directly or through mutual funds. We estimate this effect independently from the
market volatility index and household (first-moment) expectations about the stock market index.
In addition, these households have a lower probability to own corporate bonds. On the other
hand, we do not find any significant effect due to heterogeneous household exposure to policy-
related uncertainty on the probability to own stock IRAs or government bonds.
Given that the measure of exposure to policy uncertainty is household-specific and that
we use micro-level data, we are able to examine the investment decisions of different household
groups. When we consider different education groups, we find suggestive evidence that exposure
to policy uncertainty mainly influences stockholding among the less educated, in line with the
tenets of the ‘competence hypothesis’.
Our findings reveal a channel through which policy uncertainty influences individual
choices and assess its impact on household financial risk taking. More generally, our measure of
household exposure to policy uncertainty may be used to study household decisions in contexts
other than financial investing.
28
References
Aguiar, Mark, Hurst, Erik, and Karabarbounis, Lukas (2013). “Time Use during the Great Recession”. American Economic Review 103(5), 1664-1696.
Alexopoulos, Michelle, and Cohen, Jon (2009). “Uncertain times, uncertain measures”. University of Toronto Department of Economics, Working Paper 352.
Ameriks, John, and Zeldes, Stephen P. (2004). “How do household portfolio shares vary with age?” Working Paper, Columbia University.
Armelius, Hanna, Hull, Isaiah, and Köhler, Hanna S. (2017). “The timing of uncertainty shocks in a small open economy”. Economics Letters 155, 31–34.
Baker, Scott R., Bloom, Nicholas, and Davis, Steven J. (2016). “Measuring Economic Policy Uncertainty”. The Quarterly Journal of Economics 131(4), 1593–1636.
Bar-Ilan, Avner, and Strange, William C. (1996). “Investment lags”. The American Economic Review 86(3), 610–622.
Baumeister, Roy F., Bratslavsky, Ellen, Finkenauer, Catrin, and Vohs, Kathleen D. (2001). “Bad is stronger than good”. Review of General Psychology 5(4), 323–370.
Bernanke, Ben S. (1983). “Irreversibility, uncertainty, and cyclical investment”. The Quarterly Journal of Economics 98(1), 85–106.
Bilias, Yannis, Georgarakos, Dimitris and Haliassos, Michael (2010). “Portfolio Inertia and Stock Market Fluctuations”. Journal of Money, Credit and Banking 42(4), 715-742.
Bloom, Nicholas (2009). “The impact of uncertainty shocks”. Econometrica 77(3), 623–685.
— (2014). “Fluctuations in Uncertainty”. Journal of Economic Perspectives 28(2), 153–76.
— (2017). “Observations on Uncertainty”. Australian Economic Review 50(1), 79–84.
Bloom, Nick, Bond, Stephen, and Van Reenen, John (2007). “Uncertainty and investment dynamics”. The Review of Economic Studies 74(2), 391–415.
Bogan, Vicki (2008). “Stock market participation and the internet”. Journal of Financial and Quantitative Analysis 43(1), 191–211.
Christelis, Dimitris, Georgarakos, Dimitris, and Haliassos, Michael (2013). “Differences in portfolios across countries: Economic environment versus household characteristics”. The Review of Economics and Statistics 95(1), 220–236.
Christelis, Dimitris, Jappelli, Tullio, and Padula, Mario (2010). “Cognitive abilities and portfolio choice”. European Economic Review 54(1), 18–38.
Di Maggio, Marco, Kermani, Aamir, Ramcharan, Rodney, and Yu, Edison (2016). “Uncertainty and Consumer Credit Decisions”. Mimeo.
Dimmock, Stephen G., Kouwenberg, Roy, Mitchell, Olivia S., and Peijnenburg, Kim (2016). “Ambiguity aversion and household portfolio choice puzzles: Empirical evidence”. Journal of Financial Economics 119(3), 559–577.

29
Easley, David, and O’Hara, Maureen (2009). “Ambiguity and Nonparticipation: The Role of Regulation”. The Review of Financial Studies 22(5), 1817–1843.
Ellsberg, Daniel (1961). “Risk, Ambiguity, and the Savage Axioms”. The Quarterly Journal of Economics 75(4), 643–669.
Epstein, Larry G., and Schneider, Martin (2008). “Ambiguity, information quality, and asset pricing”. The Journal of Finance 63(1), 197–228.
— (2010). “Ambiguity and asset markets”. Annual Review of Financial Economics 2(1), 315–346.
Fernández-Villaverde, Jesús, Guerrón-Quintana, Pablo, Rubio-Ramírez, Juan F., and Uribe, Martin (2011). “Risk matters: The real effects of volatility shocks”. The American Economic Review 101(6), 2530–2561.
García, J. Ricardo, and Cain, Kate (2014). “Decoding and reading comprehension: A meta-analysis to identify which reader and assessment characteristics influence the strength of the relationship in English”. Review of Educational Research 84(1), 74–111.
Georgarakos, Dimitris, and Pasini, Giacomo (2011). “Trust, sociability, and stock market participation”. Review of Finance 15(4), 693–725.
Gersten, Russell, Fuchs, Lynn S., Williams, Joanna P., and Baker, Scott (2001). “Teaching reading comprehension strategies to students with learning disabilities: A review of research”. Review of Educational Research 71(2), 279–320.
Giavazzi, Francesco, and McMahon, Michael (2012). “Policy uncertainty and household savings”. Review of Economics and Statistics 94(2), 517–531.
Gilchrist, Simon, Sim, Jae W. and Zakrajšek, Egon (2014). “Uncertainty, financial frictions, and investment dynamics”. NBER Working Paper w20038.
Gollier, Christian (2011). “Portfolio choices and asset prices: The comparative statics of ambiguity aversion”. The Review of Economic Studies 78(4), 1329-1344.
Guiso, Luigi, and Sodini, Paolo (2013). “Household finance: An emerging field”. in George Constantinides, Milton Harris, and Rene Stulz eds., Handbook of the Economics of Finance Volume 2B, North-Holland, 1397–1531.
Guiso, Luigi, and Parigi, Giuseppe (1999). “Investment and demand uncertainty”. The Quarterly Journal of Economics 114(1), 185–227.
Guiso, Luigi, Sapienza, Paola, and Zingales, Luigi (2008). “Trusting the stock market”. The Journal of Finance 63(6), 2557–2600.
Gulen, Huseyin, and Ion, Mihai (2016). “Policy Uncertainty and Corporate Investment”. The Review of Financial Studies 29(3), 523–564.
Hauser, Robert M., and Willis, Robert J. (2004). “Survey design and methodology in the Health and Retirement Study and the Wisconsin Longitudinal Study”. Population and Development Review 30, 209-235.

30
Heath, Chip, and Tversky, Amos (1991). “Preference and belief: Ambiguity and competence in choice under uncertainty”. Journal of Risk and Uncertainty 4(1), 5–28.
Hong, Harrison, Kubik, Jeffrey, and Stein, Jeremy (2004). “Social interaction and stock-market participation”. The Journal of Finance 59(1), 137–163.
Izhakian, Yehuda, and Benninga, Simon (2011). “The uncertainty premium in an ambiguous economy”. The Quarterly Journal of Finance 1(02), 323–354.
Julio, Brandon, and Yook, Youngsuk (2012). “Political uncertainty and corporate investment cycles”. The Journal of Finance 67(1), 45–83.
Jurado, Kyle, Ludvigson, Sydney C., and Ng, Serena (2015). “Measuring Uncertainty”. American Economic Review 105(3), 1177–1216.
Kahneman, Daniel, and Tversky, Amos (1979). “Prospect Theory: An Analysis of Decision under Risk”. Econometrica 47(2), 263–291.
Klinger, Eric, Barta, Steven G., and Maxeiner, Madeline E (1980). “Motivational correlates of thought content frequency and commitment”. Journal of Personality and Social Psychology 39(6), 1222–1237.
Knight, Frank H. (1921). “Risk, uncertainty and profit”. New York: Hart, Schaffner and Marx.
Kraft, Holger, Schwartz, Eduardo S., and Weiss, Farina (2013). “Growth options and firm valuation”. NBER Working Paper w18836.
Leahy, John, and Whited, Toni (1996). “The Effect of Uncertainty on Investment: Some Stylized Facts”. Journal of Money, Credit and Banking 28(1), 64–83.
Ludvigson, Sydney C., Ma, Sai, and Ng, Serena (2015). “Uncertainty and Business Cycles: Exogenous Impulse or Endogenous Response?” NBER Working Paper w21803.
Maccheroni, Fabio, Marinacci, Massimo, and Ruffino, Doriana (2013). “Alpha as Ambiguity: Robust Mean-Variance Portfolio Analysis”. Econometrica 81(3), 1075–1113.
Pastor, Lubos, and Veronesi, Pietro (2012). “Uncertainty about government policy and stock prices”. The Journal of Finance 67(4), 1219–1264.
Romer, Christina D. (1990). “The Great Crash and the Onset of the Great Depression”. The Quarterly Journal of Economics 105(3), 597–624.
Rosen, Harvey S. and Wu, Stephen (2004). “Portfolio Choice and Health Status”, Journal of Financial Economics 72(3),457–484.
Soroka, Stuart N. (2006). “Good news and bad news: Asymmetric responses to economic information”. Journal of Politics 68(2), 372–385.
Tabellini, Guido (2010). “Culture and institutions: economic development in the regions of Europe”. Journal of the European Economic Association 8(4), 677–716.
van Rooij, Maarten, Lusardi, Annamaria, and Alessie, Rob (2011). “Financial literacy and stock market participation.” Journal of Financial Economics, 101, 449–472.

31
Figure 1. HRS and CAMS timeline
32
Figure 2. EPU + interviews

33
Table 1. Summary statistics
Panel A: Socio-economic characteristics Mean Median Std. deviation Word recall score 5.50 6.00 1.77 Numeracy score 3.71 4.00 1.65 No memory difficulties (interviewer) 0.93 0.25 Adequate understanding (interviewer) 0.94 0.24 Household size 2.00 2.00 1.11 Number of ADLs facing limitations with 0.29 0.00 0.81 Health fair or bad (self-reported) 0.25 0.43 Feeling depressed 0.13 0.33 Working 0.34 0.47 Retired 0.53 0.50 Know neighbors 0.72 0.45 Engage in voluntary activities 0.37 0.48 Expect to leave a bequest 0.90 0.30 Familiar with Internet 0.52 0.50 Non-capital total household income 55,070 30,400 431,780 Net total non-stock wealth 339,492 151,550 702,829 Panel B: Hours spent per month in
various activities Mean Median Std. deviation Hours reading newspapers (from paper and online)
19.2 12.0 18.2
Hours reading books 13.6 4.0 20.4 Hours using the PC 33.0 8.0 48.6 Hours watching programs or movies/ videos on TV
80.1 68.0 59.9
Hours working 56.2 0.0 78.2 Hours socializing with friends 53.3 38.0 51.0 Hours participating in voluntary/ religious activities
7.0 3.0 11.1
Hours entertaining 5.4 2.0 9.0 Hours sleeping 186.9 200.0 64.5

34
Table 2. EPU and stock ownership (1) (2) (3) (4) (5) log (EPU) × log (Hours reading newspapers)
-0.0183*** (0.0068)
-0.0182*** (0.0069)
-0.0196** (0.0075)
-0.0196** (0.0075)
-0.0239** (0.0115)
log (Hours reading newspapers) 0.0907***
(0.0322) 0.0904*** (0.0324)
0.0966*** (0.0351)
0.0965*** (0.0351)
0.1233** (0.0542)
Expected stock market up
0.0005*** (0.0001)
Cognitive indicators Word recall score
0.0038** (0.0018)
0.0036* (0.0019)
0.0035* (0.0019)
0.0046 (0.0028)
Numeracy score
-0.0027 (0.0021)
-0.0024 (0.0023)
-0.0023 (0.0023)
-0.0006 (0.0031)
No memory difficulties (interviewer)
-0.0076 (0.0087)
-0.0096 (0.0098)
-0.0095 (0.0097)
0.0029 (0.0161)
Adequate understanding (interviewer)
-0.0021 (0.0090)
-0.0050 (0.0101)
-0.0047 (0.0101)
-0.0033 (0.0152)
Income/wealth quartiles 2nd Income Quartile
-0.0062 (0.0081)
-0.0080 (0.0119)
3rd Income Quartile
0.0003 (0.0113)
0.0035 (0.0141)
4th Income Quartile
0.0205 (0.0137)
0.0066 (0.0177)
2nd Wealth Quartile
0.0136* (0.0077)
0.0110 (0.0125)
3rd Wealth Quartile
0.0140 (0.0120)
0.0057 (0.0189)
4th Wealth Quartile
0.0091 (0.0151)
0.0013 (0.0231)
Demographics NO NO YES YES YES Region fixed effects NO NO YES YES YES Household fixed effects YES YES YES YES YES Month-Year fixed effects YES YES YES YES YES Number of observations 21,642 21,451 19,797 19,797 11,725 Adj. R-Square 0.59 0.59 0.60 0.60 0.60 Note: Stock ownership refers to stocks held directly or through mutual funds. EPU is the monthly average EPU between January of the main survey year and the month prior to every household interview, calculated as in Baker et al. (2016). Double clustered standard errors by household and interview month in parentheses. ***, **, and * denote statistical significance at 1%, 5%, and 10%, respectively.

35
Table 3. Hours reading news interacted with various indicators (1) (2) (3) (4) (5) (6) (7) (8) log (EPU) × log (Hours reading newspapers) -0.0215***
(0.0078) -0.0272* (0.0151)
-0.0186** (0.0078)
-0.0156** (0.0076)
-0.0189** (0.0083)
-0.0167** (0.0077)
-0.0210*** (0.0076)
-0.0195** (0.0075)
log (Hours reading newspapers) 0.2186**
(0.0914) 0.1068*** (0.0404)
0.1136** (0.0442)
0.1227*** (0.0367)
0.0933** (0.0395)
0.0840** (0.0358)
0.1052*** (0.0367)
0.0971 (0.0727)
log (SP500) × log (Hours reading newspapers) -0.0157
(0.0101)
log (VIX) × log (Hours reading newspapers)
0.0088 (0.0146)
log (Prof_forecaster) × log (Hours reading newspapers)
-0.0047 (0.0082)
log (Oil) × log (Hours reading newspapers)
-0.0104** (0.0050)
real GDP gr × log (Hours reading newspapers)
0.0002 (0.0008)
log (int_rate) × log (Hours reading newspapers)
0.0011 (0.0015)
log (CPI) × log (Hours reading newspapers)
-0.0009 (0.0018)
log (EPU_SE) × log (Hours reading newspapers)
-0.0002 (0.0163)
Cognitive indicators YES YES YES YES YES YES YES YES Income/wealth quartiles YES YES YES YES YES YES YES YES Demographics YES YES YES YES YES YES YES YES Region fixed effects YES YES YES YES YES YES YES YES Household fixed effects YES YES YES YES YES YES YES YES Month-Year fixed effects YES YES YES YES YES YES YES YES Number of observations 19,797 19,797 19,797 19,797 19,797 19,797 19,797 19,797 Adj. R-Square 0.60 0.60 0.60 0.60 0.60 0.60 0.60 0.60 Note: See note in Table 2. Double clustered standard errors by household and interview month in parentheses. ***, **, and * denote statistical significance at 1%, 5%, and 10%, respectively.

36
Table 4. EPU interacted with hours spent in various activities (1) (2) (3) (4) (5) (6) (7) (8) log (EPU) × log (Hours reading books) -0.0034
(0.0067)
log (EPU) × log (Hours using the PC)
-0.0041 (0.0046)
log (EPU) × log (Hours watching programs or movies/ videos on TV)
-0.0007 (0.0086)
log (EPU) × log (Hours working)
-0.0067 (0.0045)
log (EPU) × log (Hours socializing with friends)
0.0001 (0.0087)
log (EPU) × log (Hours participating in voluntary/ religious activities)
0.0009 (0.0076)
log (EPU) × log (Hours entertainment)
-0.0073 (0.0087)
log (EPU) × log (Hours sleeping)
-0.0158 (0.0114)
log (Hours #) 0.0206 (0.0315)
0.0230 (0.0216)
-0.0003 (0.0405)
0.0309 (0.0210)
-0.0010 (0.0410)
-0.0072 (0.0359)
0.0288 (0.0414)
0.0755 (0.0533)
Cognitive indicators YES YES YES YES YES YES YES YES Income/wealth quartiles YES YES YES YES YES YES YES YES Demographics YES YES YES YES YES YES YES YES Region fixed effects YES YES YES YES YES YES YES YES Household fixed effects YES YES YES YES YES YES YES YES Month-Year fixed effects YES YES YES YES YES YES YES YES Number of observations 19,737 19,799 19,741 19,910 19,396 19,392 19,647 19,748 Adj. R-Square 0.60 0.61 0.60 0.60 0.60 0.60 0.60 0.60 Note: See note in Table 2. Double clustered standard errors by household and interview month in parentheses. ***, **, and * denote statistical significance at 1%, 5%, and 10%, respectively.

37
Table 5. Additional time-varying covariates (1) (2) (3) (4) log (EPU) × log (Hours reading newspapers)
-0.0225** (0.0091)
-0.0203*** (0.0075)
-0.0201** (0.0088)
-0.0183** (0.0078)
log (Hours reading newspapers) 0.1107**
(0.0430) 0.0990*** (0.0352)
0.1010** (0.0413)
0.0902** (0.0369)
Willingness to take higher risks 0.0134
(0.0100)
Charity donation
0.0179** (0.0086)
Life expectancy
0.0006* (0.0003)
Follow stock market
0.0442*** (0.0069)
Cognitive indicators YES YES YES YES Income/wealth quartiles YES YES YES YES Demographics YES YES YES YES Region fixed effects YES YES YES YES Household fixed effects YES YES YES YES Month-Year fixed effects YES YES YES YES Number of observations 14,941 19,651 12,021 18,979 Adj. R-Square 0.60 0.60 0.58 0.60 Note: See note in Table 2. Double clustered standard errors by household and interview month in parentheses. ***, **, and * denote statistical significance at 1%, 5%, and 10%, respectively.

38
Table 6. EPU and stock ownership: IV estimates (1) log (EPU) × log (Hours reading newspapers)
-0.0237** (0.0093)
log (Hours reading newspapers) 0.1158**
(0.0440) Cognitive indicators YES Income/wealth quartiles YES Demographics YES Region fixed effects YES Household fixed effects YES Month-Year fixed effects YES Number of observations 19,752 Adj. R-Square 0.70 F-test (first stage) 118.59 Note: IV estimates from a double fixed-effects model. Double clustered standard errors by household and interview month in parentheses. EPU is instrumented by a text-based uncertainty indicator, drawn from the Federal Reserve Bank report known as the Beige Book. ***, **, and * denote statistical significance at 1%, 5%, and 10%, respectively.

39
Table 7. Lagged Hours reading news and lagged EPU (1) (2) log (EPU) × log (Hours reading newspapers_lagged)
-0.0202** (0.0088)
log (Hours reading newspapers_lagged)
0.0989** (0.0416)
log (EPU_lagged) × log (Hours reading newspapers)
0.0008 (0.0091)
log (Hours reading newspapers)
0.0001
(0.0432) Cognitive indicators YES YES Income/wealth quartiles YES YES Demographics YES YES Region fixed effects YES YES Household fixed effects YES YES Month-Year fixed effects YES YES Number of observations 13,553 13,732 Adj. R-Square 0.62 0.62 Note: See note in Table 2. Double clustered standard errors by household and interview month in parentheses. ***, **, and * denote statistical significance at 1%, 5%, and 10%, respectively.

40
Table 8. EPU and ownership of various financial asset categories Stock IRAs Government bonds Corporate bonds
(1) (2) (3) log (EPU) × log (Hours reading newspapers)
-0.0007 (0.0073)
-0.0114 (0.0074)
-0.0109** (0.0043)
log (Hours reading newspapers) 0.0024
(0.0346) 0.0510
(0.0345) 0.0493**
(0.0203) Cognitive indicators YES YES YES Income/wealth quartiles YES YES YES Demographics YES YES YES Region fixed effects YES YES YES Household fixed effects YES YES YES Month-Year fixed effects YES YES YES Number of observations 19,797 19,797 19,797 Adj. R-Square 0.60 0.49 0.43 Note: Stock IRAs refer to stocks held through IRAs. Government bonds refer to CDs, government savings bonds and T-bills. Corporate bonds refer to corporate, municipal, government or foreign bonds, or any other bond funds. See note in Table 2. Double clustered standard errors by household and interview month in parentheses. ***, **, * denote statistical significance at 1%, 5%, and 10% level of confidence.

41
Table A.1. EPU and VIX summary statistics, January 2001 - April 2015
Nb. of months min p10 p25 p50 p75 p90 max mean sd
Panel A:
EPU, interview phase 92 49.6 67.81 86.09 110.09 150.7 185.59 241.77 120.32 44.87
EPU, no interview 80 44.78 69.76 87.26 107.82 137.61 181.49 283.67 118.07 49.79
Total 172 44.78 69.49 86.23 108.45 144.92 184.82 283.67 119.28 47.1
Panel B:
VIX, interview phase 92 10.82 12.3 14.02 17.29 22.31 32.22 62.64 20.42 10.19
VIX, no interview 80 11.05 12.78 14.82 20.23 24.98 31.96 44.8 20.94 7.23
Total 172 10.82 12.47 14.22 17.92 24.53 31.98 62.64 20.66 8.92

42
Table A.2. Various indicators: description and sources
Variable Description Source
S&P500S&P500 index, used from 4/2002 - 4/2015
SNP Real Time Price (^SP500TR). Currency in USD, retrieved from Yahoo Finance, March 1, 2017
VIX
Model free measure of the risk neutral implied volatility, calculated from S&P500 index options for a 30-day horizon and compiled by the Chicago Board Options Exchange (CBOE).
VOLATILITY S&P 500 (^VIX), Chicago Options Delayed Price, retrieved from Yahoo Finance, March 1, 2017.
Prof_forecasterForecaster disagreement about future CPI as developed by Baker et al. (2016)
www.policyuncertainty.com
Oil
Crude Oil Prices: West Texas Intermediate (WTI) - Cushing, Oklahoma, Dollars per Barrel, Monthly, Not Seasonally Adjusted
U.S. Energy Information Administration, Crude Oil Prices: West Texas Intermediate (WTI) - Cushing, Oklahoma [DCOILWTICO], retrieved from FRED, Federal Reserve Bank of St. Louis, https://fred.stlouisfed.org/series/DCOILWTICO, March 29, 2017.
real GDP gr
Real Gross Domestic Product, Percent Change from Preceding Period, Quarterly, Seasonally Adjusted Annual Rate
U.S. Bureau of Economic Analysis, Real Gross Domestic Product [A191RL1Q225SBEA], retrieved from FRED, Federal Reserve Bank of St. Louis, https://fred.stlouisfed.org/series/A191RL1Q225SBEA, April 6, 2017.
int_rateEffective Federal Funds Rate, Percent, Monthly, Not Seasonally Adjusted
Board of Governors of the Federal Reserve System (US), Effective Federal Funds Rate [FEDFUNDS], retrieved from FRED, Federal Reserve Bank of St. Louis, https://fred.stlouisfed.org/series/FEDFUNDS, March 29, 2017.
CPI
Consumer Price Index for All Urban Consumers: All Items, Percent Change from Year Ago, Monthly, Seasonally Adjusted
U.S. Bureau of Labor Statistics, Consumer Price Index for All Urban Consumers: All Items [CPIAUCSL], retrieved from FRED, Federal Reserve Bank of St. Louis, https://fred.stlouisfed.org/series/CPIAUCSL, April 21, 2017.
EPU_SEEconomic policyuncertainty index for Sweden as developed by Armelius et al. (2017)
www.policyuncertainty.com
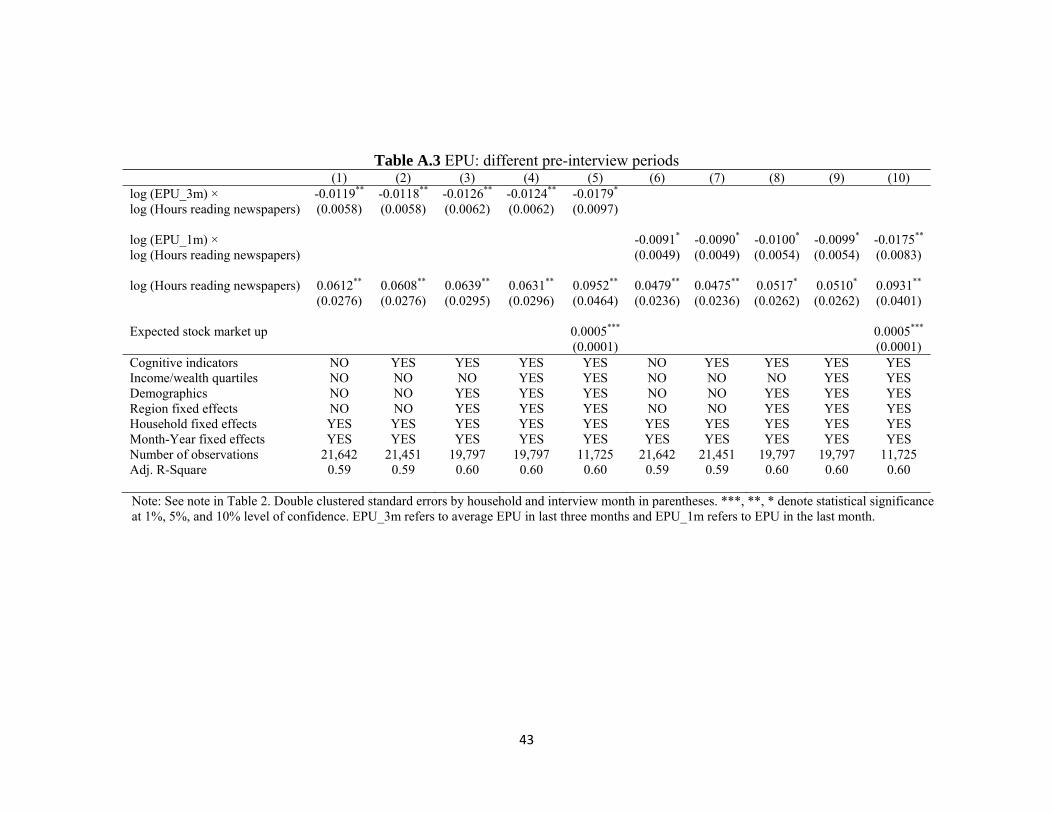
43
Table A.3 EPU: different pre-interview periods
(1) (2) (3) (4) (5) (6) (7) (8) (9) (10) log (EPU_3m) × log (Hours reading newspapers)
-0.0119** (0.0058)
-0.0118** (0.0058)
-0.0126** (0.0062)
-0.0124** (0.0062)
-0.0179* (0.0097)
log (EPU_1m) × log (Hours reading newspapers)
-0.0091* (0.0049)
-0.0090* (0.0049)
-0.0100* (0.0054)
-0.0099* (0.0054)
-0.0175** (0.0083)
log (Hours reading newspapers) 0.0612**
(0.0276) 0.0608** (0.0276)
0.0639** (0.0295)
0.0631** (0.0296)
0.0952** (0.0464)
0.0479** (0.0236)
0.0475** (0.0236)
0.0517* (0.0262)
0.0510* (0.0262)
0.0931** (0.0401)
Expected stock market up
0.0005*** (0.0001)
0.0005*** (0.0001)
Cognitive indicators NO YES YES YES YES NO YES YES YES YES Income/wealth quartiles NO NO NO YES YES NO NO NO YES YES Demographics NO NO YES YES YES NO NO YES YES YES Region fixed effects NO NO YES YES YES NO NO YES YES YES Household fixed effects YES YES YES YES YES YES YES YES YES YES Month-Year fixed effects YES YES YES YES YES YES YES YES YES YES Number of observations 21,642 21,451 19,797 19,797 11,725 21,642 21,451 19,797 19,797 11,725 Adj. R-Square 0.59 0.59 0.60 0.60 0.60 0.59 0.59 0.60 0.60 0.60 Note: See note in Table 2. Double clustered standard errors by household and interview month in parentheses. ***, **, * denote statistical significance at 1%, 5%, and 10% level of confidence. EPU_3m refers to average EPU in last three months and EPU_1m refers to EPU in the last month.