economic integration, the business cycle, and …€¦ · introduction important milestones have...
TRANSCRIPT
451
Introduction
Important milestones have been reached this year in the history of bilateraleconomic relations between Canada and the United States. In particular,2004 marks the 10th anniversary of the North American Free TradeAgreement (NAFTA) and the 15th anniversary of its precursor, the Canada-US Free Trade Agreement (CUSFTA). These agreements have been excep-tionally successful in promoting trade and financial flows between the twocountries over the years, yielding one of the world’s largest bilateral tradeand bilateral direct investment relationships (USTR 2003).
Some observers in Canada have recently called for deeper integration withthe United States to eliminate remaining barriers to trade. The mostambitious proposals include calls for a “grand bargain,” which would couplesecurity and defence-related policies with deeper trade integration, possiblyin the context of a customs union or common market (Dobson 2002).Similarly, some proposals have included calls for a monetary union with theUnited States (Courchene 2003). There have also been more modest andimmediately practical proposals, involving suggestions for greater efforttowards harmonizing rules, standards, and regulations, in order to reduce theextent to which these arrangements impede trade and efficiency (Goldfarb2003).
However, other observers have questioned the merits of these proposals andhave argued that further economic integration with the United States mightnot be in the best interests of Canada. In particular, they claim that increased
Economic Integration, the Business Cycle,and Productivity in North America
Roberto Cardarelli and M. Ayhan Kose

452 Cardarelli and Kose
economic integration between the Canadian and US economies has notcontributed to reducing Canada’s dependence on natural resources and tonarrowing the labour productivity gap between the two countries (Jackson2003a, 2003b). Moreover, they argue that a customs union with the UnitedStates would imply giving up an independent trade policy, which might havean adverse impact on Canada’s broader trade policy priorities.
To shed light on the debate about the future direction of economicintegration, we analyze the impact of major Canada-US trade agreements onthe dynamics of business cycles and productivity. In particular, we addressthe following questions: First, what has been the impact of the major tradeagreements on trade and financial flows between the two countries? Second,what has been the effect of increased economic linkages on the co-movement of business cycles in Canada and the United States? Third, howhas the economic integration affected the labour productivity gap betweenthe two economies?
Canada and the United States have taken important steps to promoteeconomic linkages during the past four decades. Section 1 reviews the keyprovisions of major trade agreements signed by Canada and the UnitedStates. The 1965 Canada-US Auto Pact freed cross-border trade in thesector, and led to a significant growth of the Canadian auto industry. In1989, CUSFTA expanded the coverage of tariff-free trade to almost allsectors, and in 1994, NAFTA broadened the scope of the CUSFTA byincluding Mexico. The CUSFTA and NAFTA were groundbreaking, insofaras they covered a broad range of sectors, including services and investment,and introduced a unique dispute settlement mechanism.
Isolating the impact of these agreements on the economies of Canada andthe United States is a difficult exercise, as various other major factors haveaffected these countries over the past two decades. Among these factors arethe increases in global trade and finance flows during this period, and thedifferent business cycles and economic policies that were implemented inthe two countries. For example, after an unprecedented expansion in the1990s, the US economy went into a recession in 2001 and remained sluggishuntil mid-2003. In contrast, Canada has enjoyed a prolonged expansionaryperiod since the late 1990s, after the macroeconomic and structuraladjustment earlier in the decade. To account for these factors and to providefor a comprehensive assessment of the effects of the trade agreements onCanadian business cycle and productivity dynamics, we document severalstylized facts, employ a variety of econometric methods, and review theresults of recent research.

Economic Integration, the Business Cycle, and Productivity in North America 453
In section 2, we examine the impact of the major agreements on trade andfinancial flows in Canada.1 In particular, CUSFTA and NAFTA have beenassociated with substantial increases in trade and financial flows between thetwo countries. The inception of CUSFTA also affected the dynamics ofnational and regional trade flows. With exports to the United States risingmuch faster than imports, the contribution of net exports to the growth ofCanadian gross domestic product (GDP) rose rapidly. In addition, afterCUSFTA, the average share of international trade in provincial GDP in-creased much faster than that of interprovincial trade.
In section 3, we study the extent to which there has been an effect on the co-movement of Canada-US business cycles. Increased trade and financiallinkages led to significant changes in the dynamics of business cycles inCanada. Canada-US business cycles have become more synchronized, andthe rapid growth of intra-industry trade has also contributed to greater cross-country correlations of investment and imports. We also use a dynamiclatent factor model to examine the role of common, country-specific, andidiosyncratic factors in driving business cycles in Canada and the UnitedStates. The estimation results indicate that, although the common factor hasplayed an increased role in explaining business cycles in Canada and theUnited States since the early 1980s, country-specific and idiosyncraticfactors remain important in Canada.
In section 4, we analyze the impact of economic integration on the labourproductivity gap between the two countries. The results indicate that thewidening labour productivity gap between the two economies over the1990s is mainly a reflection of the different evolution of the two countries’industrial structure. However, the negative impact from the differentindustry specialization between the two countries does not seem to berelated to the increased trade integration of Canada and the United Statesover the 1990s. The increased economic integration with the United Stateshas allowed Canadian firms to benefit from economies of scale andtechnology transfers, something that appears to have positively contributedto their productivity performance.
In the final section, we conclude with a brief summary of the results andpolicy implications. The results indicate that economic integration has beenassociated with a significant increase in business cycle synchronicity, andwith convergence in total factor productivity. At the same time, however, thedifferent industrial structure of the two economies implies that they remainsubject to substantial country-specific shocks. Differences in industrial
1. Kose, Meredith, and Towe (2004) provide a detailed examination of the impact ofNAFTA on the Mexican economy.

454 Cardarelli and Kose
structure have also prevented convergence in aggregate labour productivity.Although these findings would seem to weigh against moving towards amonetary union, they also suggest that substantial benefits could be reapedfrom further reducing the remaining barriers to trade.
1 Trade Agreements Between Canadaand the United States
An important step towards promoting Canada-US trade linkages was the1965 Canada-US Auto Pact. Prior to the Auto Pact, tariffs on cross-bordertrade in automotive products were high—roughly 7 per cent in Canada and17 per cent in the United States. The pact eliminated all tariffs faced byproducers and led to significant growth in the Canadian auto industry—theindustry became highly integrated with the US industry, and transportationequipment became Canada’s largest export to the United States (Hummels,Rapoport, and Yi 1998).
The 1989 Canada-US Free Trade Agreement (CUSFTA) introduced freetrade in almost all sectors. CUSFTA eliminated most tariffs and other tradebarriers in its first ten years, with the average Canadian tariff onmanufacturing imports from the United States falling from 3 per cent in1989 to almost zero in 2001, and the average US tariff on imports fromCanada falling from around 4.5 per cent to 0.5 per cent during the sameperiod (Figures 1 and 2). The agreement gave considerable preferential tariffadvantage to the other country, since tariffs on imports from third countriesremained relatively higher. In addition, CUSFTA substantially reduced non-tariff barriers, provided ground rules covering trade in services andinvestment, and included various dispute settlement mechanisms (USITC2003).
The 1994 North American Free Trade Agreement (NAFTA) represented afurther milestone.2 NAFTA created the world’s largest free trade area interms of total GDP, and it is the second largest, in terms of total tradevolume, after the European Union. In 2002, total GDP of NAFTA memberswas more than 25 per cent larger than that of the European Union. Exports(imports) of the European Union constituted roughly 38 (35) per cent ofworld exports (imports), while exports (imports) of NAFTA accounted forabout 18 (25) per cent (DFAIT 2003). In addition, NAFTA was the first
2. Negotiations for NAFTA formally started in June 1991. Since the member countries hadheld bilateral discussions earlier, negotiations moved forward quickly and were completedin August 1992. The United States and Mexico passed the NAFTA legislation in November1993, and Canada did the same in December 1993. Finally, NAFTA entered into force on1 January 1994.

Economic Integration, the Business Cycle, and Productivity in North America 455
Figure 1United States: Average tariffs on imports from Canada and world
Figure 2Canada: Average tariffs on manufacturing importsfrom the United States and rest of world
6
5
4
3
2
1
01989 1991 1993 1995 19971990 1992 1994 1996 1998 1999 2000 2001
Tariff rate (percentage) CanadaWorld
7
6
5
4
3
2
01989 1991 1993 1995 19971990 1992 1994 1996 1998 1999 2000
Tariff rate (percentage) United StatesRest of world
1
456 Cardarelli and Kose
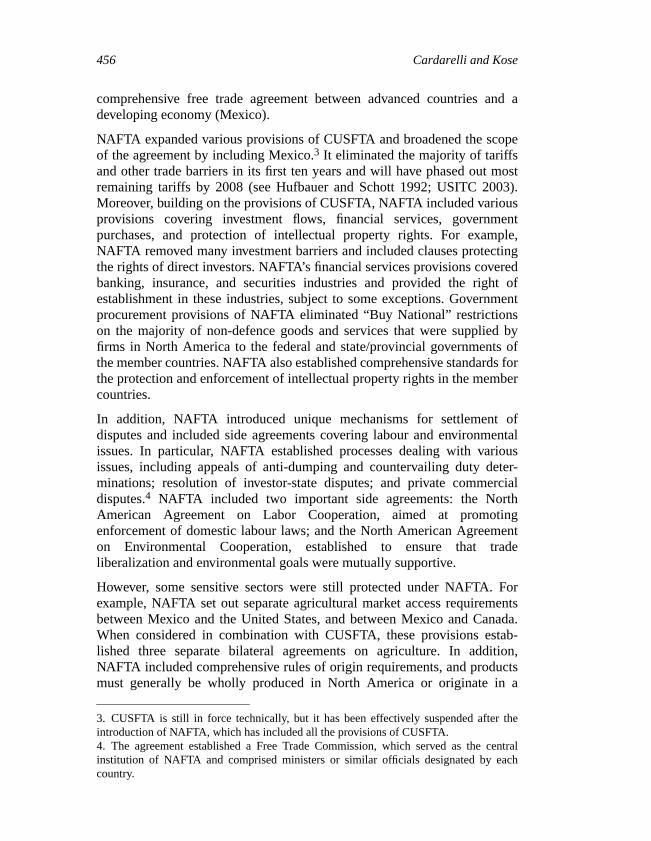
comprehensive free trade agreement between advanced countries and adeveloping economy (Mexico).
NAFTA expanded various provisions of CUSFTA and broadened the scopeof the agreement by including Mexico.3 It eliminated the majority of tariffsand other trade barriers in its first ten years and will have phased out mostremaining tariffs by 2008 (see Hufbauer and Schott 1992; USITC 2003).Moreover, building on the provisions of CUSFTA, NAFTA included variousprovisions covering investment flows, financial services, governmentpurchases, and protection of intellectual property rights. For example,NAFTA removed many investment barriers and included clauses protectingthe rights of direct investors. NAFTA’s financial services provisions coveredbanking, insurance, and securities industries and provided the right ofestablishment in these industries, subject to some exceptions. Governmentprocurement provisions of NAFTA eliminated “Buy National” restrictionson the majority of non-defence goods and services that were supplied byfirms in North America to the federal and state/provincial governments ofthe member countries. NAFTA also established comprehensive standards forthe protection and enforcement of intellectual property rights in the membercountries.
In addition, NAFTA introduced unique mechanisms for settlement ofdisputes and included side agreements covering labour and environmentalissues. In particular, NAFTA established processes dealing with variousissues, including appeals of anti-dumping and countervailing duty deter-minations; resolution of investor-state disputes; and private commercialdisputes.4 NAFTA included two important side agreements: the NorthAmerican Agreement on Labor Cooperation, aimed at promotingenforcement of domestic labour laws; and the North American Agreementon Environmental Cooperation, established to ensure that tradeliberalization and environmental goals were mutually supportive.
However, some sensitive sectors were still protected under NAFTA. Forexample, NAFTA set out separate agricultural market access requirementsbetween Mexico and the United States, and between Mexico and Canada.When considered in combination with CUSFTA, these provisions estab-lished three separate bilateral agreements on agriculture. In addition,NAFTA included comprehensive rules of origin requirements, and productsmust generally be wholly produced in North America or originate in a
3. CUSFTA is still in force technically, but it has been effectively suspended after theintroduction of NAFTA, which has included all the provisions of CUSFTA.4. The agreement established a Free Trade Commission, which served as the centralinstitution of NAFTA and comprised ministers or similar officials designated by eachcountry.

Economic Integration, the Business Cycle, and Productivity in North America 457
member country to qualify for NAFTA preferences. Moreover, NAFTAcontained safeguard clauses covering import surges from the membercountries.
2 Dynamics of Trade and Financial Flows
2.1 Growth of trade flows
Trade flows between Canada and the United States increased significantlyafter the advent of CUSFTA. Canada’s merchandise trade (the sum ofexports and imports) to the United States more than doubled in US dollarterms over the period 1988–2002, and trade with the United States, onaverage, grew more than two times faster than GDP after the inception ofCUSFTA (Figure 3a). During the same period, the share of exports to theUnited States rose from around 30 per cent of GDP to as high as 55 per cent(Figure 3b). By 2002, roughly 90 per cent of Canadian merchandise exportswere directed to the United States, a 17 percentage point increase from 1988(Figure 3c). By contrast, the share of Canadian imports from the UnitedStates remained roughly unchanged at around 65 per cent during the sameperiod.
The product mix of Canada-US trade also shifted. Although transportationequipment, along with machinery and electronics, continued to represent asignificant fraction of Canada’s total trade with the United States, theirimportance decreased during the period 1989–92 (Table 1). Notably, theshare of Canada’s exports to the United States associated with primarysectors, including metals and minerals and wood and pulp, also declinedsomewhat, with sharp increases in apparel and textiles and specialtransactions (DFAIT 2003). These trends were accompanied by a significantincrease in the share of Canada’s exports from the agriculture and oilsectors, and to a lesser extent, the manufacturing and service sectors beingdirected to the United States (Figure 3d).5
The inception of CUSFTA also had important national and regional effectsin Canada. With exports to the United States rising much faster thanimports, the contribution of net exports to GDP growth jumped from aboutzero during the period 1973–88 to about 0.75 percentage points after theintroduction of CUSFTA (Figure 4a). The growth in trade appeared tofavour those regions—British Columbia, the Prairies, and the Atlanticregion—which previously had relatively weak ties to the US market (Figure4b). These regions saw a sharp jump in the share of their exports being
5. The information and communication technology (ICT)-producing sector is proxied bythe industrial machinery and electrical and electronic product sectors.

458 Cardarelli and Kose
600
500
400
300
200
100
01980 1984 1988 1992 1996 2000
Figure 3a
Index, 1980 = 100
ImportsExportsGDP
60
50
40
30
20
10
01960 1968 1976 1984 1992 2000
Figure 3b
(Percentage)
ImportsExportsGDP
Trade with the United States
90
80
70
60
501960 1968 1976 1984 1992 2000
Figure 3c
(Percentage)
ImportsExports
Trade with the United States
100
80
60
40
20Agri- Mining Manu- Service
Figure 3d
Percentage of total sectoral exports
19892002
Canada: Sectoral exports to
and oil facturingculture
Trade with the United Statesas a share of GDPand GDP
as a share of total the United States

Economic Integration, the Business Cycle, and Productivity in North America 459
2.5
2.0
1.5
1.0
0.5
0.0
–0.5Exports Exports Net Trade
Figure 4a
Percentage points
1973Q1–1988Q41989Q1–2002Q4
100
90
80
70
60
50
40
BC & Prairies Ontario Quebec Atlantic
Figure 4b
Percentage of total regional exports
19892002
Exports to the United States by region
60
40
20
10
0BC & Prairies Ontario Quebec Atlantic
Figure 4c
In percentage of total
Regional exports to the United States
50
40
30
20
10
Primary High-tech Average over
Figure 4d
Processed imports as a share
1961–801981–88
Vertical specialization
manufacturingindustries
Contributions to GDP growth
to US balancewith US
exports
30
territories
50
30
19892002
territories
of sectoral merchandise exportsCanadian exports
0
all industries
1989–2002

460 Cardarelli and Kose
directed to the United States, narrowing the gap with Ontario and Quebec,which had already enjoyed strong trade links to the United States (Figure4c).
The importance of geographical change in Canadian trade patterns from thetraditional east-west trading axis to the international north-south trading oneis also emphasized by recent research. In particular, the average share ofinternational trade in provincial GDP increased much faster than that ofinterprovincial trade after the inception of CUSFTA, and rose from 42 percent in 1991 to 75 per cent in 2000 (Courchene 2003). For Quebec andOntario especially, the relative importance of international trade rosetremendously during the 1990s as the United States market becameincreasingly more important. In particular, Ontario’s exports to the UnitedStates rose from 25 per cent of its GDP in 1989 to almost 50 per cent in2001.
A number of recent studies examine the changes in the dynamics of regionaltrade flows using various gravity models. For example, Wall (2003) studiesbilateral trade flows among the NAFTA members using a gravity model.He concludes that NAFTA resulted in a large increase in the trade volumebetween Central Canada (Ontario and Quebec) and the United States duringthe 1993–97 period. However, his results also suggest that NAFTA led to adecrease in the amount of trade between Eastern Canada (New Brunswick,Newfoundland, Nova Scotia, and Prince Edward Island), while its impact onthe trade flows from Western Canada (Alberta, British Columbia, Manitoba,and Saskatchewan) to the United States was relatively minor. Gu andSawchuk (2001) study the changes in regional trade flows between Canada
Table 1Canada: Merchandise trade with the United States(Share of total exports and imports, percentage)
Exports 1989 2002 Change (1989–2002)
Transportation equipment 32.8 27.0 –5.8Machinery and electronics 14.6 13.7 –0.9Metals and minerals 21.3 21.7 0.4Wood and pulp 15.0 10.5 –4.5All others 16.4 27.1 10.7
ImportsTransportation equipment 28.1 25.6 –2.5Machinery and electronics 33.6 30.6 –3.0Metals and minerals 11.3 10.9 –0.4Chemicals and plastic and rubber 10.0 14.8 4.8All others 17.0 18.2 1.2
Source: DFAIT (2003).

Economic Integration, the Business Cycle, and Productivity in North America 461
and the United States over the period 1990–98, employing a gravity modelthat accounts for the effects associated with market size and distance. Theydocument that regional trade flows with the United States rose by 6.7 percent per year for Ontario, 5.3 per cent for Quebec, 5 per cent for the Prairies,and 4.7 per cent for Atlantic Canada during this period.
Recent research also confirms the significant impact of CUSFTA onCanada-US trade flows. Clausing (2001) analyzes the effect of CUSFTA oncommodity-level tariff rates and concludes that more than half of theincrease in Canada’s exports to the United States during 1989–94 was due tothe agreement. Romalis (2002) examines the impact of tariff preferenceassociated with CUSFTA and NAFTA on the trade flows between themember countries and confirms that CUSFTA has had a large impact onCanada’s trade share with the United States. Wall (2003) uses a gravityframework and finds that NAFTA accounts for roughly 50 per cent of theincrease in the exports of Canada to the United States and approximately25 per cent of the increase in Canadian imports from the United States.Clausing (2001) concludes that the agreement did not result in any sizabletrade diversion, i.e., the expansion of trade was not at the expense of othercountries, while Romalis and Wall argue that the agreements induced tradediversion. Schwanen (1997) compares trade in sectors that were liberalizedafter CUSFTA and NAFTA with others and concludes that exports ofCanada to the United States in these sectors rose by 139 per cent and by only64 per cent in other sectors. Trefler (2001) and Head and Reis (2003) findthat CUSFTA appeared to have a positive impact on trade flows. Krueger(1999, 2000) also documents a substantial increase in trade flows betweenCanada and the United States after NAFTA.
2.2 Changes in the nature of trade
Canada’s trade appears to have become more geared towards manufacturedgoods as a result of the boom in Canada-US trade linkages. The share ofmanufactures in total exports rose from less than 33 per cent in 1960 toroughly 63 per cent in 2001, with a correspondingly less prominent roleplayed by agriculture and fuels (Table 2). The share of manufacturingimports also increased from less than 70 per cent in 1960 to roughly 83 percent in 2001. Moreover, over the second half of the 1990s, Canada’s tradablesector seems to have evolved rapidly in the direction of high-tech-producingsectors. In particular, while it remains lower than in the United States,Canada’s ICT-producing sector has increased its share of aggregate GDPover this period (Table 3).
Recent research analyzes changes in the dynamics of sectoral trade flowsbetween the two countries. For example, Gu and Sawchuk (2001) study the

462 Cardarelli and Kose
contributions of various sectors to the increase in trade flows betweenCanada and the United States. They find that the two high-tech industries,i.e., electronic equipment and industrial machinery, along with the motorvehicle industry, accounted for half of the increase in Canada’s trade flowswith the United States during the period 1990–98. Their results also indicatethat the rapid growth of the two high-tech industries explained more than50 per cent of the increase, while the rest was attributable to the increasedtrade intensity in these industries. In addition, Gu and Sawchuk report thatalthough the contribution of the resource and resource-based industries was
Table 2Canada: Composition of trade(Share of total exports and imports, percentage)
Exports Imports
1960 1980 2001 1960 1980 2001
Manufactures 32.5 48.1 62.4 69.0 71.7 82.9Agriculture and food 36.5 23.4 13.0 16.2 9.6 7.0Fuel and ores 30.4 28.1 18.5 12.3 17.2 7.9
Source: World Bank, World Development Indicators.
Table 3Canada and the United States: Value-added, shares of total(Percentage)
Canada United States
1981–95 1995–2000 1981–95 1995–2000
Agriculture 3.2 2.5 2.3 1.8Mining 6.9 5.6 2.5 1.5Construction 8.5 6.9 5.3 5.3Manufacturing 24.0 25.1 22.4 19.5
of whichIndustrial machineries and 2.7 2.9 5.0 4.4
electrical and electronic equipmentTransportation 5.5 5.2 4.0 3.8Communications 3.9 3.7 3.1 3.1Utilities 4.5 4.5 3.2 2.6Trade 14.7 14.3 16.4 16.0FIRE 12.8 14.3 19.0 21.1Other services 15.9 18.0 21.9 25.3
Note: FIRE = finance, insurance, and real estate.Source: International Monetary Fund staff estimates.

Economic Integration, the Business Cycle, and Productivity in North America 463
relatively small compared with the growth of trade flows between the twocountries, these industries still accounted for roughly 20 per cent of theincrease in aggregate trade flows.6
Trade liberalization has also spurred cross-border vertical integration. Forexample, the share of Canada’s exports based on vertical trade—i.e., theshare of export value that is due to the processing of imports at an earlierstage of production—rose by twofold since the inception of CUSFTA(Figure 4d). Dion (1999–2000) finds that there has been a dramatic increasein vertical specialization across manufacturing industries, especially sincethe late 1980s (which coincides with the inception of CUSFTA). Hummels,Rapoport, and Yi (1998) conclude that the 1965 US-Canada Auto Pact led toa substantial increase in vertical trade in the auto industry.
Intra-industry trade between Canada and the United States has also risenover time. Intra-industry trade plays a major role in Canada’s trade with theUnited States, since it accounts for most of the trade in almost allindustries.7 After the inception of CUSFTA, the importance of intra-industrytrade between the two countries rose in several industries, including metalproducts, machinery, and motor vehicles. For example, the share of intra-industry trade rose from 62 per cent in 1990 to 67 per cent in 1998 inmachinery industry (Sawchuk and Sydor 2003). Recent research is unable toestablish a clear link between CUSFTA/NAFTA and the increase in intra-industry trade between the two countries during the 1990s (Trefler 2001;Acharya, Sharma, and Rao 2003).
2.3 Growth of financial flows
Trade liberalization has been associated with a significant increase inforeign direct investment (FDI) flows between Canada and the UnitedStates. Gross FDI flows increased by more than sevenfold between 1989 and2002, with similar increases in both directions (Figure 5a). The bulk of theFDI inflows to Canada came from the United States as the average share ofinflows from the United States accounted for 68 per cent of total inflowsover the period 1989–2002. A tremendous increase in FDI flows occurredafter the inception of NAFTA, associated with a small number of mega-
6. These industries include all primary industries and food, beverages, tobacco, leather,wood, paper and allied products, primary metal, non-metallic minerals, and refinedpetroleum.7. Schreyer (2001) documents that the extent of manufacturing intra-industry trade ofCanada has been high and relatively stable over time. Manufacturing intra-industry trade asa fraction of total manufacturing trade rose from 73.5 per cent over the period 1988–91 to76.2 per cent during 1996–2000.

464 Cardarelli and Kose
Figure 5aCanada-US FDI flows
Figure 5bCanada: FDI flows as a fraction of domestic investment
45
35
25
15
5
–51980 1984 1988 1992 19961982 1986 1990 1994 1998 2000 2002
Billion Can$ OutwardInward
50
40
30
20
10
01980 1984 1988 1992 19961982 1986 1990 1994 1998 2000 2002
Percentage FDI inflowsFDI outflows

Economic Integration, the Business Cycle, and Productivity in North America 465
mergers (DFAIT 2003).8 As a result, the average share of FDI inflows inCanada’s domestic gross fixed capital formation (investment) rose from6 per cent in the 1986–88 period to 26 per cent over the 2000–02 period(Figure 5b). However, recent research is unable to show that CUSFTA/NAFTA has had any discernible impact on FDI flows between the twocountries (Schwanen 1997; Globerman and Shapiro 2003).
3 Economic Integration andthe Dynamics of Business Cycles
3.1 A brief survey of the literature
In theory, increased trade linkages have ambiguous effects on the co-movement of business cycles. Stronger trade linkages can result in morehighly correlated business cycles by increasing demand- and supply-sidespillovers. Increased intra-industry specialization across countries can alsoincrease cyclical co-movement, if industry-specific shocks are important indriving business cycles. However, the degree of co-movement might fall ifinter-industry (rather than intra-industry) trade linkages are spurred andindustry-specific shocks are important in driving business cycles (Kose andYi 2001).
The effect of financial flows on business cycle correlations also depends onthe nature of shocks and specialization patterns. For example, strongerfinancial linkages could generate higher cross-country synchronization ofoutput by allowing easier spillovers of demand-side shocks. However,financial linkages could help facilitate investment and specialization ofproduction, thereby increasing countries’ exposure to industry- or country-specific shocks. This could lead to a decrease in the degree of outputcorrelations, while inducing stronger co-movement of consumption acrosscountries (Kalemli-Ozcan, Sørensen, and Yosha 2003).
These competing factors complicate evaluations of the impact of tradeagreements on Canada-US business cycles. The increase in verticalspecialization and intra-industry trade between Canada and the UnitedStates would typically be expected to strengthen business cycle linkagesover time. However, inter-industry trade and differences in industrialstructure are still considerable, implying that sector-specific shocks couldlead to divergence of cycles. For example, the fact that Canada experienceda shallower downturn and a relatively stronger recovery from the 2000
8. Although there was a significant increase in the volume of FDI flows from the UnitedStates to Canada in the period 1989–2002, the US share of Canadian FDI stock remainedquite stable at around 65 per cent.

466 Cardarelli and Kose
recession than the United States has often been ascribed to Canada’s smallerICT sector, as well as to the effects of a relatively depreciated exchange rateand the improvement in global commodity prices.
Recent empirical studies are inconclusive regarding the extent to whichbusiness cycles in the two countries have become more synchronized. Someof these studies argue that there has been an increase in the extent ofsynchronization of business cycles in Canada and the United States. Forexample, Kose, Prasad, and Terrones (2004) study cross-country corre-lations of business cycle fluctuations in several macroeconomic aggregatesof the G-7 countries over the three different periods: the Bretton Woods(BW) period of fixed exchange rates (1960Q1–1972Q4); the common-shocks period, during which the world economy was buffeted by severeshocks to oil prices and subsequent disinflation (1973Q1–1986Q2); and theglobalization period (1986Q3–2002Q4), which coincided with dramaticincreases in the volume of international trade and financial flows. Theyreport that correlations of output and consumption fluctuations in Canadaand the United States were higher in the globalization period than in the BWperiod. Kose, Otrok, and Whiteman (2003) and Stock and Watson (2003)find that the importance of global factors in explaining business cycles inboth countries has risen since the 1980s and conclude that business cyclelinkages between Canada and the United States have become stronger.
Others conclude that there has been no major change in the degree ofsynchronization of business cycles in the two countries. Doyle and Faust(2003) show that there has been no statistically significant change in thecorrelations of the growth rates of GDP of Canada and the United Statessince the 1960s, with similar results reported by Helbling and Bayoumi(2003). Heathcote and Perri (2003) show that the US business cycle hasbecome less correlated with the aggregate cycle of Europe, Canada, andJapan since the 1960s.
3.2 How did the free trade agreementschange the business cycle in Canada?
Inspection of simple correlations suggests an increase in the co-movementof business cycles in Canada and the United States. For example, an increaseis clearly evident in the 20-year rolling correlations in cyclical deviations ofCanada’s output, consumption, and investment and cyclical deviations in theUnited States, with a particularly sharp increase in the case of investmentand imports after the inception of CUSFTA (Figures 6 and 7). At the sametime, the Canadian and US business cycles have become less correlated withcycles in other G-3 countries (Germany and Japan).

Economic Integration, the Business Cycle, and Productivity in North America 467
Figure 6Canada and the United States: Co-movement of economic variables
Figure 7Canada and the United States: Co-movement of economic variables
0.9
0.8
0.7
0.6
0.5
0.41980 1984 1988 1992 19961982 1986 1990 1994 1998 2000 2002
20-year rolling correlations
OutputConsumptionInvestment (right scale)
0.5
0.4
0.3
0.2
0.1
0.0
1.0
0.8
0.6
0.4
0.2
0.0GDP InvestmentConsumption Exports Imports
Correlation coefficient 1960Q1–1988Q41989Q1–2002Q4

468 Cardarelli and Kose
While they are useful in describing some general patterns, simplecorrelations do not allow conclusive statements about the changes in thedegree of business cycle co-movement. First, cross-country correlations cap-ture only the contemporaneous co-movement in macroeconomic variables,and do not account for common fluctuations associated with “leads” and“lags.” Second, correlations can account for the degree of co-movement inonly a single macroeconomic variable. Moreover, correlations are nothelpful to analyze the relative importance of different types of factors and/orshocks in explaining business cycle co-movement.
A dynamic latent factor model is estimated to further analyze the sources ofthe apparent increase in convergence of business cycles in Canada and theUnited States. The model (employed in Kose, Otrok, and Whiteman 2003)allows estimation of the extent to which common or country-specific factorsexplain the changes in the co-movement, and also helps take into accountpotentially important contemporaneous, as well as temporal, covariationamong different macroeconomic variables.
The model focuses on the dynamic co-movement of output, consumption,and investment across Canada and the G-3 countries. It decomposes macro-economic fluctuations into (i) a “common” factor that is common across allvariables/countries; (ii) “country-specific” factors, which are commonacross the main aggregates within a country; and (iii) “idiosyncratic”factors, which are specific to total output, consumption, and investment(idiosyncratic errors). In particular, there are three types of factors in themodel: the common factor , four country-specific factors( , one per country), and 12 factors specific to each variable ( , the“unexplained” idiosyncratic errors). Observable variables are denoted by
, for , and t = 1960Q1–2002Q4. Thus, for observable i:
, (1)
where n denotes the country number. Output, consumption, and investmentdata for each of four countries are used as observables, so there are 12 timeseries to be “explained” by the five factors and 12 “regression” equations tobe estimated.
The estimated factors capture some of the major economic events since1960. In particular, casual observation suggests that the common factor hasbeen an important force behind most of the major business cycle episodes ofthe past 40 years. In particular, the behaviour of the common factor isconsistent with the steady expansionary period of the 1960s; the boom of the
f common( )f i
country εi t,
yi t, i 1 . . . ,12,=
yit ai bicommon
f tcommon
bicountry
f n t,country εi t,+ + +=
Eεi t, ε j t s–, 0= for i j≠

Economic Integration, the Business Cycle, and Productivity in North America 469
early 1970s; the recessions of the mid-1970s, the early 1980s, and the1990s; the expansionary period of the late 1980s; and the global downturn of2001–02 (Figure 8a). At the same time, the Canada-specific country factorwas also important in explaining some of Canada’s major cyclical episodes,including the recessions of 1982 and 1991, the economic slowdown in 2001,and the booms of the 1960s and the second half of the 1990s (Figure 8b).The estimated US country factor captures some of the National Bureau ofEconomic Research reference cycle dates including the recessions of 1970,1975, 1980, and 1982, and the booms of 1973, 1980, and 1981 (Figure 8c).Both the common and US country factors capture the highly synchronizedand severe downturn in 2000.
The importance of the common factor in driving business cycles is analyzedusing variance decompositions. To measure the relative contributions of thecommon, country, and idiosyncratic factors to variations in aggregatevariables in each country, the variance of each macroeconomic aggregate isdecomposed into the fraction that is due to each of the two factors and theidiosyncratic component in three different time periods. Specifically, thefraction of variance of each macroeconomic aggregate explained by thefollowing factors is computed: (i) a common factor that is common acrossall variables/countries; (ii) country-specific factors, which are commonacross the main aggregates within a country; and (iii) factors specific to eachvariable.
During the period 1960Q1–2002Q4, all three factors have played majorroles in accounting for business cycle fluctuations in Canada. Indeed, whilethe common factor has been important, it explains only about 10 per cent ofCanada’s output volatility, with the country and idiosyncratic factorsexplaining the bulk of the volatility for the period 1960Q1–2002Q4(Figure 9a). By contrast, the common factor is relatively more important inGermany and Japan, explaining more than 25 per cent of output volatility inJapan.
However, the common factor has played an increased role in explainingbusiness cycles in Canada and the United States since the early 1980s.Comparing estimates of the model calculated over two separate sub-periods—1960Q1–1981Q2 and 1981Q3–2002Q4—shows that the share ofCanada’s output variance explained by the common factor roughly tripled inthe later period (Figure 9b). Moreover, the share of investment due to thecommon factor rose by fourfold during the second period, and the role of thecommon factor in explaining consumption variance increased from less than5 per cent to roughly 40 per cent (Figures 9c and 9d). Although theimportance of the common factor also increased for the United States, theincrease was smaller than that for Canada.

470 Cardarelli and Kose
Figure 8aWorld factor
Figure 8bCanada: Country factor and GDP
Figure 8cUnited States: Country factor and GDP
3
2
1
0
1960 19681964 1972 1976
Growth rate (percentage)
–1
–2
–3
–41980 1984 1988 1992 1996 2000
5
4
3
2
1960 19681964 1972 1976
Growth rates (percentage)
1
0
–1
–2
1980 1984 1988 1992 1996 2000–3
Canada factorGDP
5
4
3
2
1960 19681964 1972 1976
Growth rates (percentage)
1
0
–1
–2
1980 1984 1988 1992 1996 2000–3
United States factorGDP

Economic Integration, the Business Cycle, and Productivity in North America 471
70
60
50
40
30
20
10
Canada United Germany Japan
Figure 9a
Fraction of variance (percentage)
CommonCountry
50
40
30
20
10
0Canada Unites Germany Japan
Figure 9b
Fraction of variance (percentage)
1960Q1–1981Q21981Q3–2002Q4
Variance of output explained
40
20
0Canada United Germany Japan
Figure 9cVariance of consumption explained
50
40
30
20
10
Canada United Japan
Figure 9d
1960Q1–1981Q21981Q3–2002Q4
Variance of investment explained
Variance of output explained
30
10
1960Q1–1981Q21981Q3–2002Q4
Fraction of variance (percentage)Fraction of variance (percentage)
0Germany
by each factor (1960Q1–2002Q4) by the common factor
by the common factor by the common factor
0
States
Idiosyncratic
States
States States

472 Cardarelli and Kose
Nonetheless, country-specific and idiosyncratic factors remain important inCanada. The country-specific factor still accounted for more than 10 percent of volatility of each variable in the second period, and the majority ofbusiness cycle variation is still attributed to the idiosyncratic factor(Table 4). The country-specific and idiosyncratic factors also explained over50 per cent of business cycle variation in the United States.
By contrast, the common factor became less important in explaining outputvolatility in Germany and Japan during the period 1981Q3–2002Q4. Thislikely reflects the relative importance of domestic forces that have swampedthe importance of increased trade and financial linkages during the past twodecades. The Japanese economy has been struggling with a variety ofstructural problems as it has suffered from a sharp fall in asset prices and asevere banking crisis since the early 1990s. The German economy has beenaffected by the aftershocks of unification during the same period. Inaddition, the share of trade with these two countries has decreased in bothCanada and the United States during the 1990s.
The important role played by country-specific and idiosyncratic factors inexplaining Canadian business cycles suggests that there are significantbenefits associated with exchange rate flexibility. This result is consistentwith the findings in some recent studies. For example, Murray, Schembri,and St-Amant (2003) document that Canada and the United States aresubjected to asymmetric shocks and a flexible exchange rate regime plays acritical role in insulating the Canadian economy from the adverse impact ofsuch shocks. Carr and Floyd (2002) also find that asymmetric real shocksaccount for a substantial fraction of exchange rate variation in Canada,suggesting that there are benefits from having a flexible regime. Arora andJeanne (2001) argue that exchange rate flexibility has not slowed the pace ofCanada-US economic integration and has been useful in isolating theCanadian economy from asymmetric external shocks.9
There have also been important changes in the dynamics of volatility ofbusiness cycles in Canada after the inception of CUSFTA. For example, thevolatility of business cycle fluctuations in Canada has become less volatileduring the 1990s (Figure 10). Debs (2001) finds that there was a structuralbreak in the volatility of Canadian real GDP growth in the first quarter of1991. The standard deviation of US real GDP growth has also declinedsignificantly since the mid-1980s, and this has been the case for the rest ofthe G-7, except for Japan, where output volatility has increased in the past
9. Murray (2000) and Bayoumi and Eichengreen (1994) also conclude that the flexibleexchange rate regime is beneficial to Canada. Lafrance and St-Amant (1999) provide areview of recent studies about optimal currency areas.

Economic Integration, the Business Cycle, and Productivity in North America 473
Figure 10Canada: Volatility of business cycles
Table 4Variance decompositions(Percentage)
Factors/ Output Consumption InvestmentPeriods 33% median 66% 33% median 66% 33% median 66%
Canada1960Q1–1981Q2Common 10.98 14.29 17.93 2.70 4.28 6.25 1.58 2.83 4.49Country 13.64 17.96 22.49 15.06 19.65 24.56 16.95 22.13 28.01Idiosyncratic 61.60 65.95 70.36 70.68 75.06 79.19 68.56 73.88 79.32
1981Q3–2002Q4Common 36.94 42.92 48.11 33.36 38.78 43.38 9.36 12.59 15.88Country 6.34 10.60 15.39 8.13 13.08 18.91 5.04 10.30 15.92Idiosyncratic 41.67 45.26 49.32 43.28 46.98 50.69 70.75 75.97 79.91
United States1960Q1–1981Q2Common 18.54 22.65 27.37 19.78 23.72 28.36 24.55 28.60 32.76Country 40.46 46.17 51.30 23.66 28.56 33.09 37.90 42.41 46.83Idiosyncratic 28.15 30.55 33.17 44.70 47.25 49.49 25.91 28.59 31.51
1981Q3–2002Q4Common 40.18 46.18 51.48 25.80 29.97 33.64 35.83 41.07 46.44Country 4.81 9.65 14.99 4.03 7.87 12.22 8.50 15.15 22.24Idiosyncratic 39.69 42.88 46.00 58.32 61.09 63.84 38.13 42.39 46.90
Note: 33 per cent and 66 per cent refer to the confidence intervals of the median.Source: International Monetary Fund staff calculations.
1.6
1.4
1.2
1.0
0.8
0.6
0.2GDP Consumption Services Investment Exports Imports
Standard deviation (percentage) 1961Q2–1988Q41989Q1–2002Q4
0.4
474 Cardarelli and Kose
decade. Explanations for the increased stability of Canadian and US outputhave centred on the increasing importance of the “new economy,” the de-clining importance of industrial versus service sector activity, the employmentof improved inventory management techniques, and increased effectivenessof monetary policy (Debs 2001; Blanchard and Simon 2001).
4 Economic Integration and Productivity
4.1 A brief survey of the literature
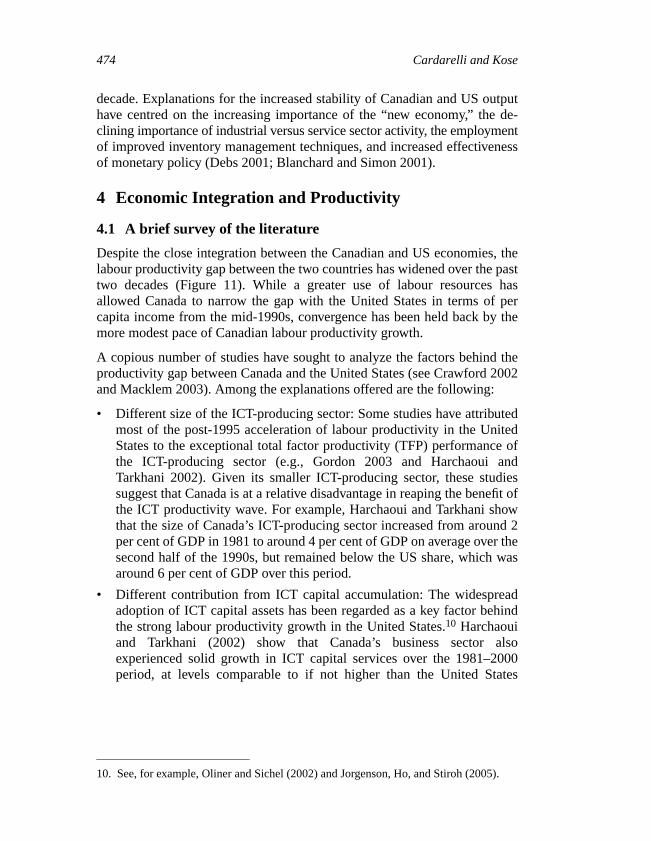
Despite the close integration between the Canadian and US economies, thelabour productivity gap between the two countries has widened over the pasttwo decades (Figure 11). While a greater use of labour resources hasallowed Canada to narrow the gap with the United States in terms of percapita income from the mid-1990s, convergence has been held back by themore modest pace of Canadian labour productivity growth.
A copious number of studies have sought to analyze the factors behind theproductivity gap between Canada and the United States (see Crawford 2002and Macklem 2003). Among the explanations offered are the following:
• Different size of the ICT-producing sector: Some studies have attributedmost of the post-1995 acceleration of labour productivity in the UnitedStates to the exceptional total factor productivity (TFP) performance ofthe ICT-producing sector (e.g., Gordon 2003 and Harchaoui andTarkhani 2002). Given its smaller ICT-producing sector, these studiessuggest that Canada is at a relative disadvantage in reaping the benefit ofthe ICT productivity wave. For example, Harchaoui and Tarkhani showthat the size of Canada’s ICT-producing sector increased from around 2per cent of GDP in 1981 to around 4 per cent of GDP on average over thesecond half of the 1990s, but remained below the US share, which wasaround 6 per cent of GDP over this period.
• Different contribution from ICT capital accumulation: The widespreadadoption of ICT capital assets has been regarded as a key factor behindthe strong labour productivity growth in the United States.10 Harchaouiand Tarkhani (2002) show that Canada’s business sector alsoexperienced solid growth in ICT capital services over the 1981–2000period, at levels comparable to if not higher than the United States
10. See, for example, Oliner and Sichel (2002) and Jorgenson, Ho, and Stiroh (2005).

Economic Integration, the Business Cycle, and Productivity in North America 475
(Table 5).11 Nonetheless, the contribution from ICT capital deepening tolabour productivity growth is generally estimated to be lower in Canadathan in the United States, mainly reflecting the lower estimated marginalproductivity of ICT capital and the lower ICT capital intensity inCanada.12
• Differences in the share and productivity performance of small andmedium-size enterprises (SMEs): In the Canadian manufacturing sector,SMEs (i.e., firms with less than 500 employees) accounted for 75 percent of total manufacturing employment, compared to around 60 per centin the United States in 1997. Not only has the weight of SMEs in theCanadian economy increased over the past two decades, but somestudies have found these firms to be less productive relative to their US
11. The faster growth in ICT capital services in Canada might be partly explained bydifferences in the capital-asset depreciation rates used by Statistics Canada and the Bureauof Labor Statistics. In particular, Statistics Canada uses higher depreciation rates for ICTassets, something that might lead to a faster growth of their capital services (see Ho, Rao,and Tang, 2003).12. See Khan and Santos (2002); Harchaoui and Tarkhani (2002); Armstrong et al. (2002);and Ho, Rao, and Tang (2003). Both Armstrong et al. and Harchaoui and Tarkhani find thatICT capital deepening has contributed around 1/4 per cent to the average annual labourproductivity growth in Canada over the 1995–2000 period, up only slightly compared to the1981–2000 period. The equivalent figure for the United States is estimated between 1/2 percent (Oliner and Sichel 2002) and 2/3 per cent (Jorgenson, Ho, and Stiroh 2005).
Figure 11United States and Canada: Income and productivity indicators
105
100
95
90
85
80
751976 1980 1984 1988 19921978 1982 1986 1990 1994 1996 1998 2000
United States = 100
2002
Labour utilizationPer capita incomeLabour productivity

476 Cardarelli and Kose
counterparts. For example, Baldwin and Tang (2003) show that around0.25 percentage point of the labour productivity gap in the manufac-turing sector in 1997 was due to the larger share of SMEs in Canadacompared to the United States, and 0.5 percentage point to the lowerproductivity of SMEs in Canada.
• Differences in the share and income of self-employed: The difference inlabour-productivity growth between Canada and the United States in the1990s has also been attributed to the faster growth of self-employment inCanada and the poorer income performance of this group compared withthe United States (Baldwin and Chowhan 2003).
Less relevant factors include:
• Differences in national accounts statistics: While differences remain, themethodology used by national statistical agencies to measure labour andTFP has been converging. In particular, both the US Bureau of LaborStatistics and Statistics Canada now use hedonic prices and includepurchase of computer software in the national account measures ofinvestment.
• Differences in the regulatory burden in labour and product markets: Gustand Marquez (2004) find that countries with a more burdensomeregulatory framework tend to have lower TFP growth. However,
Table 5Canada and the United States: ICT capital accumulation(Percentage)
1981–95 1995–2001
Canada United States Canada United States
Investment (average rate of growth)a
Computers 25.8 28.0 39.8 39.3Software 19.2 16.6 10.2 19.8Communications 4.5 4.8 17.9 12.2
Capital services (average rate of growth)b
All assets 3.0 3.4 4.3 5.4ICT 16.9 14.9 18.4 21.3Computers 27.1 23.9 32.9 41.8Software 14.5 15.0 7.2 16.4Communications 7.4 6.3 12.2 8.5
ICT share of capital incomeb 6.3 10.9 8.3 15.3
ICT share of capital stockc 3.9 7.0 6.4 11.7
a. Source: Haver Analytics.b. Source: Harchaoui and Tarkhani (2002).c. Sources: Armstrong et al. (2002) for Canada and the Bureau of Economic Analysisfor the United States.Note: Values are for 1981 and 2000.

Economic Integration, the Business Cycle, and Productivity in North America 477
notwithstanding the difficulties in building comparable indexes ofregulatory burden across countries, empirical evidence does not reveal alarge difference between Canada and the United States in terms of labourand product market legislation and institutions.13
The role of trade linkages and of different industrial structures in driving thelabour productivity gap is explored in this section by conducting level andgrowth accounting at a sectoral level. Using industry data allows assessing:i) whether the lack of aggregate convergence is masking significant variationin sectoral productivity dynamics; and ii) the extent to which the pro-ductivity differences between the two countries reflect differences in theirindustrial structure and/or in the performance of specific industries.
4.2 Sectoral growth accounting
The analysis below uses a traditional growth accounting framework. Thisapproach attributes labour productivity growth (value added per hoursworked, ) to the contribution of three factors: the improvement in labourquality , weighted by the labour income share of value added ;capital deepening (proxied by the flow of capital services per hours worked,
), weighted by the capital income share of value added ; and TFP(denoted by ):14
. (2)
Following Hall and Jones (1996), the log-TFP differential between Canadaand the United States for industry i is obtained by subtracting the weightedaverage of the log-difference in human and physical capital inputs from thelog-difference in value added:
, (3)
13. Based on the regulatory variables they use, Canada is lagging the United Statesaccording to the Organisation for Economic Co-operation and Development (OECD)employment protection legislation index, but is leading the United States according to theWorld Economic Forum’s regulatory burden index.14. The dot over the variables denotes percentage growth rates. For a more detaileddiscussion of the methodology, see Jorgenson, Ho, and Stiroh (2005).
ytHt( ) βt( )
kt α t( )At
yt α t kt βtH t At+ +=
TFPi t,Can
TFPi t,US
--------------------
lnyi t,
Can
yi t,US
----------- 1
2--- αk i t, ,
Can αk i t, ,US
+( )ki t,
Can
ki t,US
-----------
ln–ln=
12--- αh i t, ,
Can αh i t, ,US
+( )Hi t,
Can
Hi t,US
-------------
ln+

478 Cardarelli and Kose
where Canadian value added and capital stock are expressed in US dollarsusing industry-specific conversion rates derived from Lee and Tang(2001).15
Labour and capital inputs for both Canada and the United States are adjustedfor quality changes using the same methodology. In particular, labourquality (Ht) is the difference between the growth of hours worked and thegrowth of labour input, obtained by weighting the hours of different types oflabour (in terms of educational attainment, age, and gender) by theirmarginal productivity (proxied by their relative compensation). Similarly,capital services are obtained by weighting the growth rates of differentcapital assets, using their estimated marginal productivity (proxied by rentalprices) as weights. Within this framework, the estimates of labour andcapital inputs capture the effect of substituting towards inputs with a highermarginal productivity (e.g., ICT capital and higher educated labour). In turn,this allows the estimates of TFP to better proxy the impact of technical andorganizational changes on productivity.
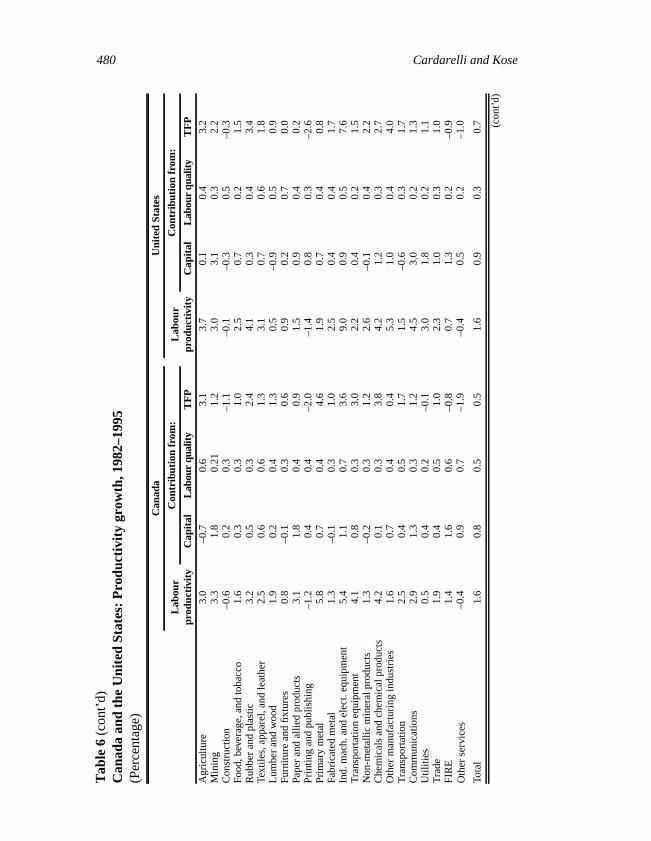
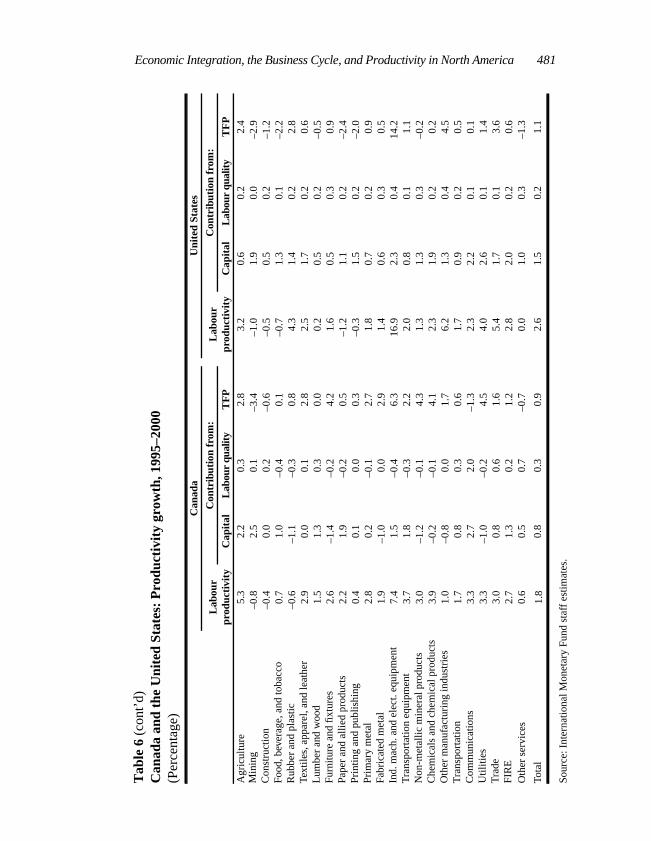
Table 6 shows Canadian and US industries’ average labour productivitygrowth, and the contribution from the three proximate causes. The resultsare shown separately for the period 1982–2000, as well as the pre- and post-1995 period. The table also shows average labour productivity growth forthe entire business sector, aggregated over the 23 sectors considered.16
There are two major results:
• Canadian aggregate labour productivity grew by an average annual 0.3percentage point less than in the United States over the whole period, butthe gap in growth rates widened to an average 0.8 percentage point in thepost-1995 period. These estimates are broadly consistent with the
15. Lee and Tang (2001) estimated relative Canada-US TFP levels for 1993. As the realGDP and capital stock data in equation (3) are expressed in 1996 (Fisher-chain-weighted)dollars, the Lee and Tang industry conversion rates are updated to 1996 using growth dif-ferentials in industries’ value-added deflators.16. Consistent with Schreyer (2001), total labour productivity growth is obtained as theweighted average of labour productivities across industries using value-added shares asweights, plus a reallocation term that reflects the economy’s ability to move labourresources to those sectors with a higher-than-average level of labour productivity. Giventhat aggregate TFP and contributions from labour quality and capital deepening areobtained as weighted averages of industries figures using value-added shares as weights,their sum is different than total labour productivity, the difference being the reallocationfactor.

Economic Integration, the Business Cycle, and Productivity in North America 479
Tab
le 6
Can
ada
and
the
Uni
ted
Stat
es:
Pro
duct
ivit
y gr
owth
, 198
2–20
00(P
erce
ntag
e)
Can
ada
Uni
ted
Stat
es
Lab
our
prod
ucti
vity
Con
trib
utio
n fr
om:
Lab
our
prod
ucti
vity
Con
trib
utio
n fr
om:
Cap
ital
Lab
our
qual
ityT
FP
Cap
ital
Lab
our
qual
ityT
FP
Agr
icul
ture
3.7
0.1
0.5
3.1
4.3
0.3
0.3
3.7
Min
ing
2.2
2.1
0.2
–0.1
1.8
2.9
0.2
–1.3
Con
stru
ctio
n–0
.60.
10.
3–1
.0–0
.1–0
.10.
4–0
.4Fo
od, b
ever
age,
and
toba
cco
1.3
0.5
0.1
0.7
0.6
0.9
0.2
–0.5
Rub
ber
and
plas
tic2.
20.
00.
12.
14.
30.
60.
33.
3Te
xtile
s, a
ppar
el, a
nd le
athe
r2.
50.
50.
51.
53.
01.
00.
51.
5L
umbe
r an
d w
ood
2.0
0.3
0.4
1.3
0.1
–0.6
0.4
0.2
Furn
iture
and
fixt
ures
1.3
–0.5
0.2
1.7
1.0
0.3
0.6
0.2
Pape
r an
d al
lied
prod
ucts
3.2
1.9
0.2
1.1
1.5
1.0
0.3
0.2
Prin
ting
and
publ
ishi
ng–0
.70.
30.
3–1
.3–1
.01.
10.
3–2
.3Pr
imar
y m
etal
5.2
0.7
0.3
4.3
2.1
0.7
0.4
1.0
Fabr
icat
ed m
etal
1.5
–0.4
0.2
1.6
2.2
0.4
0.4
1.3
Ind.
mac
h. a
nd e
lect
. equ
ipm
ent
5.8
1.3
0.3
4.2
11.0
1.3
0.5
9.2
Tra
nspo
rtat
ion
equi
pmen
t4.
21.
10.
13.
02.
20.
50.
21.
5N
on-m
etal
lic m
iner
al p
rodu
cts
2.2
–0.4
0.2
2.4
2.2
0.3
0.4
1.5
Che
mic
als
and
chem
ical
pro
duct
s4.
10.
10.
23.
83.
71.
40.
32.
0O
ther
man
ufac
turi
ng in
dust
ries
1.4
0.4
0.3
0.7
5.7
1.1
0.4
4.2
Tra
nspo
rtat
ion
2.3
0.5
0.4
1.4
1.7
–0.1
0.3
1.5
Com
mun
icat
ions
3.1
1.8
0.8
0.5
3.9
2.8
0.2
0.9
Util
ities
1.3
0.1
0.1
1.1
3.1
2.0
0.1
0.9
Tra
de2.
40.
50.
51.
33.
51.
20.
22.
0FI
RE
1.7
1.5
0.5
–0.3
1.2
1.5
0.2
–0.5
Oth
er s
ervi
ces
–0.2
0.8
0.7
–1.7
–0.2
0.6
0.2
–1.1
Tota
l1.
60.
80.
40.
61.
91.
10.
30.
8 (con
t’d)
480 Cardarelli and Kose
Tab
le 6
(con
t’d)
Can
ada
and
the
Uni
ted
Stat
es:
Pro
duct
ivit
y gr
owth
, 198
2–19
95(P
erce
ntag
e)
Can
ada
Uni
ted
Stat
es
Lab
our
prod
ucti
vity
Con
trib
utio
n fr
om:
Lab
our
prod
ucti
vity
Con
trib
utio
n fr
om:
Cap
ital
Lab
our
qual
ityT
FP
Cap
ital
Lab
our
qual
ityT
FP
Agr
icul
ture
3.0
–0.7
0.6
3.1
3.7
0.1
0.4
3.2
Min
ing
3.3
1.8
0.21
1.2
3.0
3.1
0.3
2.2
Con
stru
ctio
n–0
.60.
20.
3–1
.1–0
.1–0
.30.
5–0
.3Fo
od, b
ever
age,
and
toba
cco
1.6
0.3
0.3
1.0
2.5
0.7
0.2
1.5
Rub
ber
and
plas
tic3.
20.
50.
32.
44.
10.
30.
43.
4Te
xtile
s, a
ppar
el, a
nd le
athe
r2.
50.
60.
61.
33.
10.
70.
61.
8L
umbe
r an
d w
ood
1.9
0.2
0.4
1.3
0.5
–0.9
0.5
0.9
Furn
iture
and
fixt
ures
0.8
–0.1
0.3
0.6
0.9
0.2
0.7
0.0
Pape
r an
d al
lied
prod
ucts
3.1
1.8
0.4
0.9
1.5
0.9
0.4
0.2
Prin
ting
and
publ
ishi
ng–1
.20.
40.
4–2
.0–1
.40.
80.
3–2
.6Pr
imar
y m
etal
5.8
0.7
0.4
4.6
1.9
0.7
0.4
0.8
Fabr
icat
ed m
etal
1.3
–0.1
0.3
1.0
2.5
0.4
0.4
1.7
Ind.
mac
h. a
nd e
lect
. equ
ipm
ent
5.4
1.1
0.7
3.6
9.0
0.9
0.5
7.6
Tra
nspo
rtat
ion
equi
pmen
t4.
10.
80.
33.
02.
20.
40.
21.
5N
on-m
etal
lic m
iner
al p
rodu
cts
1.3
–0.2
0.3
1.2
2.6
–0.1
0.4
2.2
Che
mic
als
and
chem
ical
pro
duct
s4.
20.
10.
33.
84.
21.
20.
32.
7O
ther
man
ufac
turi
ng in
dust
ries
1.6
0.7
0.4
0.4
5.3
1.0
0.4
4.0
Tra
nspo
rtat
ion
2.5
0.4
0.5
1.7
1.5
–0.6
0.3
1.7
Com
mun
icat
ions
2.9
1.3
0.3
1.2
4.5
3.0
0.2
1.3
Util
ities
0.5
0.4
0.2
–0.1
3.0
1.8
0.2
1.1
Tra
de1.
90.
40.
51.
02.
31.
00.
31.
0FI
RE
1.4
1.6
0.6
–0.8
0.7
1.3
0.2
–0.9
Oth
er s
ervi
ces
–0.4
0.9
0.7
–1.9
–0.4
0.5
0.2
–1.0
Tota
l1.
60.
80.
50.
51.
60.
90.
30.
7 (con
t’d)
Economic Integration, the Business Cycle, and Productivity in North America 481
Tab
le 6
(con
t’d)
Can
ada
and
the
Uni
ted
Stat
es:
Pro
duct
ivit
y gr
owth
, 199
5–20
00(P
erce
ntag
e)
Can
ada
Uni
ted
Stat
es
Lab
our
prod
ucti
vity
Con
trib
utio
n fr
om:
Lab
our
prod
ucti
vity
Con
trib
utio
n fr
om:
Cap
ital
Lab
our
qual
ityT
FP
Cap
ital
Lab
our
qual
ityT
FP
Agr
icul
ture
5.3
2.2
0.3
2.8
3.2
0.6
0.2
2.4
Min
ing
–0.8
2.5
0.1
–3.4
–1.0
1.9
0.0
–2.9
Con
stru
ctio
n–0
.40.
00.
2–0
.6–0
.50.
50.
2–1
.2Fo
od, b
ever
age,
and
toba
cco
0.7
1.0
–0.4
0.1
–0.7
1.3
0.1
–2.2
Rub
ber
and
plas
tic–0
.6–1
.1–0
.30.
84.
31.
40.
22.
8Te
xtile
s, a
ppar
el, a
nd le
athe
r2.
90.
00.
12.
82.
51.
70.
20.
6L
umbe
r an
d w
ood
1.5
1.3
0.3
0.0
0.2
0.5
0.2
–0.5
Furn
iture
and
fixt
ures
2.6
–1.4
–0.2
4.2
1.6
0.5
0.3
0.9
Pape
r an
d al
lied
prod
ucts
2.2
1.9
–0.2
0.5
–1.2
1.1
0.2
–2.4
Prin
ting
and
publ
ishi
ng0.
40.
10.
00.
3–0
.31.
50.
2–2
.0Pr
imar
y m
etal
2.8
0.2
–0.1
2.7
1.8
0.7
0.2
0.9
Fabr
icat
ed m
etal
1.9
–1.0
0.0
2.9
1.4
0.6
0.3
0.5
Ind.
mac
h. a
nd e
lect
. equ
ipm
ent
7.4
1.5
–0.4
6.3
16.9
2.3
0.4
14.2
Tra
nspo
rtat
ion
equi
pmen
t3.
71.
8–0
.32.
22.
00.
80.
11.
1N
on-m
etal
lic m
iner
al p
rodu
cts
3.0
–1.2
–0.1
4.3
1.3
1.3
0.3
–0.2
Che
mic
als
and
chem
ical
pro
duct
s3.
9–0
.2–0
.14.
12.
31.
90.
20.
2O
ther
man
ufac
turi
ng in
dust
ries
1.0
–0.8
0.0
1.7
6.2
1.3
0.4
4.5
Tra
nspo
rtat
ion
1.7
0.8
0.3
0.6
1.7
0.9
0.2
0.5
Com
mun
icat
ions
3.3
2.7
2.0
–1.3
2.3
2.2
0.1
0.1
Util
ities
3.3
–1.0
–0.2
4.5
4.0
2.6
0.1
1.4
Tra
de3.
00.
80.
61.
65.
41.
70.
13.
6FI
RE
2.7
1.3
0.2
1.2
2.8
2.0
0.2
0.6
Oth
er s
ervi
ces
0.6
0.5
0.7
–0.7
0.0
1.0
0.3
–1.3
Tota
l1.
80.
80.
30.
92.
61.
50.
21.
1
Sour
ce: I
nter
natio
nal M
onet
ary
Fund
sta
ff e
stim
ates
.

482 Cardarelli and Kose
estimates obtained by conducting growth accounting at an aggregatelevel (Macklem 2003).17
• In the post-1995 period, the labour productivity gap between the twocountries widened not only in the ICT-producing sector, but also insectors that intensively used ICT capital.18 Canada’s non-ICT-producingmanufacturing industries appear to have performed as well as, if notbetter than, their US counterparts. However, a gap emerged in sectorsthat have been most intensively using new technologies, such as the tradeand FIRE (financial, insurance, and real estate) sectors. In particular,labour productivity growth in Canada’s trade sector was well below thatin the United States, reflecting shortfalls in both TFP and capitaldeepening. A gap also opened in the FIRE sector, reflecting a smallercontribution of capital deepening than in the United States.
4.3 How did the free trade agreementsaffect productivity growth in Canada?
The persistence of the labour productivity gap in the face of the dramaticincrease in trade linkages between Canada and the United States has puzzledmany observers.19 Recent studies in growth literature have highlighted avariety of mechanisms through which increased trade would affectproductivity growth. In particular, trade would facilitate the transfer ofknowledge, increase scale and specialization, and, by increasing exposure tocompetition, induce a reallocation of resources from less to more efficientfirms within industries. At the same time, traditional trade theories, asembodied in a Heckscher-Ohlin framework, predict a reallocation ofresources towards sectors where a country has comparative advantage. Tothe extent that Canada’s comparative advantage lies in sectors less exposedto the dynamic gains from trade, such as the natural resource and resource-based manufacturing sectors, the inter-industry resource reallocationinduced by trade may have hindered the productivity gap with the UnitedStates from closing (Jackson 2003a).
The fact that Canadian trade has increased mainly in two-way trade insimilar products suggests that Canadian firms are likely to have benefitedgreatly from the dynamic gains of trade. To assess this hypothesis, average
17. Recent data revisions by Statistics Canada suggest that the aggregate labour produc-tivity growth gap between Canada and the United States in the 1995–2000 period has beensmaller, about 1/2 per cent, than what is suggested by the data used in this paper.18. The ICT-producing sector is proxied by the industrial machinery and electrical andelectronic product sectors.19. See the exchange of ideas between McCallum (1999) and Jackson (1999) on the occa-sion of the 10th anniversary of NAFTA.

Economic Integration, the Business Cycle, and Productivity in North America 483
Canadian industry TFP growth is plotted against (i) the degree of verticalspecialization, and (ii) the degree of trade exposure of Canadian sectors.20
Figure 12 shows that the average TFP growth is positively correlated withboth measures of openness to trade, and the extent of the correlation hasincreased since the inception of the free trade agreements with the UnitedStates. In particular, the ICT-producing and transportation equipment sectorsseem to have benefited most from exposure to trade and intra-industry spe-cialization over this period.
Moreover, the free trade agreements seem to have contributed to conver-gence in TFP between the two countries. To assess the impact of theagreements on the TFP convergence between Canada and the United States,an autoregressive model is estimated; it contains both industry and time-specific effects and a structural change in the autoregressive coefficient:21
, (4)
where i is the index for industries , t is the index for time, is the log-TFP differential between Canada
and the United States for industry i derived from equation (2), andis a dummy that controls for the impact of CUSFTA (from 1990). Table 7reports the results from the Arellano and Bond (1991) generalized methodof moments (GMM) applied to equation (3) in first differences.22 Theestimated value of is significantly less than 1, suggesting convergence inTFP levels between Canada and the United States over the periodconsidered. Furthermore, the estimated negative value of (significant at a
20. The degree of vertical specialization measures the extent to which an industry’s tradeis accounted for by inputs that are imported and embodied in exports. The degree of tradeexposure is the algebraic sum of three different indicators: (i) the share of an industry’sexports in its gross output (capturing its degree of export orientation); (ii) the share of anindustry’s imported intermediate inputs in its gross output (capturing the exposure of anindustry on the cost side); and (iii) the share of an industry’s competing imports in thedomestic markets for its core products (measuring the exposure to foreign penetration ofthe domestic market). Both indexes of openness to trade are from Dion (1999–2000). Thedata, originally up to 1996, have been extrapolated to 2000.21. Easterly, Fiess, and Lederman (2003) adopt this methodology to assess the impact ofNAFTA on the Mexico-US productivity convergence.22. As is well known, the presence of a lagged dependent variable in a fixed-effect modelgenerates biased ordinary least squares estimates. The Arellano-Bond technique allows toobtain unbiased and consistent estimates by moving to a specification in first differencesand instrumenting the lagged changes of the dependent variables with its lagged ( andearlier) levels.
TFPi t,Can US– βTFPi t 1–,
Can US– γDCUSFTA+=
δDCUSFTA*TFPi t 1–,Can US– α i λ t εi t,+ + + +
i 1. . . 23=( )t 1 . . . 20=( ) TFPi t,
Can US–
DCUSFTA
t 2–
β
δ

484 Cardarelli and Kose
9
7
5
4
1
Vertical integration
8
6
3
2
0
–1
TFP
gro
wth
0.0 0.1 0.2 0.3 0.4 0.5 0.6
Elect.products
Ind.mach.
Otherman.
Min.
Paper
Food
Constr.Lum.
Util.
Text.
Rub.
Print.
Furn.Prim. Met.Chem.
Agr.
Non-Transp.equip.
Fittedline
Fittedline
Transp.
Fab.
8
7
6
5
4
3
2
Figure 12a
Average 1981–2000
9
8
7
6
5
4
3
Figure 12b
Average 1990–2000
Trade exposure and TFP growth
8
6
4
3
0
Vertical integration
Figure 12c
Average 1981–2000
Vertical integration and TFP growthFigure 12d
Average 1990–2000
Vertical integration and TFP growth
Trade exposure and TFP growth
2
7
5
%%
%
1
0
–2
–1–0.2 0.0 0.2 0.4 0.6 0.8 1.0 1.2 1.4
TFP
gro
wth
Trade exposure
Elect.products
Prim. Met.
Chem.
Agr. Transp.equip.
Ind.Otherman.
Min.
Non-metallicmin.
Transp.Fab. met.
Rub. & plast.Furn.Text.
Lum.Util.Food
Paper
Constr.Print.
Fittedline
Fittedline
%
mach.1
0
–1
–2
–0.2 0.0 0.2 0.4 0.6 0.8 1.0 1.2 1.4
Elect.products
Chem. Prim. Met.Agr.
Furn.
Rub. & plast.
Util. Non-metallicmin.
Transp.equip.
PaperFab. met. Text.
FoodTransp.
Otherman.
Ind.mach.
Min.Lum.
Print.Constr.
Fittedline
Fittedline
Trade exposure
TFP
gro
wth
2
1
–1
–2
TFP
gro
wth
0.0 0.1 0.2 0.3 0.4 0.5 0.6
Elect.products
Ind.mach.Other
man.Min.
PaperFood
Constr.
Lum.Util.
Text.
Rub. & plast.
Print.
Furn.
Prim. Met.
Chem.
Agr.
Non-metallicmin.
Transp.equip.
Fittedline
Fittedline
Transp. Fab. met.
–2
& plast.met.min.
metallic

Economic Integration, the Business Cycle, and Productivity in North America 485
10 per cent level) indicates that the rate of convergence has increased in the1990s after the Canada-US free trade agreement. The role of trade is con-firmed by the fact that convergence has been even faster in the manufac-turing sector, as shown by the lower coefficients in the second column.
These results are consistent with those of other papers about the impact onproductivity of increased trade linkages between Canada and the UnitedStates. For example, examining the impact of CUSFTA on productivity inthe manufacturing sector, Sawchuk and Trefler (2002) find that, over the1989–95 period, tariff cuts raised labour productivity by 3.25 per cent peryear in the most affected industries, and by 0.5 per cent per year in theoverall manufacturing sector. On the other hand, empirical research hasfailed to identify a positive link between trade specialization and TFPgrowth in Canada (Harris and Kherfi 2000) and noticed that the speciali-zation of Canada’s manufacturing sector has hardly changed under the freetrade agreement (Head and Reis 2003).
4.4 The impact of industrial structure on the aggregate labourproductivity gap
The evidence thus far suggests that factors other than trade linkages with theUnited States have likely been at work in driving the Canada-US labourproductivity gap. Conducting growth accounting at a sectoral level allowsfor quantifying the role played by the differences in industrial structuresbetween the two economies. This is done by decomposing the aggregate
Table 7Estimation of TFP convergence equationa
All sectors Manufacturing
TFPCan-US (–1) 0.79 0.69(0.00) (0.00)
DCUSFTA*TFPCan-US (–1) –0.06 –0.11(0.09) (0.14)
DCUSFTA –0.04 –0.06(0.00) (0.00)
No. of observations 414 252
Sargan test (p-value) 0.74 0.34AR(2) test (p-value) 0.59 0.21
Notes:a. Dependent variable: log-TFP differential (Canada minus United States).Yearly data, covering 23 industries for the period 1982–2000.Year dummies are not reported. Numbers in parentheses are p-values, based on heteroscedasticrobust standard errors.

486 Cardarelli and Kose
labour productivity growth gap between Canada and the United States intothree components, which correspond to the three terms on the right-handside of equation (5):
• a “direct” effect, which reflects the contribution from industry i’sdifferent labour productivity growth performance, weighted by itsaverage value-added share ;
• a “structural” effect, which reflects the contribution from the industry i’sdifferent relative size across the two countries, weighted by its averagelabour productivity growth;
• and a “reallocation factor,” which reflects the different ability of the twoeconomies to direct labour resources (hours worked, ) towards sectorswith a value-added share that exceeds the labour compensation share
(that is, towards sectors with a higher-than-average labour produc-tivity level):23
. (5)
This decomposition shows that a significant part of the widening labourproductivity gap between Canada and the United States over the post-1995period is explained by structural differences between the two economies.Table 8 shows that the negative contribution from the “direct” effect hasincreased slightly over the two periods, whereas the other two effects have
23. See Faruqui et al. (2003) for a similar decomposition formula. Their conclusion is thatmost of the business sector labour productivity growth gap between Canada and the UnitedStates in the 1987–2000 period is explained by the direct effect. Moreover, the manufac-turing sector is the main contributor to the aggregate gap in the post-1996 period, while theservice sector is more relevant in the period 1987–96. However, these results are obtainedat a rather coarse level of disaggregation (four large sectors are identified, namely, primary,manufacturing, construction, and services), something that (as admitted by the sameauthors) might conceal the contribution from the structural and reallocation effects.
vai( )
hi
lsi( )
yCan yUS–vai Can, vai US,+
2----------------------------------------
yi Can, yi US,–( )i∑=
yi Can, yi US,+
2---------------------------------
vai Can, vai US,–( )i∑+
vai Can, lsi Can,–( )i∑ hi Can,+
vai US, lsi US,–( )hi US,i∑–
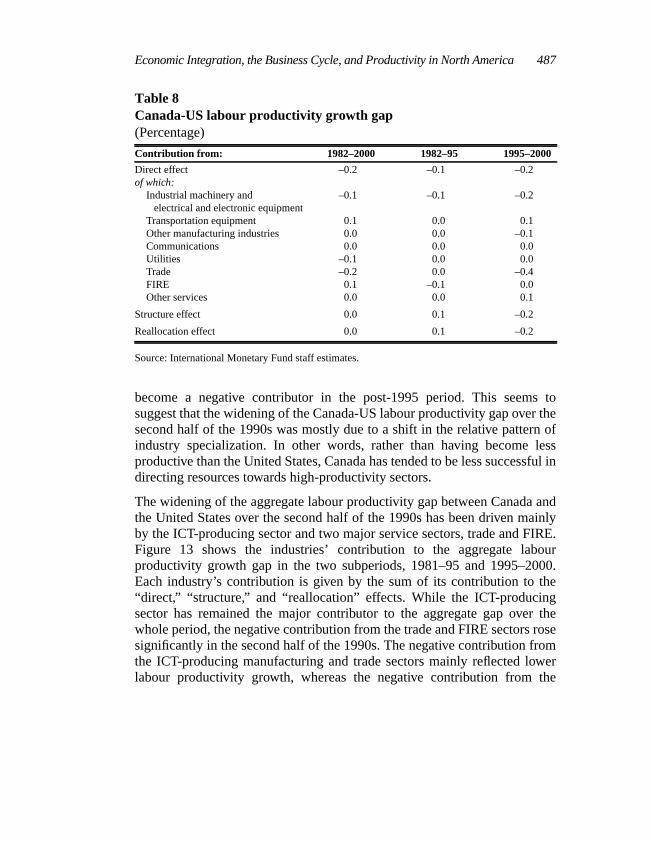
Economic Integration, the Business Cycle, and Productivity in North America 487
become a negative contributor in the post-1995 period. This seems tosuggest that the widening of the Canada-US labour productivity gap over thesecond half of the 1990s was mostly due to a shift in the relative pattern ofindustry specialization. In other words, rather than having become lessproductive than the United States, Canada has tended to be less successful indirecting resources towards high-productivity sectors.
The widening of the aggregate labour productivity gap between Canada andthe United States over the second half of the 1990s has been driven mainlyby the ICT-producing sector and two major service sectors, trade and FIRE.Figure 13 shows the industries’ contribution to the aggregate labourproductivity growth gap in the two subperiods, 1981–95 and 1995–2000.Each industry’s contribution is given by the sum of its contribution to the“direct,” “structure,” and “reallocation” effects. While the ICT-producingsector has remained the major contributor to the aggregate gap over thewhole period, the negative contribution from the trade and FIRE sectors rosesignificantly in the second half of the 1990s. The negative contribution fromthe ICT-producing manufacturing and trade sectors mainly reflected lowerlabour productivity growth, whereas the negative contribution from the
Table 8Canada-US labour productivity growth gap(Percentage)
Contribution from: 1982–2000 1982–95 1995–2000
Direct effect –0.2 –0.1 –0.2of which:
Industrial machinery andelectrical and electronic equipment
–0.1 –0.1 –0.2
Transportation equipment 0.1 0.0 0.1Other manufacturing industries 0.0 0.0 –0.1Communications 0.0 0.0 0.0Utilities –0.1 0.0 0.0Trade –0.2 0.0 –0.4FIRE 0.1 –0.1 0.0Other services 0.0 0.0 0.1
Structure effect 0.0 0.1 –0.2
Reallocation effect 0.0 0.1 –0.2
Source: International Monetary Fund staff estimates.

488 Cardarelli and Kose
Figure 13Sectoral contributions to the Canada-USaggregate labour productivity growth gap(Percentage)
–0.006 –0.003 0 0.003
1981–95
MiningOther services
Primary metalsTransportation
Transportation equipmentPaperLumber
ConstructionPrinting
FurnitureAgriculture
Rubber & plasticFood
Non-metallic mineralTextiles
ChemicalsUtilities
CommunicationsFabricated metal
FIREOther manufacturing
TradeMachinery & electronics
–0.006 –0.003 0 0.003
Other servicesTransportation equipment
UtilitiesAgriculture
PaperLumber
Primary metalsFood
TransportationMining
Non-metallic mineralChemicalsFabricated metalPrintingFurniture
TextilesConstruction
CommunicationsRubber & plastic
Other manufacturingFIRE
TradeMachinery &
1995–2000
electronics
Economic Integration, the Business Cycle, and Productivity in North America 489
FIRE sector was largely the result of the lower relative size of the sector inCanada.24
Conclusion
The results above illustrate that while free trade has helped promote theintegration of the US and Canadian economies, significant differencesremain. Business cycles in Canada and the United States have certainlybecome more synchronized, and the importance of common factors inexplaining business cycles in the two countries has increased, likelyreflecting the significant increase in trade based on vertical specialization.Nonetheless, significant structural differences between the two economiesremain evident. Primary goods still account for more than 30 per cent ofCanada’s total exports, and the analysis above shows that country-specificand idiosyncratic factors remain very important in explaining the Canadianbusiness cycle.
The continued importance of country-specific and idiosyncratic factors indriving business cycles in Canada also confirms the benefits of exchangerate flexibility. Although there remain those in Canada who argue in favourof a Canada-US monetary union, the significant differences in industrialstructure and composition of trade between the two countries suggest thatthere could be important costs to Canada from giving up its ability to in-sulate itself from country-specific and other shocks.
The paper also shows that the widening labour productivity gap between thetwo economies over the 1990s is a reflection of the differences in theindustrial structure of the two countries. Industry growth accounting showsthat Canada has done as well, if not better, than the United States in many(non–ICT-producing) manufacturing sectors, while it has lagged in someindustries that have been intensively using ICT capital, especially in theservice sector. In this paper, the industries’ contribution to the aggregatelabour productivity gap is weighted through their relative value-addedshares, and it also reflects the economy’s ability to reallocate resources fromless productive to more productive sectors. From this perspective, the UnitedStates has been able to take a much larger benefit from the dramatic
24. The comparison between the trade sectors in the two countries may be blurred by thefact that eating and drinking places are included in the US trade sector, while they are partof the “other service” sector for Canada (as they are in the “accommodation, food, andbeverage” sector). However, the results do not change substantially when the Canadiantrade sector is adjusted to include that fraction of the “accommodation, food, and beverage”sector that can be attributed to eating and drinking places.

490 Cardarelli and Kose
acceleration of labour productivity growth in the service sectors, owing tothe larger share of these sectors in their economy compared to Canada.
The negative impact from the difference in industry specialization betweenthe two countries does not seem to be related to the increased tradeintegration of Canada over the 1990s. Much of the increased trade occurredwithin industries, as shown by the increased degree of vertical specializationof many Canadian sectors (in particular, transport equipment and ICT-producing sectors). This has allowed Canadian firms to benefit fromeconomies of scale and technology transfers, which appear to havecontributed positively to their TFP performance over the past decades.
These findings suggest that there could be gains from further steps to deepeneconomic linkages. The CUSFTA/NAFTA experience illustrates the sig-nificant benefits accruing to both countries from free trade, but importantbarriers remain. For example, differences in regulatory frameworks impedetrade and investment flows; security concerns, which have become criticallyimportant during the past two years, slow cross-border flows of goods; andrules-of-origin requirements also restrict trade flows (McMahon, Curtis, andAdegoke 2003). Recent research suggests that the removal of rules-of-originrequirements and the harmonization of most favoured nation (MFN)tariffs—which is under discussion among the NAFTA partners—couldboost NAFTA’s GDP by as much as 2 to 3 per cent (Policy ResearchInitiative 2003).25
25. NAFTA partners have recently decided to establish study groups to analyze avenues forharmonization of MFN tariffs and rules-of-origin requirements, and to improve rulesgoverning investment flows. In addition, recognizing the importance of secure andcontinuous access to each other’s markets, Canada and the United States have recentlyplaced an emphasis on border security. For example, a Smart Border Action Plan has beenimplemented, which includes a Free and Secure Trade (FAST) program to harmonizeprocedures for clearing cross-border shipments. For an extensive discussion of the impactof rules-of-origin requirements, see Estevadeordal and Suominen (2004). Mirus andHoffman (2004) and Ghosh and Rao (2004) argue that there are large gains associated withthe harmonization of MFN tariffs and the liberalization of NAFTA’s rules of origin.

Economic Integration, the Business Cycle, and Productivity in North America 491
Appendix 1Data Sources
Data for Canada
Real (chain-Fisher-weighted) value added, hours worked, labour input, andcapital services data were obtained from Statistics Canada and were basedon a SIC-80 industry classification.
For the manufacturing sectors, however, the data ended in 1997. They wereextrapolated to 2000 using the growth rates from the KLEMS input andoutput database, which follows the North American Industry ClassificationSystem (starting from 1997).
Comparing the 1997 industries’ value added based on the two industryclassifications shows that the difference is generally around 15 per cent,except for “other manufacturing sector” and “furniture and fixture,” forwhich the difference is around 30 per cent. The results for these sectorsshould then be interpreted with greater caution than others.
Data for the United States
Industry data for the United States follow the US SIC-87 industryclassification.
Real (chain-Fisher-weighted) value-added industry data for the UnitedStates were obtained from Bureau of Economic Analysis’s “gross productoriginating” (GPO) by industry. As these figures are on a market-price basis,value-added data at basic prices were obtained by subtracting the indirectbusiness tax and non-tax liability from GPO.
GDP by industry is obtained from industries’ components of domesticincome which, as is well known, tend to fall short of GDP measured on anexpenditure basis. The difference is named “statistical discrepancy,” and isattributed to the industries based on their share of total GDP.
Hours worked, labour input, and capital services were obtained fromJorgenson, Ho, and Stiroh (2005) and are based on methodologies that arelargely comparable with those adopted by Statistics Canada.
Industry classification
To obtain the same level of industry classification for the two countries, anumber of subsectors were aggregated into larger sectors. As an example, a“mining” sector was obtained for the United States by aggregating foursubsectors (namely, metal mining, coal mining, petroleum and gas, and non-metallic mining).

492 Cardarelli and Kose
The aggregation was also needed to obtain comparable sectors for the twocountries. For example, US SIC-87 classification places computers andoffice equipment in “industrial machinery,” while Canada SIC-80 classifi-cation places it in the “electrical and electronic” equipment. For comparison,the two sectors were aggregated into one large sector, which was taken as aproxy for the ICT-producing sector in the paper.
The following aggregation criteria were used: subindustries value addedwere aggregated using value-added shares as weights; labour and capital in-puts were aggregated using relative shares in aggregate labour compen-sation and capital income, respectively, as weights; and hours worked wereaggregated through the unweighted sum.
Despite following these aggregation procedures to obtain reasonably com-parable sectors for the two countries, minor differences still persist, par-ticularly in the service sectors. In addition to the different treatment ofeating and drinking places (see footnote 24 in the main text), anotherdifference that is worth mentioning relates to postal services, which areplaced in the “communications” sector for Canada but in the “transportation”sector for the United States.
Economic Integration, the Business Cycle, and Productivity in North America 493
References
Acharya, R., P. Sharma, and S. Rao. 2003. “Canada-U.S. Trade and ForeignDirect Investment Patterns.” In North American Linkages: Opportunitiesand Challenges for Canada, edited by R.G. Harris, 13–88. Calgary:University of Calgary Press.
Arellano, M. and S. Bond. 1991. “Some Tests of Specification for Panel Data:Monte Carlo Evidence and an Application to Employment Equations.”Review of Economic Studies 58 (2): 277–97.
Armstrong, P., T. Harchaoui, C. Jackson, and F. Tarkhani. 2002.“A Comparison of Canada-U.S. Economic Growth in the InformationAge, 1981–2000.” Statistics Canada Economic Analysis Research PaperNo. 001.
Arora, V. and O. Jeanne. 2001. “Economic Integration and the Exchange RateRegime: Some Lessons from Canada.” International Monetary FundPolicy Discussion Paper No. 01/1.
Baldwin, J. and J. Chowhan. 2003. “The Impact of Self-Employment onProductivity Growth in Canada and the US.” Canadian EconomicObserver 16 (8).
Baldwin, J.R. and J. Tang. 2003. “The Contribution of Small and MediumSized Producers to the Productivity Gap between the ManufacturingSectors of Canada and the United States.” Paper presented at the 37thAnnual Meeting of the Canadian Economics Association, CarletonUniversity, Ottawa, 30 May–1 June 2003.
Bayoumi, T. and B. Eichengreen. 1994. “Monetary and Exchange RateArrangements for NAFTA.” Journal of Development Economics 43 (1):125–65.
Blanchard, O. and J. Simon. 2001. “The Long and Large Decline in U.S.Output Volatility.” Brookings Papers on Economic Activity 1: 135–74.
Carr, J.L. and J.E. Floyd. 2002. “Real and Monetary Shocks to the CanadianDollar: Do Canada and the United States Form an Optimal CurrencyArea?” North American Journal of Economics and Finance 13 (1):21–39.
Clausing, K.A. 2001. “Trade Creation and Trade Diversion in the Canada-United States Free Trade Agreement.” Canadian Journal of Economics34 (3): 677–96.
Courchene, T.J. 2003. “FTA at 15, NAFTA at 10: A Canadian Perspective onNorth American Integration.” North American Journal of Economics andFinance 14 (2): 263–85.
Crawford, A. 2002. “Trends in Productivity Growth in Canada.” Bank ofCanada Review (Spring): 19–32.

494 Cardarelli and Kose
Debs, A. 2001. “Testing for a Structural Break in the Volatility of Real GDPGrowth in Canada.” Bank of Canada Working Paper No. 2001–9.
Department of Foreign Affairs and International Trade (DFAIT). 2003.“NAFTA @ 10: A Preliminary Report.”
Dion, R. 1999–2000. “Trends in Canada’s Merchandise Trade.” Bank ofCanada Review (Winter): 29–41.
Dobson, W. 2002. “Shaping the Future of the North American EconomicSpace: A Framework for Action.” C.D. Howe Institute CommentaryNo. 162.
Doyle, B.M. and J. Faust. 2003. “Breaks in the Variability and Co-movementof G-7 Economic Growth.” Board of Governors of the Federal ReserveSystem International Finance Discussion Paper No. 786.
Easterly, W., N. Fiess, and D. Lederman. 2003. “NAFTA and Convergence inNorth America: High Expectations, Big Events, and Little Time.”Economica 4 (1): 1–40.
Estevadeordal, A. and K. Suominen. 2004. “Rules of Origin: A World Mapand Trade Effects.” Inter-American Development Bank. Washington.Unpublished.
Faruqui, U., W. Gu, M. Kaci, M. Laroche, and J.-P. Maynard. 2003.“Differences in Productivity Growth: Canadian-U.S. Business Sectors,1987–2000.” Monthly Labor Review April 126 (4): 16–29.
Ghosh, M. and S. Rao. 2004. “Economic Impacts of a Possible Canada-U.S.Customs Union: Simulation Results from a Dynamic CGE Model.”Industry Canada. Photocopy.
Globerman, S. and D. Shapiro. 2003. “Assessing Recent Patterns of ForeignDirect Investment in Canada and the United States.” In North AmericanLinkages: Opportunities and Challenges for Canada, edited byR.G. Harris, 281–310. Calgary: University of Calgary Press.
Goldfarb, D. 2003. “Beyond Labels: Comparing Proposals for CloserCanada-U.S. Economic Relations.” C.D. Howe Institute Backgrounder,No. 76.
Gordon, R.J. 2003. “High-Tech Innovation and Productivity Growth: DoesSupply Create Its Own Demand?” National Bureau of EconomicResearch Working Paper No. 9437.
Gu, W. and G. Sawchuk. 2001. “Canada’s Growing Market Integration withthe U.S.—With a Focus on Trade.” North American Journal of Economicsand Finance 12 (3): 283–300.
Gust, C. and J. Marquez. 2004. “International Comparison of ProductivityGrowth: The Role of Information Technology and Regulatory Practices.”Labour Economics 11 (1): 33–58.

Economic Integration, the Business Cycle, and Productivity in North America 495
Hall, R.E. and C.I. Jones. 1996. “The Productivity of Nations.” NationalBureau of Economic Research Working Paper No. 5812.
Harchaoui, T. and F. Tarkhani. 2002. “Information Technology andProductivity Growth in Canada and the United States: A ComprehensiveExamination.” Statistics Canada. Unpublished.
Harris, R.G. and S. Kherfi. 2000. “Productivity Growth and TradeSpecialization.” Paper presented at the Centre for the Study of LivingStandards conference on The Canada-U.S. Manufacturing ProductivityGap. Ottawa.
Head, K. and J. Reis. 2003. “Free Trade and Canadian EconomicPerformance: Which Theories Does the Evidence Support?” In NorthAmerican Linkages: Opportunities and Challenges for Canada, edited byR.G. Harris, 181–205. Calgary: University of Calgary Press.
Heathcote, J. and F. Perri. 2003. “Why Has the U.S. Economy Become LessCorrelated with the Rest of the World?” American Economic Review93 (2): 63–9.
Helbling, T. and T. Bayoumi. 2003. “Are They All in the Same Boat? The2000–2001 Growth Slowdown and the G-7 Business Cycle Linkages.”International Monetary Fund Working Paper No. 03/46.
Ho, M.S., S. Rao, and J. Tang. 2003. “Sources of Output Growth in Canadianand U.S. Industries in the Information Age.” Industry Canada ResearchMonograph.
Hufbauer, G.C. and J.J. Schott. 1992. “North American Free Trade: Issuesand Recommendations.” Washington: Institute for InternationalEconomics.
Hummels, D., D. Rapoport, and K.-M. Yi. 1998. “Vertical Specializationand the Changing Nature of World Trade.” Economic Policy Review4 (2): 79–99.
Jackson, A. 1999. “From Leaps of Faith to Lapses of Logic.” Policy Options20 (5): 12–18.
———. 2003a. “Why the ‘Big Idea’ Is a Bad Idea: A Critical Perspective onDeeper Economic Integration with the United States.” Canadian LabourCongress Research Paper No. 20.
———. 2003b. “From Leaps of Faith to Hard Landings: Fifteen Years of‘Free Trade’.” Canadian Labour Congress Research Paper No. 28.
Jorgenson, D.W., M.S. Ho, and K.J. Stiroh. 2005. “Growth of U.S. Industriesand Investments in Information Technology and Higher Education.”In Measuring Capital in the New Economy, edited by C. Corrado,J. Haltiwanger, and D. Sichel. National Bureau of Economic ResearchStudies in Income and Wealth.

496 Cardarelli and Kose
Kalemli-Ozcan, S., B.E. Sørensen, and O. Yosha. 2003. “Risk Sharing andIndustrial Specialization: Regional and International Evidence.”American Economic Review 93 (3): 903–18.
Khan, H. and M. Santos. 2002. “Contribution of ICT Use to Output andLabour-Productivity Growth in Canada.” Bank of Canada Working PaperNo. 2002–7.
Kose, M.A., G.M. Meredith, and C.M. Towe. 2004. “How Has NAFTAAffected the Mexican Economy? Review and Evidence.” InternationalMonetary Fund Working Paper No. 04/59.
Kose, M.A., C. Otrok, and C.H. Whiteman. 2003. “International BusinessCycles: World, Region, and Country-Specific Factors.” AmericanEconomic Review 93 (4): 1216–39.
———. 2004. “Understanding the Evolution of World Business Cycles.”International Monetary Fund Working Paper. Forthcoming.
Kose, M.A., E.S. Prasad, and M.E. Terrones. 2004. “Volatility andComovement in a Globalized World Economy: An EmpiricalExploration.” In Macroeconomic Policies in the World Economy, editedby H. Siebert, 89–122. Berlin: Springer-Verlag.
Kose, M.A. and K.-M. Yi. 2001. “International Trade and Business Cycles:Is Vertical Specialization the Missing Link?” American Economic Review91 (2): 371–75.
Krueger, A.O. 1999. “Trade Creation and Trade Diversion under NAFTA.”National Bureau of Economic Research Working Paper No. 7429.
———. 2000. “NAFTA’s Effects: A Preliminary Assessment.” WorldEconomy 23 (6): 761–75.
Lafrance, R. and P. St-Amant. 1999. “Optimal Currency Areas: A Review ofthe Recent Literature.” Bank of Canada Working Paper No. 1999–16.
Lee, F.C. and J. Tang. 2001. “Productivity Levels and InternationalCompetitiveness Between Canada and the United States.” In Industry-level Productivity and International Competitiveness Between Canadaand the United States, edited by D.W. Jorgenson and F.C. Lee, 155–79:Industry Canada Research Monograph.
Macklem, T. 2003. “Future Productivity Growth in Canada: Comparing tothe United States.” International Productivity Monitor 7 (Fall): 50–7.
McCallum, J. 1999. “Two Cheers for the FTA.” Policy Options 20 (5): 6–11.McMahon, F., M. Curtis, and A.O. Adegoke. 2003. “The Unseen Wall:
The Fraser Institute’s 2003 Trade Survey.” Fraser Institute Public PolicySources No. 76.
Mirus, R. and K. Hoffman. 2004. “Estimating Potential Savings fromStreamlining Tariffs Among NAFTA Partners: An Alberta Perspective.”Unpublished.
Economic Integration, the Business Cycle, and Productivity in North America 497
Murray, J. 2000. “Why Canada Needs a Flexible Exchange Rate.”North American Journal of Economics and Finance 11 (1): 41–60.
Murray, J., L. Schembri, and P. St-Amant. 2003. “Revisiting the Case forFlexible Exchange Rates in North America.” North American Journal ofEconomics and Finance 14 (2): 207–40.
Oliner, S.D. and D.E. Sichel. 2002. “Information Technology andProductivity: Where Are We Now and Where Are We Going?” FederalReserve Bank of Atlanta Economic Review 87 (3): 15–44.
Policy Research Initiative. 2003. “The North American Linkages Project:Focusing the Research Agenda.” Policy Research Initiative, PrivyCouncil Office (Ottawa). <www.policyresearch.gc.ca>.
Romalis, J. 2002. “NAFTA’s and CUSFTA’s Impact on North AmericanTrade.” University of Chicago. Unplished paper.<http://gsbwww.uchicago.edu/fac/john.romalis/research/naftapaper.pdf>.
Sawchuk, G. and A. Sydor. 2003. “Mexico and Canada: ChangingSpecializations in Trade with the United States.” In North AmericanLinkages: Opportunities and Challenges for Canada, edited byR.G. Harris, 117–79. Calgary: University of Calgary Press.
Sawchuk, G. and D. Trefler. 2002. “A Time to Sow, a Time to Reap: The FTAand Its Impact on Productivity and Employment.” In Productivity Issuesin Canada, edited by S. Rao and A. Sharpe, 537–69. Calgary: Universityof Calgary Press.
Schreyer, P. 2001. “The OECD Productivity Manual: A Guide to theMeasurement of Industry-Level and Aggregate Productivity.”International Productivity Monitor 0 (2): 37–51.
Schwanen, D. 1997. “Trading Up: The Impact of Increased ContinentalIntegration on Trade, Investment, and Jobs in Canada.” C.D. HoweInstitute Commentary No. 89.
Stock, J.H. and M.W. Watson. 2003. “Understanding Changes inInternational Business Cycle Dynamics.” National Bureau of EconomicResearch Working Paper No. 9859.
Trefler, D. 2001. “The Long and Short of the Canada-U.S. Free TradeAgreement.” National Bureau of Economic Research Working PaperNo. 8293.
United States International Trade Commission (USITC). 2003. “The Impactof Trade Agreements: Effect of the Tokyo Round, U.S.-Israel FTA, U.S.-Canada FTA, NAFTA, and the Uruguay Round on the U.S. Economy.”Publication No. 3621. Washington, DC.
United States Trade Representative (USTR). 2003. National Trade EstimateReport on Foreign Trade Barriers. Washington.
Wall, H.J. 2003. “NAFTA and the Geography of North American Trade.”Federal Reserve Bank of St. Louis Review 85 (2): 13–26.
498
This paper offers an extensive and comprehensive review of real macro-economic links between Canada and the United States. It discusses the foun-dations of the debate on whether or not the trade agreements between thetwo countries in the past decades have been beneficial for Canada, in par-ticular for the dynamics of its business cycle and productivity.
My interpretation of the paper’s main points is the following. First, tradewith the United States accelerated in Canada since the Canada-United StatesFree Trade Agreement (CUSFTA) at both the national and regional levels.This acceleration was especially evident in the manufacturing sector, whichincreased cross-border vertical integration. Second, the higher businesscycle synchronicity observed over time between Canada and the UnitedStates may not necessarily be due to trade intensification. Cardarelli andKose find that the biggest source of Canadian business cycle fluctuations areidiosyncratic factors, which contribute strongly to the case for flexibleexchange rates. Third, the widened gap of labour productivity between theUnited States and Canada since the mid-1990s is shown to be linked topoorer performance of the information and communication technologies(ICT) sector in Canada. Trade intensification indeed reduced the total factorproductivity (TFP) differential across countries but did not bring aboutconvergence.
I will focus on three aspects of the paper: (i) the measurement and interpre-tation of business cycle synchronicity; (ii) the evidence and conclusions onthe productivity gap; and (iii) whether Canada-US real macroeconomic linksrepresent a story of trade.
Discussion
Eva Ortega
Discussion: Ortega 499
Business Cycle Synchronicity
As highlighted by the authors, evidence of higher trade and verticalspecialization would result in a more common business cycle. However,section 4 of their paper shows evidence of different production structures inCanada and the United States, which would cause more country-specificcyclical fluctuations. Which effect dominates is unclear, both theoreticallyand empirically. The authors choose a dynamic factor model for output,consumption, and investment in Canada and the G-3 and find that idio-syncratic factors are the main source of the business cycle fluctuations ofCanadian variables.
A frequent criticism of factor models is that they do not provide a cleareconomic interpretation of the various factors. The authors’ Table 4 showsthe variance decomposition1 results and finds that for the United States, thedominant role of the country-specific factor in the 1960s and 1970s isreplaced by that of the common factor in the past two decades. How do weinterpret the common factor in this case? Did the United States become thecommon factor for the G-3 and Canada business cycles in the past twodecades? If so, the higher role that the paper finds for the common factor inCanadian fluctuations in the 1980s and 1990s could then be interpreted as adeeper economic integration with the United States.
On a different note, this higher significance of common fluctuations found inthe latter period (1981–2002) is compatible with the maintained or increasedrole for country-specific or idiosyncratic fluctuations and has been high-lighted elsewhere (see, for example, Canova, Ciccarelli, and Ortega 2004).The main reason behind both findings is that macroeconomic fluctuationswere less volatile in the G-7 countries in recent periods, especially duringthe 1990s. Lower volatility causes less uncertainty around estimatedcommon cycles as well as country-specific cycles, which were often non-significant before the 1990s because of wide standard errors. Determiningwhether the recent lower business cycle volatility is due to increasedintegration or to other causes, for example, smaller shocks, would require astructural model rather than a reduced-form model like the one in this paper.
1. The variance decomposition is shown for two periods (1960–81 and 1981–2002), andthe coefficients are kept fixed. Since the break is not linked to a particular change in tradeagreements, differences across subperiods cannot, unfortunately, be linked to tradeintensification.
500 Discussion: Ortega
The Canada-US Productivity Gap
The authors show how the convergence of Canadian per capita income withthat of the United States has been held back since the mid-1990s as a resultof the widening of the gap in labour productivity. The common explanationfor this indicates a smaller and less productive ICT sector in Canada,together with a lower ICT capital deepening in Canadian firms. Cardarelliand Kose use industry data to look for possible sectoral dynamics behind thegap and for a possible link with trade intensity. This is an ambitious anddemanding task.
The accounting exercise for growth in sectoral labour productivity yields anestimate of –0.8 per cent for the Canada-US labour productivity gap in the1995–2000 period versus 0.9 per cent in 1982–95. The contributing factorsfound for that change confirm the consensus story above and are: (i) thesignificantly smaller TFP growth in the ICT sector in Canada, despite thereduction of the Canada-US TFP gap in general; and (ii) the far lower capitaldeepening in Canada than earlier.
The results for the 1995–2000 period should be considered with caution,since the authors extrapolate the database for manufactures after 1997 usinga different industry definition. Indeed, the authors acknowledge that recentestimates show a Canada-US labour productivity gap in 1995–2000 ofaround –0.4 per cent.
A volume edited by Dale Jorgenson examines this productivity gap, usingthe new KLEMS (capital, labour, energy, material, and service) database.In this publication, Ho, Rao, and Tang (2004) find that FIRE (financial,insurance, and real estate services) and retail trade, followed by commu-nications, agriculture, and other services, contributed most to aggregatelabour productivity growth in Canada in 1995–2000. More productive ICT-producing industries contributed less because of their small size. Consistentwith this new evidence, Cardarelli and Kose report an important contributionof services to the productivity gap in 1995–2000, which they find is not somuch due to big differences in productivity but rather to the fact that rapidlyimproving sectors, such as the FIRE services, are larger in the United States(the “structure effect”).
The authors also analyze the effect of trade agreements on productivity.Informal evidence is found of higher TFP growth in Canada after CUSFTA,linked to greater vertical specialization and trade exposure. In terms of theCanada-US gap, the authors find that trade intensification reduced the TFP

Discussion: Ortega 501
level differential,2 although it did not lead to convergence. It would havebeen interesting to see an analysis related to the labour productivity gap oreven to TFP growth.
Cardarelli and Kose conclude by arguing that the main reason behind theincreased gap in labour productivity growth between Canada and the UnitedStates is the reallocation and industry structure differences; that Canada hasbeen less successful in redirecting resources to sectors of high productivity.However promising, their analysis could be extended by reporting, for ex-ample, the size of the reallocation factor for each country. It may also beworth exploring the reallocation effect using other sectoral information,such as capital reallocation and the entry and exit of firms from high-productivity sectors. But is this reallocation effect linked to higher tradeintensity or is it linked to different investment patterns in the two countries?
A Story of Trade?
Trade agreements between Canada and the United States do not seem tohave clearly affected either the business cycle synchronicity or the evolutionof productivity growth in the two countries. Thus, have Canada-US realmacroeconomic links been governed by trade? Or are they determined moreimportantly by their differing economic structures or by aggregate and sec-toral investment patterns?
If the different structures or investment behaviour matter most, then perhapsdomestic policies rather than international trade agreements should be em-phasized and encouraged.
The extensive information conveyed in Cardarelli and Kose’s work provideschallenging evidence that stimulates interesting and important further in-vestigation. Their Table 5, for example, reports a remarkably slower growthof the use of ICT capital services by Canadian firms than by their UScounterparts. What can explain this difference?
2. The TFP gap is calculated assuming equal input shares across countries. This assum-ption leads to erroneously interpreting the cross-country differences in input income sharesin value added as TFP differential.

502 Discussion: Ortega
References
Canova, F., M. Ciccarelli, and E. Ortega. 2004. “Similarities andConvergence in G-7 Cycles.” Europe Central Bank Working PaperNo. 312.
Ho, M.S., S. Rao, and J. Tang. 2004. “Sources of Output Growth in Canadianand U.S. Industries in the Information Age.” In Economic Growthin Canada and the United States in the Information Age, edited byD.W. Jorgenson, 83–165. Industry Canada Research Monograph.

503
Graham Voss, in response to comments, pointed out that his results seemedconclusive, but that more work should be done to try to reconcile the lack ofa border effect according to the sectoral data in his paper and the strongCanadian component that was found in the Gosselin et al. paper. In responseto Ortega’s comments, Ayhan Kose made four points. First, while usingfixed coefficients over the two sample periods was debatable, their paperwas not trying to link the cyclical convergence with trade agreements. Goingforward, rolling regressions and structural break tests may be useful in thiscontext. Second, the common factor is not the US economic cycle. Theoutput data are not weighted and the United States is not the main driver ofthe common factor. Third, neither is decreasing volatility of shocks. Fourth,given the fact that data revisions have tended to lessen the Canada-US pro-ductivity gap in recent years, measurement of productivity across countriesremains a challenge.
In the general discussion that followed, Raphael Solomon asked Kose if itwas not too soon to evaluate the effects of NAFTA, given that tariffs were tobe phased out over time, up to ten years for certain categories of goods. Koseagreed it would be useful to look at this again in 2010. Gregor Smith askedif researchers could provide confidence intervals, since observed differencesacross different time periods might not be statistically significant. Moreover,shock decompositions can be interpreted for exogenous variables, but notfor endogenous variables, as reported in the papers. Kose replied thatconfidence intervals can be found in the paper. Nicholas Rowe cautionedagainst using correlations evidence to assess optimal currency areas. For
General Discussion*
* Prepared by Robert Lafrance.

504 General Discussion
instance, if the Bank of Canada could perfectly offset the common Canadianshock in these models, then we would conclude that Canada was not anoptimal currency area (since only the international and regional shockswould be in evidence). What the correlations show is the failures of centralbanks to offset shocks. Kose agreed, but noted that a flexible exchange rateregime is still valuable for Canada despite its growing integration into theUS economy.