economic indicators report first quarter 2018: central
TRANSCRIPT

Economic Indicators ReportFirst Quarter 2018: Central Wisconsin
Unive
rsity
of W
iscon
sin-S
teve
ns Po
int
Cent
ral W
iscon
sin Ec
onom
ic Re
sear
ch Bu
reau
Randy Cray, Ph.D., Interim Chief EconomistScott Wallace, Ph.D., Research Associate
Special Reports: “The Opioid Epidemic” by Associate Professor Sue Bailey, UW-Stevens Point Department of Sociology and Social Work
“The Economics of the Opioid Epidemic” by Professor Scott Wallace and Erika Rattunde, UW-Stevens Point School of Business and Economics

The Central Wisconsin Economic Indicators Report is made possible thanks to support of:

CWERB Economic Indicators Report - Central Wisconsin 1
TABLE OF CONTENTS
Outlook................................................................................................................................................................................... 2 Table 1: National Economic Statistics .............................................................................................................................. 2State Economy ....................................................................................................................................................................... 3 Table 2: Unemployment Rate in Central Wisconsin ........................................................................................................ 3 Table 3: Employment in Central Wisconsin ..................................................................................................................... 4 Table 4: Wisconsin Employment Change by Sector ........................................................................................................ 4 Figures 1-7 .....................................................................................................................................................................4-5County Economy ................................................................................................................................................................... 5 Table 5: County Sales Tax Distribution ............................................................................................................................ 5 Table 6: Portage County and Wisconsin Demographics .................................................................................................. 5 Table 7: Portage County and Wisconsin Business and Geographic Data ........................................................................ 6 Table 8: Unemployment Claims in Portage County ......................................................................................................... 6Local Economy ...................................................................................................................................................................... 6 Table9:BusinessConfidenceinCentralWisconsin ........................................................................................................ 6 Table10:RetailerConfidenceinCentralWisconsin ........................................................................................................ 6 Table 11: Help Wanted Advertising in Central Wisconsin ............................................................................................... 7 Table 12: Residential Construction in Stevens Point - Plover Area ................................................................................. 7 Table 13: Nonresidential Construction in Stevens Point - Plover Area............................................................................ 7 Figures 12-15 .................................................................................................................................................................7-8Housing Market Information............................................................................................................................................... 8 Table 14: National Median Home Prices.......................................................................................................................... 8 Table 15: National Existing Home Sales .......................................................................................................................... 8 Table 16: National Inventory ............................................................................................................................................ 8 Table 17-1; 17-2: National Affordability Index ................................................................................................................ 9 Table 18: Local Area Median Price .................................................................................................................................. 9 Table 19: Local Units Sold ............................................................................................................................................... 9 Table 20: Local Median Price........................................................................................................................................... 9 Table 21: Local Number of Home Sales .......................................................................................................................... 9Special Report ................................................................................................................................................................10-19
Special Recognition: Scott Wallace, Research Associate, CWERBErika Rattunde, Senior Research Assistant, CWERBCaleb Nysse, Lead Research Assistant, CWERBDrosianos Louvaris, Research Assistant, CWERB
Association for University
Business and Economic Research
CWERB - School of Business & EconomicsUniversity of Wisconsin-Stevens Point
Stevens Point, WI 54481715-346-3774 or 715-346-2537www.uwsp.edu/business/cwerb

2 CWERB Economic Indicators Report - Central Wisconsin
OutlookGenerally speaking the economy, whether we are talking about the nation, the state or local area, is doing quite well. Table 1 of the report shows the reader that the nation’s economy is growing. In addition, employment is growing, the unemployment rate is very low, the stock market has had a tremendous run, and household income is rising.
The general consensus among economist is that the economy will continue to do well for the rest of the year. However, there are some looming issues that could throw the economy off track. For example, evolving Federal Reserve interest rate policy has the potential to slow the economy as it attempts to normalize interest rates with a series of rate hikes over the next two years. In the short run, recenttaxcutsandtheboomingfederalgovernmentdeficitwill provide stimulus to the economy. In the long run, the taxcutsanddeficitwillplaceinflationarypressureonanalready healthy economy and thus drive up borrowing costs for the public and private sectors. Additionally, the shortage of working age adults is only going to get worse and this too will place a damper on future economic growth.
Currently, the 800-pound gorilla in the room is international trade policy. Much of the discussion concerns the negative aspectsofinternationaltradelikejoblossandtradedeficits.Moreover, it is clear that some of our trading partners like China have engaged in unfair practices. Examples include currency manipulation, the theft of intellectual property, and trade barriers that hinder access to Chinese markets. Having a trade war, however, has serious consequences for the nation and the state of Wisconsin. Therefore, I want to take this opportunity to discuss some of the positive aspects of international trade. Perhaps not the most popular position to take on the matter, but I am not running for politicaloffice.
Most people do not understand the extent that Wisconsin is engagedininternationaltrade.Butfirst,Iwanttodiscussfactors that play a role in determining a state’s export activity. I will primarily be using data from the U.S. Census Bureau, the Business Roundtable, and the Wisconsin Department of Revenue.
Therearemanyfactorsthatcaninfluencetheamountofa state’s exporting activity in a state. They include: (1) a
state that ships intermediate products to another state for finalassemblyandexportwillhaveitsexportingactivityundercounted; (2) some products are better suited for export than others, e.g. products that lose weight in the production process are easier to ship than products that gain weight in the production process; (3) a state’s access to international transportation networks plays a big role in determining transportation costs ; (4) a state’s location and proximity to foreign markets also has an impact on shipping costs.; (5) a state’s regulations and assistance programs can either help or hinder exporting activity; and (6) a state’s entrepreneurial culture or lack thereof can play ahugeroleininfluencingtheamountofexporting.
With that in mind, Wisconsin’s international trade is estimated to directly support over 800,000 jobs. Therefore, a large number of jobs in the state are dependent on international trade. In dollar terms, over $30 billion worth ofgoodsandservicesareexportedbyWisconsinfirmseach year. Keep in mind that 95 percent of the world’s population and 80 percent of the world’s purchasing power exist outside of the U.S. This means that future job growth in Wisconsin and the U.S. will be highly dependent on having access to foreign markets.
It is estimated that over 8,700 Wisconsin businesses export goods and services each year. Wisconsin ranks in the top ten of states for about 30 product categories, such as animal products, dairy products, nonmetallic minerals, and agricultural construction machinery. Additionally the exporting of navigation and measuring instruments, motor vehicle parts, travel, computer software, and insurance services represent important product categories that comprise Wisconsin exports.
Wisconsin companies exported to over 210 countries in 2014. We exported $8.5 billion worth of goods and services to Canada and approximately $3 billion worth of products to Mexico in 2014. Most people would be shocked to learn that Wisconsin exported over $2.3 billion worth of our goods and services to China. Furthermore, Japan, the United Kingdom, and Germany respectively bought $1.5 billion, $1.3 billion and $1.0 billion worth of our products.
Wisconsin’s top six exporting markets are Canada (approximately 30% of the total), Mexico (10%), China (7%), Germany (4%), Australia (3.8%), and Japan (3.8%). Rounding out Wisconsin’s top ten export destinations are the United Kingdom, Chile, Brazil and France. In addition, agricultural products are estimated to add an additional $850 million dollars to the state’s export total (this number excludes processed foods).

CWERB Economic Indicators Report - Central Wisconsin 3
What does Wisconsin export to the world? The largest export categories are as follows. Machinery accounts for $5.4 billion or 27 percent of Wisconsin, exports. Construction machinery is the second most important item, followed by general purpose machinery, engines, turbines, and transmission equipment. Not surprising, the largest importers of our machinery are, Canada, China, Chile, and Australia.
Computers and electronics rank second at $3.4 billion or about 17 percent of total exports. Navigational, medical, and control instruments represent the largest share. Computer equipment and semiconductors are the next largest component and China, Japan, Canada and France buy the bulk of these items.
Transportation equipment ranks third in terms of exports at $1.8 billion or 9% of exports. Motor vehicle parts account for over half of this total. Aerospace products and parts represent about a fourth of this category. Canada, Mexico, Germany, United Kingdom and Australia are the top destinations for transportation equipment.
The processed foods category accounts for $1.3 billion or about 7 percent of Wisconsin’s exports. Meat products are around 25 percent of the processed food total and dairy products account for an additional 25 percent of the total. Food(notelsewhereclassified)accountsforabout16percent of the processed foods exporting total.
Chemical products were valued at $1.2 billion or 6 percent of total exports, and include items such as pharmaceuticals, basic chemicals, and cleaning products. The paper industry exports were around $840 million or about 4 percent of export activity. Lastly, the export value of agricultural and livestock products was approximately $850 million. The top products were oilseeds and grain, other animal products, and forestry products.
It is clear that Wisconsin is highly engaged in the global economy. So how does Wisconsin compare to the U.S. in terms of exporting activity? For the last few years, Wisconsin has accounted for about 1.5 percent of U.S. exporting activity. Since Wisconsin’s population is approximately 1.8 percent of the U.S. population (5.72 million/313.91 million), one might expect that our exports would account for about 1.8 percent of the U.S. total. However, this is not the case. In other words, on a per capita basis, we tend to export a little less than the rest of the country.
International trade has another important dimension that most people do not consider: about 60 percent of the $1.3 trillion that the U.S. imports annually are used by U.S.
firmsasinputstotheirproducts.ThishelpsU.S.firmskeepcosts down and to stay competitive in the global economy. A Business Round Table study found that relaxed trade barriers reduce prices on imported and domestic made products.Inotherwords,theyhelptokeepinflationincheck. For example, the study estimated that over a 10-year period (2004-2014) the price on comparable televisions has declined by over 80 percent, and 69 percent for computers. Further, the average Wisconsin family of four saves about $10,000 a year because of relaxed trade barriers.
We also need to consider the impact of foreign direct investment in Wisconsin. Remember this is a form of international trade. Foreign owned companies employ 88,000 workers in our state. A few examples are the Canadian National Railroad, McCain Foods, Domtar paper manufacturing, Veolia waste management, Aldi groceries stores, and BMO Harris Bank. In addition many well know companies are foreign owned like Budweiser Beer, 7 Eleven convenient stores, Gerber baby food, Frigidaire appliances, Holiday Inn, Citco gasoline, BP gasoline, Firestone, Honda, and Toyota.
While most would like to see the U.S. win better trade terms with other countries, people should remember that alienating other nations and starting a trade war would causehigherdomesticinflationandthelossofjobshere.Clearly this is a very delicate situation and the public needs to be aware of the potential costs. Raising tariffs and other trade barriers with the hope of increasing domestic jobs will come with a steep cost.
State EconomyThe unemployment rate in each reporting areas is listed in Table 2. Marathon, Portage and Wood County all experienced substantial declines in their unemployment rates from a year ago. The respective March rates for Portage, Marathon and Wood are now down to 3.4, 2.9 and 4.1 percent in March 2018. The labor force weighted unemployment rate for Central Wisconsin also contracted, and is now at 3.3 percent. Meanwhile, Wisconsin’s unemployment rate dropped from 3.7 to 3.2 percent. Thus,

4 CWERB Economic Indicators Report - Central Wisconsin
unemployment rates were much improved throughout the region and state. The United States unemployment rate also fell from 4.6 percent to 4.1 percent over the past 12 months. EmploymentfiguresinTable3arebasedonthegovernment’s survey of households. Portage County’s totalemploymentfigureroseby600positionsandtotalemployment in Wood County expanded by about 600 jobs over the past year. Meanwhile, Marathon County payrolls are estimated to have grown by 1,800 positions over the past 12 months. Thus, Central Wisconsin as a whole experienced an employment growth of about 3,100 positions. Jobs in the region rose from 144.1 to 147.2 thousand or by 2.2 percent. The survey of households also shows that Wisconsin’s payrolls increased by 2.7 percent. The nation gained 1.5 percent or about 2.2 million jobs over the same period.
Table 4 gives the most recent employer based payrolls numbers for Wisconsin. Economists believe the nonfarm employment numbers that are based on employer provided data, give a more accurate assessment of the labor market conditions than the household survey data. From
March 2017 to March 2018 Wisconsin’s total nonfarm employment expanded from 2.90 million to 2.93 million or by 0.9 percent. This represents a gain of approximately 27 thousand jobs during the past year. Unlike past periods when only a few of the state’s 11 major industrial sectors expanded, this time all but four of the sectors recorded gains in employment. Overall though, the rate of job generation continues to be very modest in the state as measured by this data set and compared to what our neighbor states are experiencing. Figures 1-7Figures 1 thru 7 give a historic overview of how the economy in Wisconsin has performed relative to other Midwestern state over the past few years. If past trends hold,thenthefiguresmightgiveusaglimpseintowhatfuture levels of activity might look like.
Figure 1: Employment Level: WI
Figure 2: Unemployment Level: WI
Figure 3: Unemployment Rate: WI

CWERB Economic Indicators Report - Central Wisconsin 5
Figure 4: Labor Force: WI
Figure 5: Manufacturing: WI
Figure 6: Education and Health Services: WI
Figure 7: Leisure and Hospitality: WI, In Thousands
County EconomyIn Table 5, Portage County sales tax distributions were stronger this year than last, rising from $1.4 million in 2017 to $1.5 million in 2018, an increase of 8 percent. Marathon also experienced an increase in sales tax distributions from the state. Marathon rose from $2.86 million to $2.90 million or by about 1.2 percent. However, Wood County collections eked out a modest gain rising from $1.31 million to $1.32 million or by 0.3 percent over the course of the past year. The data suggests there was improvement in retail activity in Central Wisconsin retail activity.
6 CWERB Economic Indicators Report - Central Wisconsin
Table 6 presents Portage County and Wisconsin demographic information. A highlight from this table is that Portage County population is estimated to have reached 70,408 in 2015, only growing by 0.6 percent from 2010 to 2015. Likewise the state grew by just 1.5 percent over the same time period. Table 7 contains the business and geographic data for Portage County and the state of Wisconsin. These tables give the reader points of comparison in terms of the local area’s characteristics relative to the state. Moreover, the latter provides some insights into Portage County’s share of the state’s economic activity.
Another measure of the local economy is presented in Table 8. It shows that new unemployment claims rose from 105 to 144 or by 36.6 percent over the year. Moreover, total unemployment claims climbed from 820 to 1,040 or by 26.9 percent in our year over comparison. Perhaps this result is partially due to the very long and harsh winter in central Wisconsin and to layoffs in the retail sector.
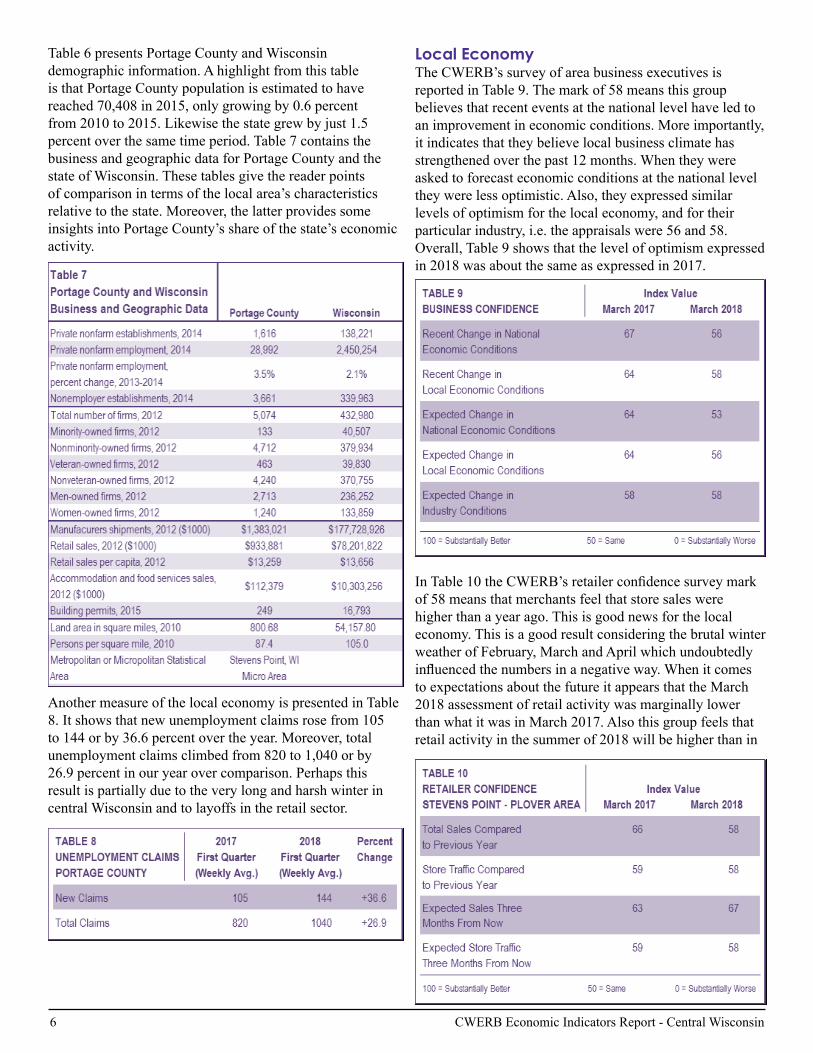
Local EconomyThe CWERB’s survey of area business executives is reported in Table 9. The mark of 58 means this group believes that recent events at the national level have led to an improvement in economic conditions. More importantly, it indicates that they believe local business climate has strengthened over the past 12 months. When they were asked to forecast economic conditions at the national level they were less optimistic. Also, they expressed similar levels of optimism for the local economy, and for their particular industry, i.e. the appraisals were 56 and 58. Overall, Table 9 shows that the level of optimism expressed in 2018 was about the same as expressed in 2017.
InTable10theCWERB’sretailerconfidencesurveymarkof 58 means that merchants feel that store sales were higher than a year ago. This is good news for the local economy. This is a good result considering the brutal winter weather of February, March and April which undoubtedly influencedthenumbersinanegativeway.Whenitcomesto expectations about the future it appears that the March 2018 assessment of retail activity was marginally lower than what it was in March 2017. Also this group feels that retail activity in the summer of 2018 will be higher than in

CWERB Economic Indicators Report - Central Wisconsin 7
2017.Theoverallsignificanceofthesurveyisthatlocalmerchants believe that the local retail sector did well in light of the harsh winter weather.
Help Wanted Advertising in Table 11 is a barometer of local labor market conditions and the indexes for Stevens Point,Wausau,MarshfieldandWisconsinRapidsarenowbased on job advertising on the Internet. The index for Stevens Point and Wisconsin Rapids fell by 6 percent and by 5 percent respectively when compared to a year ago. LikewiseMarshfieldadvertisingfell8percent.Further,Wausau experienced a small increase in the amount advertising taking place, 1.3 percent. Adams County was way down in advertising. While advertising in Lincoln Countywasflat.Thedatatakentogethersuggeststhatadvertising growth has been very uneven in the area.
Table 12 presents the residential construction numbers for the Stevens Point-Plover area. In our yearly comparison the number of permits issued in First Quarter was 10, the number of permits last year was 15. The 2018 estimated value of the construction was $2.6 million and represents 11 housing units. When comparing First Quarter 2017 to that of 2018 residential alteration activity expanded from 152 to 182 permits. However, the estimated value of this type of activity went down from $2.7 million to $1.2 million over the year. Overall, the 2018 construction data are off the pace from a year ago.
ThenonresidentialconstructionfiguresinTable13wereas follows for First Quarter 2018. The number of permits issued was just 2 and the estimated value was $10.2
million. The number of business alteration permits was 89 in 2018 compared to 69 in 2017. The estimated value of alteration activity was $2.7 million 2018 compared tothe2017figureof$4.3million.Insum,thepaceofnonresidential construction activity remained brisk in the area.
Figures 12 thru 15 give an economic history lesson as to how the employment level, the unemployment level, the unemployment rate, and the labor force have trended and likely will trend in the future. The City of Stevens Point, the City of Wausau, as well as the Combined Statistical Area (CSA) of Wausau, Stevens Point, Wisconsin Rapids andMarshfieldarepresentedinthefigures.
Figure 12: Employment Level: Portage
Figure 13: Unemployment Level: Portage

8 CWERB Economic Indicators Report - Central Wisconsin
Figure 14: Unemployment Rate: Portage
Figure 15: Civilian Labor Force: Portage
Housing Market InformationThe following seven tables contain information on the national, regional, and local housing market. Housing activity is an incredibly important aspect of the economy. We believe the reader will gain valuable insight into housing markets conditions and greater insight into the local economy in this section of the report.
Table 14 gives national median home price for the U.S. and major regions in the U.S. The median home price in the U.S. rose to $250,400 in March 2018. Housing prices in the Midwest, as always, remain the lowest in the nation. The median home price in our part of the country fell from 2017 to $192,200 in 2018. In general, housing prices are slowly increasing in the U.S. and are rising in nearly all of its geographic regions. The West has the highest medium housing prices at $377,100.
Table 15 for the United States existing home sales data show a modest increase in sales activity over the past year. In the Midwest 1.29 million homes are forecasted to be sold in 2018. For the Midwest, the preliminary estimate for 2018 is that 10,000 fewer homes will be sold than in 2017. In 2011 the number of homes sold in the Midwest bottomed out at 910 thousand units.
The national inventory of homes is given in Table 16. As of March 2018 the inventory backlog is estimated to be 3.6 months. Going all the way back to 2010 the national supply of homes was 9.4 months. Thus, a great deal of improvement has taken place in housing inventory number. The statistics indicate that the backlog of unsold houses has been greatly reduced.
Tables 17-1 and 17-2 present national housing affordability data. Over the years very low interest rates and falling home prices have greatly improved the affordability of homes. However, starting in 2013 housing prices and interest rates started to trend upwards and affordability started trending lower. The preliminary estimate for the affordability index in 2018 is 159.6. The higher the index, the more affordable housing is for the typical family. This means that in 2018 a household earning at the median household income level has 159.6 percent of the income necessary to qualify for a conventional loan covering 80 percent of a medium-priced existing single-family home.

CWERB Economic Indicators Report - Central Wisconsin 9
Table 18 displays data on state and local area median prices. For the most part Wisconsin and local area home prices have been more stable than the U.S. as a whole. In Central Wisconsin the lowest median home price are to be found in Wood County at $110,000. Portage County has the highest median price at $161,500 and Marathon falls somewhere between the other two counties, with a median house price of $149,900. In comparison, the median price of a house in Wisconsin is about $170,000. In addition, after a few years of rising values, the preliminary data for 2018 suggests that the median price for a house in the local area and state are declining.
Table 19 gives the number of local housing units sold, from 2015 to 2018. The counties in our region have all experienced some stagnation in the number of units sold over this time period. Please note the listed number of homes sold in 2018 only represents the January to March activity.
Tables 20 and 21 present the changes that have taken place in the local median prices and units sold, and compares First Quarter 2017 to First Quarter 2018. In Table 20 we see an increase in local median home prices has taken place in Marathon and Wood. In Table 21, the number of housing units sold in Portage and Wood County fell by 12 and 24 percent respectively over the year. Marathon experienced an increase in home sales 8.0 percent.

10 CWERB Economic Indicators Report - Central Wisconsin
The Economics of the Opioid Epidemic
by Professor Scott Wallace and Erika Rattunde ’18
The authors would like to thank Sue Bailey and C.R. Marshall for their very helpful comments.
IntroductionOpioids represent a class of pharmaceuticals that can be used to reduce pain. Physicians prescribe opioid-based drugs like oxycodone (OxyContin), hydrocodone (Vicodin), and morphine to relieve pain. Users of opioids experience feelings of euphoria. Opioids are highly addictive with overdoses often resulting in death from respiratory failure. Heroin and fentanyl also are opioids. Fentanyl is a synthetic opioid which has been prescribed to treat severe pain. Fentanyl, like heroin, is also distributed illegally throughout the United States (CDC, 2018).
The United States is in the midst of a severe opioid epidemic. More than 165,000 Americans died from prescription-based opioid overdoses from 1999 to 2014 (Kano & Thiruvananthapuram, 2016). The sale of prescription opioids per capita increased by 356% between 1999 and 2015. In 2011, 44% of Medicare recipients under 65 had been prescribed opioid medication (Krueger, 2017, 31-2). The Center for Disease Control estimates that more than 11 million people abused prescription opioids in 2016 alone (CDC, 2018). While the abuse of prescription opioids primarily fueled the epidemic early on, illicit drugs like heroin and fentanyl have been the dominant drivers since 2010.
This report reviews the recent economic literature on the opioid epidemic. We begin by looking at studies that estimate the economic costs of the epidemic. Next the report explores some of the demand-side factors that have contributed to the epidemic. Then it examines the factors that effectively increased the supply of opioid drugs. We also investigate the increasing role of illicit opioids like heroin and fentanyl in propelling the epidemic over the last halfdozenyearsorso.Weconcludebybrieflyconsideringthe policy implications drawn from these studies.
A note of caution is in order. Human behavior is complex. Itisextraordinarilydifficultforeconomists(andothersocialscientists)toidentifythetruecausesbehindspecifickinds of behavior. It is also important to recognize that there are differences in beliefs among economists over the epidemic’s causes and costs. In addition, many of the
studies we describe are “working papers,” meaning they haven’t yet been subject to a rigorous review process that is typically required for publication. Despite these provisos, we believe that a review of the current economic literature can illuminate many of the issues surrounding this epidemic and thereby provide needed context in trying tofindsolutionstothisterribleproblem.
The Economic Costs of the Opioid EpidemicEconomistshaveattemptedtoestimatetheverysignificantcosts of the opioid epidemic on economic performance and society overall. In this section, we review and summarize the results of their studies. We initially look at the impact of the epidemic on the nation’s workforce and then focus on broader societal costs associated with the epidemic.
Labor Force Participation Rate (LFPR)In evaluating the health of a patient, doctors look at blood pressure, weight, heart rate, and cholesterol levels as well as a host of other indicators. Economists similarly rely on multiple measures in assessing the performance of the overall economy. Neither doctor nor economist, however, can evaluate well-being by only looking at a single measure; each must make sense of a wide range of indicators in making their appraisals.
A critical gauge of the health of the economy is the unemployment rate. The symptoms of an economy suffering from high unemployment include psychological andfinancialhardshipsincurredbyindividualsandtheirfamilies as well as the lost output to the economy. The unemployment rate measures the proportion of the labor force that is out of work. The labor force consists of all civilian adults who are either employed or who are unemployed and are looking for work. The labor force, however, doesn’t include those non-working adults that retire, attend school full time, or who no longer seek employment (McEachern, 2012, 142-3). Looking solely at changes in unemployment rate therefore provides an incomplete picture because it fails to account for changes in the number of those outside of the labor force.
In addition to the unemployment rate, economists also consider the labor force participation rate in their analyses. The labor force participation rate (LFPR) is the share of working-age adults that are in the labor force. The LFPR

CWERB Economic Indicators Report - Central Wisconsin 11
reached a relatively recent historical peak of 67.3% in 2000 but has been steadily declining ever since with it currently standing at 62.9%.
The labor force participation rate is important because it partially accounts for an economy’s productive capacity; the lower the labor force participation rate, all things equal, the lower the capability of the economy to produce goods and services (McEachern, 2012, 144). Declining labor force participation means that employers often have a difficulttimefindingworkersduringeconomicexpansions.In addition, the longer potential workers stay out of work, the more likely their skills will become obsolete. Other negative effects of a low LFPR include reductions in the tax base and increases in social spending which exacerbate anation’sfiscalwell-being.
While retiring baby boomers and increased school enrollment account for most of the decline, Alan Krueger (2017) has found evidence that the opioid epidemic has hadasignificantimpactaswell.ThePrincetonPainSurveyrevealed that 47 percent of prime age men (ages 25-54) who were not in the labor force took pain medication on a daily basis. Approximately two-thirds of these men were taking prescription pain medication. Krueger’s study also findsthat31%ofnon-laborforce(NLF)primeagemenwere using opioid-based medication. All-in-all, Krueger estimates that the increase in opioid prescriptions was responsible for approximately 20% of the decline in the labor force participation rate from 1999 to 2015.
Employer Costs and Lost EarningsIn addition to reducing the number of employees available for hire, the opioid epidemic has imposed substantial costs on employers in other ways. The National Safety Council surveyed and interviewed US businesses that employed 50 or more workers in 2017 regarding their experiences with employees who used prescription pain medication. More than 70 percent had been affected by prescription drugs. Thirty nine percent reported that prescription drug use led to increases in absenteeism. In addition, 29 percent of employers cite that the abuse of prescription pain-killers has reduced the performance of the workers with 15 percentfindingthattheycontributedtoworkplaceaccidentsand injuries (Hersman, 2017). Employers also report that isbecomingmoredifficulttofindjobcandidatesthatcanpass drug tests and that turnover has increased dramatically because of the epidemic. In addition, employees who abuse opioids have double the healthcare costs relative to non-abusers (Saraiva, Laya, & Smialek, 2017).
Altarum,anon-profithealthsystemresearchorganization,has published several studies diagnosing the economic costs of opioid abuse in the United States. Altarum
estimated the lost wages and productivity arising from overdose fatalities, non-fatal productivity decreases, and incarceration for 2016 (Rhyan, 2017, 2). The total costs in lost wages and productivity reached $40 billion in 2016. The table below breaks down the both the individual and private sector losses as well as the reduction in government tax revenues at the federal, state, and local levels
Table 1: 2016 Lost Earnings and Productivity (in billions)Event Individual
& Private Sector Losses
Lost Federal Tax Revenues
Lost State Tax Revenues
Lost Local Tax Revenues
Overdose Fatalities $31.1 $8.2 $2.2 $1.7
Incarceration $0.9 $0.2 $0.1 $0.1
Nonfatal Productivity
$8.1 $2.1 $0.6 $0.4
Total $40.0 $10.6 $2.8 $2.2
The loss in future productivity from opioid overdose fatalities averaged $800,000 on a per capita basis (with 41 being the average age of the victim). “The average lost productivity per death and number of deaths has increased substantially due to the opioid epidemic transitioning away from overdoses in the older population using prescription opioid pills towards overdoses in younger users of illicit drugs like heroin and fentanyl” (Rhyan, 2017, 2).
Other Societal CostsFlorence et. al. (2016) estimated the total health care and substance abuse treatment costs from the opioid epidemic reached $29 billion in 2013. More recently, costs associated with emergency room visits and in-patient hospital services from overdoses alone was $12.2 billion in 2016 with Medicaid and Medicare covering $8.5 billion of these costs. Indirect costs such as diseases related to addiction like neonatal abstinence syndrome, tuberculosis, and hepatitis summed to $9.2 billion (Rhyan, 2017, 2 – 3).
The epidemic has also dramatically increased costs in the areas of criminal justice, education and social services like child and family assistance. Costs associated with police protection, corrections and incarceration, judicial and legal administration, and property losses amounted to $7.5 billion in 2016. The increased need for child and family assistance associated with higher rates of child neglect raised spending on these services by $6.1 billion. Education expenses increased by $4.4 billion (Rhyan, 2017).
As troubling as these numbers are, these estimates vastly underestimate the total costs from the opioid epidemic. They exclude the enormous emotional costs borne by family members and friends of victims as well as the social deterioration from a loss of community in areas where the
Rhyan, 2017, 2

12 CWERB Economic Indicators Report - Central Wisconsin
epidemic is concentrated. By focusing on lost productivity and earnings, these estimates fail to consider the full value of lives that are lost to the epidemic (Rhyan, 2017). Federal agencies, for example, use the “value of statistical life” in theircost-benefitanalysesofnewpoliciesandregulations.“Such valuations are typically based on how individuals trade off wealth for reduced mortality risks” (CEA, 2017, 3). Using such an approach, the Council of Economic Advisers (2017) estimated that opioid-related overdose fatalities accounted for close to $432 billion in fatality costs in 2015. Adding non-fatality costs, the CEA estimated total costs from the opioid crisis reached $504 billion or approximately 2.8 % of GDP in 2015 (CEA, 2017)!
Demand-Side Factors In analyzing the opioid crisis, it is important to understand why people over the last 20 years have been more willing to consume opioids. In other words, why has the demand for these drugs increased over time?
Economic DespairPrinceton economists Anne Case and Nobel Prize winner Angus Deaton have explored the rise in middle-age mortality rates among white non-Hispanic Americans since 2000. This unprecedented increase in mortality rates represents a clear break from the past in which rates have consistently declined over time for all racial and ethnic groups.TheproblemseemstobeconfinedtoAmericanwhites as mortality rates have been declining in other wealthy nations (e.g. Canada, United Kingdom, Germany, Sweden, and Australia) at an average rate of 2% annually (Case and Deaton, 2017).
As the graph below shows, the middle age (Age 50-54) mortality rates for black non-Hispanic and Hispanic Americans (BNHs) have continued to decline over this time period. The increase in mortality for white non-Hispanics
Figure 1. All-Cause Mortality by Race and Ethnicity for Age 50-54, 1999-2015
(WNHs) has largely been concentrated in individuals with a high school education or less and is now 30% higher than black non-Hispanics.
Not only are American white non-Hispanics the only group experiencing increasing mortality rates, Figure 2 shows that the overwhelming cause of the higher rates is what Case and Deaton call “deaths of despair,” namely fatalities from alcohol and drug poisonings, suicides, alcohol liver diseases, and cirrhosis (Case and Deaton, 2015, p. 15079). These “deaths of despair” overwhelmed the progress made from declines in heart disease and cancer as causes of mortality.
Figure 2. Mortality by cause, white non-Hispanics ages 45-54
Case and Deaton (2017) conjecture that the dramatic increases in mortality for less educated, middle aged whiteslargelyreflectthedecliningeconomicfortunesof this population since the early 1970s. Globalization, technological change, and other economic shocks have led to increasing unemployment and falling real incomes for people who don’t have a college degree with each subsequent generation doing worse than the previous one. The authors provide a narrative of “cumulative disadvantage from one birth cohort to the next – in the labor market, in marriage and child outcomes, and in health – is triggered by progressively worsening labor market opportunities at the time of entry for whites with low levels of education” (Case and Deaton, 2017, 397). Concomitant with worsening economic conditions and deaths of despair are a host of indicators like higher rates of morbidity, out-of-wedlockbirths,anddivorcethatrevealsignificantsocial
Case & Deaton, 2017, 402
Case & Deaton, 2015, 79

CWERB Economic Indicators Report - Central Wisconsin 13
deterioration. “Mortality rate increases varied in different parts of the country in the period 1999-2015. Of the nine census divisions, the hardest hit was East South Central (Alabama, Kentucky, Mississippi, and Tennessee) which saw mortality rates rise 1.6 percent a year on average for WNHs age 50 – 54, increasing from 552 to 720 deaths per 100,000 during this period” (Case and Deaton, 2017, 413).
Case and Deaton (2017) view the opioid epidemic as just one cause of the increase in mortality rates. They provide a narrative that characterizes opioid abuse as a symptom of the underlying despair felt by this population. “Although we do not see the supply of opioids as the fundamental factor, the prescription of opioids for chronic pain added fueltotheflames,makingtheepidemicmuchworsethanitotherwise would have been” (Case and Deaton, 2017, 399).
Other StudiesTwo studies have shown that the level of regional unemployment has had an impact on the use of illegal drugs.Carpenter,McClellan,andRees(2017)findasignificantandpositiverelationshipbetweenstateunemployment rates and the illicit use of opioids including prescriptiondrugsandheroin(p.64).TheirresultsconfirmCase and Deaton (2017) by showing that the rates of analgesic disorders are countercyclical and are “driven by men, whites, lower educated individuals, and prime aged adults (31 – 64 years old)…” (Carpenter, McClellan, and Rees, 2017, 70). Using county level data, Hollingsworth, Ruhm, and Simon (2017) found that a one percent increase in the unemployment rate increased opioid-related mortality rates by 3.6% and increased opioid-related emergency room visits by 7.0% (p. 222). These authors similarly found that mortality rates among whites were much higher than other racial or ethnic groups.
Pierce and Schott (2016) provide evidence that changes in trade policy have contributed to increasing mortality rates in those counties most impacted by those policies. In October 2000, the United States granted Permanent Normal Trade Relations (PTNR) to China which effectively eliminated the annual renewals of trading relationship status and the threat of tariff increases on Chinese imports into the United States. By lowering tariff rates and reducing the level of uncertainty, trade liberalization “differentially exposed U.S. counties to increased international competition via their industry structure” (p. 1). Those counties most impacted experienced loss in employment, concentrated in the manufacturing sector and higher mortality rates from causes, like suicide and illicit drug overdoses that are associated with loss of employment. For these counties, the authors estimate that increased competition from Chinese imports led to a 27.7% increase in poisonings relative to the rate in 2000, before PTNR
was implemented (Pierce and Schott, 2016, 14). Consistent withthefindingsfromCaseandDeaton(2016),theauthorsfound that the increase in poisonings and suicides were concentrated among whites.
Age and Cohort EffectsThestudiessofarhaveidentifiedeconomiccausesbehindthe increasing mortality rates for middle-aged white non-Hispanics. One study shows that individuals born between 1947 and 1964 (aka the Baby Boomers) demonstrated the greatest risk for prescription opioid overdose than any other cohort (Huang, Keyes, & Li, 2018). The reason may have more to do with cultural values of the baby boom generation than economic despair. The baby boomers have shown a greater proclivity to experiment with drugs (both legal and illegal) than other generations. Stephen Pinker notes that “opioid overdoses are largely an epidemic of the druggy Baby Boomer cohort reaching middle age. The peakageofpoisoningdeathsin2011wasaroundfifty,upfrom the low forties in 2003, the late thirties in 1993, the early thirties in 1983, and the early twenties in 1973. Do thesubtractionsandyoufindthatineverydecadeit’sthemembers of the generation born between 1953 and 1963 who are drugging themselves to death” (Pinker, 2018, 184). When it comes to heroin overdoses, however, Huang et al. (2018)findthatindividualsbornbetween1979and1992have been at greatest risk.
Supply-Side FactorsOther economists have focused on the increasing availability of opioids (both prescription and illicit) combined with changes in medical practices as primary causes of the epidemic.
Regional Variation in Opioid Prescription RatesKrueger(2017)hasidentifiedsignificantdifferencesinopioid prescription rates across different regions in the United States. “The average quantity of opioids prescribed per capita varies by a factor of 31 to one in the top 10 percent of counties relative to the bottom ten percent of counties, according to CDC data” (Krueger, 2017, 33). The stark differences in prescription rates far exceed the differences in health outcomes across counties. Krueger also found that there is a positive correlation between prescription rates and the use of pain medication at the county level. On a per-capita basis, a ten percent increase in the amount of opioids prescribed is correlated with a two percent increase in the proportion of people who report taking pain medication on a daily basis (Krueger, 2017, 34). While the direction of causation is ambiguous, Krueger found areas with higher prescription rates to be associated with lower rates of labor force participation.

14 CWERB Economic Indicators Report - Central Wisconsin
Changes (and Differences) in Prescribing Behavior among PhysiciansThe 1990s witnessed a sea change in the attitude among many doctors regarding the treatment of pain. Physiciansincreasinglyconsideredpaina“fifthvitalsign” that required their medical attention. Pharmaceutical companies, meanwhile, aggressively promoted new brands of opioid painkillers like OxyContin. Greater time pressures combined with the increased reliance on “patient-satisfaction surveys” in evaluating performance induced many physicians to adopt more liberal prescribing practices. These practices created an “excess medication” problem in which prescribed painkillers were often diverted to non-patients who would abuse them. By the early 2000s, pain clinics emerged in states like Ohio and Florida where less than scrupulous physicians prescribed and distributed opioids on a cash-basis only (Satel, 2017, 6-7).
Despite the trend toward more liberal prescribing practices, thereremainsignificantdifferencesamongphysicianswithrespect to prescribing painkillers. Schnell and Currie (2017) analyze the relationship between physicians’ educational backgrounds and their opioid prescription practices. Their study shows that physicians who graduated from the lowest ranked medical schools prescribe close to three times as the amount of opioids compared to physicians from top-ranked programs.Thefigurebelowshowsthenumberofannualopioid prescriptions per physician based on their school’s rank relative to Harvard, the highest ranked medical program.
Figure 3: Opioid Prescriptions by Medical School Rank
The relationship between medical school rank and opioid prescription rates even persisted among physicians in the same specialty who practiced in the same county. The authors estimated that if general practitioners “prescribed like those from the top ranked school, we would have had 56.5% fewer opioid prescriptions and 8.5% fewer
deaths over the period 2006 to 2014” (Schnell and Currie, 2017, 3). These differences in prescribing practices among physicians encouraged “doctor shopping” in which patients patronize numerous physicians to receive multiple prescriptions for the same condition (Mallat, 2017, 2).
Introduction of Medicare, Part DUndertheMedicareDrugBenefitProgram(PartD),Medicare recipients are now eligible to receive voluntary coverage for prescription drugs. The program’s introduction in 2006 dramatically decreased prescription drug costs to senior citizens. Powell, Pacula, and Taylor (2016) claim that the reduction in drug prices had the effect of increasing access to opioid medications to those 65 and older. The increase in supply of opioids to seniors precipitated “spillovers” to other individuals who used opioids for nonmedical reasons. Approximately, “two-thirds of people who report nonmedical use of prescription pain relievers get them from a friend or relative” (Powell, Pacula, & Taylor, 2016, 3). The authors also found that states with a high percentage of elderly people had greater access to opioids because of Medicare, part D. Their “estimates imply that a 10% increase in medical access to opioids leads to a 7.4% increase in opioid-related mortality and a 14.1% increase in substance abuse treatment” (Powell, Pacula, & Taylor, 2016, 6). Much of the increase in opioid abuse was the result of the “diversion” of prescription drugs to non-Medicare recipients who used them for nonmedical purposes.
Changes in the Drug Environment In a recent study, Christopher Ruhm, an economist from theUniversityofVirginia,findsthattheprimarycauseof the recent increase in fatalities from opioid overdoses is an increase in supply of illicit opioids such as heroin and fentanyl. While counties facing economic hardships experienced higher rates of drug-related deaths than more prosperous ones, Ruhm found that economic conditions account for less than ten percent of the difference (Ruhm, 2018,6)Thefigurebelowdecomposesdrug-relatedmortality rates according to whether fatalities were related to the use of opioid analgesics or illicit opioids over the 1999 – 2015 period. Early on, the abuse of prescription painkillers was the dominant cause of fatalities. Around 2010, mortality rates related to abuse of analgesic plateaued while mortality rates from illicit opioids skyrocketed. The rapid increase in mortality rates from all drugs since 2010 is due exclusively to rise in the number (and share) of fatal overdoses from illicit opioids (Ruhm, 2018, 5).

CWERB Economic Indicators Report - Central Wisconsin 15
Figure 4. Drug, Nondrug Suicide and Alcohol (DSA) Mortality Rates
Not only did the number of illicit drug fatalities increase in absolute and relative terms, the composition of the victims changedaswell.Ruhm’sanalysisfindsthatthe“explosivegrowth in illicit opioid death rates after 2010 was accompanied a rising share of drug deaths being accounted for by males and relatively young adults, as well as a faster growth in fatalities involving these drugs for them relative to females and other adults” (Ruhm, 2018, 6). Fatalities from prescription opioids tended to be concentrated among middle-aged adults of both sexes while younger adult males accounted for a disproportionate share of overdoses from heroin and fentanyl.
The differences in the drug of choice between these different age cohorts and the change in the pattern of fatalities suggests that the demand-side “deaths of despair” arguments are misguided, according to Ruhm. “If economic conditions are the primary driver of the drug epidemic, there would be no reason to expect that these shifts in the drug composition to affect the distribution of the demographic groups killed by overdoses. Instead, individuals self-medicating for their ‘despair’ would simply switch to the newly more available types of drugs” (Ruhm, 2016, 5). Ruhm’s analysis suggests that the recent rise in drug mortality is the result of increased availability and lower price of illicit opioids like heroin and fentanyl. The sharp increase in opioid consumption and fatalities strongly suggest that the epidemic is largely a supply-side phenomenon.
From Prescription Opioids to Illicit DrugsAs discussed, the kinds of drugs that have fueled the epidemic have shifted from prescription opioids to illicit drugs like heroin and fentanyl. Approximately 80% of heroin users had originally abused prescription opioids (Kano & Thiruvantahtapuram, 2016). In addition to increases in the supply of illicit drugs (and the resulting lower prices), changes in public policy and new formulations of prescription opioids contributed to this shift. Initiatives designed to curb the abuse of prescription opioids include pain clinic laws, Prescription Drug Monitoring Programs, and abuse deterrent drug formulations (Alpert, Powell, & Pacula, 2017). Evidence suggests that these changes have encouraged some abusers to substitute illicit drugs like heroin for prescription opioids.
The Reformulation of OxyContinMuch of the opioid epidemic can be attributed to the widespread abuse of OxyContin which contains the opioid oxycodone. In its original formulation, OxyContin acted as a time-release drug that provided its users pain relief over an extended period of time. Abusers of OxyContin would crush or dissolve the pills so that the drug could be snorted or injected in its most concentrated form. In 2010, the FDA approved a reformulation of OxyContin that was designed tomakeitdifficultforabuserstocrushordissolvethepills.The introduction of this abuse-deterrent version did have the intended effect of reducing the quantities of OxyContin used for nonmedical purposes with overdose deaths from prescriptionopioidsdecliningforthefirsttimesince1990.Deaths, however, from heroin overdoses tripled between 2010 and 2014 (Alpert, Powell, and Pacula, 2017, 4).
Alpert, Powell, and Pacula (2017) estimate that the reformulation reduced the nonmedical use of OxyContin by approximately 40 percent. States with high rates of OxyContin abuse before the reformulation saw the greatest reductions in OxyContin abuse after reformulation; these states, however, simultaneously saw sharp spikes in heroin deaths. “Each percentage point reduction in the rate of OxyContin misuse due to reformulation leads to 3.1 more heroin-related deaths per 100,000. Extrapolating our estimates to the national trend implies that as much as 80% of the three-fold increase in heroin mortality since 2010 may be due to the OxyContin reformulation” (Alpert, Powell, & Pacula, 2017, 5-6). These results suggest that a significantnumberofprescriptiondrugabusersswitchedtoheroin after OxyContin’s reformulation.

16 CWERB Economic Indicators Report - Central Wisconsin
Prescription Drug Monitoring Programs (PDMPs)The practice of “doctor shopping” greatly expanded the diversion of prescription opioids for illegal, nonmedical purposes. “In 2013, 23.8% of past-year non-medical users reported obtaining opioid pain relievers from at least one doctor, and 46.1% for free from a friend or relative who obtained them from at least one doctor” (Meinhofer, 2017, 3). Physicians, unfortunately, had no way of determining if their patients were engaging in this practice. In response, many states have implemented Prescription Drug Monitoring Programs (PDMPs) as a means of reducing doctor shopping. “PDMPs are electronic databases that collect designated data on controlled substances dispensed within a state, and allow selected healthcare providers,lawenforcementofficials,PDMPadministrators,and other authorized stakeholder to identify consumption patterns that are consistent with doctor shopping” (Meinhofer, 2017, 3-4).
There is evidence that these programs have reduced the levels of prescription opioid abuse. Angelica Meinhofer (2017) found that PDMPs decreased prescription opioid quantities by 9% and also reduced overdose deaths from prescription opioid abuse by 9%. The author also found rather weak evidence that heroin deaths had increased by 12% over the same period (p. 8). In a different study, Justine Mallat (2017) found that nationwide PDMPs accounted for an 8% decrease in oxycodone shipments. She also found that in counties with the highest pre-PDMP oxycodone per capita, that PDMP causes a 47% to 84% increase in criminal incidents involving heroin (pp. 25-6). These results are consistent with drug abusers substituting heroin for prescription opioids.
FentanylWhen discussing the opioid epidemic, it is critical to include fentanyl’s role on the increase of deaths caused byoverdoses.AsdefinedbytheDEA,“Fentanylisanodorless [synthetic] substance considered to be 25 to 50 times more potent than heroin and 50 to 100 times more potent than morphine. Fentanyl is potentially lethal, even at very low levels.” (US Drug Enforcement Administration, 2016). Fentanyl is cheaper, more potent, and easier to transport in high volumes than heroin or cocaine. Illicit drugs such as heroin, cocaine, or counterfeit pills sold on the black market are commonly laced with fentanyl in order to make the product stronger or to compensate for a weak product. Oftentimes the consumer has little or no knowledge if it is laced into their product. Because of its potency, a simple miscalculation of a fentanyl dosage is
much more dangerous than heroin. A study using data from the National Vital Statistics System found that in 2016, 45.9% of opioid related deaths involved synthetic opioids, compared to 14.3% in 2010 (Jones, Einstein, & Compton, 2018).
ConclusionHow can the above economic studies (and economics in general) inform public policy? In addressing the abuse of prescription opioids, Schnell and Currie (2017) recommend that changes in physician education can play an important role in reducing differences in prescribing behaviors among physicians from different educational backgrounds. In addition, initiatives like OxyContin reformulation, PDMPS, and outlawing of pain clinics have reduced the level of prescription opioid abuse (Alpert, Powell, & Pacula, 2017; Mallat, 2017). While there is strong evidence that many nonmedical users switched to illicit drugs like heroin as a result, these policies are likely to be effective in the long-run by reducing current and future abuse of prescription opioids (Alpert, Powell, & Pacula, 2017, 31). Future supply-side policies need to consider substitution responses by those addicted to prescription opioids. A greater offering of treatment options need to be available to help opioid-dependent individuals (Mallat, 2017, 26).
What kinds of public policies should be implemented to address the abuse of illicit drugs like heroin and fentanyl? Economist Tom Wainwright has been critical of the traditional US approach that has focused on reducing the supply of illegal drugs which has had the effect of increasing price.
Demand for drugs is inelastic – that is, when prices rise, people cut consumption relatively little. (Given that most banned drugs are addictive, this isn’t surprising). So even when governments can drive up prices, dealers continue to sell almost as much as they did before - only at higher prices, meaning that the value of the criminal market increases (Wainwright, 2016).
Wainwright recommends the expansion of policies that reduce demand for illegal drugs like drug education, rehabilitation, and treatment programs. “Reducing demand, by contrast, triggers a fall in both the amount consumed and the price paid, cutting into the criminal market on two fronts” (Wainwright, 2016). In addition, these policies tend to be a lot less expensive than the supply-side interventions that often require the use of military resources.

CWERB Economic Indicators Report - Central Wisconsin 17

18 CWERB Economic Indicators Report - Central Wisconsin
References
Altarum. 2018. “Economic Toll of Opioid Crisis in U.S. Exceeded $1 Trillion since 2001,” February 13, Retrieved on 2/21/2018 from https://altarum.org/about/news-and-events/economic-toll-of-opioid- crisis-in-u-s-exceeded-$1-trillion-since-2001
Alpert, A; Powel, D; & Padula, R.L. 2017. “Supply-Side Drug Policy in the Presence of Substitutes: Evidence from the Introduction of Abuse-Deterrent Opioids,” NBER Working Papers No. 23031.
Carpenter, C.; McClellan, C.; and Rees, D. 2017. “Economic Conditions, Illicit Drug Use, and Substance Use Disorders in the United States,” Journal of Health Economics, January, 52: 63-73.
Case, A. and Deaton, A. 2015. “Rising Morbidity and Mortality in Midlife among White non- Hispanic Americans in the 21st Century,” PNAS, December 15, 112(49): 78-83.
__________________. 2017. “Mortality and Morbidity in the 21st Century,” Brookings Papers on Economic Activity, Spring, pp. 397-343.
Center for Disease Control and Prevention. “Opioid Basics,” Retrieved on May 1, 2018 from https://www.cdc.gov/drugoverdose/opioids/index.html
Council of Economic Advisers. 2017. “The Underestimated Cost of the Opioid Crisis,” November 20, from http://www.whitehouse.gov/cea
Evans, W; Lieber, E.; and Power, P. 2017. “How the Reformulation of OxyContin Ignited the Heroin Epidemic,” NBER Working Paper No. 24475, April 2018.
Florence, C.S; Zhou, C; Luo, F; and Xu, L. 2016. “The Economic Burden of Prescription Opioid Overdose, Abuse, and Dependence in the United States, 2013,” Medical Care, October, 54(10): 901 – 6.
Hersman, Deborah. 2017. “How the Prescription Drug Crisis is Impacting American Employers,”http://www.nsc.org/NewsDocuments/2017/Media-Briefing
Hollingsworth, A.; Ruhm, C.; and Simon, K. 2017. “Macroeconomic Conditions and Opioid Abuse,” Journal of Health Economics, August, 56: 222-233.
Huang, X.; Keyes, K.; and Li, G. 2018. “Increasing Prescription Opioid and Heroin Overdose Mortality in the United States, 1999-2014: An Age-Period-Cohort Analysis,” American Journal of Public Health, January 1, pp. 131-136.
Justin, R., and Schott, P. 2016. “Trade Liberalization and Mortality: Evidence from U.S. Counties,” Finance and Economics Discussion Series 2016-094. Washington: Board of Governors of the Federal Reserve System, https://doi.org/10.17016/FEDS.2016.094
Jones, C. M., Einstein, E. B., & Compton, W. M. (2018, May 1). Changes in Synthetic Opioid Involvement in Drug Overdose Deaths in the United States, 2010-2016. JAMA, 319(17), 1819-1821.
Kano and Thiruvanathapuram. 2016. “Opioids: The Problem of Pain,” The Economist, May 28.

CWERB Economic Indicators Report - Central Wisconsin 19
Krueger, Alan. 2017. “Where Have All the Workers Gone? An Inquiry into the Decline of the U.S. Labor Force Participation Rate,” Brookings Papers on Economic Activity, BPEA Conference Draft, September 7-8.
Mallat, J. 2017. “The Effect of Prescription Drug Monitoring Programs on Opioid Prescriptions And Heroin Crime Rates,” Perdue University Economics Department Working Paper No. 1292, October 11.
McEachern, William. 2012. Macroeconomics: A Contemporary Introduction, USA: South-Western Cengage Learning.
Meinhofer, Angelica. 2017. “Prescription Drug Monitoring Programs: The Role of Asymmetric Information on Drug Availability and Abuse,” RTI International, Behavioral Health Economics Program.
Pew Charitable Trusts. 2017. “The High Price of the Opioid Crisis,” July, Retrieved on 2/18/2018 from http://www.pewtrusts.org/substancemisuse
Pinker, S. 2018. Enlightenment Now: The Case for Reason, Science, Humanism, and Progress, New York: Viking Press.
Powell, David; Pacula, Rosalie Liccardo; and Taylor, Audrey. 2016. “How Increasing Medical Access to Opioids Contributes to the Opioid Epidemic: Evidence from Medicare Part D,” Rand Bing Center for Health Economics, September, Working Paper WR-1169.
Rhyan,C.2017.“ThePotentialSocietalBenefitofEliminatingOpioidOverdoses,Deaths,and Substance Use Disorders Exceeds $95 Billion per Year,” Altarum, Research Brief, November 16, pp. 1 – 4.
Ruhm, C. 2017. “Geographic Variation in Opioid and Heroin Involved Drug Poisoning Mortality Rates,” American Journal of Preventive Medicine, December, 53(6): 745-753.
_______. 2018. “Deaths of Despair or Drug Problems?” National Bureau of Economic Research, NBER Working Paper Series, January, Working Paper 24188 from http://www.nber.org/papers/w24188
Saraiva, Catarina; Laya, Patricia and Smialek, Jeanna. 2017. “Opioids on the Job are Overwhelming American Employers,” Bloomberg News. September 20. Retrieved on 2/12/2018 from http://www.bloomberg.com/news/articles/2017-09-20/overdosing-on-the- job-opioid-crisis-spills-into-the-workplace
Satel, S. 2017. “Taking on the Scourge of Opioids,” National Affairs, Summer, pp. 3-21 from http://www.NationalAffiars.com.RetrievedonApril27,2018.
Schnell, M; and Currie, J. 2017. “Addressing the Opioid Epidemic: Is There a Role for Physician Education?” National Bureau of Economic Research, NBER Working Paper Series, November, #23645 from http://www.nber.org/papers/w23645
US Drug Enforcement Administration. (2016, April 01). Public Safety Alert from DEA Counterfeit Hydrocodone Tablets Containing Fentanyl. Retrieved April 26, 2018, from US Drug Enforcement Administration: https://www.dea.gov/divisions/sf/2016/sf040116.shtml
Wainwright, T. 2016. “How Economists Would Wage the War on Drugs,” Wall Street Journal, February 20.

20 CWERB Economic Indicators Report - Central Wisconsin
Notes

MISSION AND VISION
The mission of the UWSP Central Wisconsin Economic Research Bureau is to foster economic development by bringing timely economic analysis to our region, focusing on Marathon, Portage and Wood counties.
The mission has been accomplished through the publication of Economic Indicators Reports. These reports are compiled and released for Central Wisconsin.
The CWERB aspires to be Wisconsin’s premier research center focused on regional economic development.
HISTORY
The CWERB is a nonprofit organization founded in October 1983. Its operating budget comes from the private sector and the UWSP School of Business and Economics. The CWERB also represents an important part of the outreach efforts of the UWSP School of Business and Economics.
SOURCES OF FUNDING • UWSP School of Business and Economics• BMO Harris Bank of Stevens Point• BMO Harris Bank of Marshfield• BMO Harris Bank of Wausau • Centergy Inc. of Wausau• Community Foundation of Greater South Wood County - Wisconsin Rapids
SCHOOL OF BUSINESS & ECONOMICS • Enrollment of 1,000 students; More than 30% of our students come from Marathon, Portage and Wood counties; approximately 50% of our graduates stay in the three-county area • The SBE is in the pre-accreditation phase by the Association to Advance Collegiate Schools of Business (AACSB), once completed, SBE will be among the top 18% of all business schools in the world.
CWERB CLIENTELE • Central Wisconsin business firms are the most crucial component in the economic development of our region. Business firms are keenly aware of the important role that informed decision making plays in any developmental strategy.
• Private sector organizations devoted to economic development in Central Wisconsin, such as area chambers of commerce and their affiliated economic development agencies.
• Public sector organizations devoted to economic development in Central Wisconsin.
• The general public, in order to make informed decisions, take advantage of the unbiased information and analysis about the economy.
• The CWERB employs student research assistants which provides an excellent educational setting while also providing the opportunity for students to earn funds toward education. Faculty, staff and students at UWSP utilize the reports and resources of the CWERB.
CWERB ACTIVITIES Research conducted during the last 25 years by CWERB is disseminated through more than 230 publications, media reports and presentations for the Portage, Marathon and Wood counties. Each report provides an analysis of the economy at the national, state and regional levels, and also contains a special section devoted to a topic of economic significance to the Central Wisconsin region. These special topic reports are often written by UW-Stevens Point faculty members and include current topics such as Medicare, debt and deficits and the Central Wisconsin housing market.
The Economic Indicators Reports are presented on a periodic basis by Professor Segura and the author of the special topic report. These reports have received substantial media coverage on a variety of economic matters.
ABOUT THE CENTRAL WISCONSIN ECONOMIC RESEARCH BUREAU

22 CWERB Economic Indicators Report - Central Wisconsin
www.uwsp.edu/busecon/cwerbfacebook.com/uwspsbe