economic impacts of energy efficiency investments in...
TRANSCRIPT

Economic Impacts of Energy Efficiency Investments
in Vermont – Final Report
Prepared for
The Vermont Department of Public Service
by:
Optimal Energy, Inc.
and
Synapse Energy Economics, Inc.
August 17, 2011
Optimal Energy, Inc. 14 School Street 802.453.5100 www.optenergy.com Bristol, VT 05443

Optimal Energy, Inc.
Contents
INTRODUCTION ........................................................................................................................ 1
Overview of the Study .................................................................................................................................1
Overview of Economic Impacts ..................................................................................................................2
Report Structure ...........................................................................................................................................3
SUMMARY OF RESULTS ......................................................................................................... 4
METHODOLOGY ....................................................................................................................... 7
The REMI PI+ Model ..................................................................................................................................7
Cash Flows Captured in the Economic Model ............................................................................................7
Developement of Inputs to the REMI Model ..............................................................................................9
Program and Participant Spending ............................................................................................................ 10
Economic Benefits of Energy Savings ...................................................................................................... 12
Costs to Participants and Ratepayers ......................................................................................................... 14
Net Savings for Participants and Ratepayers ............................................................................................. 16
APPENDIX A: SUMMARY OF DATA SOURCES AND ASSUMPTIONS ................... 17
APPENDIX B: INDUSTRIES USED IN THE REMI MODEL ........................................... 20
Tables
Table 1: Total Economic Impacts of Vermont Energy Efficiency Programs (2011$) .....................................5
Table 2: Leverage of Program Spending .........................................................................................................6
Table 3: Program and Participant Costs (2011$) ........................................................................................... 10
Table 4: Cumulative Gross Benefits from Energy Savings by Type (2012-2031, 2011$) ............................ 13
Table 5: Assumptions for Participant Financing ........................................................................................... 15
Figures
Figure 1. Cash Flow Diagram of Vermont’s Energy Efficiency Investment ...................................................8
Figure 2. Mapping Equipment and Labor Investments to REMI Industries .................................................. 11
Figure 3. Distribution of Program and Participant Spending by Industry ..................................................... 12
Figure 4. Participant and Ratepayer Gross Benefits on Energy Expenses by Year ....................................... 14
Figure 5. System Benefit Charge Collections by Sector (2011$) .................................................................. 15
Figure 6. Net Savings, Gross Savings and Costs by Year (2011$) ........................................................... 16
Optimal Energy, Inc. 8/17/2011 1
INTRODUCTION
OVERVIEW OF THE STUDY
The goal of this study is to quantify the economic impacts of Energy Efficiency Utility
investments in Vermont. The results are based on the 2012 budgets for energy efficiency
spending proposed by the Department of Public Service (DPS), including:
$40.1 million for electric energy efficiency to be performed by Efficiency
Vermont (EVT) and Burlington Electric Department (BED), funded by the
energy efficiency charge on ratepayers’ electric bills, and
$5.4 million for Heat and Process Fuels (HPF) efficiency to be performed by
EVT, funded by revenues from the Regional Greenhouse Gas Initiative
(RGGI) and the Forward Capacity Market (FCM).1
This study estimates the impact of this single year of additional energy efficiency spending
on the State’s economy in comparison to having no spending for energy efficiency programs in
that year. Actual adopted budgets may differ somewhat from these values but not to a degree
that would substantially change the study’s findings regarding the economic effects per dollar
of spending.
The main spending categories associated with the efficiency programs include:
the total outlays for installed efficient equipment and practices (relative to the
baseline of standard-efficiency equipment and practices), comprised of two
parts:
- the “out-of-pocket” portion of those costs paid by participants , plus
- the portion of those costs paid by the efficiency programs including any
rebates or other incentives paid to program participants or vendors to
promote the efficiency measures, and
other program spending for administration, marketing, technical assistance,
and related expenses.
The installation of efficient equipment and practices due to Vermont’s efficiency programs
results in savings in electricity, heating and process fuels (mostly oil and propane), water, and
operation and maintenance costs. These savings and their economic benefits continue for as
long as the efficiency measures are operational, which can be up to 20 years or more for the
most durable measures. In addition, electric rates are affected by reduced demand for
electricity, reduced transmission and distribution expenditures by the State’s utilities, and by
reduced costs for Pooled Transmission Facilities2 and related services provided by the New
England Independent System Operator.
1 The energy efficiency activities of Vermont Gas Systems (VGS) were outside the scope of this project. 2 Pooled Transmission Facilities are generally transmission facilities that operate at 69 kV or higher and which fall
under the authority of the New England Independent System Operator (ISO-NE).
Optimal Energy, Inc. 8/17/2011 2
The results of this study represent the net new economic activity generated by the efficiency
investment: the difference between the amount of economic activity increase associated with
stimulating related commercial services and industries in Vermont and the amount of economic
activity reduction associated with the costs of the efficiency programs. The costs, savings and
economic benefits resulting from the efficiency programs were evaluated by sector (residential,
commercial, industrial) and modeled over the 20-year study period (2012-2031) using the REMI
PI+ economic model, as further described below.
OVERVIEW OF ECONOMIC IMPACTS
The economic impacts of any new activity depend on the extent to which that new activity
affects supporting industries in the region. Economic impacts emanate from:
1. direct economic effects (e.g. spending on goods and services at a construction site or
the purchase of a piece of new equipment), and
2. multiplier effects which include
a. spending on supporting goods and services by the firms providing that direct
activity (“indirect” impacts), and
b. re-spending by workers of their wages or disposable income from savings or
costs to households (“induced” impacts).
In general, energy efficiency investments create net positive economic impacts in a given
region3. In other words, usually more jobs are created through these projects than are lost by the
activities they displace, such as electric generation or the sale of fuel oil, or spending on other
goods and services rather than paying more for efficient equipment. This net positive impact is
due to the fact that participants save money on their energy bills, and usually more of the
dollars spent on energy efficiency remain in the local economy than dollars spent on
“traditional” electric generation or fossil fuel purchases. Energy efficiency is also a more labor-
intensive activity than typical generation or fuel sales, so for any given amount of efficiency
spending, more local jobs are created than lost by reducing spending on electric generation. The
size of that net impact depends on how the region is defined, the amount of energy savings, and
how much of the spending by each affected industry remains within that given region.
The range of economic impact results from a new economic activity depends on the metric
used to express that impact. This report provides estimates of two economic multipliers for the
energy efficiency program evaluated. One is the ratio of change in Gross State Product (GSP) to
the program spending. The other is the ratio of change in wage income to the program
spending. Arguably, the most useful measure is net job-years created per million dollars in program
spending. This measure represents the change in employment in the region due to the program’s
3 Economic Impacts and Potential Air Emission Reductions from Renewable Generation & Efficiency Programs in New
England, prepared for the Regulatory Assistance Project by Synapse Energy Economics, April 2005.
Optimal Energy, Inc. 8/17/2011 3
total spending.4 For studies that only capture the direct jobs associated with energy efficiency,
the results show between three and ten job-years per million dollars in program spending
(depending on program type and the specific region).5 When including total economic impacts
(direct, indirect and induced activity) the impacts are much higher, as with this study which
shows an estimated impact of 43 job-years per million dollars.
The findings of this report are consistent with other recent studies on the economic impacts
of efficiency investments. A report for Environment Northeast showed impacts between 36 and
60 job-years per million dollars spent (depending on the state) due to energy efficiency.6 One
study in Wisconsin showed between 75 and 250 job-years per million dollars over 25 years
(depending on the program type).7
REPORT STRUCTURE
The following section of the report provides a summary of the results of the economic
modeling, after which we provide a detailed explanation of the study methodology. Appendix
A provides a summary of the data sources and assumptions used in the study. Appendix B then
provides a description of the industries (goods and services categories) used in the economic
model. Unless otherwise stated, all tables and figures are the product of Optimal Energy and/or
Synapse Energy Economics.
4 Unlike other indicators discussed below, this number is not a typical economic multiplier since the denominator
(program spending) does not include participants’ out-of-pocket spending on energy efficiency. 5 Energy Efficiency Services Sector: Workforce Size and Expectations for Growth, Ernest Orlando Lawrence Berkeley
National Laboratory, September 2010. (http://eetd.lbl.gov/ea/emp/reports/lbnl-3987e.pdf) 6 Energy Efficiency: Engine of Economic Growth, Environment Northeast, and EDR Group, October 2009. 7 Focus on Energy Evaluation, State of Wisconsin Public Service Commission, March 2010, PA Consulting and EDR
Group.

Optimal Energy, Inc. 8/17/2011 4
SUMMARY OF RESULTS
Energy efficiency generates economic activity throughout Vermont in the form of purchase
and installation of energy efficiency goods and services, administration of the program itself,
and net energy savings to ratepayers and participants. Households that participate in the
program save on energy costs and, therefore, can spend additional money in the local economy,
spurring job growth. Businesses have lower energy costs that improve their bottom-line, which
enables them to be more competitive and to expand production and related employment. The
investment in efficiency in itself also generates economic activity to the extent that the
equipment is produced, sold, installed or maintained by Vermont businesses.
These efficiency investments also cost participants money for their part of the efficient
equipment and installation costs. Further, all ratepayers participate in funding the program.
These costs are taken into account in our analysis in that participants are negatively affected
through their additional spending on the energy efficiency goods and services (constricting
their ability to spend elsewhere), and all ratepayers are negatively impacted by the inclusion of
energy efficiency program costs on their energy bills. These negative impacts offset part of the
positive impacts from savings and investment.
Table 1 shows the resulting net economic impacts in terms of job-years of employment (the
equivalent of one full-time job for one year), personal income, Gross State Product (GSP),8 and
output (i.e., business sales). Program operations for the year 2012 are estimated to generate a net
increase of nearly 1,900 job-years and $220 million in GSP in Vermont over 20 years. The largest
impact year is 2012 itself, since this is when new equipment and installation are purchased.
Some participants pay for these investments in one lump sum while others that seek financing
begin paying them off over time. In the following years, positive net benefits continue due to
energy cost savings to participants and price effects that occur for all ratepayers.
If the analysis considers the separate impacts from electricity efficiency and heating process
fuels (HPF) programs, the latter is responsible for around one-sixth of the total first year
employment impacts or 65 job-years. The “All Years” employment impact for HPF is slightly
higher (85 job-years). Therefore, most of the employment impacts from heating fuel programs
are felt in the first year due to the purchase and installation of new heating efficiency
equipment. In reviewing the HPF results, it should be noted that the HPF program is in its early
stages and currently has limited funding. The limited funding leads to a limited amount of
savings associated with lower heating bills over the life of efficiency measures, and thus the
investment has modest impact over the long term. Also, since use of heating fuel will decrease,
the positive impacts from savings are partially counteracted by the loss in activity from heating
fuel distribution and delivery services. Limited funding also leads to a higher percentage of the
budget allocated to administrative costs than what is likely to be allocated over larger budgets
(economies of scale reduce administrative costs). In addition, because the program is in its early
stages, it is likely that ramp up costs – including initial program design and development – limit
8 The Gross State Product (GSP) captures the additional value-added activity produced in Vermont. It generally
refers to the additional wage income, plus the additional profits of production and services in Vermont.

Optimal Energy, Inc. 8/17/2011 5
the amount of fuel savings. Thus, a continued and/or increased investment in thermal efficiency
is likely to increase the economic benefit ratio for this sector.
Table 1: Total Economic Impacts of Vermont Energy Efficiency Programs (2011$)
Impact Type 2012 All Years
Elec. HPF Total Elec. HPF Total
Jobs (job-years) 305 65 370 1,808 85 1,894
Personal Income (million) $11.3 $2.5 $14 $96 $1.9 $98
Gross State Product (million) $11.5 $2.2 $14 $215 $4.7 $220
Output (million) $17 $5 $22 $344 $7 $351
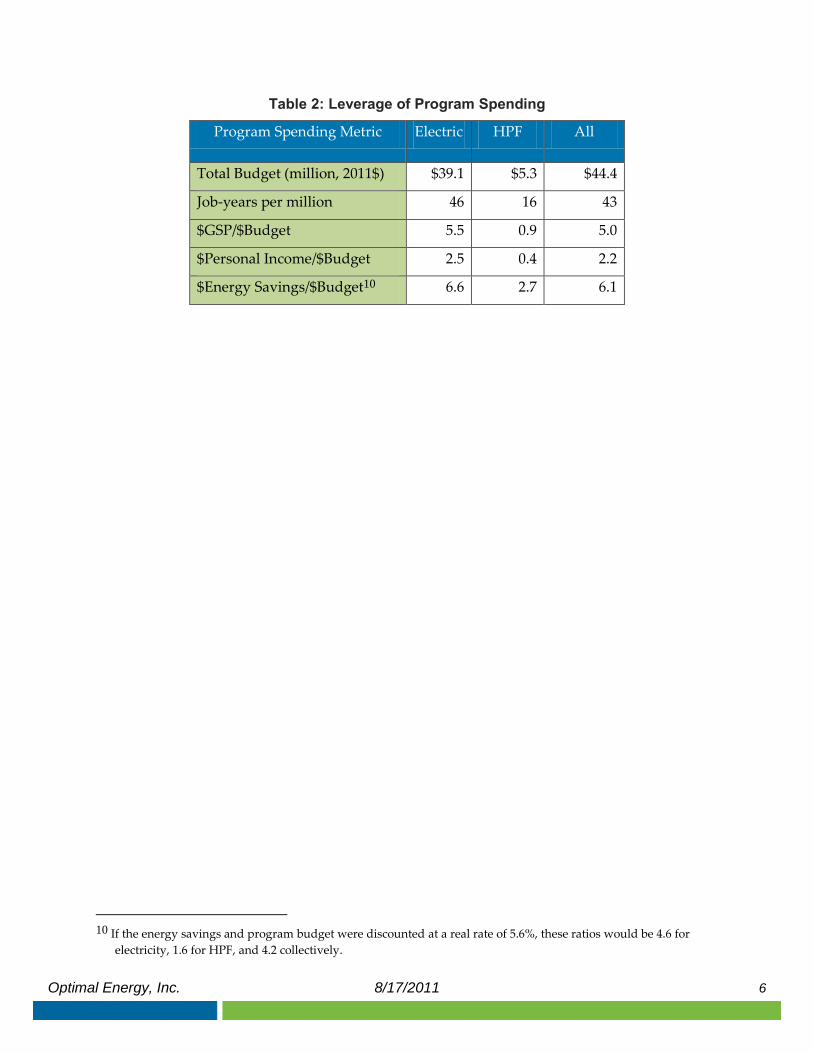
Another perspective for measuring the efficacy of the programs is to present the impacts as
value produced per dollar of program spending, as shown below in Table 2 for the planned
2012 energy efficiency program budget of $45.5 million ($44.4 million in 2011 dollars).9 Dividing
the economic impacts above by that amount shows that this one-year investment creates a net
gain of 43 job-years per million dollars of program spending and a net increase of nearly five
dollars of cumulative Gross State Product (GSP) for every dollar spent. This impact is largely
due to the electricity program which creates 46 job-years per million dollars of program
spending and a ratio of over five for GSP impacts compared to the budget ($39.1 million).
Heating and process fuels (HPF) program exhibits much lower impacts per dollar since fewer of
the associated equipment is produced in-state and its energy savings are small compared to the
electricity program. Another important metric is personal income. For every dollar of program
spending, an additional two dollars is generated in Vermonters’ income over 20 years. In terms
of gross energy savings, the programs create over six dollars for every dollar spent on the
program. These impacts take on more significance when we consider that Vermont’s energy
efficiency programs will continue to operate for multiple years, compounding these net
benefits.
9 Values in the report have not been discounted for the future value of money unless otherwise stated. Impacts were
modeled using 2011 constant dollars (2011$). Therefore, 2012 dollars are adjusted downwards assuming a 2.6%
long-term inflation rate to calculate “job-years per million dollars” and the two multipliers. The program
spending refers to dollars funded from the efficiency charge to ratepayers and from RGGI and FCM revenues.
Optimal Energy, Inc. 8/17/2011 6
Table 2: Leverage of Program Spending
Program Spending Metric Electric HPF All
Total Budget (million, 2011$) $39.1 $5.3 $44.4
Job-years per million 46 16 43
$GSP/$Budget 5.5 0.9 5.0
$Personal Income/$Budget 2.5 0.4 2.2
$Energy Savings/$Budget10 6.6 2.7 6.1
10 If the energy savings and program budget were discounted at a real rate of 5.6%, these ratios would be 4.6 for
electricity, 1.6 for HPF, and 4.2 collectively.

Optimal Energy, Inc. 8/17/2011 7
METHODOLOGY
THE REMI PI+ MODEL
We used the PI+ model developed by REMI (Regional Economic Models Inc.) to estimate the
economic impacts of Vermont’s energy efficiency programs. This model is used throughout the
US, including by many state and federal government agencies. The model is dynamic and
sophisticated, capturing structural changes in the regional economy that result from a direct
stimulus.
REMI has built-in baseline forecasts of economic activity that are calibrated to each study
region (in this case the State of Vermont). Changes to economic activity represent “policy
changes” that affect the trajectory of the state economy—in this study this includes changes to
consumer spending, businesses’ energy costs, and additional commercial activity and industry
demand related to energy efficiency investments. The model results show the difference in
these alternative forecasts from the original baseline, representing what is expected to occur in
the future over and above what would have occurred in the State’s economy absent any
changes in policy.
CASH FLOWS CAPTURED IN THE ECONOMIC MODEL
The economic modeling through REMI takes into consideration all of the changes in cash
flow due to the funding and activities of the efficiency programs. Inputs to the REMI model fall
into three broad categories:
Program and Participant Spending – Efficiency investments have an
economic impact from equipment that is produced within the region and to
the extent that local contractors are installing the equipment. These
investments are comprised of both participant costs and incentives
contributed by the program administrators. The program also requires
spending on administration and overhead to operate.
Participant net energy savings. While users have to invest in upgrades or
equipment at the outset, savings start to accrue after these costs have been
offset (usually several years after installation) and continue throughout the
efficiency measure’s useful life. Households take these savings and spend a
portion on other goods further stimulating the local economy. Businesses
have lower costs, freeing up capital for investment and improving
competitiveness. Types of savings include energy (electricity, natural gas,
heat and process fuels), water, operations and maintenance, and savings due
to the deferred replacement of old equipment.
Ratepayer Effects. All ratepayers are affected by the adoption of energy
efficiency programs. The program is funded by all customers, who pay a
Systems Benefits Charge (SBC) as a percentage of their electric bill.
Counteracting this additional expense is the downward pressure on energy
prices due to decreased demand for energy in Vermont. Specifically, impacts

Optimal Energy, Inc. 8/17/2011 8
due to Demand Reduction Induced Price Effect (DRIPE), utility avoided
costs, and avoided contributions to Pooled Transmission Facilities (PTFs)
managed by the New England Independent System Operator (ISO-NE).
Energy efficiency investments are modeled in REMI as transfers of money from one party to
another (from ratepayers to various industries in and out of state), whereas savings due to
investments are modeled as increased discretionary spending for residents and lower energy
costs for businesses that participate. Both are considered cash flows. To conceptualize the
interactive effects of these cash flows (in the way that REMI does), it is useful to look at an
illustration. Figure 1 represents the various cash flows and how they relate, with explanations
provided below the figure.
Figure 1. Cash Flow Diagram of Vermont’s Energy Efficiency Investment
Program Administrator
RGGI/FCM
Elec. Utility
EE Investment(Incl. EE Equip. &Labor to install)
5
3
DRIPE
PTF
Fixed Cost Recovery8
1
6
7
9
10
4
Program Overhead
2
Non-Participants
Participants
Ratepayers
1. Payments by electric ratepayers via their electric bills.
2. The surcharge on electric bills collected to fund electric energy efficiency programs (EVT
and BED).
3. Allowance auction revenues provided to the Heat and Process Fuels (HPF) program
administrator (Efficiency Vermont) from the Regional Greenhouse Gas Initiative (RGGI),
and revenue provided to EVT for demand resources from the Forward Capacity Market
(FCM).
4. Payments to EVT and BED for program administration, core supporting services, and
other non-incentive costs used to deliver the energy efficiency programs.
5. The incremental cost of energy efficient equipment, above the cost of baseline
equipment, paid by those installing the efficient equipment due to the efficiency
programs.
Optimal Energy, Inc. 8/17/2011 9
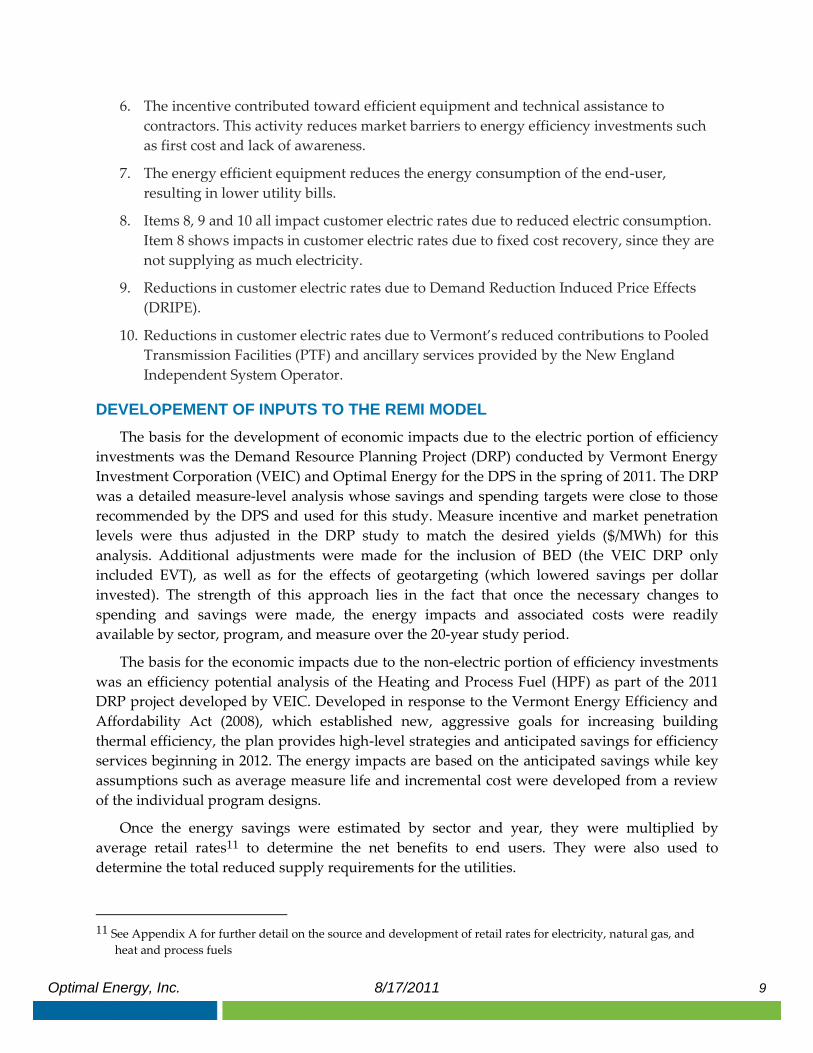
6. The incentive contributed toward efficient equipment and technical assistance to
contractors. This activity reduces market barriers to energy efficiency investments such
as first cost and lack of awareness.
7. The energy efficient equipment reduces the energy consumption of the end-user,
resulting in lower utility bills.
8. Items 8, 9 and 10 all impact customer electric rates due to reduced electric consumption.
Item 8 shows impacts in customer electric rates due to fixed cost recovery, since they are
not supplying as much electricity.
9. Reductions in customer electric rates due to Demand Reduction Induced Price Effects
(DRIPE).
10. Reductions in customer electric rates due to Vermont’s reduced contributions to Pooled
Transmission Facilities (PTF) and ancillary services provided by the New England
Independent System Operator.
DEVELOPEMENT OF INPUTS TO THE REMI MODEL
The basis for the development of economic impacts due to the electric portion of efficiency
investments was the Demand Resource Planning Project (DRP) conducted by Vermont Energy
Investment Corporation (VEIC) and Optimal Energy for the DPS in the spring of 2011. The DRP
was a detailed measure-level analysis whose savings and spending targets were close to those
recommended by the DPS and used for this study. Measure incentive and market penetration
levels were thus adjusted in the DRP study to match the desired yields ($/MWh) for this
analysis. Additional adjustments were made for the inclusion of BED (the VEIC DRP only
included EVT), as well as for the effects of geotargeting (which lowered savings per dollar
invested). The strength of this approach lies in the fact that once the necessary changes to
spending and savings were made, the energy impacts and associated costs were readily
available by sector, program, and measure over the 20-year study period.
The basis for the economic impacts due to the non-electric portion of efficiency investments
was an efficiency potential analysis of the Heating and Process Fuel (HPF) as part of the 2011
DRP project developed by VEIC. Developed in response to the Vermont Energy Efficiency and
Affordability Act (2008), which established new, aggressive goals for increasing building
thermal efficiency, the plan provides high-level strategies and anticipated savings for efficiency
services beginning in 2012. The energy impacts are based on the anticipated savings while key
assumptions such as average measure life and incremental cost were developed from a review
of the individual program designs.
Once the energy savings were estimated by sector and year, they were multiplied by
average retail rates11 to determine the net benefits to end users. They were also used to
determine the total reduced supply requirements for the utilities.
11 See Appendix A for further detail on the source and development of retail rates for electricity, natural gas, and
heat and process fuels

Optimal Energy, Inc. 8/17/2011 10
PROGRAM AND PARTICIPANT SPENDING
The energy efficiency program requires significant resources to operate but these
expenditures also induce economic activity for industries and services that operate in Vermont.
Firstly, the program calls upon technicians, administrators, and other professionals to operate.
Secondly, participants in the program must purchase efficient equipment and install them in
their home or business. These purchases include more efficient appliances, light bulbs, furnaces,
etc., some of which must be installed by professional contractors.
Table 3 below shows the one year spending of $67.1 million on program administration,
equipment, and installation. The program overhead and delivery cost (including technical
assistance, marketing, and administrative costs) is $23.3 million.12 The investments in
equipment and installation total $43.8 million, of which some is covered by financial incentives
($21 million) to purchase efficient equipment; participants then pay the remainder of the costs
of investment “out-of pocket” ($22.7 million).
Table 3: Program and Participant Costs (2011$)
Spending Category $Million
Total Equipment and Installation $43.8
Participant out-of-pocket costs $22.7
Incentives $21.0
Program Delivery/Administration $23.3
Total Program and Participant Spending $67.1
This activity creates an initial stimulus in the local economy for the first year of the
program’s operation. Moreover, this stimulus is only felt by a handful of industries, namely
those associated with energy efficient equipment and its installation. The magnitude of the
impact felt by each industry depends on the total incremental cost associated with a given
industry’s corresponding equipment/services, and the amount purchased. The process of
matching equipment with industries was, with a few exceptions, based on the equipment’s end-
use. A more granular, measure-level approach could not be taken due to the limited set of
industries in the REMI model (e.g. Electrical Equipment and Appliance Manufacturing
encompasses both indoor and outdoor lamps and ballasts, as well as household appliances such
as clothes washers and dishwashers). Figure 2 below shows the general mapping of equipment
and labor categories to REMI industries13.
12 Despite the significant positive economic impacts shown in this report, it is important to recognize that these costs,
too, are significant. Efforts should continue to ensure that programs are as efficient as possible, to maximize both
the efficiency savings and economic benefit associated with those savings. 13 See Appendix B for detailed descriptions of the REMI industries.

Optimal Energy, Inc. 8/17/2011 11
Figure 2. Mapping Equipment and Labor Investments to REMI Industries
Labor Associated with Installation of Equipment
Space Conditioning, Refrigeration, and Water
Heating Equipment
Indoor and Outdoor Lighting, and Kitchen/
Laundry Equipment
Energy Management Systems and Lighting
Controls
Building and Lighting Design Services
Machinery Manufacturing
Electrical Equipment and Appliance Manufacturing
Computer and Electronic Product Manufacturing
Professional and Technical Services
Construction
Non-Incentive Program Costs (incl. NRA, OPS & QPI,
CSS, etc.)
Administrative and Support Services
RE
MI In
du
strie
s
Eq
uip
me
nt a
nd
La
bo
r
NRA = Non-Resource Acquisition. OPS & QPI = Operations and Quantifiable
Performance Indicators, which comprise EVT’s performance incentive. CSS = Core
Supporting Services, mainly marketing and information technology services.
The mapping of equipment and labor categories to REMI industries was conducted on a
program-by-program basis. This was due to the fact that the portion of the incremental cost due
to labor was most easily estimated by program (e.g., labor costs were estimated to be near 0%
for retail products programs, but upwards of 30% for the low-income program).
Figure 3 below shows the proportion of the total investments going to each industry. The
extent of economic impacts depends on the amount of each activity provided in Vermont.
Program administration (professional, technical, administration and support services) and
installation of equipment (construction) were both considered largely in-state activities since the
program is run in Vermont and would most likely call on local contractors for installation.
However, the production of efficient equipment (machinery, computer and electronics,
electronic equipment and appliances) will not all take place in-state. The economic model uses
assumptions for the portion of demand that is provided locally for each of these industries to
ensure that only the local production is counted in Vermont’s economic impact.

Optimal Energy, Inc. 8/17/2011 12
Figure 3. Distribution of Program and Participant Spending by Industry
ECONOMIC BENEFITS OF ENERGY SAVINGS
Participants in the energy efficiency program save by forgoing the purchase of energy and
related expenses that they would have without the program. Over the course of 20 years,
residents and businesses participating in the efficiency programs save over $247 million in
estimated energy-related spending. The savings directly related to the electric efficiency
investments were modeled using Optimal Energy’s Portfolio Screening Tool. Benefits from the
Heat and Process Fuels programs are based on projected spending and savings for 2012
developed by Vermont Energy Investment Corporation (VEIC). Table 4 shows the distribution
of total savings by type of energy spending. Not surprisingly, the majority of savings is
attributed to spending on electricity ($207.6 million, 84%) while the rest is distributed among
heating fuels, water and operations and maintenance savings.
All ratepayers are also subject to the responses of prices due the decreases in energy
demand afforded by participants. In this case, ratepayers experience an initial cost due to
utilities increasing rates to recover fixed costs. However, this force is counteracted by the
savings from reduced transmission from Pooled Transmission Facilities (PTF), and DRIPE
(Demand Reduction Induced Price Effects) which refers to a drop in prices due to the reduction
of demand. This amounts to $25 million in savings due to rate effects, also shown in Table 4. See
Appendix A for the data sources and assumptions for each of these components.
Construction 14%
Machinery 22%
Computer and electronic products
1%
Electrical equipment and
appliance 27%
Professional and technical services
29%
Admin. and support services
7%

Optimal Energy, Inc. 8/17/2011 13
Table 4: Cumulative Gross Benefits from Energy Savings by Type (2012-2031, 2011$)
Energy Spending14
Gross Benefits
(million)
Percent of
participant
savings
Electricity $207.6 84%
Oil, Propane, Kerosene $13.8 6%
O&M $20.1 8%
Water $5.6 2%
Participant Savings $247 100%
Ratepayer Savings15
$25 -
Total Gross Savings $272 -
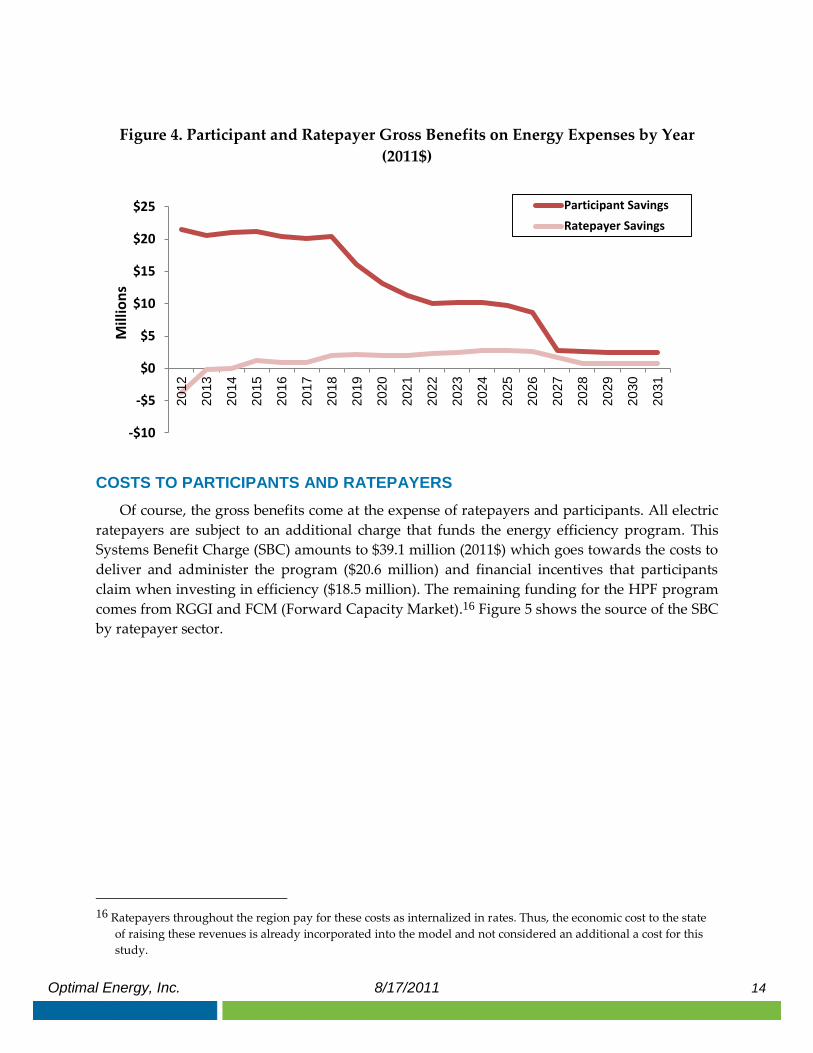
Figure 4 shows the estimated gross benefits (presented above) for participants and
ratepayers distributed by year. The timing of these benefits is based on assumptions of
deterioration of efficiency investments (by type of equipment) over time. Likewise, the savings
resulting from these investments taper off as the equipment becomes less efficient or expires. It
is important to note that these effects were estimated for one year’s spending in 2012. A
program with continued funding year-to-year would not show this decrease over time since
new efficiency would be perpetually coming on-line each year (though the program benefits
would change from year to year as prices for equipment and energy change, and due to
increases in the baseline efficiency of new equipment, from which program savings are
measured).
14 Natural gas savings were excluded since they were close to nothing (-$100,000 or .-04% of total savings). 15 “Ratepayers” here refers to the effects on participants and non-participants due to changes in rates. This also
includes deferred replacement credits awarded to participants (nearly $6 million).
Optimal Energy, Inc. 8/17/2011 14
Figure 4. Participant and Ratepayer Gross Benefits on Energy Expenses by Year
(2011$)
COSTS TO PARTICIPANTS AND RATEPAYERS
Of course, the gross benefits come at the expense of ratepayers and participants. All electric
ratepayers are subject to an additional charge that funds the energy efficiency program. This
Systems Benefit Charge (SBC) amounts to $39.1 million (2011$) which goes towards the costs to
deliver and administer the program ($20.6 million) and financial incentives that participants
claim when investing in efficiency ($18.5 million). The remaining funding for the HPF program
comes from RGGI and FCM (Forward Capacity Market).16 Figure 5 shows the source of the SBC
by ratepayer sector.
16 Ratepayers throughout the region pay for these costs as internalized in rates. Thus, the economic cost to the state
of raising these revenues is already incorporated into the model and not considered an additional a cost for this
study.
-$10
-$5
$0
$5
$10
$15
$20
$25
20
12
20
13
20
14
20
15
20
16
20
17
20
18
20
19
20
20
20
21
20
22
20
23
20
24
20
25
20
26
20
27
20
28
20
29
20
30
20
31
Mill
ion
s
Participant Savings
Ratepayer Savings

Optimal Energy, Inc. 8/17/2011 15
Figure 5. System Benefit Charge Collections by Sector (2011$)
Source: Vermont Department of Public Service, 2010 Collections by Rate Class
The financial incentives (funded by ratepayers) only cover a portion of the investments
needed to participate. In aggregate, participants pay the majority of the total investment of $43.8
million as shown previously in Table 3. However, in reality, not all of these costs would be
incurred up-front by the participants. Many will take out loans to cover the additional expense.
Larger investments are more likely to require outside funding, though smaller investments
often contribute to general borrowing to meet cash flow needs. This would mean that the
participants amortize the cost—pay a monthly charge including interest and principal of the
loan for the equipment. With this in mind, we developed estimates of how much of each type of
investment would be paid up-front (with the remainder amortized over a longer period) and
the average length of the amortization period.
Table 5: Assumptions for Participant Financing
Type of Program
% of expense
amortized
Years to
amortize
New Construction 100% 20
Residential Multi-Family programs 50% 10
Existing Homes/Retrofits 50% 5
Heating Equipment 0% N/A
Retail Products/Low-income programs 0% N/A
Due to the costs of borrowing, the participants pay a higher amount than if they would have
paid “out-of-pocket” in the first year. Using the assumptions above, the total participant
Residential, 48% 18.9M
Commercial, 40% 15.6M
Industrial, 12% 4.6M
Optimal Energy, Inc. 8/17/2011 16
spending over 20 years is $25.1 million17 (instead of the original $23 million). Even though the
total costs are higher, distributing the costs over the years also means that participants overall
expend less in the first year. In sum, this results in higher economic impacts in 2012 and slightly
lower impacts in the future years.
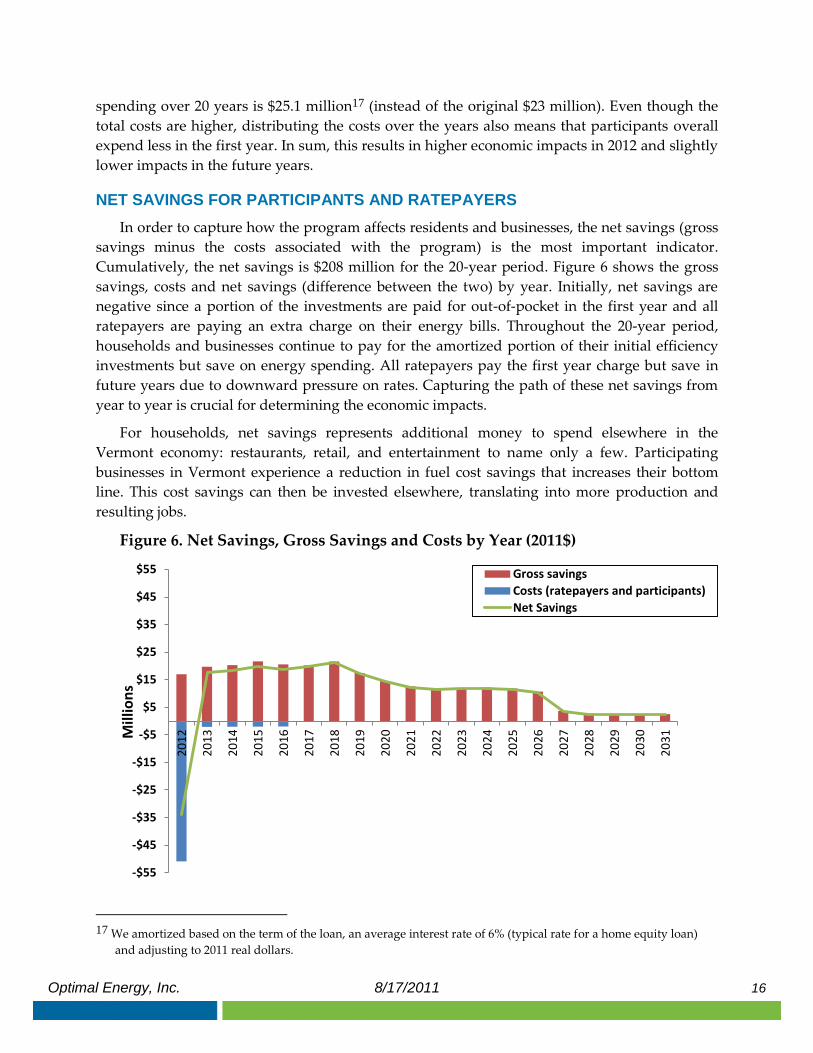
NET SAVINGS FOR PARTICIPANTS AND RATEPAYERS
In order to capture how the program affects residents and businesses, the net savings (gross
savings minus the costs associated with the program) is the most important indicator.
Cumulatively, the net savings is $208 million for the 20-year period. Figure 6 shows the gross
savings, costs and net savings (difference between the two) by year. Initially, net savings are
negative since a portion of the investments are paid for out-of-pocket in the first year and all
ratepayers are paying an extra charge on their energy bills. Throughout the 20-year period,
households and businesses continue to pay for the amortized portion of their initial efficiency
investments but save on energy spending. All ratepayers pay the first year charge but save in
future years due to downward pressure on rates. Capturing the path of these net savings from
year to year is crucial for determining the economic impacts.
For households, net savings represents additional money to spend elsewhere in the
Vermont economy: restaurants, retail, and entertainment to name only a few. Participating
businesses in Vermont experience a reduction in fuel cost savings that increases their bottom
line. This cost savings can then be invested elsewhere, translating into more production and
resulting jobs.
Figure 6. Net Savings, Gross Savings and Costs by Year (2011$)
17 We amortized based on the term of the loan, an average interest rate of 6% (typical rate for a home equity loan)
and adjusting to 2011 real dollars.
-$55
-$45
-$35
-$25
-$15
-$5
$5
$15
$25
$35
$45
$55
20
12
20
13
20
14
20
15
20
16
20
17
20
18
20
19
20
20
20
21
20
22
20
23
20
24
20
25
20
26
20
27
20
28
20
29
20
30
20
31M
illio
ns
Gross savings
Costs (ratepayers and participants)
Net Savings

Optimal Energy, Inc. 8/17/2011 17
APPENDIX A: SUMMARY OF DATA SOURCES AND ASSUMPTIONS
This appendix catalogues the data sources and assumptions used for this study that are not
described in the body of the report.
Summary of Key Analysis Assumptions
Factor Value Source
Real Discount Rate 5.6% DPS rate used in statewide screening tool for
cost-effectiveness analysis
Long-term Inflation Rate 2.6% Long-term average inflation rate for cost-
effectiveness analysis used in statewide screening
tool
Average electric line loss
factor
9.5% Weighted average of VT (10%) and BED (3.05%)
average line losses
EEC collections by sector 48% Res
40% Com
12% Ind
Provided by DPS for 2010 for EVT and BED
Electric sales split by sector 42% Res
39% Com
19% Ind
Calculated from Itron sales forecast, not
including sales from Self-Managed Energy
Efficiency Program participant sales
Heating and Process Fuels
(HPF) incentive spending
split by sector
75% Res
17% Com
8% Ind
HPF analysis performed by VEIC in 2011 for the
DPS
Benefit for Pooled
Transmission Facilities and
ancillary services provided by
ISO-NE ($/kWh)
$0.0216 Regional Network Service (RNS) Rate Forecast,
2012-2015 ($0.015/kWh in 2012), plus
$0.0066/kWh for ancillary fixed charges
(provided by Paul Chernick, Resource Insight
Inc.). A flat rate was used for the forecast period,
though the RNS Rate is forecast to escalate in the
coming years. The benefits are assumed to occur
one year after the actual savings.18
18 The RNS is calculated on a $/kW-Year basis, but is converted to $/kWh for ease of use in this report.

Optimal Energy, Inc. 8/17/2011 18
Inclusion of Burlington Electric Department (BED) Programs - The savings from electric
efficiency programs were based on a 2011potential study analysis performed for the DPS by
VEIC and Optimal Energy. That analysis only modeled EVT’s program activity. The analysis
was therefore adapted to fit the portfolio spending and savings targets recommended by the
DPS, and to include both BED and EVT. An implicit assumption in the adjusted DRP analysis is
that BED and EVT have efficiency programs with similar savings and spending composition.
This is reasonable because BED’s impact is relatively small compared to EVT; adjusting the
forecast to account for BED’s unique program characteristics (e.g., greater portion of C&I
savings, higher concentration of multifamily buildings) would not significantly affect the
results.
Electric Avoided Costs – Based on Avoided Energy Supply Costs in New England: 2011 Report
(Synapse Energy Economics, July, 2011).
HPF Incentive Costs – Based on a detailed budget projection for the 2011 HPF programs,
provided by VEIC. The total incentive costs were calculated to be 76% of the resource
acquisition budget.
HPF Participant Costs – Estimated by sector based on review of program designs and
corresponding electric programs.
Average Retail Electric Rates – Based on 2010 VT utility revenues and sales by sector, adjusted
to 2011$ for inflation. The 2012 average retail rates by sector were estimated to be:
$0.158/kWh Residential
$0.136/kWh Commercial
$0.096/kWh Industrial.
Retail rates for the years 2013-2031 were based on the 2012 estimates, escalated in proportion to
the wholesale electric rates forecasted for those years in the 2011 AESC (July 2011, Synapse
Energy Economics).
Average Retail Natural Gas Rates – Based on 2010 EIA retail prices by sector for VT, adjusted
up for inflation. The 2012 rates ($/MMBtu) by sector were estimated to be: $17.06 – Residential,
$12.5 – Commercial, $6.97 – Industrial. Retail rates for the years 2013-2031 were based on the
2012 estimates, escalated in proportion to the wholesale gas rates forecasted for those years in
Avoided Energy Supply Costs in New England: 2011 Report (Synapse Energy Economics, July,
2011).
Average Retail Heat and Process Fuels Rates – Based on Avoided Energy Supply Costs in New
England: 2011 Report (Synapse Energy Economics, July, 2011), Appendix E, Petroleum Fuels.
Residential rates are for Distillate Fuel Oil. Commercial and Industrial rates are a weighted
average of Distillate and Residual Fuel Oil based on a 5-year average from EIA data for
Vermont (commercial was 86% distillate, 14% residual, while industrial was 78% distillate and
22% residual). The 2012 average retail rates by sector were estimated to be:
Optimal Energy, Inc. 8/17/2011 19
$26.22/MMBtu Residential
$16.61/MMBtu Commercial
$9.39/MMBtu Industrial.
Retail rates for the years 2013-2031 were based on the 2012 estimates, escalated in proportion to
the wholesale HPF rates forecasted for those years in the 2011 AESC report.
DRIPE Benefits – Calculated as the sum of energy and capacity benefits for Vermont, on a per
kWh saved basis, from the Avoided Energy Supply Costs in New England: 2011 Report (Synapse
Energy Economics, July, 2011),.
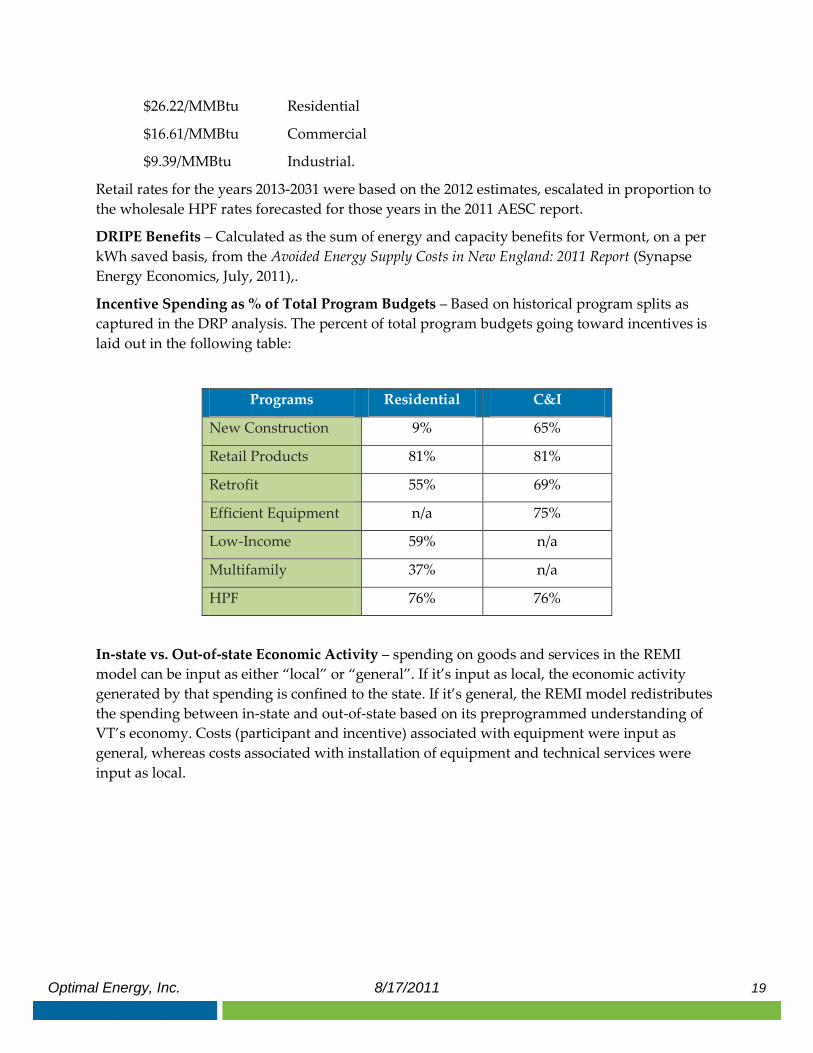
Incentive Spending as % of Total Program Budgets – Based on historical program splits as
captured in the DRP analysis. The percent of total program budgets going toward incentives is
laid out in the following table:
Programs Residential C&I
New Construction 9% 65%
Retail Products 81% 81%
Retrofit 55% 69%
Efficient Equipment n/a 75%
Low-Income 59% n/a
Multifamily 37% n/a
HPF 76% 76%
In-state vs. Out-of-state Economic Activity – spending on goods and services in the REMI
model can be input as either “local” or “general”. If it’s input as local, the economic activity
generated by that spending is confined to the state. If it’s general, the REMI model redistributes
the spending between in-state and out-of-state based on its preprogrammed understanding of
VT’s economy. Costs (participant and incentive) associated with equipment were input as
general, whereas costs associated with installation of equipment and technical services were
input as local.

Optimal Energy, Inc. 8/17/2011 20
APPENDIX B: INDUSTRIES USED IN THE REMI MODEL
The following “REMI industries” correspond to subsectors of the North American Industrial
Classification System (NAICS) that were applied in this study. Each represents a general set of
related sub-industries, and thus provides only limited precision compared to the real-world
impacts of energy efficiency investments. Brief descriptions and examples of sub-subsectors are
provided for each as a means of clarifying their selection as appropriate proxies in the REMI
modeling.
Construction: The construction sector comprises establishments primarily engaged in the
construction of buildings or engineering projects. Construction labor may be related to new
work, additions, alterations, or repairs and maintenance. Relevant subsectors include:
Residential Building Construction
Nonresidential Building Construction
Foundation, Structure, and Building Exterior Contractors
Building Equipment Contractors
Machinery Manufacturing: The machinery manufacturing sector comprises establishments
engaged in creating end products that apply mechanical force to perform work. This includes
machinery used in a variety of commercial and industrial applications. Relevant subsectors
include:
Ventilation, Heating, Air-Conditioning, and Commercial Refrigeration
Equipment Manufacturing
Air Purification Equipment Manufacturing
Industrial and Commercial Fan and Blower Manufacturing
Heating Equipment Manufacturing
Air-Conditioning and Warm Air Heating Equipment and Commercial and
Industrial Refrigeration Equipment Manufacturing
Pump and Compressor Manufacturing
Electrical Equipment and Appliance Manufacturing: Industries in the Electrical Equipment,
Appliance, and Component Manufacturing subsector manufacture products that generate,
distribute and use electrical power including electric lamp bulbs, lighting fixtures, and parts;
both small and major electrical appliances and parts; electric motors, generators, transformers,
and switchgear apparatus. Relevant subsectors include:
Electric Lamp Bulb and Part Manufacturing
Lighting Fixture Manufacturing
Small Electrical Appliance Manufacturing

Optimal Energy, Inc. 8/17/2011 21
Household Refrigerator and Home Freezer Manufacturing
Household Laundry Equipment Manufacturing
Computer and Electronic Product Manufacturing: Industries in the Computer and Electronic
Product Manufacturing subsector manufacture computers, computer peripherals,
communications equipment, and similar electronic products, and establishments that
manufacture components for such products. Relevant subsectors include:
Computer and Peripheral Equipment Manufacturing
Professional and Technical Services: Industries in the Professional and Technical Services
subsector engage in processes where human capital is the major input. These establishments
make available the knowledge and skills of their employees, often on an assignment basis,
where an individual or team is responsible for the delivery of services to the client. The
distinguishing feature of this subsector is the fact that most of the industries grouped in it are
almost wholly dependent on worker skills. Relevant subsectors include:
Accounting, Tax Preparation, Bookkeeping, and Payroll Services
Architectural Services
Engineering Services
Building Inspection Services
Interior Design Services
Industrial Design Services
Computer Systems Design and Related Services
Environmental Consulting Services
Marketing Consulting Services
Other Scientific and Technical Consulting Services
Administrative and Support Services: Industries in the Administrative and Support Services
subsector group establishments engaged in activities that support the day-to-day operations of
other organizations. The processes employed in this sector (e.g., general management,
personnel administration, clerical activities, cleaning activities) are often integral parts of the
activities of establishments found in all sectors of the economy. Relevant subsectors include:
Office Administrative Services
Facilities Support Services
Business Support Services
Other Support Services