economic impacts of climate change on michigan
TRANSCRIPT
Economic Impacts of Climate Change on Michigan
July 2008
A Review and Assessment Conducted by The Center for Integrative Environmental Research University of Maryland

Contributors to the Report Daria Karetnikov
Graduate Research Assistant, Center for Integrative Environmental Research
Matthias Ruth Director, Center for Integrative Environmental Research and Roy F. Weston Chair for Natural Economics
Kim Ross Executive Director, Center for Integrative Environmental Research
Daraius Irani Director, Regional Economic Studies Institute (RESI) of Towson University
The Center for Integrative Environmental Research (CIER) at the University of Maryland addresses complex environmental challenges through research that explores the dynamic interactions among environmental, economic and social forces and stimulates active dialogue with stakeholders, researchers and decision makers. Researchers and students at CIER, working at local, regional, national and global scales, are developing strategies and tools to guide policy and investment decisions. For additional information, visit www.cier.umd.edu. For additional information on this report, please contact: Matthias Ruth, [email protected] The full report is available for free download at www.cier.umd.edu/climateadaptation

1
INTRODUCTION Policymakers across the country are now seeking solutions to curb greenhouse gas emissions and to help us adapt to the impending impacts triggered by past emissions. The debate to date has primarily focused on the perceived costs of alternative solutions, yet there can also be significant costs of inaction. Climate change will affect our water, energy, transportation, and public health systems, as well as state economies as climate change impact a wide range of important economic sectors from agriculture to manufacturing to tourism. This report, part of a series of state studies, highlights the economic impacts of climate change in Michigan and provides examples of additional ripple effects such as reduced spending in other sectors and resulting losses of jobs, wages, and even tax revenues. A Primer on Climate Change Earth’s climate is regulated, in part, by the presence of gases and particles in the atmosphere which are penetrated by short-wave radiation from the sun and which trap the longer wave radiation that is reflecting back from Earth. Collectively, those gases are referred to as greenhouse gases (GHGs) because they can trap radiation on Earth in a manner analogous to that of the glass of a greenhouse and have a warming effect on the globe. Among the other most notable GHGs are carbon dioxide (CO2), methane (CH4), nitrous oxide (N2O) and chlorofluorocarbons (CFCs). Their sources include fossil fuel combustion, agriculture, and industrial processes. Each GHG has a different atmospheric concentration, mean residence time in the atmosphere, and different chemical and physical properties. As a consequence, each GHG has a different ability to upset the balance between incoming solar radiation and outgoing long-wave radiation. This ability to influence Earth’s radiative budget is known as climate forcing. Climate forcing varies across chemical species in the atmosphere. Spatial patterns of radiative forcing are relatively uniform for CO2, CH4, N2O and CFCs because these gases are relatively long-lived and as a consequence become more evenly distributed in the atmosphere. Steep increases in atmospheric GHG concentrations have occurred since the industrial revolution (Figure 1). Those increases are unprecedented in Earth’s history. As a result of higher GHG concentrations, global average surface temperature has risen by about 0.6°C over the twentieth century, with 10 of the last 12 years likely the warmest in the instrumental record since 1861 (IPCC 2007).

2
Figure 1. Atmospheric Concentrations of Carbon Dioxide, Methane and Nitrous Oxide
(Source: IPCC 2007)
A change in average temperatures may serve as a useful indicator of changes in climate (Figure 2), but it is only one of many ramifications of higher GHG concentrations. Since disruption of Earth’s energy balance is neither seasonally nor geographically uniform, effects of climate disruption vary across space as well as time. For example, there has been a widespread retreat of mountain glaciers during the twentieth century. Scientific evidence also suggests that there has been a 40 percent decrease in Arctic sea ice thickness during late summer to early autumn in recent decades and considerably slower decline in winter sea ice thickness. The extent of
3
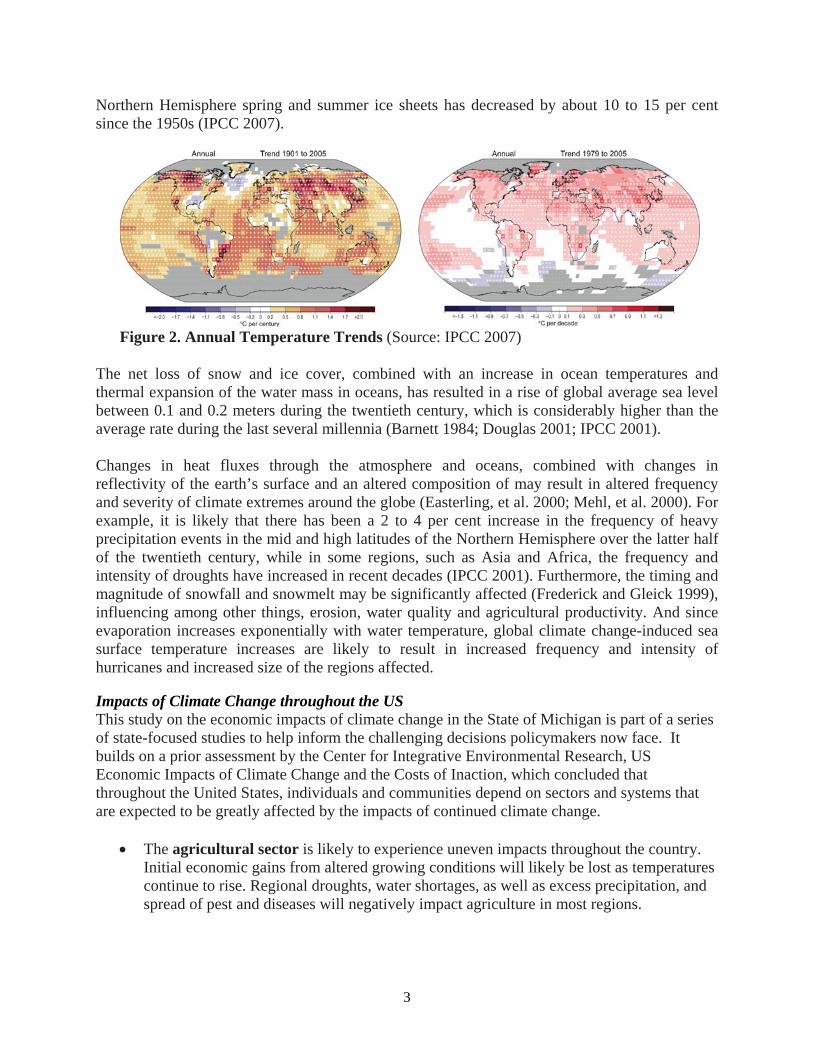
Northern Hemisphere spring and summer ice sheets has decreased by about 10 to 15 per cent since the 1950s (IPCC 2007).
Figure 2. Annual Temperature Trends (Source: IPCC 2007)
The net loss of snow and ice cover, combined with an increase in ocean temperatures and thermal expansion of the water mass in oceans, has resulted in a rise of global average sea level between 0.1 and 0.2 meters during the twentieth century, which is considerably higher than the average rate during the last several millennia (Barnett 1984; Douglas 2001; IPCC 2001). Changes in heat fluxes through the atmosphere and oceans, combined with changes in reflectivity of the earth’s surface and an altered composition of may result in altered frequency and severity of climate extremes around the globe (Easterling, et al. 2000; Mehl, et al. 2000). For example, it is likely that there has been a 2 to 4 per cent increase in the frequency of heavy precipitation events in the mid and high latitudes of the Northern Hemisphere over the latter half of the twentieth century, while in some regions, such as Asia and Africa, the frequency and intensity of droughts have increased in recent decades (IPCC 2001). Furthermore, the timing and magnitude of snowfall and snowmelt may be significantly affected (Frederick and Gleick 1999), influencing among other things, erosion, water quality and agricultural productivity. And since evaporation increases exponentially with water temperature, global climate change-induced sea surface temperature increases are likely to result in increased frequency and intensity of hurricanes and increased size of the regions affected. Impacts of Climate Change throughout the US This study on the economic impacts of climate change in the State of Michigan is part of a series of state-focused studies to help inform the challenging decisions policymakers now face. It builds on a prior assessment by the Center for Integrative Environmental Research, US Economic Impacts of Climate Change and the Costs of Inaction, which concluded that throughout the United States, individuals and communities depend on sectors and systems that are expected to be greatly affected by the impacts of continued climate change.
• The agricultural sector is likely to experience uneven impacts throughout the country. Initial economic gains from altered growing conditions will likely be lost as temperatures continue to rise. Regional droughts, water shortages, as well as excess precipitation, and spread of pest and diseases will negatively impact agriculture in most regions.

4
• Storms and sea level rise threaten extensive coastal infrastructure – including transportation networks, coastal developments, and water and energy supply systems.
• Current energy supply and demand equilibria will be disrupted as electricity
consumption climbs when demand grows in peak summer months. At the same time, delivering adequate supply of electricity may become more expensive because of extreme weather events.
• Increased incidence of asthma, heat-related diseases, and other respiratory ailments may
result from climate change, affecting human health and well-being.
• More frequent and severe forest fires are expected, putting ecosystems and human settlements at peril.
• The reliability of water supply networks may be compromised, influencing agricultural
production, as well as availability of water for household and industrial uses. As science continues to bring clarity to present and future global climate change, policymakers are beginning to respond and propose policies that aim to curb greenhouse gas emissions and to help us adapt to the impending impacts triggered by past emissions. While climate impacts will vary on a regional scale, it is at the state and local levels where critical policy and investment decisions are made for the very systems most likely to be affected by climate change – water, energy, transportation and public health systems, as well as important economic sectors such as agriculture, fisheries, forestry, manufacturing, and tourism. Yet, much of the focus, to date, has been on the perceived high cost of reducing greenhouse gas emissions. The costs of inaction are frequently neglected and typically not calculated. These costs include such expenses as rebuilding or preparing infrastructure to meet new realities and the ripple economic impacts on the state’s households, the agricultural, manufacturing, commercial and public service sectors. The conclusions from our nation-wide study highlight the need for increased understanding of the economic impacts of climate change at the state, local and sector level:
• Economic impacts of climate change will occur throughout the country. • Economic impacts will be unevenly distributed across regions and within the economy
and society. • Negative climate impacts will outweigh benefits for most sectors that provide essential
goods and services to society. • Climate change impacts will place immense strains on public sector budgets. • Secondary effects of climate impacts can include higher prices, reduced income and job
losses. Methodology This report identifies key economic sectors in Michigan which are likely affected by climate change, and the main impacts to be expected for these sectors. The report provides examples of the direct economic impacts that could be experienced in the state and presents calculations of

5
indirect effects that are triggered as impacts on individual sectors in the economy ripple through to affect others. The study reviews and analyzes existing studies such as the 2000 Global Change Research Program National Assessment of the Potential Consequences of Climate Variability and Change which identifies potential regional impacts. Additional regional, state and local studies are used to expand on this work, as well as new calculations derived from federal, state and industry data sources. The economic data is then related to predicted impacts of climate change provided from climate models. To standardize the results, all of the figures used in this report have been converted to 2007 dollars (BLS 2008). Since the early 1990s, and especially during the 21st century, significant progress has been made in understanding the impacts of climate change at national, regional, and local scales. The Canadian and Hadley climate change models are cited most frequently and we look first to these, yet there are many other valuable models used by some of the specialized studies we cite in this report. In addition to looking at data that illustrates the direct economic impacts of climate change, the report also provides examples of the often overlooked ripple economic effects on other sectors and the state economy. To calculate these, we employed a modified IMPLANTM model from the Regional Economic Studies Institute (RESI) of Towson University. This is a standard input/output model and the primary tool used by economists to measure the total economic impact by calculating spin-off impacts (indirect and induced impacts) based upon the direct impacts which are inputted into the model. Direct impacts are those impacts (jobs and output) generated directly by the project. Indirect economic impacts occur as the project (or business owners) purchase local goods and services. Both direct and indirect job creation increases area household income and results in increased local spending on the part of area households. The jobs, wages, output and tax revenues created by increased household spending are referred to as induced economic impacts. After reviewing climate and economic information that is currently available, the study identifies specific data gaps and research needs for further understanding of the significant economic impacts. There is no definitive total cost of inaction. Given the diversity in approaches among existing economic studies and the complexity of climate-induced challenges faced by society, there is a real need for a consistent methodology that enables more complete estimates of impacts and adaptation costs. The report closes with basic recommendations and concluding lessons learned from this series of state-level studies. Not all environmentally induced impacts on infrastructures, economy, society and ecosystems reported here can be directly or unequivocally related to climate change. However, historical as well as modeled future environmental conditions are consistent with a world experiencing changing climate. Models illustrate what may happen if we do not act now to effectively address climate change and if adaptation efforts are inadequate. Estimates of the costs of adapting environmental and infrastructure goods and services to climate change can provide insight into the very real costs of inaction, or conversely, the benefits of maintaining and protecting societal goods and services through effective policies that avoid the most severe climate impacts. Since it

6
is typically at the sectoral and local levels where those costs are borne and benefits are received, cost estimates can provide powerful means for galvanizing the discussion about climate change policy and investment decision-making. These cost estimates may understate impacts on the economy and society to the extent that they simply cover what can be readily captured in monetary terms, and to the extent that they are calculated for the more likely future climate conditions rather than less likely but potentially very severe and abrupt changes. The broader impacts on the social fabric, long-term economic competitiveness of the state nationally and internationally, changes in environmental quality and quality of life largely are outside the purview of the analysis, yet likely not trivial at all. Together, the monetary and non-monetary, direct, indirect and induced costs on society and the economy provide a strong basis on which to justify actions to mitigate and adapt to climate change. CLIMATE CHANGE IN MICHIGAN Projected increases in summer and winter temperatures in Michigan are expected to outweigh the predicted 20-40 percent rise in precipitation and result in an overall dryer climate. Dryer conditions will likely threaten the integrity of the Great Lakes-St. Lawrence shipping route and diminish its economic contribution, as well as disrupt ground water aquifer levels, recreational boating, and hydroelectric power production. The migration of plant and animal species northward will likely affect all aspects of the tourism industry in the state. This shift in species, coupled with more frequent flooding, extreme weather events, and warmer temperatures are predicted to impact the agricultural and forestry sectors, as well. Surrounded by four of the Great Lakes, temperature distributions throughout the state are connected to the lake effects on temperature. For example, average January temperatures in Michigan – situated on the eastern side of Lake Michigan – are slightly above 20°F. On the other side of the lake in Wisconsin, mean temperatures are around 5°F lower, demonstrating the warming effect of the lake (USGS 2006). The average temperature in the state has seen a clear trend upward throughout the last century, as is shown by the deviations from average temperatures in Figure 3.

7
Departure from Average Temperature in F°
-1.5
-1
-0.5
0
0.5
1
1.5
2
2.5
1965 1970 1975 1980 1985 1990 1995 2000 2005 2010
Cha
nge
from
Ave
rage
Departure from Mean Temperature in F°
Linear (Departure from Mean Temperature in F°)
Figure 3. Change from Average Temperatures in Michigan in the month of January Source: NOAA 2007 Another indicator of the rising temperatures in the state is the extent of ice cover in winter. For example, Grand Traverse Bay, located in the northern part of Michigan has experienced a decline in ice cover throughout the century. Figure 4 demonstrates the decline in the Bay. The number of years the Bay froze completely for every century since 1851 has declined significantly from an average of 8-10 years per decade back in the late 1800s, to only 3 frozen winter seasons between 1990 and 2000.

8
Figure 4. Grand Traverse Bay Freezing Trends Source: Andersen 2007, who used data from the Traverse City Chamber of Commerce 2006. Water lake levels in the Great Lakes and along the St. Lawrence Seaway have been on the decline. The most recent publication of Environment Canada’s1 reports lower than average levels for nearly the entire system (Environment Canada 2008). Table 4 below presents this trend.
January Monthly Mean Level
Lake Compared to Monthly Average (1918-2006) Compared to One Year Ago
Superior 10.2 in below 6.3 in above
Michigan-Huron 24.4 in below 11.8 in below
St. Clair 7.5 in below 12.6 in below
Erie 1.6 in below 11.4 in below Ontario same 16.5 in below Table 1. January 2008 Great Lakes Water Level Source: Environment Canada 2008 1 Environment Canada is the Department of the Environment of the Government of Canada
9
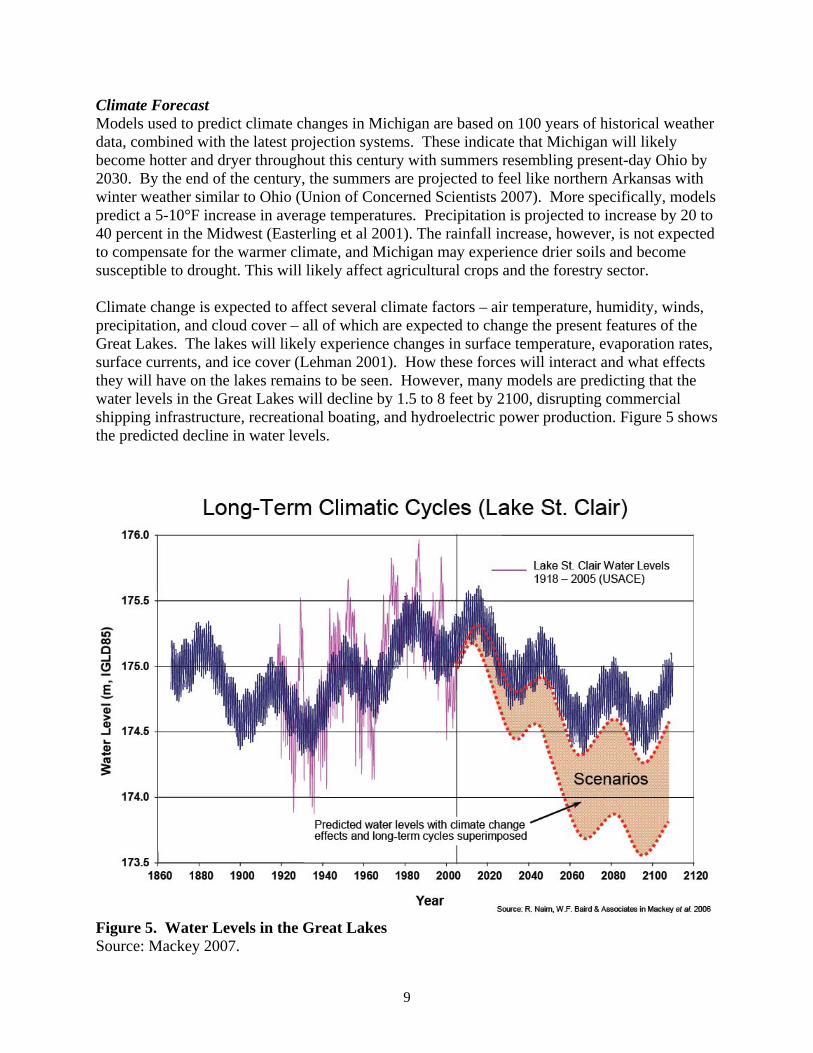
Climate Forecast Models used to predict climate changes in Michigan are based on 100 years of historical weather data, combined with the latest projection systems. These indicate that Michigan will likely become hotter and dryer throughout this century with summers resembling present-day Ohio by 2030. By the end of the century, the summers are projected to feel like northern Arkansas with winter weather similar to Ohio (Union of Concerned Scientists 2007). More specifically, models predict a 5-10°F increase in average temperatures. Precipitation is projected to increase by 20 to 40 percent in the Midwest (Easterling et al 2001). The rainfall increase, however, is not expected to compensate for the warmer climate, and Michigan may experience drier soils and become susceptible to drought. This will likely affect agricultural crops and the forestry sector. Climate change is expected to affect several climate factors – air temperature, humidity, winds, precipitation, and cloud cover – all of which are expected to change the present features of the Great Lakes. The lakes will likely experience changes in surface temperature, evaporation rates, surface currents, and ice cover (Lehman 2001). How these forces will interact and what effects they will have on the lakes remains to be seen. However, many models are predicting that the water levels in the Great Lakes will decline by 1.5 to 8 feet by 2100, disrupting commercial shipping infrastructure, recreational boating, and hydroelectric power production. Figure 5 shows the predicted decline in water levels.
Figure 5. Water Levels in the Great Lakes Source: Mackey 2007.

10
Moreover, water temperatures in the Lakes will likely become warmer, making the ecosystem unsuitable for cold-water fish species and changing the ecology of the region (Sousounis and Glick 2007). Coupled with temperature and precipitation increases, higher frequency of extreme weather events are expected with frequency of heavy rainstorms increasing by 50-100 percent (Union of Concerned Scientists 2007). Weather unpredictability can affect agricultural production, and flooding following heavy rainstorms could disrupt integral infrastructure networks, such as roads, electric grids and water supplies. Finally, the decline of ice cover on the Great Lakes that has been documented for the last century is expected to continue (Union of Concerned Scientists 2007)). Reduction in surface ice on a lake can increase shore erosion and disrupt breeding patterns of fish species. Moreover, decreased ice cover can impact lake levels and have an adverse affect on water aquifers. MAJOR ECONOMIC IMPACTS Lower water levels along the Great Lakes-St. Lawrence shipping route are likely to impact a range of economic sectors dependent on it. Besides providing an efficient and economical shipping option for manufactured goods, the Great Lakes are integral to the tourism and fishing industries; are a source of water for many municipalities along their shores; and provide water for hydropower and other industrial operations (Mortsch 2007). More frequent rainfall events are predicted to affect the agricultural sector, as well as increase incidence of flooding, which damages road and energy supply networks and causes damages to other built infrastructure. Shipping Infrastructure Surrounded by four out of five Great Lakes and situated squarely on the Great Lakes-St. Lawrence Seaway, Michigan is home to over 40 commercial ports (Port of Detroit 2000). The largest economic sector in the state – manufacturing – contributes around 18 percent of the Gross State Product (BEA 2006) and depends on the Seaway for cheap and efficient shipping infrastructure. With over 76 million tons of domestic and foreign cargo shipped through Michigan’s waterborne routes, the state is 13th in the nation in the total tonnage shipped by water (US Army Corps of Engineers 2001a). The largest port in Michigan is the Port of Detroit, which imported and exported over 17 million tons of goods in 2000. The estimated total income generated in the Port was over $680 million (2007 $) that year, with over 10,000 direct and indirect jobs supported by the shipping activity (Port of Detroit 2000). The three largest ports in Michigan oversee over a billion dollars in foreign imports, and export nearly $4.7 billion (2007 $) worth of manufactured products (World Port Source 2006). If water levels continue to drop along the route, expensive dredging of channels will be necessary. In fact, dredging along the entire Great Lakes-St. Lawrence shipping route could cost between $92 and $154 million annually by 2030 under a climate change scenario with falling water levels in the Great Lakes2 (Great Lakes Regional Assessment Group 2000). In the Detroit District alone, the US Army Corps of Engineers already awarded nearly $10 million worth of 2 This is under the Canadian Climate Center Model, which predicts a 1.5-3 feet drop in the lake levels by 2030.

11
dredging contracts in 2006 (US Army Corps of Engineers 2006). In a recent survey of Great Lakes operators conducted by the US Department of Transportation, the respondents unanimously agreed that insufficient dredging of ports was the most important infrastructure issue determining their future investment decisions (US Dept of Transportation 2005). It is clear that the significant expense of dredging may become an even more necessary part of shipping activities along the route. Additionally, the Great Lakes support a blossoming cruise route with 9 ships offering cruises in 2004. A study by an industry association showed that the total value of cruises on the Great Lakes was over $40 million (2007 $) in the US in 2004 (GLCC 2004). If the water levels in the Great Lakes decrease as projected, system connectivity along the Great Lakes-St. Lawrence route will decline by around 25 percent (Great Lakes Regional Assessment Group 2000). This could cause an annual economic loss of almost $1.5 billion in foreign trade for the ports of in Detroit, Muskegon, and Port Huron. Additional losses in foreign trade are likely in the other 35 ports, domestic shipping will likely decline, as well, lowering the sector’s profitability and job security. The impacts on the waterborne industry may translate into higher shipping costs for manufacturers, threatening the profitability of the most important economic sector in Michigan. The ripple effects will spread even further. Indirect effects associated with increased dredging needs for the Port of Detroit alone will include annual losses of $142 million and a combined direct and multiplicative job loss of over 1500 (RESI 2008). Michigan would see an additional loss of $2.6 billion and 13,000 jobs in the state due to lost imports/exports (RESI 2008). Other Infrastructure Flooding events, which are predicted to occur more often as the incidence of heavy rainstorms increases due to climate change, threaten the entire population of the state. Michigan is interlaced with 36,000 miles of rivers and streams (Michigan DNR 2007), which may overflow, causing large economic damages. In fact, a study looking at economic impacts of severe weather events in the Mid-Atlantic region showed that a 1 percent increase in annual precipitation results in a 2.8 percent increase in annual flood and hurricane economic losses, as measured by historical insurance loss data (Choi and Fisher 2003). A report sponsored by the National Oceanic and Atmospheric Administration (NOAA) showed that from the years 1991-2003, Michigan incurred over $10 million in annual flood damages on average3 (Pielke et al 2002). As is pointed out earlier in this report, precipitation is projected to increase by up to 25 percent in Michigan by the end of the century. Applying the economic data to past average flood damages, the expected average annual losses from flooding events may top $700 million.4 Flooding events go much further than damage infrastructure, but result in many indirect effects, such as productivity losses and impacts on multiple sectors. Indirect effects from flooding may
3 Damages ranged from a low of $325,000 in 1997 and 1999 to a high of around $27 million in 1996 (Pielke et al 2002). 4 25 percent increase in precipitation * 2.8 percent increase in annual flood losses * $10 million in annual flood damages = $700 million

12
reach $506 million – almost as large as the direct impact on the economy – and a total of nearly 9,700 workers may lose their jobs (RESI 2008). Water Resources The Great Lakes Basin is the fourth largest watershed in the nation, and provides around over 75 percent of Michigan’s residents with water. The rest of the water supply is withdrawn mostly from ground water. In the largest five counties in the states, over 90 percent of water supply originated in the Great Lakes and their connecting water ways. Interestingly, while the total volume withdrawn from the lakes is significant, the amount actually consumed is only 10-15 percent, with the rest lost to evaporation, transpiration, and incorporation into consumer products (Michigan Department of Environmental Quality 2006). Public water sources originating at the Great Lakes may see their supplies compromised, as water levels decline. An additional stress on the system may come from more frequent rainfall events predicted by climate change models, which may cause flooding and a subsequent accumulations of pollutants, necessitating more expensive treatment of the resource. A study in Texas found that increased contamination of surface raw water raised the treatment costs by 27 percent (Dearmont et al. 1997). In Michigan, the cost of cleaning up ground water contamination from 1989-1999 totaled over $367 million (2007 $), with nearly $30 million spent in 1999 (Ground Water Protection Council 2000). While it is unclear how much additional treatment ground water and the Great Lakes water supply will need, the treatment costs are real and will likely increase as climate change impacts continue to be felt. OTHER ECONOMIC IMPACTS Forestry Over half of Michigan is forested. The Michigan Society of American Foresters estimates that Michigan’s forests support around 200,000 jobs and contribute over $12 billion to the state’s economy each year. The annual consumption of paper, furniture and other forest products by the state’s residents is 800 million cubic feet (Michigan Society of American Foresters 2007). Timberland area accounts for 97 percent of the total forested land in Michigan with hardwood forests making up 75 percent of the timberland area (USDA 2006 – Michigan’s Forest Resources). Warmer temperatures will likely shift the ranges of many of the state’s current forest species northward. The climate is likely to be more suitable for insect pests, potentially causing more damage to this sector (Union of Concerned Scientists 2003). It is difficult to estimate the economic losses to the forestry sector since much of it depends on the adaptability strategies of tree species. Nonetheless, the forestry sector in Michigan will likely suffer large economic damages as a result of global climate change impacts.
This is exactly what happened in Michigan in 2002 when a period of unusually warm temperatures was followed by a spring frost, which damaged already budding flowers. The tart cherry harvest fell by 95 percent from nearly 300 million pounds in 2001 to just 15 million in 2002 (Michigan Department of Agriculture 2004). The current 2008 season has started off on a

13
similar note. This time the frost may have impacted other fruit crops – including grapes, apples, and peaches - although the full extent of damages won't come to light until after the harvest (Parker 2008).
Agriculture In 2005, crop and animal production accounted for $2.3 billion (2007 $) of Michigan’s Gross State Product (BEA 2006). Milk production was by far the largest commodity by cash receipts, generating nearly $1 billion in 2006. Field crops, such as corn, hay, soybeans, wheat and others contributed around $1.6 billion in cash receipts. Fruit production is another productive business, producing around $350 million in cash receipts in 2006. In fact, Michigan ranked first in the production of cherries and blueberries among the states (USDA, NASS 2007). In addition, a recent report issued by Michigan State University calculated that agriculture and related industries have add $63.3 billion (2007 $) to Michigan’s economy. The report further estimated that 725,000 people are directly employed by the industry, and that the sector presents high future growth potential (MSU 2006). Disruptions to this important industry from climate change impacts will likely have detrimental economic effects throughout the entire state. Although some studies show that higher CO2 concentrations in the atmosphere may benefit certain crops such as soybeans, corn, and wheat, the projected higher frequency of extreme weather events as well as potential regional drought will likely put stress on the agricultural sector and may diminish its productivity. In addition, the sector may be impacted by newly favorable climate conditions for agricultural pests, such as the European corn borer; and higher ozone concentrations5 have been shown to injure susceptible horticultural crops – particularly soybeans (Union of Concerned Scientists 2003). Another consideration in crop management is soil erosion and runoff. Rising temperatures have been shown to increase soil erosion through impacting microbial activity levels and changing the productive cycle of crops. Similarly, greater precipitation levels have been found to increase erosion and runoff. A recent study, focused on the Midwest, incorporated current agricultural uses for soil into its model and found similar results. Runoff is expected to increase by nearly 50 percent in the Michigan Thumb area and by 310 percent in the South Eastern Michigan. Soil erosion is also predicted to progress rapidly. The Michigan Thumb area is expected to experience 105 percent in soil loss and the South Eastern Michigan will see over 270 percent increase in soil erosion by 2059 (O’Neal 2005). Increased runoff and soil loss may be costly challenges to the local farmers and the entire agricultural sector. The dairy industry is vulnerable to temperature increases. More specifically, dairy production decreases at temperatures around 90°F, and losses begin to be felt when temperature reaches 77°F. This productivity loss can translate into economic costs. For example, in California, higher temperatures were responsible for 7-22 percent decline in dairy production by the end of the century (PNAS 2007). As was described above, climate models predict that by the end of the century, Detroit will experience 30-50 days above 90°F. This is likely to impact the $1 billion milk industry. 5 Since ozone molecules are formed from greenhouse gases, higher CO2 concentrations in the atmosphere will result in more atmospheric ozone.

14
While Michigan is not well known for wine production, it does have a sizable winery sector A study conducted at Michigan Statue University estimated the total economic value of the sector – including related tourism and production factors – is nearly $90 million (2007 $) (Kim and Kim 2002). Research has demonstrated that high temperatures during the grape ripening process can lower the quality of the product. The market value of the wine produced will likely also suffer (PNAS 2007). Predicted warmer winters may induce earlier flowering of the fruit trees, which, if damaged by spring frosts, may jeopardize the entire field crop for the season, incurring losses to the $350 million fruit industry. A study conducted in Germany investigating productivity changes in fruit trees as climate patterns shift found distinct changes in plant behavior. For example, higher temperatures in the spring sped up the trees’ developmental process and resulted in earlier blossoming of trees. In fact, the average air temperatures from February to April predicted the timing of phenological stages of plants. The danger of early blossoms lies in the potential damages caused by late frosts. In fact, frosts during the flowering phase of trees can cause a failure of the entire crop (Chmielewski 2004). Recreation and Tourism Surrounded by natural bounty, wildlife-related recreation is enjoyed by many Michigan residents. In fact, a 2001 survey showed that 3.5 million Michiganians (or 35 percent of the population) participated in fishing, hunting, or wildlife watching. A total of $3.3 (2007 $) billion was spent on those three activities that year (Census 2003). Overall, tourist spending was estimated to be over $14.4 (2007 $) billion that same year with 157,200 jobs directly related to tourism. On average, tourists spent nearly $120 per day at their destinations, and 80 percent of the money is captured by local economies. Moreover, around 30 percent of tourism-related sales go to payroll expenditures (MSU 2004). The projected higher temperatures in the region and of water in the Great Lakes will likely alter the inland and aquatic ecosystems of the state. For example, climate computer models have indicated that the Great Lakes biomass productivity may diminish by 20 percent as aquatic food chains are disrupted. An additional stress on the aquatic ecosystem will be the projected declines in water levels, as this will cut off many species’ access to their critical wetland habitats where they breed and young fish are sheltered (Sousounis and Glick 2007). Moreover, one report studying species’ responses to rising temperatures found that 80 percent of species studies are changing their behavior, including changing migratory patterns and habitats (Root et al 2003). This is certain to impact the native flora of the state, undermining the established tourism sector of wildlife watching. According to the Census, 2,666,000 people participated in wildlife-watching activities in 2001. Collectively, they spent over $825 million (2007 $) on the activity, with 17 percent coming from nonresidents (Census 2003). In 2006, around $584 million was spent by 1.4 million anglers, with 13 percent of the anglers primarily interested in trout (USFWS 2006). Trout is a species likely to be susceptible to climatic changes, particularly temperature increases and seasonal runoff patterns. If the trout is entirely eliminated from its territory, Michigan stands to lose over $75 million in trip-related expenses.

15
Over 6,000 miles of designated snowmobiling miles crisscross the State of Michigan (Michigan DNR 2007) and 30,000 more miles of undeveloped track are permitted for snowmobile use. There are nearly 365,000 registered snowmobiles in the state, ranking it number one in the nation. According to the Michigan Snowmobile Association, an average snowmobiler spends $150 per day on a trip, with most trips lasting up to 5 days. Added together, the annual economic contribution of the sport is over $1 billion – including around 8,000 new snowmobiles sold annually (MSA 2007). Warmer temperatures and increased rainfall during the winter months will likely cause major disruptions to winter sports activities in Michigan. There are 16 skiing facilities in the state, generating nearly $50 million (2007 $) in revenues in 2002 (Census 2002). A study done in Canada predicts that the ski season length will decrease – by as much as 65 percent in Brighton, Michigan by 2050s under the high impact scenario. Additionally, the study incorporated snowmaking costs, as most ski resorts will have to rely on the practice to sustain their operations. The model predicts an increase of 10-16 percent in costs associated with snowmaking (Scott et al 2006). MISSING INFORMATION AND DATA GAPS The major missing links in preparing for unavoidable impacts of climate change relate to the water supply networks in the state. Climate change effects are projected to cause both a rise in temperatures and more frequent severe rainfall events. This causes a special challenge to municipal water supply managers. On the one hand, dryer conditions will likely lower water levels in many crucial aquifers, especially those adjacent to the Great Lakes. On the other hand, more frequent severe precipitation may cause more frequent flooding in some reservoirs, as well as potentially introducing more pollutants to the water source requiring more extensive treatments. Preparedness plans for these scenarios need to be researched and established. CONCLUSIONS The abundant natural resources of the state shaped Michigan’s economy. However, as global climate change effects continue to take place many of the economically valuable resources may be endangered. Lower water levels in the Great Lakes may reduce the connectivity along the Great Lakes-St. Lawrence shipping route undermining the manufacturing sector’s relatively cheap transportation method. Changes in the water levels in the lakes are projected to have other impacts – affecting the water supply for domestic and agricultural uses and damaging the recreational potential of the area. Changes in temperature and precipitation events are predicted to influence agriculture, forestry, and wildlife tourism sectors and cause infrastructure damage. Immediate action to prevent further advance of climate change is needed to stave off worst-case effects. Lessons Learned As we begin to quantify the potential impacts of climate change and the cost of inaction, the following five lessons are learned:

16
1. There are already considerable costs to society associated with infrastructures, agricultural and silvicultural practices, land use choices, transportation and consumptive behaviors that are not in synch with past and current climatic conditions. These costs are likely to increase as climate change accelerates over the century to come.
2. The effects of climate change should not be considered in isolation. Every state’s economy
is linked to the economies of surrounding states as well as to the national and global economy. While the economic costs of climate change are predicted to vary significantly from state to state, the negative impacts that regional, national and global markets may experience are likely to affect all states and many sectors.
3. While some of the benefits from climate change may accrue to individual farms or businesses,
the cost of dealing with adverse climate impacts are typically borne by society as a whole. These costs to society will not be uniformly distributed but felt most among small businesses and farms, the elderly and socially marginalized groups.
4. The costs of inaction are persistent and lasting. Benefits from climate change may be brief
and fleeting -- for example, climate does not stop changing once a farm benefited from temporarily improved growing conditions. In contrast, costs of inaction are likely to stay and to increase.
5. Climate models and impact assessments are becoming increasingly refined, generating
information at higher spatial and temporal resolutions than previously possible. Yet, little consistency exists among studies to enable "summing up" impacts and cost figures across sectors and regions to arrive at a comprehensive, state-wide result.
6. To provide not just a comprehensive state-wide assessment of impacts and cost, but to
develop optimal portfolios for investment and policy strategies will require support for integrative environmental research that combines cutting-edge engineering solutions with environmental, economic and social analysis. The effort and resources required for an integrative approach likely pales in comparison to the cost of inaction.

17
WORKS CITED
Andresen, J. A. March 2007. Historical Climate Trends in Michigan and the Great Lakes Region. Michigan State University. MSU Climate Change Symposium. Available online: http://environment.msu.edu/climatechange/presentations.html
Barnett, T.P. (1984), ‘The estimation of “global” sea level change: a problem of uniqueness’,
Journal of Geophysical Research, 89: 7980-7988. Bureau of Economic Analysis (BEA). 2006. Regional Economic Accounts, Available online:
www.bea.gov/regional/index.htm Bureau of Labor Statistics (BLS). 2008. Consumer Price Indexes: Inflation Calculator.
Available online: http://www.bls.gov/cpi/ Census. 2002. Economic Census. Available online: www.census.gov Census 2003. National Survey of Fishing, Hunting, and Wildlife-Associated Recreation:
Michigan. Available online: http://www.census.gov/prod/2003pubs/01fhw/fhw01-mi.pdf Choi Onelack, and Fisher, A. 2003. The Impacts of Socioeconomic Development and Climate
Change on Severe Weather Catastrophe Losses: Mid-Atlantic Region (MAR) and the US. Climatic Change 58: 149-170.
Chmielewski, F-M. Mueller, A. and Bruns, E. 2004. Climate changes and trends in phenology of fruit trees and field crops in Germany, 1961-2000. Agricultural and Forest Meteorology. 121: 1-2: p. 69-78.
Dearmont, D., McCarl, B.A., and Tolman, D.A. 1997. Costs of Water Treatment Due to Diminished Water Quality: A Case Study in Texas. Available online: http://agecon2.tamu.edu/people/faculty/mccarl-bruce/papers/535.pdf
Douglas, B.C. (2001), ‘An introduction to sea level’, in Sea level rise: history and consequences,
B.C. Douglas, M.S. Kirney, and S.P. Leatherman (eds), San Diego, CA: Academic Press, pp. 1-11.
Easterling, D.R. and T. R. Karl 2001. Potential Consequences of Climate Variability and Change
for the Midwestern United States. Climate Change Impacts on the United States: The Potential Consequences of Climate Variability and Change. In, Ch. 6, pp 167-188. Report for the US Global Change Research Program. Cambridge University Press, Cambridge, UK. Available online: www.usgcrp.gov/usgcrp/nacc/midwest.htm
Easterling, D. R., G. A. Mehl, et al. (2000), ‘Climate extremes: observations, modeling, and
impacts’, Science, 289: 2068-2074.

18
Environment Canada. January 2008. Level News: Great Lakes – St. Lawrence River Water Levels. Volume 16, Number 02. Available online: www.on.ec.gc.ca/water/level-news/ln200802_e.html
Frederick, K.D. and P.H. Gleick (1999), ‘Water And Global Climate Change: Potential Impacts
on US Water Resources’, Washington, DC: Pew Center on Global Climate Change. Great Lakes Cruising Coalition (GLCC). 2004. Just the Facts – Study shows the Great Lakes
Cruising Industry’s Impact. Available online: www.greatlakescruisingcoalition.com/press_a10.html
Great Lakes Regional Assessment Group. 2000. Preparing for a Changing Climate: The
Potential Consequences of Climate Variability and Change. Available online: www.geo.msu.edu/glra/PDF_files/GLRA_report.pdf
Ground Water Protection Council (GWPC). 2000. Michigan Ground Water Conditions.
Oklahoma City, Oklahoma: GWPC. Available Online: www.gwpc.org/e-library/e-library_documents/e-library_documents_state_fact_sheets/michigan.pdf
Intergovernmental Panel on Climate Change (IPCC) (2001), Climate Change 2001: Working
Group II: Impacts, Adaptation and Vulnerability, Intergovernmental Panel on Climate Change, Cambridge: Cambridge University Press.
IPCC (2007), Climate Change 2007: Synthesis Report for the Fourth Assessment Report of the Intergovernmental Panel on Climate Change. Available online: www.ipcc.ch/ipccreports/ar4-syr.htm
IPCC (2007), Climate Change 2007: Working Group II: Impacts, Adaptation and Vulnerability, Intergovernmental Panel on Climate Change, Cambridge: Cambridge University Press.
Lehman, J. 2001. How might future climate affect lake temperature, mixing, algae, and small
invertebrates? Conference Report on Water Ecology Workshop. Mackey, Scudder D. March 2007. Climate Change Impacts and Adaptation Strategies for Great
Lakes Nearshore and Coastal Systems. Michigan State University. MSU Climate Change Symposium. Available online: http://environment.msu.edu/climatechange/presentations.html
Michigan Department of Agriculture. 2004. Cherries. Available online: www.michigan.gov/mda/1,1607,7-125-1570_2468_2469-12733--,00.html
Michigan Department of Environmental Quality. 2006. Water Withdrawals for Public Water Supply in Michigan: 2006.
Michigan Department of Natural Resources. 2007. Available online:
www.michigan.gov/dnr/0,1607,7-153-10365---,00.html
19
Michigan Snowmobile Association. 2007. Interesting Stats and Facts. Available online: www.msasnow.org/Snowmobile%20Facts.htm
Michigan Society of American Foresters. 2007. Forest Management Guidelines for Michigan.
Available online: Michigantimber.com/tf.htm Michigan State University (MSU). 2004. Michigan Tourism. Department of Community,
Agriculture, Recreation and Resource Studies. Available online: http://web4.canr.msu.edu/mgm2/econ/michigan.htm
Michigan State University. 2006. Agriculture, food system study shows potential for new job,
industry growth. Available online: http://newsroom.msu.edu/site/indexer/2644/content.htm Mortsch, Linda. March 2007. Decision-making in the Great Lakes: Challenges of Mainstreaming
Adaptation to Climate Change. Michigan State University. MSU Climate Change Symposium. Available online: http://environment.msu.edu/climatechange/presentations.html
National Assessment Synthesis Team. 2001. Climate Change Impacts on the United States: The
Potential Consequences of Climate Variability and Change. Report for the US Global Change Research Program. Cambridge university Press, Cambridge, UK. Available online: www.usgcrp.gov/usgcrp/nacc
National Oceanic and Atmospheric Administration. 2007. Historic Temperature O’Neal, M. R. et al. 2005. Climate Change Impacts on Soil Erosion in Midwest United Status
with Changes in Crop Management. Catena 61: 165-184.
Parker, R. 2008. Extent of Southwest Michigan frost damage to fruit crops is unclear. Kalmazoo Gazettee. Available online: www.mlive.com/news/kzgazette/index.ssf?/base/news-28/1209653417193840.xml&coll=7
Pielke, Jr., R.A., M.W. Downton, and J.Z. Barnard Miller, 2002: Flood Damage in the United States, 1926-2000: A Reanalysis of National Weather Service Estimates. Boulder, CO: UCAR. Available online: www.flooddamagedata.org/full_report.html
Port Detroit Statistics. 2000. Economic Impact. Detroit/Wayne County Port Authority.
Available online: www.portdetroit.com/statistics/stat_economic_impact.htm Proceedings of the National Academy of Sciences of the United States of America (PNAS).
2007. Emissions pathways, climate change, and impacts on California. Available online: www.pnas.org/cgi/reprint/0404500101v1
RESI, 2008. Calculations using modified IMPLAN™ economic model from the Regional
Economic Studies Institute (RESI) of Towson University.

20
Scott, Daniel, McBoyle, G, and Minogue, A. 2006. Climate Change and the Sustainability of Ski-based Tourism in Eastern North America: A Reassessment. Journal of Sustainable Tourism. Vol. 14, No. 4.
Sousounis, P., and Glick, P. 2007. The Potential Impacts of Global Warming on the Great Lakes
Region. Available online: www.climatehotmap.org/impacts/greatlakes.html Terry L. Root, Jeff T. Price, Kimberly R. Hall, Stephen H. Schneider, Cynthia Rosenzweig and J.
Alan Pounds. January 2003. Fingerprints of global warming on wild animals and plants. Nature 421, 57-60.
Union of Concerned Scientists. April 2003. Michigan: Findings from Confronting Climate
Change in the Great Lakes Region. Union of Concerned Scientists. 2007. Climate Change in Michigan US Army Corps of Engineers. 2001a. CY 2001 Waterborne Tonnage by State. Available online:
www.iwr.usace.army.mil/ndc/wcsc/statenm01.htm. US Army Corps of Engineers. 2006. Dredging Contracts Awarded: Fiscal Year 2006 Awards. USDA: Forest Service. 2006. Michigan’s Forest Resources, 2006. Research Note NRS-6. USDA, National Agricultural Statistics Service. 2007. Michigan 2006-2007 Highlights. US Department of Transportation, Maritime Administration. 2005. Industry Survey Series:
Great Lakes Operators 2005. US Fish & Wildlife Service (USFWS). 2006. 2006 National Survey of Fishing, Hunting, and
Wildlife-Associated Recreation. Available online: http://library.fws.gov/nat_survey2006_michigan.pdf
US Geological Survey. 2006. National Water Summary 1988-1989 – Floods and Droughts:
Michigan. World Port Source. 2006. Ports in Michigan. Available online:
www.worldportsource.com/ports/USA_MI.php