economic impact of refugees in the cleveland area...
TRANSCRIPT

1309 E Cary Street, Richmond, VA 23219
1025 Huron Road East, Cleveland, OH 44115
chmuraecon.com
Economic Impact of
Refugees in the Cleveland
Area, Calendar Year 2016
Prepared for the Refugee Services Collaborative
of Greater Cleveland
September 7, 2017

2
Table of Contents
SUMMARY ........................................................................................................................................................................... 2
BACKGROUND .................................................................................................................................................................... 3
RECENT STUDIES ON REFUGEE IMPACT ................................................................................................................................... 4
REFUGEE SERVICES IN THE CLEVELAND AREA ......................................................................................................................... 6
ECONOMIC IMPACT OF REFUGEE SERVICES AND REFUGEES IN THE CLEVELAND AREA .............................................................. 9
Refugee Service Organization Operations ...................................................................................................... 9
Refugee Household Spending ......................................................................................................................... 10
Refugee-Owned Businesses ............................................................................................................................. 12
Summary of Economic Impact of Refugees and Refugee Services .......................................................... 13
FISCAL IMPACT ON STATE AND LOCAL GOVERNMENTS ........................................................................................................ 14
Fiscal Impact for the Ohio State Government .............................................................................................. 14
Fiscal Impact for Cuyahoga County and Municipalities in the Cleveland Area ...................................... 15
About Chmura Economics & Analytics
We have a data-driven culture. We are a group of published scientists contributing to innovations
with big data analytics on the forefront of applied economics and technology solutions. We have a
very diverse team of people with backgrounds such as PhD economists, statisticians, computer
scientists, and transformation strategists. We serve a cross section of decision makers from the
defense, government, public, and private sectors.
As data scientists, we help our clients answer big data questions, quickly. We provide a reliable
picture of economic trends on both a macro and micro level. Our clients rely on the historical,
current, and predictive market reports we provide to cut through the confusing information they
receive on a daily basis from the media, politicians, and industry resources.
Our clients view us as trusted economic advisors because we help them mitigate risk and prepare
for growth by understanding the why, the how, and the what about their local economy. As the
nation’s preferred provider of labor market data, we help our clients understand both the demand
for and the supply of available data. Our clients benefit from our expertise by better understanding
their own bottom line costs, sustainability issues, and associated risks.

3
Summary
The Cleveland area1 has proven to be an inclusive and hospitable place for refugees displaced by wars,
famines, and persecution. Refugees in the region have enjoyed integrating into the community—a
success measured by a variety of socioeconomic indicators such as employment, income, and level of
reliance on public assistance. The arrival of these refugees has bolstered the region’s population,
increased demand for locally produced goods and services, and boosted the regional economy via
their employment and entrepreneurship. These economic activities also generate substantial taxes for the
state and local governments in the area.
From 2000 through 2016, there were 7,649 refugees resettled in the area. This study estimated that in 2016,
refugees and refugee service organizations in the Cleveland area generated a total economic impact of
$88.2 million in spending that supported 1,220 jobs in the region. The sources of economic impact are
refugee service organizations’ expenditures, refugee household spending, and refugee-owned
businesses. In addition, refugees contributed $4.5 million in taxes to both state and local governments.
Compared with the analysis for calendar year 2012, for which the impact was first estimated, the
economic impact of refugees and refugee service organizations in the Cleveland area in calendar year
2016 increased significantly. The budgets of these organizations climbed 126%, from $4.8 million to $11.0
million, and their employment more than tripled. The estimated number of refugees living in the
Cleveland area also grew by 69%. As a result, the economic impact of refugees in 2016 was more than
80% higher than the 2012 impact, both in terms of spending and job creation.
Despite misconceptions, the Cleveland area refugee community relies relatively little on public
assistance, compared with the general population.2 What public benefits they do receive come from an
influx of federal funds into the Cleveland area—without these, refugees would be diverted to other cities
that welcome new refugees. The region also benefits from both cultural and ethnic diversity that
accompany new residents from around the world.
Background
In 2013, Chmura Economics & Analytics (Chmura) completed a study titled The Economic Impact of
Refugees in Cleveland-Calendar Year 2012.3 This study, commissioned by the Refugee Services
1 In this study, the Cleveland area is defined as Cuyahoga County.
2 For example, in 2012, 21.3% of the U.S. population participated in one of the public assistance programs including
Medicaid, Supplemental Nutrition Assistance Program (SNAP), Housing Assistance, Supplemental Security Income,
Temporary Assistance for Needy Families (TANF), and General Assistance. Chmura’s survey found that only 9.5% of
refugee families received public assistance two years after their arrivals. Source: Dynamics of Economic Well-Being:
Participation in Government Programs, 2009-2012: Who Gets Assistance. U.S. Census, May 2015, available at:
https://www.census.gov/content/dam/Census/library/publications/2015/demo/p70-141.pdf
3 Source: The Economic Impact of Refugees in Cleveland: Employment & Fiscal Impact. Prepared for Refugee
Services Collaborative, by Chmura Economics & Analytics, October 2013, available at: http://rsccleveland.org/wp-
content/uploads/2013/10/ClevelandRefugeeEconomicImpactReport.pdf. This study is referred as the Chmura 2013
study.
4
Collaborative of Greater Cleveland (RSC), analyzed the economic impact of refugees in the Cleveland
area from the following three angles: 1) operations of refugee service organizations, 2) refugee
household spending, and 3) refugee-owned businesses. The 2013 study has been beneficial for RSC and
other refugee serving organizations. The Refugee Services Collaborative of Greater Cleveland links
together a group of Cleveland area organizations who serve the rising number of refugees resettling in
Northeast Ohio. It includes three Cuyahoga County refugee resettlement agencies and area school
systems, healthcare providers, and community and faith-based organizations.
The 2013 Study was based on data from 2012. Since then, the region continues to attract a large number
of refugees. This report serves as an addendum to the Chmura 2013 study with updated economic
impact based on 2016 data.
To maintain consistency, Chmura employed the same methodology as the 2013 study in analyzing the
impact for 2016. Chmura surveyed the refugee service organizations to obtain data on their budget and
spending activities. The survey also collected information on the refugees these organizations helped
settle, the percentage of refugees that obtained employment, and the number of refugees that started
their own businesses. These primary data helped Chmura estimate the direct impact of refugees and
refugee organizations in the Cleveland area. The indirect and induced impacts were estimated using
IMPLAN Pro® software after the direct impact (spending and employment) was identified.4
Recent Studies on Refugee Impact
The 2013 study included a comprehensive literature review of the studies on refugee impact. The general
conclusion of the literature is that due to the small number of refugees compared with the size of the host
nation, studies have not yet discerned the macroeconomic effect of refugee resettlement. But refugees
do have sizable impact on local communities. Studies have also found that though refugees receive
government assistance when they first arrive in the United States, they were not a social burden after a
short period of time—when they adjusted to the host society. In addition, refugees were more likely to be
entrepreneurial and enjoyed higher rates of successful business ventures compared to natives.5
Since publication of the Chmura 2013 study, the refugee issue continues to receive attention from
national and local organizations, especially in recent years due to the civil war in Syria and resulting large
number of refugees. As a result, several studies were completed since 2013. Nationally, the Migration
Policy Institute (MPI) in 2015 published a comprehensive study on the integration outcomes of refugees.6
The study found many positive outcomes of refugee integration. In the labor market, the study found that
4 IMPLAN Professional (IMPLAN Pro®) is an economic impact assessment modeling system developed by the
Minnesota IMPLAN Group that is often used by economists to build economic models that estimate the impacts of
economic changes in local economies. 5 Please see Chmura 2013 study. 6 Source: The Integration Outcomes of U.S. Refugees: Success and Challenges, Migration Policy Institute, June 2015,
available at: http://www.migrationpolicy.org/research/integration-outcomes-us-refugees-successes-and-challenges.
This is referred to as the 2015 MPI study.

5
refugee men were more likely to work than U.S.-born men (with a labor force participation rate of 67%
versus 62%), while refugee women were as likely to work as U.S.-born women (both with labor force
participation rates of 52%). The study also found that refugee income rose substantially as they lived in the
U.S. longer. Though refugees receive public assistance initially, their participation in benefit programs
declines substantially as their length of residence increases. However, the challenges are that refugees
have lower educational attainment and lower English skills, which hamper their potential success in the
labor market.
Another national study conducted by the Center for American Progress (CAP) focused on the integration
outcomes of four ethnic groups: Somali, Burmese, Hmong, and Bosnian refugees.7 This study examined
similar integration indicators as did the 2015 MPI study, and generally reached the consistent conclusion
in the areas of labor market participation, income growth, and occupation mobility as the 2015 MPI
study. This study also evaluated the impact of refugees in metro areas and concluded that these four
ethnic groups of refugees played big roles in the economic revitalization of Minneapolis-St. Paul,
Minnesota. They also helped spur growth in St. Louis, Missouri, and Columbus, Ohio, among other cities.
Several cities in Ohio conducted their own studies since the publication of the Chmura 2013 study on
Cleveland refugees. The 2015 study on the Impact of Refugees in Central Ohio utilized a similar
methodology as the Chmura 2013 study.8 The report showed that 16,596 refugees were resettled in the
Columbus Metropolitan Statistical Area (MSA) between 1983 and 2014. Franklin County (where the City of
Columbus is located) had the largest number of refugee arrivals in Ohio between 2002 and 2014,
accounting for nearly half (48.4%) of all refugees resettled in the state. In 2015, the total economic impact
of refugees was estimated to have been $1.6 billion, which supported 21,273 jobs in Central Ohio. The
economic impact came from operation of refugee resettlement agencies, refugee workers, and
refugee-owned businesses.9
In 2016, the Partnership for a New American Economy and the Knight Foundation published a report on
the contribution of refugees and immigrants to the City of Akron, Ohio.10 The study demonstrated the
effect of refugees in offsetting the population decline in the Akron area, boosting the regional housing
market values, and starting new businesses. The study also quantified that in 2013, refugees in the Akron
area had $23 million in disposable income, and paid more than $3.0 million in state and local taxes.
7 Source: Refugee Integration in the United States, Center for American Progress and Fiscal Policy Institute, June 2016,
available at: https://www.americanprogress.org/issues/immigration/reports/2016/06/16/139551/refugee-integration-
in-the-united-states/.
8 Source: Impact of Refugees in Central Ohio, 2015 Report, Community Research Partners, 2015, available at:
http://www.communityresearchpartners.org/portfolios/impact-of-refugees-in-central-ohio/. 9 This study acknowledged but did not remove overlapping impacts while aggregating three components of
economic impact to the regional level. 10 Source: Welcome to Akron: How Immigrants and Refugees Are Contributing to Akron’s Economic Growth,
Partnership for a New American Economy and Knight Foundation, 2016, available at:
http://www.newamericaneconomy.org/research/welcome-to-akron/.

6
Refugee Services in the Cleveland Area
In 2012, Chmura conducted a survey of refugee service organizations in the Cleveland area. At that time,
all refugee service organizations employed 95 workers with a total annual operational budget of $4.8
million.
Since then, the refugee service organizations have expanded, due to continued resettlement of
refugees. In May 2017, Chmura once again surveyed the eleven refugee service organizations in the
Cleveland area. The survey results show that these organizations spent an estimated total of $11.0 million
on refugee services in 2016, 126% more than the 2012 amount (Table 1). Of total expenditure, $6.4 million
was paid as wages and salaries to staff members of the refugee organizations and $1.1 million was spent
to purchase supplies and services for refugees such as food, clothing, and transportation. In addition,
these organizations paid $198,445 in the form of direct assistance (paying for services such as lodging,
travel, and utilities) to refugee families. Refugee-related capital expenditures totaled $66,400 in 2016,
including refurbishment of buildings, vehicle purchase and repair, and computer and other equipment
purchases.
Table 1: Estimated Total Refugee Service Expenditure
by RSC Organizations (2016)
Expenditure items Amount ($) Percent of Total
Wages and salaries $6,446,643 58.8%
Supplies and services for refugees $1,098,943 10.0%
Direct assistance to refugees $198,445 1.8%
Refugee-related capital expenditure $66,400 0.6%
Other expenses $3,157,691 28.8%
Total RSC Budget $10,968,122 100.0%
Total Refugee Service Employment 291
Source: Chmura Survey of RSC Organizations
Meanwhile, the number of staff members working in refugee service organizations more than tripled, from
95 in 2012 to 291 in 2016. Among these, 105 were full-time workers and the rest were part-time and
seasonal workers. In addition, 200 of the staff members were themselves refugees when they first arrived
in the United States.
In 2016, Chmura’s survey found that since 2012, the Cleveland area welcomed 3,131 new refugees in four
years, with 1,092 in 2016 alone (Figure 1). From 2000 to 2016, there were a total of 7,649 refugees settled in
the Cleveland area.

7
Like many industrial cities in the Great Lakes region, the population of Cleveland has been declining.
From 2000 to 2016, Cuyahoga County lost 144,626 residents while the City of Cleveland lost 92,594
residents.11 The influx of refugees has helped slow the population decline in the Cleveland area. Without
them, the county would have lost 152,275 while the city would have lost 97,397 residents.
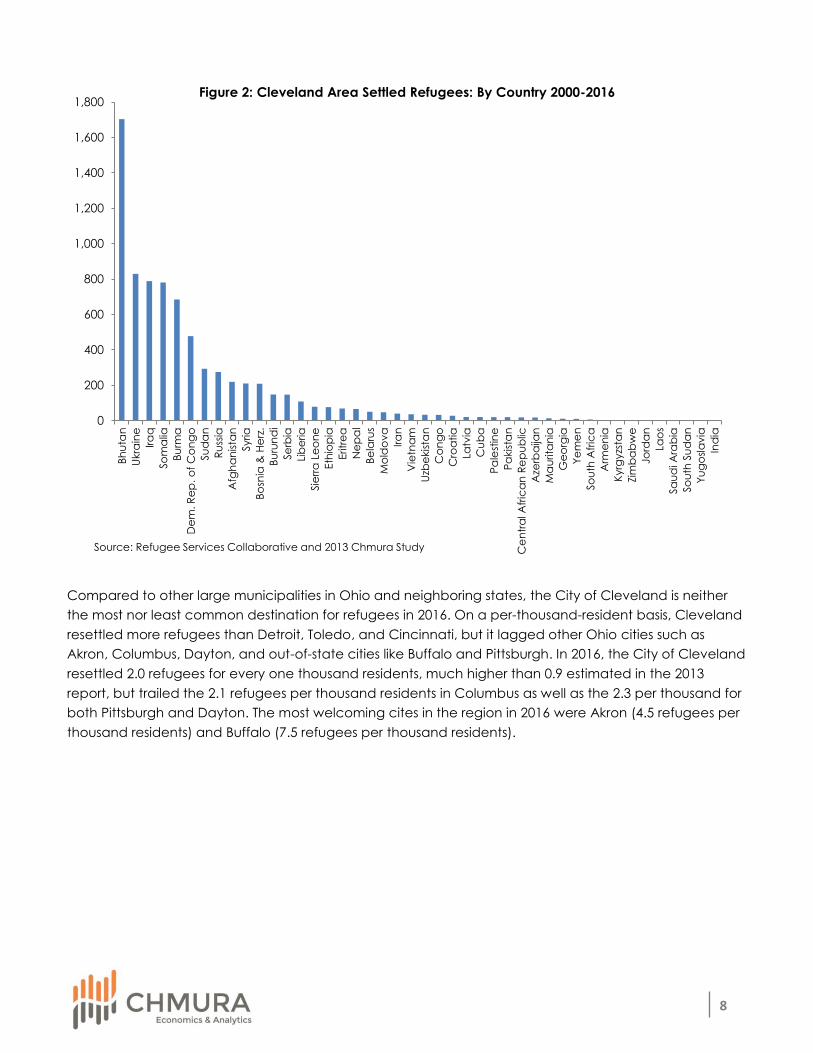
Refugees settled in the Cleveland area have come from all corners of the world. From 2000 to 2016, in
terms of country of origin, Bhutan ranked first with the largest number of refugees. This is followed by
Ukraine, Iraq, Somalia, and Burma (Figure 2). Compared with the Chmura 2013 study, the Cleveland area
continued to attract a large number of Bhutanese refugees over the past four years. In addition, there
are significant increases in Iraqi and Somali refugees, vaulting them to third and fourth, respectively.
Noticeable increases also occurred for refugees from Syria and the Democratic Republic of Congo as
civil wars in those countries produced a large number of refugees. Refugee settlements from Russia,
Bosnia and Herzegovina, and Serbia have slowed.
11 Estimated based on U.S. Census data.
521
387
267 260 285
199161
258311
350
459 463
598627
737675
1,092
0
200
400
600
800
1,000
1,200
2000 2001 2002 2003 2004 2005 2006 2007 2008 2009 2010 2011 2012 2013 2014 2015 2016
Figure 1: Number of Refugees Settled in Cleveland Area
Source: Refugee Services Collaborative and Chmura 2013 Study
8
Compared to other large municipalities in Ohio and neighboring states, the City of Cleveland is neither
the most nor least common destination for refugees in 2016. On a per-thousand-resident basis, Cleveland
resettled more refugees than Detroit, Toledo, and Cincinnati, but it lagged other Ohio cities such as
Akron, Columbus, Dayton, and out-of-state cities like Buffalo and Pittsburgh. In 2016, the City of Cleveland
resettled 2.0 refugees for every one thousand residents, much higher than 0.9 estimated in the 2013
report, but trailed the 2.1 refugees per thousand residents in Columbus as well as the 2.3 per thousand for
both Pittsburgh and Dayton. The most welcoming cites in the region in 2016 were Akron (4.5 refugees per
thousand residents) and Buffalo (7.5 refugees per thousand residents).
0
200
400
600
800
1,000
1,200
1,400
1,600
1,800
Bh
uta
n
Ukra
ine
Ira
q
So
ma
lia
Bu
rma
De
m. R
ep
. o
f C
on
go
Su
da
n
Ru
ssia
Afg
ha
nis
tan
Syria
Bo
snia
& H
erz
.
Bu
run
di
Se
rbia
Lib
eria
Sie
rra
Le
on
e
Eth
iop
ia
Eritr
ea
Ne
pa
l
Be
laru
s
Mo
ldo
va
Ira
n
Vie
tna
m
Uzb
ekis
tan
Co
ng
o
Cro
atia
Latv
ia
Cu
ba
Pa
lest
ine
Pa
kis
tan
Ce
ntr
al A
fric
an
Re
pu
blic
Aze
rba
ijan
Ma
urita
nia
Ge
org
ia
Ye
me
n
So
uth
Afr
ica
Arm
en
ia
Kyrg
yzs
tan
Zim
ba
bw
e
Jord
an
Lao
s
Sa
ud
i Ara
bia
So
uth
Su
da
n
Yu
go
sla
via
Ind
ia
Figure 2: Cleveland Area Settled Refugees: By Country 2000-2016
Source: Refugee Services Collaborative and 2013 Chmura Study

9
Economic Impact of Refugee Services and Refugees in the Cleveland Area
Refugee Service Organization Operations
The total annual expenditures of all refugee service organizations in the Cleveland area was $11.0 million
in 2016. This was spent on various items such as staff wages and salaries, supplies for goods and services,
and capital expenditures.
Inputting the direct spending amounts into the IMPLAN model, it is estimated that spending activities of
refugee service organizations generated a total economic impact (including direct, indirect, and
induced impacts) of $17.7 million in the Cleveland area in 2016. Aside from the $10.7 million12 in direct
economic impact, the indirect impact in the region is estimated to have been $2.2 million in 2016. The
beneficiaries of the indirect impact are regional businesses that provided supplies to the refugee service
organizations such as contractors, retail shops, and other service providers. The induced impact in the
region is estimated have been $4.8 million in 2016. The beneficiaries of the induced impact are mostly
consumer-service businesses (such as retail shops, restaurants, and healthcare providers) through their
provision of goods and services to employees of refugee service organizations.
12 The $10.7 million in direct impact does not match the $11.0 million in total expenditures because some of the
spending is leaked to businesses outside the Cleveland area.
0.050.4
2.1 2.0
4.5
1.3
2.3 2.3
7.5
0.0
1.0
2.0
3.0
4.0
5.0
6.0
7.0
8.0
Detroit Toledo Columbus Cleveland Akron Cincinnati Dayton Pittsburgh Buffalo
Figure 3: Refugee Arrivals per Thousand Residents, by City, 2016
Source: Bureau of Population, Refugees, and Migration, U.S. Department of State; U.S. Census.

10
Table 2: Economic Impact of Refugee Service Organization Operation (2016)
Direct Indirect Induced Total Impact
Spending ($Million) $10.7 $2.2 $4.8 $17.7
Employment 291 15 35 340
Note: Numbers may not sum due to rounding
Source: IMPLAN Pro 2015 and Chmura
Spending by refugee service organizations is estimated to have supported a total of 340 jobs in the
Cleveland area. Based on the Chmura survey, those organizations directly employed a total of 291 full-
time, part-time, and seasonal workers. In addition, spending by refugee service organizations has
supported job opportunities in other industries through indirect and induced impact. It is estimated that
these ripple effects comprised 15 indirect and 35 induced jobs in the Cleveland area in 2016.
Refugee Household Spending
From 2000 to 2016, a total of 7,649 refugees were settled in the Cleveland area.13 To understand the
economic impact of refugee households in the region in 2016, it is important to know how many of them
remained in the area. Through the Chmura survey results, it is estimated that of those refugees, 12.2%
have left the area or their contact information was lost.14 Refugees may have left the area for a variety of
reasons, such as employment opportunities, seeking education (college), or reuniting with their families.
Assuming 12.2% of refugees arriving since 2000 have left the area, it is estimated that 6,713 refugees still
lived in the Cleveland area as of 2016—78% more than the estimated number of 3,768 in 2012.15
The economic impact of refugee household spending depends on the household income of refugee
families. The sources of refugee income can be varied. Contrary to the misconception that American
taxpayers are supporting refugee families, the majority of refugees rely on their labor earnings. This is
especially evident after the initial period of transition. Granted, when refugee families first arrive in the
United States, they received nominal assistance (monetary, in-kind, and adjustment support) for a short
period of time after arrival. Those services are short-term and designed to help refugees successfully
transition to life in this country and gain economic self-sufficiency and independence.16 However, after
the initial transition period, government assistance only accounts for a small portion of their household
income, with the majority of their income coming from labor earnings. For instance, one resettlement
13 This is the sum of 4,518 refugees in the Chmura 2013 study and 3,131 new refugees from 2013 through 2016. 14 In the 2013 survey, this percentage is 16.6%. In the 2017 survey, this percentage is 7.9%. Chmura chose to use the
average of the two surveys in the analysis. 15 The economic impact estimate relating to refugee spending does not include any refugees that are originally
resettled in communities outside of northeast Ohio and then subsequently relocated to the Cleveland area—
because detailed data are lacking. 16 Please see Chmuras 2013 study for examples of those programs.

11
agency in Cleveland reported that for refugee families receiving public assistance, the assistance
amount accounted for only 12.5% of their household incomes.17
The Chmura survey indicated that refugees settled in the Cleveland area have a comparable or better
labor market performance than refugees in other areas of the nation that have been studied. For
example, the 2008 Lewin Group study reported that two years after refugee settlement, 68.2% of refugees
were employed.18 The 2015 study in Columbus reported an employment rate of 68.8%.19 The Chmura
survey results indicated that approximately 75.3% of refugees were employed after two years.20 Refugees
in the Cleveland area also showed less likelihood to receive public assistance after two years. While the
Lewin Group reported 12.4% of refugees still receive public assistance after two years, the Chmura survey
indicated that only about 9.5% of Cleveland-area refugees do so.21 In addition, the Chmura survey
indicated that the average employed refugee earned about $19,344 per year.22
Table 3: Comparison of Cleveland Indicators with Other Studies
Adult
Employment
Rate
Adult Labor
Force
Participation
Rate
Percent
Receiving Public
Assistance
Average
Annual
Wage
Cleveland Studies (2012, 2016) 75.3% 85.8% 9.5% $19,344
Lewin Group 3-city Study (2008) 68.2% N/A 12.4% $22,333
Columbus Study (2015) 68.8% 81.8% N/A N/A
MPI National Study (2015) 67.0% N/A N/A N/A
CAP National Study (2016) N/A 75.4% N/A N/A
Source: Chmura
Including both labor earnings and public assistance, and also assuming an average of 1.7 working
members per household, the average annual household income for Cleveland-area refugees is thus
estimated to have been $35,849 in 2016.23 Before average spending is estimated, household income is
further adjusted to remove possible savings.24 For a refugee family living in the Cleveland area, the
percentage of income spent outside the region is considered leakage. The IMPLAN model estimates that
17 Source: Refugee Service Collaborative of Greater Cleveland. 18 Specifically, the comparison areas cited in this paragraph are Houston, Miami, and Sacramento. See Section 3 for
further details. Source: The Evaluation of the Refugee Social Service (RSS) and Targeted Assistance Formula Grant
(TAG) Programs: Synthesis of Findings from Three Sites. Prepared by The Lewin Group, prepared for the U.S.
Department of Health and Human Services, Office of Refugee Resettlement, 2008. 19 Source: Impact of Refugees in Central Ohio, 2015 Report, Community Research Partners, 2015, available at:
http://www.communityresearchpartners.org/portfolios/impact-of-refugees-in-central-ohio/.
20 This figure is the average of 73.5% from the 2013 Survey and 77.0% from the 2017 Survey. 21 This figure is the average of 8.1% from the 2013 Survey and 11.0% from the 2017 survey. 22 This figure is the average of $19,913 from the 2013 Survey, and $18,774 from the 2017 Survey.
23 Each household having 1.7 working members is based on assumptions from the Lewin Group study in 2008 and the
Columbus study in 2015. 24 The latest consumer expenditure survey (2015) from the U.S. Department of Labor indicates a difference between
annual expenditure and after-tax income of 27% for the Midwest region.
12
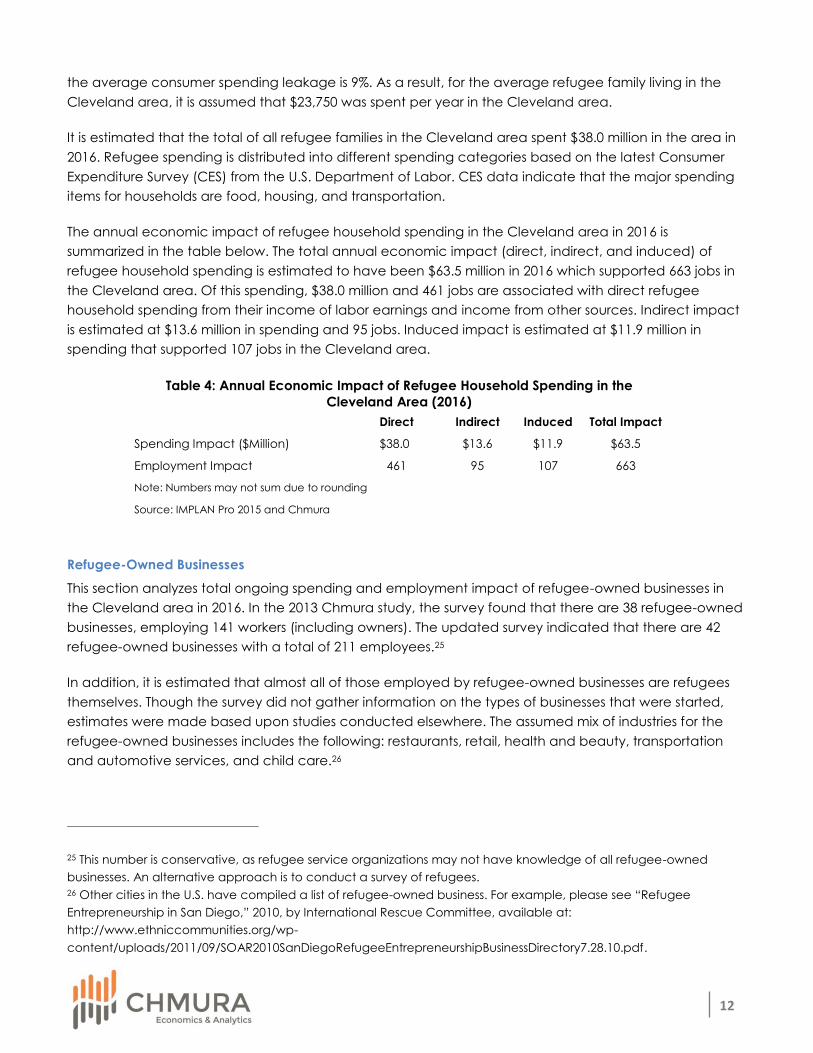
the average consumer spending leakage is 9%. As a result, for the average refugee family living in the
Cleveland area, it is assumed that $23,750 was spent per year in the Cleveland area.
It is estimated that the total of all refugee families in the Cleveland area spent $38.0 million in the area in
2016. Refugee spending is distributed into different spending categories based on the latest Consumer
Expenditure Survey (CES) from the U.S. Department of Labor. CES data indicate that the major spending
items for households are food, housing, and transportation.
The annual economic impact of refugee household spending in the Cleveland area in 2016 is
summarized in the table below. The total annual economic impact (direct, indirect, and induced) of
refugee household spending is estimated to have been $63.5 million in 2016 which supported 663 jobs in
the Cleveland area. Of this spending, $38.0 million and 461 jobs are associated with direct refugee
household spending from their income of labor earnings and income from other sources. Indirect impact
is estimated at $13.6 million in spending and 95 jobs. Induced impact is estimated at $11.9 million in
spending that supported 107 jobs in the Cleveland area.
Table 4: Annual Economic Impact of Refugee Household Spending in the
Cleveland Area (2016) Direct Indirect Induced Total Impact
Spending Impact ($Million) $38.0 $13.6 $11.9 $63.5
Employment Impact 461 95 107 663
Note: Numbers may not sum due to rounding
Source: IMPLAN Pro 2015 and Chmura
Refugee-Owned Businesses
This section analyzes total ongoing spending and employment impact of refugee-owned businesses in
the Cleveland area in 2016. In the 2013 Chmura study, the survey found that there are 38 refugee-owned
businesses, employing 141 workers (including owners). The updated survey indicated that there are 42
refugee-owned businesses with a total of 211 employees.25
In addition, it is estimated that almost all of those employed by refugee-owned businesses are refugees
themselves. Though the survey did not gather information on the types of businesses that were started,
estimates were made based upon studies conducted elsewhere. The assumed mix of industries for the
refugee-owned businesses includes the following: restaurants, retail, health and beauty, transportation
and automotive services, and child care.26
25 This number is conservative, as refugee service organizations may not have knowledge of all refugee-owned
businesses. An alternative approach is to conduct a survey of refugees.
26 Other cities in the U.S. have compiled a list of refugee-owned business. For example, please see “Refugee
Entrepreneurship in San Diego,” 2010, by International Rescue Committee, available at:
http://www.ethniccommunities.org/wp-
content/uploads/2011/09/SOAR2010SanDiegoRefugeeEntrepreneurshipBusinessDirectory7.28.10.pdf.
13
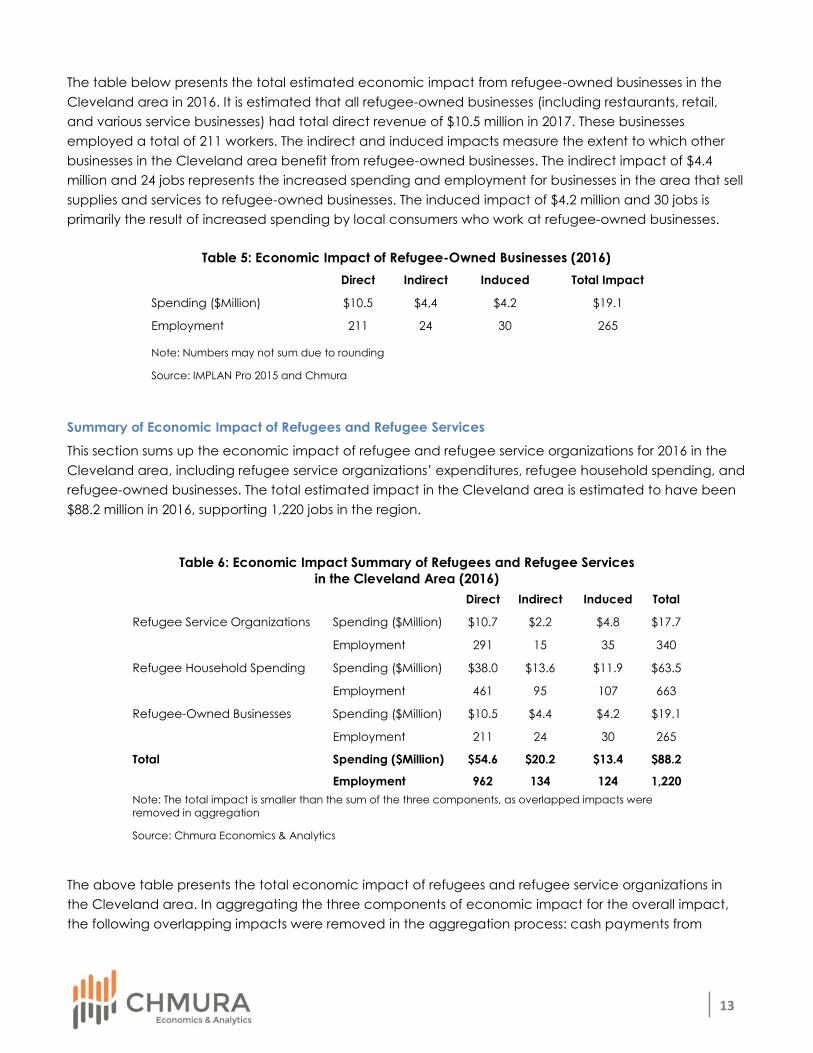
The table below presents the total estimated economic impact from refugee-owned businesses in the
Cleveland area in 2016. It is estimated that all refugee-owned businesses (including restaurants, retail,
and various service businesses) had total direct revenue of $10.5 million in 2017. These businesses
employed a total of 211 workers. The indirect and induced impacts measure the extent to which other
businesses in the Cleveland area benefit from refugee-owned businesses. The indirect impact of $4.4
million and 24 jobs represents the increased spending and employment for businesses in the area that sell
supplies and services to refugee-owned businesses. The induced impact of $4.2 million and 30 jobs is
primarily the result of increased spending by local consumers who work at refugee-owned businesses.
Summary of Economic Impact of Refugees and Refugee Services
This section sums up the economic impact of refugee and refugee service organizations for 2016 in the
Cleveland area, including refugee service organizations’ expenditures, refugee household spending, and
refugee-owned businesses. The total estimated impact in the Cleveland area is estimated to have been
$88.2 million in 2016, supporting 1,220 jobs in the region.
Table 6: Economic Impact Summary of Refugees and Refugee Services
in the Cleveland Area (2016)
Direct Indirect Induced Total
Refugee Service Organizations Spending ($Million) $10.7 $2.2 $4.8 $17.7
Employment 291 15 35 340
Refugee Household Spending Spending ($Million) $38.0 $13.6 $11.9 $63.5
Employment 461 95 107 663
Refugee-Owned Businesses Spending ($Million) $10.5 $4.4 $4.2 $19.1
Employment 211 24 30 265
Total Spending ($Million) $54.6 $20.2 $13.4 $88.2
Employment 962 134 124 1,220
Note: The total impact is smaller than the sum of the three components, as overlapped impacts were
removed in aggregation
Source: Chmura Economics & Analytics
The above table presents the total economic impact of refugees and refugee service organizations in
the Cleveland area. In aggregating the three components of economic impact for the overall impact,
the following overlapping impacts were removed in the aggregation process: cash payments from
Table 5: Economic Impact of Refugee-Owned Businesses (2016)
Direct Indirect Induced Total Impact
Spending ($Million) $10.5 $4.4 $4.2 $19.1
Employment 211 24 30 265
Note: Numbers may not sum due to rounding
Source: IMPLAN Pro 2015 and Chmura

14
refugee organizations to refugees, wages and salaries paid to refugees working in refugee service
organizations, and wages and salaries paid to refugees working in refugee-owned businesses.27
Compared with the 2012 benchmark, the economic impact of refugees and refugee service
organizations in the Cleveland area has increased significantly in four years. The budget size of these
organizations increased 126% and their employment more than tripled. The estimated number of
refugees living in the Cleveland area also grew by 69%. As a result, the economic impact of refugees in
2016 was more than 80% higher than the 2012 impact in both spending and job creation.
Fiscal Impact on State and Local Governments
Refugees and refugee service organizations also contribute tax revenue to the state and local
governments. Chmura estimated that refugees and refugee service organizations in the Cleveland area
contributed an estimated $2.7 million in tax revenue to the Ohio state government in 2016, and $1.8
million in tax revenue to the county and city governments, for a total of $4.5 million tax revenue (Table 7).
The rest of this section details the state and local tax benefits.
Table 7: Annual State and Local Tax Revenues (2016)
Refugee Service
Organizations
Refugee Household
Spending
Refugee
Businesses Total
State Tax Revenues $159,619 $2,046,790 $465,418 $2,671,827
Local Tax Revenues $150,936 $1,429,119 $231,718 $1,811,772
Total Tax Revenues $310,554 $3,475,909 $697,135 $4,483,599
Source: Chmura Economics & Analytics
Fiscal Impact for the Ohio State Government
For the state government, the main revenue sources are individual income, commercial activity, and
state sales tax. To be conservative, only tax from the direct impact is estimated here.28
For tax revenue from refugee service organizations, state individual income tax can be estimated based
on wages and salaries paid by these organizations. The Chmura survey indicated that total wages and
salaries for refugee-related work of these organizations amounted to $6.4 million in 2016, resulting in state
income tax of $159,619.29 The Commercial Activity Tax (CAT), based on gross receipts of a business, has a
current tax rate of 0.26%.30 Since refugee service organizations are nonprofit agencies, they are exempt
from this tax.
27 The Chmura survey implies that 69% of workers in refugee service organizations are former refugees, and
approximately all workers in refugee-owned businesses are former refugees. 28 This approach is recommended by The Fiscal Impact Handbook. Source: Burchell, R.W. and Listokin, D. 1978. Center
for Urban Policy Research. New Brunswick, NJ: Rutgers, The State University of New Jersey 29 Source: Ohio Department of Taxation, available at: http://www.tax.ohio.gov/ohio_individual/individual.aspx 30 Source: Ohio Department of Taxation, available at:
http://www.tax.ohio.gov/commercial_activities/information_releases/index_cat/cat_2013_05.aspx

15
Table 8: Annual State Tax Revenue for State Government (2016)
Refugee Service
Organizations
Refugee
Household
Spending
Refugee-
Owned
Businesses
Total
Individual Income Tax $159,619 $1,070,024 $103,894 $1,333,537
Commercial Activity Tax $0 $54,167 $20,420 $74,586
Sales Tax $0 $922,599 $341,105 $1,263,704
Total $159,619 $2,046,790 $465,418 $2,671,827
Source: Chmura Economics & Analytics
For tax revenue from refugee household spending, the individual income tax comes mostly from the labor
income of refugees who are employed. Based on information from the Chmura survey, it estimated that
total annual labor income was approximately $51.8 million in 2016, resulting in $1.1 million in individual
income tax.31 The CAT tax from household spending is generated as refugee households spend their
income at retail, health care, and other businesses in the Cleveland area. The CAT revenue is estimated
to have been $54,167. Ohio also has a 5.75% sales tax which is applied to household spending at retail
businesses. The state sales tax from refugee household spending is estimated to have been $922,599 in
2016.
For tax revenue from refugee-owned businesses, individual income tax comes mostly from labor income
paid out as wages and salaries. The state individual income tax from this source is estimated to have
been $103,894 in 2016. The state also collects CAT tax from gross receipts of refugee-owned businesses.
Applying the CAT rate to estimated gross revenue, the tax revenue is estimated to have been $20,420.
Finally, Ohio has a 5.75% sales tax which is applied to refugee-owned businesses such as those in the retail
and restaurant industries. The state sales tax is estimated to have been $341,105.
All combined, refugee and refugee service organizations in the Cleveland area contributed an
estimated $2.7 million in tax revenue to the Ohio state government in 2016.
Fiscal Impact for Cuyahoga County and Municipalities in the Cleveland Area
In Ohio, local taxes are administered at both the county and municipality levels. Cuyahoga County has a
county sales tax and a county bed tax. Municipalities in the county can levy municipal income tax and
admissions tax. In addition, certain school districts also levy school district income tax, but not those
districts in the county receiving refugees.
For tax revenue from refugee service organizations, municipal income tax can be estimated based on
salaries and wages paid by these organizations. The Chmura survey indicated that total wages and
salaries amounted to $6.4 million in 2016, resulting in state income tax of $150,936.32
31 This number excludes income tax for those working in refugee service organizations and refugee-owned businesses. 32 The weighted average local municipal income tax rate for all municipalities in Cuyahoga County is 2.3%. For
example, the City of Cleveland has a tax rate of 2.5%. Tax rates are available at:
https://thefinder.tax.ohio.gov/StreamlineSalesTaxWeb/default_municipal.aspx.
16
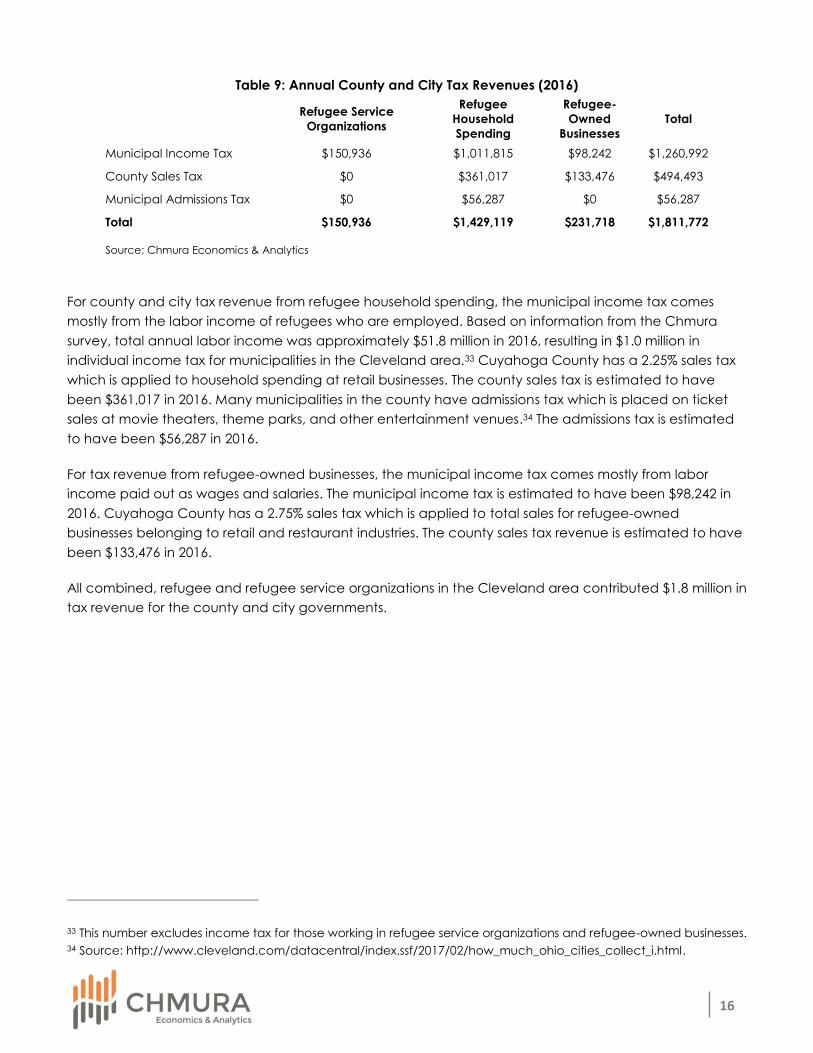
Table 9: Annual County and City Tax Revenues (2016)
Refugee Service
Organizations
Refugee
Household
Spending
Refugee-
Owned
Businesses
Total
Municipal Income Tax $150,936 $1,011,815 $98,242 $1,260,992
County Sales Tax $0 $361,017 $133,476 $494,493
Municipal Admissions Tax $0 $56,287 $0 $56,287
Total $150,936 $1,429,119 $231,718 $1,811,772
Source: Chmura Economics & Analytics
For county and city tax revenue from refugee household spending, the municipal income tax comes
mostly from the labor income of refugees who are employed. Based on information from the Chmura
survey, total annual labor income was approximately $51.8 million in 2016, resulting in $1.0 million in
individual income tax for municipalities in the Cleveland area.33 Cuyahoga County has a 2.25% sales tax
which is applied to household spending at retail businesses. The county sales tax is estimated to have
been $361,017 in 2016. Many municipalities in the county have admissions tax which is placed on ticket
sales at movie theaters, theme parks, and other entertainment venues.34 The admissions tax is estimated
to have been $56,287 in 2016.
For tax revenue from refugee-owned businesses, the municipal income tax comes mostly from labor
income paid out as wages and salaries. The municipal income tax is estimated to have been $98,242 in
2016. Cuyahoga County has a 2.75% sales tax which is applied to total sales for refugee-owned
businesses belonging to retail and restaurant industries. The county sales tax revenue is estimated to have
been $133,476 in 2016.
All combined, refugee and refugee service organizations in the Cleveland area contributed $1.8 million in
tax revenue for the county and city governments.
33 This number excludes income tax for those working in refugee service organizations and refugee-owned businesses. 34 Source: http://www.cleveland.com/datacentral/index.ssf/2017/02/how_much_ohio_cities_collect_i.html.