economic impact of douglas county nonprofit organizations
TRANSCRIPT

Economic Impact of Douglas County Nonprofit Organizations
Prepared for:
Douglas County Nonprofit Coalition
Roseburg, Oregon
Prepared by:
Community Planning Workshop Community Service Center
1209 University of Oregon
Eugene, Oregon 97403
(541) 346-3889
http://darkwing.uoregon.edu/~cpw
Project Manager:
Adam Alabarca
CPW Project Advisor:
Bob Parker
Douglas County Nonprofit Coalition Advisor:
Michael Fieldman, Umpqua Community Action Network
February 2001

Economic Impact of Douglas County Nonprofit Organizations CPW February 2001 Page i
Executive Summary
The findings of this study demonstrate that nonprofit organizations in Douglas County
significantly contribute to the health of the local economy. The 87 organizations
represented in this analysis accounted for:
1,771 total jobs in 1999
$41 million in wages and salaries
463,000 hours of volunteer time
An estimated $5.6 million of additional income and 103 additional jobs, as a result
of new dollars brought into the local economy from outside sources.
Nonprofit organizations also improve the quality of life in the community through activities
such as:
Providing social, cultural, and recreational outlets for residents and visitors
Providing social services to individuals and families in need, decreasing future costs
to society.
Background
The Douglas County Nonprofit Coalition, an informal group of local nonprofit directors,
hired Community Planning Workshop (CPW) to assess the economic impact of local
nonprofit organizations. CPW is a program in the University of Oregon’s Community
Service Center that provides research and planning assistance to Oregon communities and
governments.
This study examined the direct and indirect economic impacts of Douglas County’s
nonprofit sector. Direct impacts include revenues, expenditures, and employment
generated by nonprofits themselves. The indirect impacts capture the extra income and
jobs created by the stream of new dollars into the local economy from outside sources, as
well as the spending of those dollars on wages and salaries and on goods and services
produced by local businesses.
In addition to creating jobs and paying salaries, the nonprofit sector enhances the quality of
life of the Douglas County community by providing cultural amenities like art, music, and
theater and providing social, educational, and recreational outlets for children and adults.
Moreover, many non-profit organizations deliver social services to those in need, which
works to lower the costs of negative externalities on businesses like crime, drug use,
inadequate housing and unstable family environments. Enhancing the quality of life
makes the community more attractive to visitors, new residents, and new businesses, and
complements other economic development efforts.
In return for acting on behalf of the public good, rather than for the economic benefit of
owners or shareholders, the Internal Revenue Service exempts nonprofits from paying a
variety of taxes. This is the key difference between nonprofits and their for-profit
counterparts. It also influences how these organizations behave as well as how the public
and consumers perceive them in the marketplace. Nevertheless, nonprofits do operate like

Economic Impact of Douglas County Nonprofit Organizations CPW February 2001 Page ii
other businesses and make prudent financial decisions to ensure the stability of their
organization and sustainability of their mission-oriented activities.
The findings reported in this study are intended to help the nonprofit community better
understand their role in the economy and provide them with a resource to communicate
their impact to citizens, business, government, and potential funding sources.
Methods
This study is based on a survey of non-profit organizations registered in Douglas County.
CPW administered a mail survey to 279 organizations identified as non-profits by the
Secretary of State–Corporations Division. We received 87 valid responses yielding a 31%
response rate. Survey results suggest these 87 responding organizations represent a
significant majority of the sector’s economic impact—many of the non-respondents were
very small, volunteer-oriented groups, whose economic impact is likely to be small relative
to the entire sector.
CPW asked respondents to report revenue and expenditure data come from IRS Form 990
disclosures. Because organizations use varying fiscal year accounting periods, CPW
performed calculations with expenditure and revenue data from 1998 and 1999. This
means that some results cannot be solely attributed to 1998 or 1999, but are an estimate of
recent activity over a typical year. Responses not taken from the 990 can be dated to 1999.
Most of the respondents were also small organizations, with few or no employees and
modest revenue. For example, only 36 of the 87 nonprofits employed at least one person
full or part time. By contrast the largest nonprofit employed 864 people (full and part time)
in 1999. As a result, a small minority of large organizations contributed the great majority
of the economic impact.
Two organizations stood out from the sample—Mercy Medical Center and The Ford Family
Foundation. Mercy Medical Center (hospital only and not its affiliates) is clearly the
largest in the nonprofit sector and a major contributor to the county economy. Additionally,
over the time period from which data was collected, The Ford Family Foundation earned an
extraordinary one-time gift from the late Kenneth Ford’s estate. In terms of revenue, this
gift alone overshadowed the revenue of all nonprofits. In normal years Ford Family
remains a leader in terms of revenue and local expenditures (grantmaking).
Findings
This section describes CPW’s key research findings, organized as follows: revenue,
expenditures, employment, and indirect impacts.
Revenue
Excluding Ford Family and Mercy Medical, nonprofits generated total revenues of $38
million, with an estimated $13.9 million (37 percent) coming from sources outside of the
local economy. The average revenue was $450,000 and median only $14,300. When there
are a few numbers that are much larger than the rest of the sample (as in this case),
median values provide the best estimate of the average organization’s revenue. The low

Economic Impact of Douglas County Nonprofit Organizations CPW February 2001 Page iii
median indicates that most nonprofits in the county earn small streams of revenue. Adding
Ford Family and Mercy Medical to the calculations raises total revenue dramatically to
over $299 million.
Contributions, gifts, and grants were the most significant source of revenue, comprising 45
percent of total revenue. The second and third largest portions of total revenue came from
fees for program services (29 percent) and investment and interest income (26 percent).
Program fees are attributable to Mercy Medical, while investment and interest income can
are attributable to Ford Family.
Expenditures
Excluding the county’s two largest spenders, Mercy Medical and Ford Family, nonprofits
reported total expenditures of $24.5 million, with the average nonprofit spending $290,000
and the median nonprofit spending only $10,000. When we add back Mercy and Ford, total
expenditures increase to over $98 million, with Mercy and Ford accounting for nearly 75
percent.
The largest expenditure item was payroll, equaling $41 million for all nonprofits. This
made up nearly 42 percent of total expenditures. The second largest expenditure item was
grants or contributions, equaling over $20 million or 20 percent of the total. However, when
we subtract the largest grantor, the percentage then drops to about eight percent.
Operating costs were the third largest expenditure item (when considering all nonprofits).
But it is the second largest item if we subtract Mercy’s considerable operating costs. For a
definition of these costs, see the full report.
Employment
Excluding Mercy Medical, the largest nonprofit employer, nonprofits employed a total of
907 persons in 1999. Including Mercy, total employment equals 1,771 persons, or 4.3
percent of the non-farm employment in all of Douglas County. Sixty-three percent of the
nonprofit employees worked full-time, 37 percent worked part time. The health care and
social service were the largest employers in the nonprofit sector respectively.
CPW found that jobs in the nonprofit sector, on average, were comparable to those in other
sectors. While 38 percent of the nonprofit jobs accounted for in the study paid under $9 per
hour, 42 percent of the jobs paid over $12 per hour. Based on a 40-hour work week, $12 per
hour is just below of the county’s average annual wage of $25,000 in 1998. In addition, 75
percent of the jobs offered health benefits and 67 percent offered retirement benefits,
compared to 68 percent and 46 percent for full time non- managerial workers statewide
(2000 Oregon Employer Survey, Employment Department)
The volunteer effort mobilized by nonprofit organizations was impressive. Nonprofits
reported a total of 6,304 volunteers and over 463,000 hours contributed in 1999. This
equals approximately 73 hours per person per year, or the equivalent of 235 full-time
employees. If we value volunteer hours at $6.50 per hour (minimum wage), nonprofits
contributed an additional $3 million in service to the community.

Economic Impact of Douglas County Nonprofit Organizations CPW February 2001 Page iv
Indirect impacts
Nonprofits’ revenue, spending, and job creation creates additional economic activity in
other sectors of the economy. Economists use income and employment multipliers to
measure these effects. Multipliers tend to overestimate indirect effects and any conclusions
should be made with caution. See Chapter Four for a more thorough discussion.
Based on the data collected and the multipliers supplied by the Oregon Employment
Department, CPW estimates that for every one dollar of income brought into the local
economy by nonprofits from outside sources, approximately 40 cents of additional income is
created elsewhere in the local economy. Additionally, for every one job created as a result
of revenue from outside sources, an estimated 0.3 additional jobs are created elsewhere in
the local economy.
Since nonprofits brought in an estimated $14 million from outside revenue sources, an
additional $5.6 million dollars were circulated in the local economy. Likewise, CPW
estimates that 336 jobs were a result of outside revenue sources, which resulted in the
creation of an additional 103 jobs locally.
Table E-1. Summary of economic impact for reporting nonprofits
Category Impact
Revenue $299,873,315
Expenses $98,210,656
Payroll $41,162,441
Employment: 1,771
Full-time positions 1,111
Part-time positions 660
Volunteers: 6,304
Volunteer hours 463,518
Imputed value of volunteer time $5,562,216
Indirect effects:
Income $5,657,067
Employment (# of jobs) 103
Source: Douglas County Non-Profit Survey, CPW 2000
Conclusion
The nonprofit sector plays an important role in the Douglas County economy. Nonprofit
organizations bring in new dollars into the economy, create job opportunities for local
residents, and spend money on local goods and services. They provide essential goods like
health care, education and job training, and social services. Nonprofits also play important
roles in the community life of county residents. They provide outlets for social activities, to
pursue interests, have fun, and give back to the community.
This Executive Summary contains only a small amount of the information found in the full
report. In addition to a detailed survey analysis, the full report includes information on
nonprofits’ tax-exempt status, the economics of the nonprofit sector and its role along side
for-profits and government, and community development aspects of the sector.

Economic Impact of Douglas County Nonprofit Organizations CPW February 2001 Page v
For more information or a copy of the full report, contact the Douglas County Nonprofit
Coalition through Michael Fieldman at the Umpqua Community Action Network, (541)
672-3421. Or you may contact Suzie Johnston-Forte at the United Way of Douglas County
at (541) 672-1734.

Table of Contents
Executive Summary ................................................................................. i
Chapter One: Introduction ................................................................ 1 Background ........................................................................................................................ 1
Purpose of study................................................................................................................. 1
Methodology ....................................................................................................................... 2
Organization ...................................................................................................................... 3
Chapter Two: Economics of the nonprofit sector .................................... 5 Tax exemption.................................................................................................................... 5
The U.S. nonprofit sector ................................................................................................... 6
Economic theories of the nonprofit sector ......................................................................... 9
Political theories of the nonprofit sector ......................................................................... 13
Community development aspects .................................................................................... 14
Conclusion ........................................................................................................................ 16
Chapter Three: Profile of Douglas County Economy ........................... 17 Population ........................................................................................................................ 17
Labor force and unemployment ....................................................................................... 18
Income and wages ............................................................................................................ 20
Payroll .............................................................................................................................. 22
Conclusion ........................................................................................................................ 23
Chapter Four: Economic Impact Analysis ........................................... 25 Methodology ..................................................................................................................... 25
Characteristics of respondents ........................................................................................ 26
Economic impact .............................................................................................................. 31
Direct impacts .................................................................................................................. 31
Indirect impacts ............................................................................................................... 51
Summary .......................................................................................................................... 56
Appendix A: Miscellaneous data tables ............................................... 59
Appendix B: Q-30 Transcription and Survey Form ............................. 63
Appendix C: Bibliography and References .......................................... 69


Economic Impact of Douglas County Nonprofit Organizations CPW February 2001 Page 1
Chapter One: Introduction
Background
The nonprofit sector is characterized by a diversity of organizations engaged in a wide
spectrum of activities, including social service, education, health care, arts and culture,
recreation, and advocacy. Some groups are small, staffed by volunteers, and maintain only
a local presence. Others, like the United Way or the American Red Cross are quite large;
employing both paid staff and volunteers, and are active nationally or internationally.
Nonprofit organizations operate in the economy alongside private (for-profit) firms and
government, incorporating elements of both sectors in their activities. Described as the
“third sector,” these organizations are privately formed and operate independently—that is,
outside of government control—but they often provide goods or services that can be
collectively consumed, much like goods provided by the public sector. This dynamic of
public goods supplied by private resources places nonprofits in a unique position to provide
a range of goods and services that for-profit firms or the government are not well suited to
produce.
The economics of the nonprofit sector is often misunderstood. First of all, the range of
activities nonprofits are engaged in is not fully appreciated. Second, nonprofit status does
not preclude an organization generating revenue above costs. Third, nonprofits do not
operate primarily on contributions—only 10 percent of revenue came from private giving
sources in 1996. The largest source of revenue was fees for services, comprising 54 percent
of revenue. 1
The sector plays an important role in the economy, whether viewed at the local, regional, or
national scale. In The Emerging Sector Revisited, researchers found that nonprofits
accounted for nearly eight percent of the total nonagricultural employment in the United
States in 1995. Both the revenue and employment generated by the sector also create
ripple effects in the local economy. Nonprofits and their employees spend money locally.
Nonprofits also enhance the quality of life of communities by providing social service,
cultural, educational, and recreational amenities. These amenities draw visitors, new
residents, and businesses to an area, complementing other local economic development
efforts.
Purpose of study
The purpose of this study is to provide the Douglas County Nonprofit Coalition with an
economic impact analysis of nonprofit organizations in Douglas County. This study will
assist the coalition in communicating the nonprofit sector’s role in the local economy to the
community. Specifically, this study:
Provides an overview of the economic behavior of nonprofit organizations with
respect to its role alongside public and private, for-profit sectors.
1 Salamon, America’s Nonprofit Sector, page 37.

Economic Impact of Douglas County Nonprofit Organizations CPW February 2001 Page 2
Describes the Douglas County economy to provide a context for an analysis of the
economic impact created by the nonprofit sector.
Estimates the direct and indirect economic contributions of the nonprofit sector
with respect to revenue, employment, payroll, expenditures, and volunteer
participation.
Methodology
This study focuses on organizations that are exempt from state and federal income taxes
under Internal Revenue Service code 501c in Douglas County. Our methodology included
(1) a review of relevant literature, and (2) a survey of nonprofit organizations registered in
Douglas County with the Corporations Division of the Oregon Secretary of State.
Literature Review
CPW conducted a review of books and scholarly articles to gather information on the
structure and economics of the nonprofit sector. In addition, CPW reviewed economics
literature about impact analyses and the use of multipliers in measuring indirect economic
impacts. Multipliers are tools for measuring the number of jobs and income stimulated by
activities of a particular industry or sector of the economy. The premise behind them is
that new dollars brought into an economy from the sale of exports (in this case, grant
dollars or fees from services) will be respent on goods or services in the local economy,
creating additional income and jobs in other sectors. That additional income and jobs will
induce more local spending, and so on.
Survey
The Coalition and CPW surveyed all of the county’s 279 nonprofit organizations registered
with the Secretary of State’s office. Many of the survey questions asked respondents to
transpose numerical data from the IRS form 990 (return for tax-exempt organizations) to
the survey instrument. Other questions asked respondents to provide information relevant
to their organization’s operations, employees, volunteers, and missions.
Organization
This document is composed of five chapters and three appendices. The following chapters
present the findings of the study:
Chapter Two: Economics of Nonprofit Organizations first provides an overview of the
nonprofit sector and discusses the legal criteria that entitle nonprofits to their tax-exempt
status—their defining characteristic. Then, the chapter discusses economic and political
theories of nonprofits and how the tax-exempt status affects their role in the economy and
society. Finally, the chapter explores the value nonprofits provide to local economic
development efforts.
Chapter Three: Economic Profile of Douglas County establishes the context from
which the analysis of nonprofit economic impact can be better understood. The profile
provides a broad view of the Douglas County economy, presenting data on labor force,
employment, industrial composition, and annual wages.

Economic Impact of Douglas County Nonprofit Organizations CPW February 2001 Page 3
Chapter Four: Economic Impact Analysis presents both the direct and indirect impacts
generated by nonprofit organizations in Douglas County. The direct impacts include data
such as number of jobs created, payroll, and revenue. Indirect impacts, which refer to
economic activity created as a result of money circulating through an economy, will be
measured through the use of income and employment multipliers provided by the Oregon
Employment Department.
The appendices contain additional supporting materials including a copy of the survey,
transcription of responses to (open-ended question) Q-30, and a bibliography.

Economic Impact of Douglas County Nonprofit Organizations CPW February 2001 Page 5
Chapter Two: Economics of the Nonprofit Sector Much of the research on the nonprofit sector has occurred only in the last 30 years. This is
in part due to economists’ preoccupation with the private (for profit) sector, and to a lesser
degree, the public sector. However, in the 1970s, economists and social scientists responded
to the rise of nonprofits in the health, education, and social service industries and began to
examine the unique nature of the nonprofit sector in more detail.
Nonprofits do not fit the conventional model of private and public sector roles in the
economy. In this model, the private sector consists of independent firms, organized to
maximize profits; their behavior is typically consistent with this aim. The public sector
regulates private sector activities and the markets in which they operate. It also provides
goods and services not likely to be provided by the private sector.
That said, nonprofits could be thought of as the “third sector”—a term used to articulate the
differences between nonprofits and the private and public sectors. While nonprofits are
privately controlled, similar to corporations, they generally provide goods and services
oriented towards the public benefit. They face a slightly different set of incentives than for-
profit firms, because by law and definition, they are unable to pass net gains to owners or
stockholders. The inability to pass on profits affects both the nonprofit organization’s
behavior and the way the public and consumers perceive the sector.
Chapter Two examines the role of nonprofits in the larger economy by reviewing existing
literature and research. The chapter is divided into five sections and begins with a short
discussion of nonprofits’ tax-exempt status. Next we present a sketch of the nonprofit
sector in the United States. The third and fourth sections discuss a sampling of economic
and political theories of nonprofit organizations developed by scholars in economics and
other social sciences. The final section looks at the community and economic development
role the local nonprofit sector plays.
Tax exemption
Depending on the type of nonprofit organization (501(c) 3, 501(c) 4, etc.), preferential tax
treatment takes on various forms, including exemption from state and federal income taxes,
exemption from property and sales taxes, and the ability to receive deductible charitable
donations. The tax code is complex on this matter: twenty-seven separate sections of the
tax code apply to tax exempt organizations—each section corresponding to a certain type of
nonprofit. Examples of the types of tax-exempt organizations are religious, charitable, and
educational, labor and agriculture, fraternal organizations, social and recreational clubs,
credit unions, and cemetery companies. Nearly all of the categories are within Section 501
of the Internal Revenue Code, the most common being 501(c) 3 (religious, charitable,
educational). Sections 521 and 527 apply to farmer’s cooperatives and political
organizations respectively.
The primary and most important distinction with respect to tax treatment is between
“charitable” 501(c) 3 organizations and the organizations subject to the remaining sections
of the tax-exempt code. The word charitable is a general term used to describe 501(c) 3
organizations which, according to the IRS, are groups engaged in activities such as “relief of

Economic Impact of Douglas County Nonprofit Organizations CPW February 2001 Page 6
the poor, the distressed, or the underprivileged; advancement of religion; advancement of
education or science; erection or maintenance of public buildings, monuments, or works;
lessening the burdens of government; lessening of neighborhood tensions; elimination of
prejudice and discrimination; defense of human and civil rights secured by law; and
combating community deterioration and juvenile delinquency.”2 The remaining nonprofits
have also been called mutual benefit or member-serving organizations, and consist of groups
such as social clubs, veterans’ organizations, labor unions, and chambers of commerce.
The tax code allows charitable organizations to receive tax-deductible contributions or
gifts—mutual benefit organizations cannot. This is the essential difference between the
two types. The primary reason charitable nonprofits receive such preferential treatment is
that these groups create benefits that can be widely shared, while mutual benefit
organizations create benefits that are generally limited to the members of the group.
Additionally, tax deductibility of contributions is a strong incentive for the public to donate
to nonprofits, especially for corporations and high-income households whose tax liability is
high. Without this incentive, fundraising efforts would be much more difficult.
Tax exemption, in effect, acts as a subsidy to support nonprofits. This support from the
government is not without its critics, in terms of propriety (i.e., is it fair to for-profit firms?)
and the manner in which it is executed (i.e., through the tax system). Nevertheless, it is
generally accepted that nonprofits receive support because they provide goods that are of
public benefit, which otherwise would be provided by government or not at all. An
alternative explanation for support is that tax exemption helps to offset the sector’s
inability to generate capital through issuance of stock.
The U.S. nonprofit sector
This section gives a brief statistical overview of the U.S. nonprofit sector to provide a sense
of the scope of activity in the national economy. Data was drawn from two sources: the
Nonprofit Almanac, 1996-1997 and chapter three of America's Nonprofit Sector: A Primer.
The Almanac's most recent data dates to 1994, and the Primer's data dates to 1996. Due to
differences in subject matter in the respective publications, both sources are used to create
a more complete description.
Number and types of organizations
The nonprofit sector is quite diverse. As mentioned above, the tax code recognizes 27
different categories of nonprofits. These organizations vary in size and in activity, ranging
from hospitals, to schools, day care centers, civic organizations, hobby clubs, advocacy
groups, charities, and foundations. In 1995, the number of nonprofit organizations totaled
1.6 million—over 6 percent of all organizations.3
As mentioned in the tax-exemption section, the sector can be divided into two main
categories: member-serving organizations and public-serving (charitable) organizations.4
The member-serving category is subdivided into social and fraternal organizations,
2 http://www.irs.gov/bus_info/eo/exempt-req.html (visited 8/25/00) 3 Salamon, p. 22 4 Different authors use different terminology to describe the same entities. Member-serving and mutual benefit
are essentially the same, as public-serving and charitable.

Economic Impact of Douglas County Nonprofit Organizations CPW February 2001 Page 7
business and professional associations, labor unions, and others. The public-serving
category is subdivided into funding intermediaries (foundations), churches, service
providers, and action agencies5. Figure 2-1 illustrates how organizations within the
nonprofit sector are categorized.
Figure 2-1. Diagram of nonprofit sector
Source: America’s Nonprofit Sector
According to the Nonprofit Almanac, the number of 501(c)(3) organizations doubled from
1977 to 1992. The Almanac notes, however, that most of charitable organizations are quite
small. In 1993, only 33 percent filed a 990 return.6
5 Action agencies are considered those engage in political lobbying--essentially, 501(c)(4) "social welfare
organizations." 6 Organizations with operating revenues less than $25,000 are not required to file a 990 return to the IRS.
Nonprofit Sector
()
Member-Serving
( Public-Serving
(
Social and Fraternal Org
(
Business and Professional Assoc
(
Labor Unions
(
Mut Benefit and Cooperative Org
(
Political Organizations
(
Funding Intermediaries
(
Churches
(
Service Providers
(
Action Agencies
(

Economic Impact of Douglas County Nonprofit Organizations CPW February 2001 Page 8
Of the filers: 7
41 percent had expenses less than $100,000
31 percent between $100,000 and $500,000
9 percent between $500,000 and $1 million
12 percent between $1 million and $5 million
3 percent between $5 million and $10 million
4 percent over $10 million.
Employment
The procedures for collection and aggregation of employment data by Standard Industrial
Code (SIC) complicate analysis on the nonprofit sector. The SIC includes nonprofit
organizations, but they are not explicitly classified as such. Nevertheless, in 1994 an
estimated 9.7 million people were employed in the nonprofit sector. This represents 8.5
percent of all paid workers. In addition, volunteer hours contributed the equivalent of over
six million full time equivalent employees in 1994.8 With respect to rate of growth,
employment in nonprofits grew faster than in for-profits (providing services) form 1977 to
1994. Nonprofits experienced 3.3 percent annual growth, while for-profits experienced 3.0
percent annual growth.9
Employment in the nonprofit sector is concentrated in the health services industry. In
1994, health services held 45.5 percent of total nonprofit employment. Second to health
services was education, employing 23.2 percent of the total in 1994. Following education
were social and legal services with 13.0 percent.10
In 1994, wages and salaries of nonprofit employees totaled $205 billion, or 6.4 percent of
total wages and salaries in the national economy. Volunteers contributed an additional
$103 billion worth of earnings in 1994, increasing the nonprofit sector’s share to 7.8
percent.11 This suggests that the impact of voluntarism in the nonprofit sector is significant
and essential to operations and provision of services.
Revenue
Funding for nonprofits come from three primary sources: (1) private contributions,
including private foundations; (2) private payments (income from dues, fees, or charges);
and (3) government payments (grants and contracts). The entire sector had revenues of
$670 billion, or almost nine percent of the U.S. gross domestic product (GDP).12 Among the
sector's public benefit organizations, total revenue equaled approximately $515 billion.13
The largest source of revenue is private payments. In 1996, income from private payments
accounted for 54 percent of total revenue. Included in this category are college tuition
payments, hospital fees, and payments for goods or services. Government was the second
7 Nonprofit Almanac, p. 15 8 Ibid, p. 44 9 Ibid, p. 128 10 Ibid, p. 132 11 Ibid, p. 31 12 Ibid, p. 22 13 Salamon, p. 36

Economic Impact of Douglas County Nonprofit Organizations CPW February 2001 Page 9
largest source of nonprofit income, accounting for 36 percent. Contrary to the popular belief
that nonprofits rely heavily on donations from private sources, private contributions
accounted for only 10 percent of total income.14
Economic theories of the nonprofit sector
Simply quantifying the number of dollars or jobs created by a certain industry or set of
activities is not sufficient to understanding the impact of the nonprofit sector. A deeper
analysis should include a discussion of the economic theories that explain the nonprofit
sector’s role in the economy. Understanding why nonprofits are prominent in certain
activities is equally important as knowing how much activity they generate. This section
describes three economic rationales on the nonprofit sector: (1) public goods theory; (2)
contract failure theory; and (3) transaction cost theory. Together, these theories provide a
sound background to the economics of nonprofits.
Public Goods Theory
Although government is the primary producer of public goods, government’s involvement is
not what makes these goods “public.” Public goods are those that can be equally consumed
by multiple people. In their pure form, public goods are characterized by nonexcludability
and nonrivalry. Nonexcludability is the inability to discriminate between persons able and
unable to consume a particular good. Nonrivalry refers to the inability of one person’s
consumption of a good to limit or infringe upon another’s consumption of the same good.
The classic example of a public good is the lighthouse. Since, there is no means to regulate
who uses the services of the lighthouse, any ship’s captain can see the light and use it to
guide the ship. Therefore, it is nonexcludable. Moreover, if one captain uses the
lighthouse, that captain’s use does not interfere with another ship’s use of the lighthouse’s
services—therefore the good is nonrival.
Because of these characteristics, public goods can be enjoyed by anyone, whether or not
they have contributed to its provision. As a result, the fundamental issue with public goods
is the free-rider problem and the resulting underprovision of public goods. Since there is no
way to exclude people from enjoying the public good, individuals have no incentive to pay
their share. Moreover, one’s recognition that no one else is required to pay his or her share
presents an additional psychological incentive to avoid paying.
This situation is problematic. Welfare economic theory says that the socially optimal
provision of goods is at a point where society’s demand for a good equals its supply.
However, according to microeconomic theory, private firms maximize profits by producing
goods up to a point such that the costs of production of one extra unit equals the benefit (to
the firm) of producing one extra unit. Since consumers are unwilling to contribute to
provision of the good, there is little or no benefit to producers and as a result, production of
public goods is certain to be well below the amount truly desired by society, if at all. Thus,
we have the free-rider problem. Many economists assert that the role of the government is
to respond to this unmet demand through governmental provision of goods or services.
14 Ibid, p. 36-37

Economic Impact of Douglas County Nonprofit Organizations CPW February 2001 Page 10
Burton Weisbrod argues that the nonprofit sector’s place in the economy is to supplement
government’s provision of public goods. To explain this, Weisbrod first says that we must
assume that, more or less, government determines the level of public good output and
corresponding tax rates (to fund provision) through political voting processes.15 Assuming a
majority-wins decision rule, the outcome of the process is determined by the median voter.16
The problem with this scenario, Weisbrod explains, is that given a particular tax rate, 50
percent of the voters actually want less output than the outcome provides. At the same
time, the other 50 percent want higher output. In other words, this system leads to results
in which nearly all people do not get the outcome they most desire. According to
economists, this is not socially optimal.
To achieve a more desirable level of public good consumption, Weisbrod states that
dissatisfied individuals can: (1) move to another place with an output-tax combination that
better suits their preferences; (2) form lower-level governments to establish more optimal
conditions; (3) turn to private-market alternatives; or (4) turn to nonprofit organizations.
Moving to another place is expensive. Forming new governments is also difficult and
costly. Private markets have a difficult time producing public goods because of the free-
rider problem. These difficulties create opportunities for nonprofit organizations.
Weisbrod classifies nonprofits as “extra-governmental providers of collective-consumption
(public) goods.”17 Because government is unable to meet the demand of the 50 percent who
desire more output, nonprofits serve as a means to supplement the state’s provision and
offer alternatives to private-good substitutes. Weisbrod also states that level of under-
satisfied demand for public goods is associated to the size of the nongovernmental
(nonprofit and for-profit) sector in that industry. For example, nonprofit institutions (prep
schools, private universities) comprise a significant portion the education sector, suggesting
that a large portion of the demand for education services cannot be met by the state. This
further implies that sectors in which nonprofits are most active have the most unmet
demand.
More simply, public goods theory states that the nonprofit sector provides public goods that
the government or private sector cannot or will not provide. The private sector
undersupplies public goods because of the free rider problem. Government undersupplies
public goods because it is constrained by voting processes that respond to the choices of the
median voter, leaving a number of individuals under-satisfied. The nonprofit sector
attempts to fill the missing gaps.
According to Harry Hansmann, the public goods theory as forwarded by Weisbrod raises
two concerns. First, many of the goods that nonprofits provide are private not public. For
example, services provided in a nonprofit hospital, childcare, education in a nonprofit
preparatory school, and the entertainment provided by a nonprofit symphony orchestra
appear to be private goods, not public.18 Second, Hansmann argues that Weisbrod does not
15 Lower levels of public good provision imply lower tax rates and vice versa. 16 Because half of the electorate votes one way, and half votes the other way, the median or middle voter’s
decision will give that side the majority, and thus determine the outcome. 17 Weisbrod in Ackerman, p. 30 18 Hansmann in Powell, 29

Economic Impact of Douglas County Nonprofit Organizations CPW February 2001 Page 11
satisfactorily explain why nonprofit organizations, rather than for-profits, arise to meet
under-satisfied demand of these “private” goods.19
Contract Failure Theory
The contract failure theory takes up the question of why nonprofit organizations and not
for-profit firms. Rather than focus on sub-optimal levels of provision that the nonprofit
sector fills, this second theory looks at how the failure of a contract between producer and
consumer is rectified by a nonprofit organization.
Hansmann argues that for-profit firms will supply goods and services at prices and
quantities that maximize social efficiency, under certain conditions. He says that the
following three conditions are among the most important:20
1) Consumers can, without undue cost or effort make a reasonably accurate comparison
of the products and prices of different firms before any purchase is made.
2) Consumers can reach a clear agreement with the chosen firm concerning the goods
or services that the firm is to provide and the price to be paid.
3) Consumers will determine subsequently whether the firm complied with the
resulting agreement and obtain redress if it did not.
Because quality is easy to monitor, Hansmann says that the above conditions are generally
met with standardized industrial goods and farm produce. However, in other cases,
consumers will not be able to achieve all these conditions. Firms maximize profits, and if
consumers cannot assure quality of goods or services, consumers can fall victim to paying
excessive prices for inferior goods. In these circumstances, consumers experience contract
failure, and are better off transacting with a nonprofit organization. The nondistribution
constraint placed upon nonprofits—the inability to pass surplus on to owners or
stockholders—eliminates the incentive to profiteer.
One condition that contributes to contract failure is the separation between the
purchaser and the recipient of the service. This occurs when the purchaser of a good
or service is not the actual recipient, and is characteristic of charities that provide relief to
the poor. For example, a family in Roseburg, Oregon donates $100 to a hunger relief
organization helping distribute food in El Salvador. The family in Roseburg (the purchaser)
knows little about whether food actually ends up in the hands of hungry families in El
Salvador, nor in what condition the food is delivered. For-profit managers have the
incentive to be “efficient” and minimize costs where able, potentially compromising the
quality of service. Donors may suspect this and be reluctant to use a for-profit
organization. Nonprofits do not have this same incentive and this suggests why they are
engaged in these types of activities.
Contract failure also occurs when you have public goods. One example Hansmann uses is
the community radio station. The broadcast is a public good—you cannot exclude users and
one’s listening to the broadcast in no way prohibits another from listening as well. In this
19 Hansmann in Powell, p.29 20 Hansmann in Ackerman, p. 67

Economic Impact of Douglas County Nonprofit Organizations CPW February 2001 Page 12
situation it is easy for free riders to consume the good and not contribute to the station.
Because the station cannot charge listeners because of public good characteristics, it relies
on donations. However, donors cannot discern what part of the broadcast is being funded
by their contribution—another form of contract failure. A for-profit radio station has the
incentive to minimize costs and maximize revenues. This may take the form of raising
contributions in excess of operating expenses, since consumers would be hard pressed to
recognize the contract failure. However, potential contributors recognize the profit motive,
and will not contribute to for-profit firms when they are able to access the broadcast for
free. Again, community radio avoids much of this suspicion and can generate revenue
through donations.
A third condition where nonprofits can address contract failure is in consumption of
complex personal services such as day care, education, and health care. Hansmann
states that nonprofits often emerge in these sectors, rather than traditional industrial
goods sectors, because quality is much more difficult to monitor. He cites the complexity of
services, their nonstandardized character, and “circumstances under which they are
provided make it difficult for the consumer to determine whether the services are
performed adequately.”21 By their nature, these types of services generally place significant
trust in the provider. Having additional assurance that the consumer will not be taken
advantage of (nondistribution constraint) gives nonprofits organizations some advantages
in these industries.
Transaction Costs Theory
Michael Krashinsky argues that economists have focused too heavily on market failure as a
reason for nonprofits to emerge. Rather than focusing on nonprofits as a way to overcome
certain types of market failure (contract failure, under provision of public goods), he views
the choice between for-profit and nonprofit organization as a matter of transaction costs.
Transaction costs can be defined as the cost of executing and enforcing transactions
between two agents. Krashinksy discusses two types of transaction costs: (1) transaction
costs between producers and consumers of final goods, and (2) transaction costs among
consumers.”22
Transaction costs between producers and consumers
This is closely related to contract failure. The most common example of this type of
transaction cost is the cost of monitoring output. When the cost of monitoring quality is
high, producers have more leeway to reduce quality, cut costs, and increase profits. For
nonprofits, the nondistribution constraint removes the profit motive, reducing the concern
that consumers may be taken advantage of.
Individually monitoring output can be expensive and time consuming. Government can
reduce the costs of monitoring output by centralizing this activity via regulation. But
regulation itself costs money. Krashinksy also says it is difficult to monitor the quality of
(complex) services. Regulation may neither be adequate nor satisfactory to some consumers
in these situations; therefore nonprofits emerge as a viable option. The difference between
21 Hansmann in Ackerman, p. 71 22 Krashinksy in Ackerman, p. 115

Economic Impact of Douglas County Nonprofit Organizations CPW February 2001 Page 13
the transaction cost approach and the contract failure idea above is the focus on the costs of
monitoring the contract, not just the failure (or potential failure) of the contract.
Transaction costs among consumers
This type of transaction costs relates to the idea of public goods. We already know that
public goods are sub-optimally provided because of free rider issues—individuals can
consume whether or not they pay so they have no incentive to contribute, resulting in little
or no private provision of the public good. The socially optimal level of provision requires
that all individuals reveal their true preferences for the public good. In order to determine
the level of public good provision that everyone could agree to, all individuals would have to
bargain among each other to decide the level of output. Krashinksy argues that this is
extremely costly.
Government can solve the costly bargaining and provide the public good itself. But
determination of the amount and type of public good is itself a costly process—whether by
public vote or policy decision made by elected officials. Recalling Weisbrod’s median voter
concept, government has the tendency to respond to the median voter, leaving a
considerable number of people under-satisfied. In response, interest groups may form
nonprofits to provide the public good themselves when, according to Krashinsky, the costs
of doing so are less than trying to influence the public sector.23 Krashinsky states, “It is
thus the cost of using government and not the unwillingness of governments to serve “non-
median” voters that leads to the establishment of nonprofits to provide public goods.”24
Another costly area for government involvement is in activities that involve moral values.
Governments are less certain about the public’s acceptance of funding or support of
potentially controversial issues. One example used by Krashinsky is the abortion clinic, an
issue riddled with disagreement. As a result, governments tend not to operate these clinics;
rather they form under the auspices of a nonprofit organization. Krashinksy adds that
support of nonprofits via tax exemption and/or grants is less costly than the government
determining whether it is politically acceptable to provide these goods publicly.25
Political theories of the nonprofit sector
Because it is difficult to separate politics and economics, political reasons for the emergence
of nonprofit organizations in certain activities are related to the economic rationales
reviewed above. The following section discusses four political limitations to governments
providing certain types of goods. These themes also describe how these limitations create
opportunities for nonprofit organizations.
Categorical Constraint
The categorical constraint applies to the understanding that democratic governments must,
by law, treat all its citizens equitably and justly. In addition, the benefits the state
generates ought to be distributed fairly. James Douglas calls this universality. Because
the state must distribute benefits equitably, it is difficult for it to support the interests of
23 Krashinsky in Ackerman, p. 125 24 Ibid, p. 125 25 Ibid, p.126

Economic Impact of Douglas County Nonprofit Organizations CPW February 2001 Page 14
relatively small portions of society. To illustrate this point, Douglas quotes Lord Nathan,
chairman of a committee on nonprofit organizations in Britain. Nathan said, “Historically,
state action is voluntary action crystallized and made universal.”26
The question then arises, “Should taxpayers be required to contribute to services they feel
are neither necessary nor desirable?” Universality also acts as a constraint when the state
may lack the resources to distribute benefits to all those in need. Nonprofit organizations
are not subject to this constraint. They are able to pursue specific interests and can focus
or limit resources to particular groups or issues.
Diversity
The diversity argument builds on the idea of categorical constraint, but centers on the
paradoxical nature of pluralist democracies: universality (above) prohibits the state from
reflecting the full diversity of views and values that it is intended to tolerate and respect.27
Douglas says that a healthy voluntary (nonprofit) sector is characteristic of a democracy. In
countries that are more homogenous—where values are far more similar—the nonprofit
sector is weaker and the state supports activities that would be provided voluntarily in
democracies. Douglas also notes that diversity occurs with respect to the scale of provision,
in addition to the type of goods provided. Preferences are certain to differ on the amount of
provision as well as the kind of provision. Again, Weisbrod’s public goods theory states that
the government will likely respond to the median voter, which enables nonprofit
organizations to fill the under-satisfied demand for goods or services.
Experimentation
Governments are also subject to limitations on innovation and experimentation in
programs or services. The political acceptability of experimentation is often tenuous.
Governments do not enjoy freedom in trying new methods that are uncertain or untested.
Conversely, the private sector (nonprofit or for-profit) has far more flexibility with
experimentation. The private sector is in better position to innovate and test new methods,
leading the way for change at the government level. According to Douglas, this is
particularly true in the area of social service.28
Bureaucratization
It is no secret that government is characterized by bureaucratization. Much of this is a
result of the expectation of public accountability. Again, universality requires that states
treat everyone fairly, and this must be enforced and documented. This creates the “red
tape” that can make government appear slow moving and unresponsive. Nonprofits are not
subject to the same levels of accountability that the public sector is, and can escape much of
the costs associated with bureaucratization. In other words, nonprofit provision of (public)
goods can be more cost effective than public provision. On the flip side, according to
Douglas, the major disadvantage to public officials in using nonprofits to deliver services
was accountability.29
26 Douglas in Ackerman, p. 46 27 Ibid, p. 47 28 Ibid, p. 48 29 Ibid, p. 50
Economic Impact of Douglas County Nonprofit Organizations CPW February 2001 Page 15
Community Development Aspects
The economic and political theories above attempt to explain, in different ways, why
nonprofits emerge in various economic activities. However, an understanding of the
nonprofit sector's economic impact should not be limited to merely "why and under what
conditions" or "how many jobs and how much income", but how the emergence of nonprofits
affects other activity in a given economy. Perhaps this is the more important question for
community leaders.
Keith Snavely and Roger Beck argue that not only do nonprofits create jobs and income in a
local economy, but enrich the livability of a community such that it is an attractive place for
new businesses and residents to locate. Economic development, as Snavely and Beck
conceive of it, is not merely the act of creating jobs, but a more “holistic approach to
enhancing the quality of life of all community residents, including the economic
environment within which businesses must operate.”30 If we accept this definition of
economic development, we can then expand our understanding of the nonprofit sector’s
impact on the community.
Nonprofits provide both nonmarket and market functions to community economic
development. Nonmarket functions are those associated with providing amenities like
culture, recreation, and social services. Market functions relate to direct job and income
creation and the offering of producer and consumer services.
Nonmarket functions
As mentioned above, nonprofits supply many cultural and recreational amenities, such as
museums, performing arts centers, and zoos. Nonprofits are also vehicles for individuals to
support fairs and festivals, preserve natural and historical resources, and to meet and
interact with people with similar interests. An abundance of these amenities attract
employers and residents alike.
Another nonmarket function is what Snavely and Beck call “redevelopment activities”
which include housing rehabilitation, community organizing, and job training.31 Because of
weak economic incentives for for-profit firms to engage in such activities, nonprofits are in a
better position to fill the need, because of their mission-based orientation. Conventional
firms are reluctant to bear the financial risk associated with redeveloping housing,
providing affordable housing, or generally investing in economically distressed
communities. Community development corporations (CDCs) are a prime example of
nonprofits engaged in these activities.
A third nonmarket function of nonprofits is implementation of social welfare or
redistributive programs. These programs include food banks or homeless shelters. Snavely
and Beck argue that charitable nonprofits help the community meet the social welfare goals
of economic development that the for-profit sector cannot. They also suggest that these
30 Snavely and Beck, p. 226 31 Ibid, p. 218

Economic Impact of Douglas County Nonprofit Organizations CPW February 2001 Page 16
organizations can lower the costs of negative externalities on businesses like crime, drug
use, inadequate housing, and unstable family environments.32
Market functions
The market functions of nonprofit organizations refer to its potential to stimulate job and
income growth. Economic base theory explains that export industries like agriculture and
manufacturing bring in income from outside of the community. These industries, in turn,
spend that money locally and further contribute to the local economy. The multiplier
coefficients used in Chapter 4 are based on this theory.
As service industries have become more and more predominant, economic base theory has
likewise included the contributions of the service sector. Nonprofit service providers play a
significant part in this process as well. For example, households outside the immediate
economy consume health care services provided by nonprofit hospitals. Universities and
colleges bring in tuition and research dollars. Museums, festivals, and other performing
arts bring in visitors who spend money locally as well.
Conclusion
Despite an orientation away from profit maximizing, nonprofit organizations are clearly an
important part of the larger economy. In fact, theory explains that the inability to pass
profits to owners—the nondistribution constraint—creates the opportunities that nonprofits
enjoy. Because for-profit firms will not provide public goods due to the free rider problem
and government cannot provide all the public goods demanded by society because of
political constraints, nonprofits will fill the unmet demand. In addition, because some
goods are consumed under conditions that are difficult for consumers to monitor, they feel
more comfortable using nonprofit suppliers because they do not have the incentive to take
profits.
Finally, nonprofits have a significant role in the economic development efforts of a
community. They directly employ people as well as engage in activities that stimulate
economic growth. These activities include providing cultural and environmental amenities
that enhance the community’s quality of life and make it more attractive to new residents
and employers. Nonprofits also sell services to consumers from outside of the community.
This export revenue circulates through the local economy, creating new economic activity.
32 Ibid, p. 220-221
Economic Impact of Douglas County Nonprofit Organizations CPW February 2001 Page 17
Chapter 3: Profile of Douglas County Economy
Without an understanding of the performance of the region’s broader economy, information
about the contribution of the nonprofit sector would be incomplete. A profile of the Douglas
County economy provides us a context from which to understand the impact of the County’s
nonprofit sector. This chapter describes the following economic trends: population growth,
labor force participation and unemployment, and income by sector.
Population
According to the Center for Population Research and Census at Portland State University,
Douglas County’s population was 100,850 in 1999, the ninth most populous county in
Oregon. More interesting, though, is how rapidly the population is growing. Population
growth serves as a good proxy for the health of an economy. Job creation and opportunity
attracts new employees and residents, while economic downturns can compel residents to
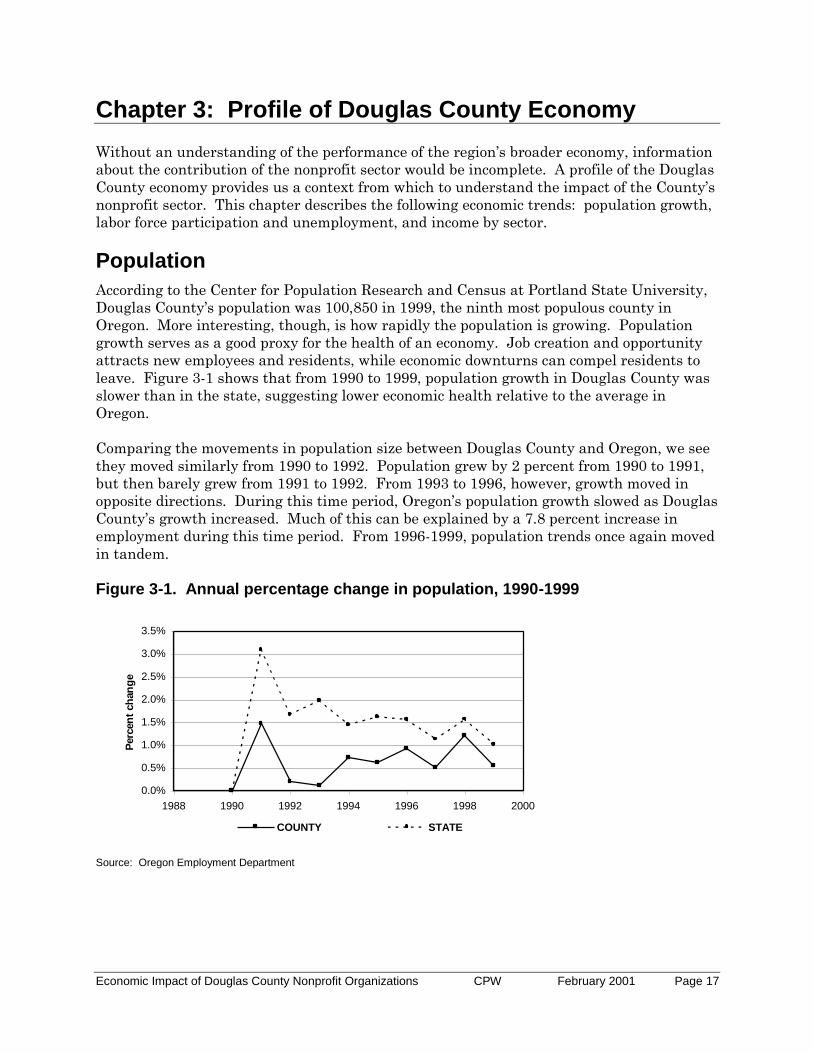
leave. Figure 3-1 shows that from 1990 to 1999, population growth in Douglas County was
slower than in the state, suggesting lower economic health relative to the average in
Oregon.
Comparing the movements in population size between Douglas County and Oregon, we see
they moved similarly from 1990 to 1992. Population grew by 2 percent from 1990 to 1991,
but then barely grew from 1991 to 1992. From 1993 to 1996, however, growth moved in
opposite directions. During this time period, Oregon’s population growth slowed as Douglas
County’s growth increased. Much of this can be explained by a 7.8 percent increase in
employment during this time period. From 1996-1999, population trends once again moved
in tandem.
Figure 3-1. Annual percentage change in population, 1990-1999
0.0%
0.5%
1.0%
1.5%
2.0%
2.5%
3.0%
3.5%
1988 1990 1992 1994 1996 1998 2000
Perc
en
t ch
an
ge
COUNTY STATE
Source: Oregon Employment Department

Economic Impact of Douglas County Nonprofit Organizations CPW February 2001 Page 18
Labor force and unemployment
Labor force
Economists define the labor force as the number of people employed or seeking
employment. Changes in the size of the labor force are a function of multiple factors
including population change and demographic shifts. For example, the nation’s labor force
will decline as baby boomers retire. The subsequent generation’s labor force is simply not
as large to compensate for the retirees.
According to the Oregon Employment Department, Douglas County’s labor force numbered
45,070 in November 2000, a less than one percent decrease from November 1999.33 Figure
3-2 plots changes in labor force size versus changes in population. The trend line shows
erratic growth. From 1991 to 1992, population growth was nearly flat, while the labor force
contracted by 2.7 percent, signaling a particularly bad point in the Douglas County
economy. The size of the labor force then began to rise, peaking at 3.4 percent growth from
1995-1996. This was followed by another contraction in 1997, a rebound in 1998, and then
the 3.1 percent contraction over 1999. In this year, the economy suffered job losses
resulting from the closings of International Paper in Reedsport, Evergreen Forest Products
in Oakland, and layoffs at Ingram Publishing in Roseburg.
Figure 3-2. Annual labor force growth versus annual population
growth, 1990-1999
-4%
-3%
-2%
-1%
0%
1%
2%
3%
4%
1990 1992 1994 1996 1998 2000
Pe
rce
nt
Ch
an
ge
POPULATION LABOR FORCE
Source: Oregon Employment Department
The shift from a manufacturing to service based economy is a well-recognized trend. For
many working class households, this shift has been accompanied by a major loss of income.
Douglas County, with an economy traditionally based in the lumber and wood products
industry, has been especially affected by changes in the economy.
33 Oregon Employment Department, Labor Trends Report, 1/01.

Economic Impact of Douglas County Nonprofit Organizations CPW February 2001 Page 19
Between 1990 and 1999, the share of employment in the “goods producing” industries fell
from 33 percent to 26 percent. In particular, employment in firms manufacturing durable
goods fell nearly 17 percent. Meanwhile, employment in wholesale and retail trade grew by
23 percent; employment in financial, insurance, and real estate services grew by 36 percent;
and employment in other services such as business and management and health services
grew by almost 33 percent over this same time period. Table 3-1 displays the percent
change of various industries in Douglas County.
Table 3-1. Percent change of employment by sector, 1990-1999
Sector Percent change, 1990-1999
Durable Goods -16.7%
Nondurable Goods -46.1%
Construction and Mining 59.0%
Transportation and Public Utilities -5.8%
Wholesale and Retail Trade 22.9%
Finance, Insurance, and Real Estate 36.5%
Services 32.6%
Government 17.1%
Source: Oregon Employment Department
Figure 3-3 below shows the distribution of employment in Douglas County by industrial
sector in 1999. Despite the large decrease in employment in the durable goods sector, it
still comprised over 20 percent of (nonfarm) employment in the county in 1999. County
employment tends to be dominated by the wholesale and retail trade, government, services,
and durable goods sectors. Together they constitute over 86 percent of employment.

Economic Impact of Douglas County Nonprofit Organizations CPW February 2001 Page 20
Figure 3-3. Percent of total nonfarm employment by sector in 1999
22.7%
22.0%
21.5%
20.4%
3.5%
1.3%
4.4%
4.3%
0% 5% 10% 15% 20% 25%
Whlsl and Retail Trade
Government
Services
Durable Goods
Transportation and Pub Util
Construction and Mining
Fin, Ins, and RE
Nondurable Goods
% of Total Nonfarm Employment
Unemployment
The unemployment rate, defined as the percentage of the labor force not working but
actively seeking employment is a common indicator of economic health. Economists refer to
people who have stopped looking for work as “discouraged workers” and do not include
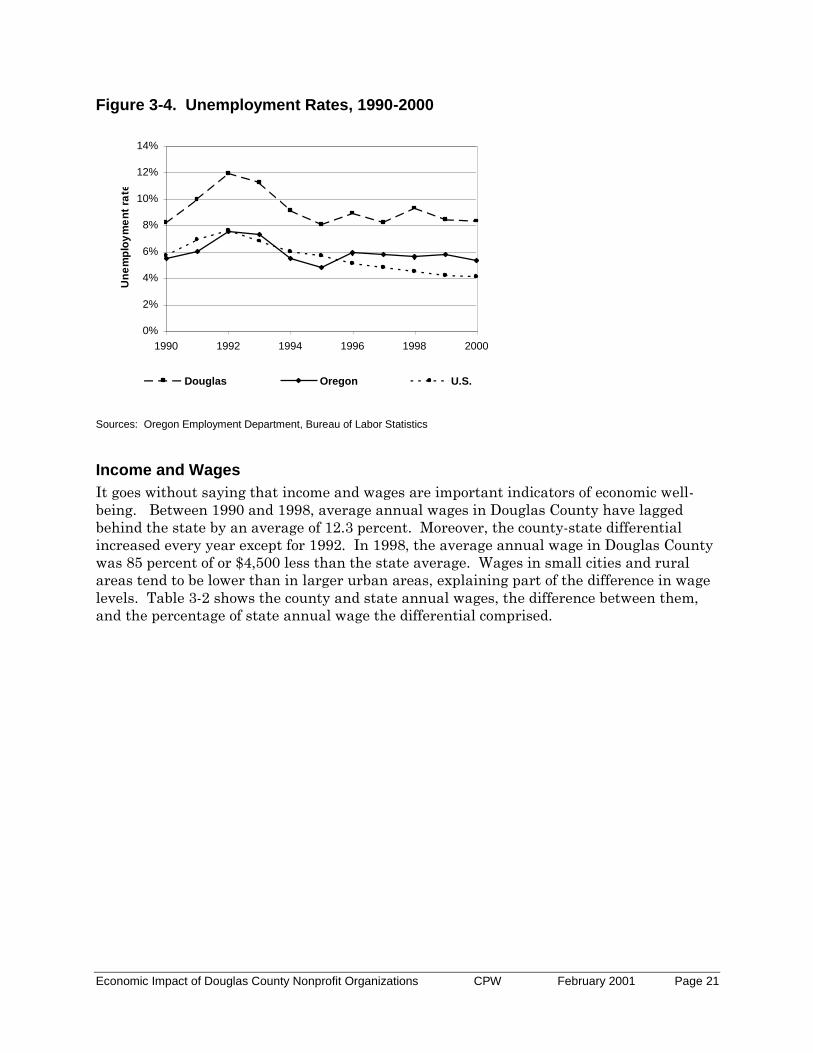
them in unemployment rate calculations. Unemployment in Douglas County has been, on
average, 3.3 percentage points higher than the state and 3.4 percentage points higher than
the nation since 1990. Figure 3-4 graphs unemployment for Douglas County, Oregon, and
the U.S. from 1990-2000. County unemployment generally moved with the state, albeit at
exaggerated levels.
Source: Oregon Employment Department
Economic Impact of Douglas County Nonprofit Organizations CPW February 2001 Page 21
Figure 3-4. Unemployment Rates, 1990-2000
0%
2%
4%
6%
8%
10%
12%
14%
1990 1992 1994 1996 1998 2000
Un
em
plo
ym
en
t ra
te
Douglas Oregon U.S.
Sources: Oregon Employment Department, Bureau of Labor Statistics
Income and Wages
It goes without saying that income and wages are important indicators of economic well-
being. Between 1990 and 1998, average annual wages in Douglas County have lagged
behind the state by an average of 12.3 percent. Moreover, the county-state differential
increased every year except for 1992. In 1998, the average annual wage in Douglas County
was 85 percent of or $4,500 less than the state average. Wages in small cities and rural
areas tend to be lower than in larger urban areas, explaining part of the difference in wage
levels. Table 3-2 shows the county and state annual wages, the difference between them,
and the percentage of state annual wage the differential comprised.

Economic Impact of Douglas County Nonprofit Organizations CPW February 2001 Page 22
Table 3-2. Differential in average annual wage, 1990–1998
Year Douglas ($) Oregon ($) Differential ($) Percent
difference
1990 19,840 21,310 (1,470) 6.9%
1991 20,447 22,346 (1,899) 8.5%
1992 21,573 23,526 (1,953) 8.3%
1993 21,591 24,097 (2,506) 10.4%
1994 22,201 24,779 (2,578) 10.4%
1995 22,800 25,837 (3,037) 11.8%
1996 23,604 27,031 (3,427) 12.7%
1997 24,325 28,407 (4,082) 14.4%
1998 25,054 29,548 (4,494) 15.2%
Source: Oregon Employment Department Avg % difference: 12.3%
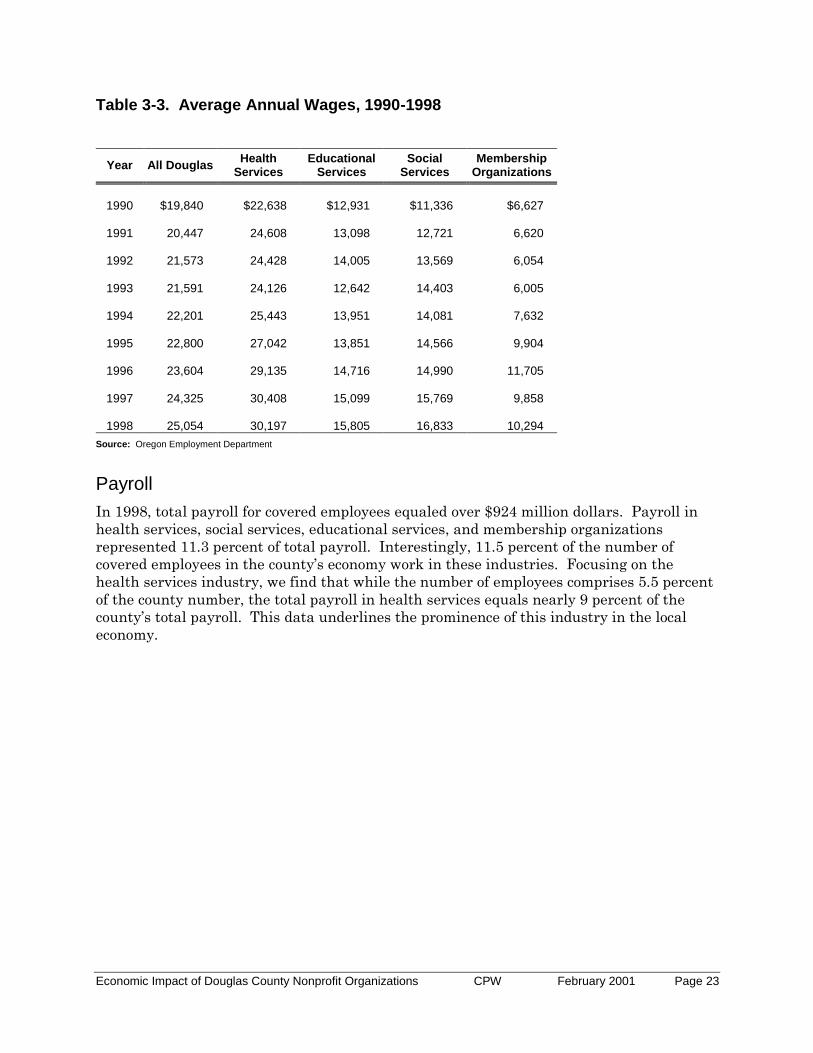
Examining the industries in which nonprofit organizations are most prevalent, the data
reveals that employees in the Health Services34 field earn higher annual wages than the
county average. Additionally, workers in Educational Services35, Social Services36, and
Membership Organizations37 earned significantly below the county average.38 From 1990 to
1998, annual wages in health services were, on average, 18 percent greater than the
county. Wages in educational services averaged only 63 percent of the county; 64 percent
for social services; and 37 percent of membership organizations. This differential may be
explained by less than full time employment by workers in these industries. Table 3-3
displays the average annual wage data.
34 Health Services occupations include doctors, nurses, technicians, and administrative staff employed in a
hospital or clinic. http://www.census.gov/epcd/naics/NDEF621.HTM#N621 (visited 10/18/2000) 35 Educational Services occupations include people employed by elementary and secondary schools, junior
colleges, universities, technical schools, and etcetera. 36 Social Services occupations include a broad range activities generally associated with social welfare activities. 37 Membership Organizations occupations include those with professional associations, business associations, or
other organizations that promote the interests of its members. 38 This data is aggregated by two-digit Standard Industrial Code (SIC).
Economic Impact of Douglas County Nonprofit Organizations CPW February 2001 Page 23
Table 3-3. Average Annual Wages, 1990-1998
Year All Douglas Health
Services Educational
Services Social
Services Membership
Organizations
1990
$19,840
$22,638
$12,931
$11,336
$6,627
1991
20,447
24,608
13,098
12,721
6,620
1992
21,573
24,428
14,005
13,569
6,054
1993
21,591
24,126
12,642
14,403
6,005
1994
22,201
25,443
13,951
14,081
7,632
1995
22,800
27,042
13,851
14,566
9,904
1996
23,604
29,135
14,716
14,990 11,705
1997
24,325
30,408
15,099
15,769
9,858
1998
25,054
30,197
15,805
16,833 10,294
Source: Oregon Employment Department
Payroll
In 1998, total payroll for covered employees equaled over $924 million dollars. Payroll in
health services, social services, educational services, and membership organizations
represented 11.3 percent of total payroll. Interestingly, 11.5 percent of the number of
covered employees in the county’s economy work in these industries. Focusing on the
health services industry, we find that while the number of employees comprises 5.5 percent
of the county number, the total payroll in health services equals nearly 9 percent of the
county’s total payroll. This data underlines the prominence of this industry in the local
economy.

Economic Impact of Douglas County Nonprofit Organizations CPW February 2001 Page 24
Figure 3-5. Percentage of total Douglas County covered payroll
Conclusion
This chapter presented a series of economic indicators to describe the performance of the
Douglas County economy. Generally, the county appears to be recovering from the
downturns experienced by the timber and forest products industry—the base of the
economy. The data and trends described here indicate that conditions are stable and
showing small improvement over time. Nevertheless, the county still experiences
unemployment above and incomes below the state average.
The industries in which nonprofits are most active contribute significantly to the overall
economy. Together, health services, educational services, social services, and membership
organizations comprise 12.3 percent of the county’s total covered payroll. Health services
alone make up nine percent of payroll. Health services also pay substantially above the
county’s average. By contrast, the other industries that we highlighted in this chapter pay
well below the county average.
All other
industries
88.7%
Educational
services
0.3% Social services
1.4%
Membership
organizations
0.6%
Health services
9.0%
Source: Oregon Employment Department

Economic Impact of Douglas County Nonprofit Organizations CPW February 2001 Page 25
Chapter Four: Economic Impact Analysis
The preceding chapters described the theoretical underpinnings of economic impact
analysis as well as the characteristics and economic impacts of nonprofit organizations on a
national basis. They provide the foundation we use to describe the economic impact
generated by the county’s nonprofit sector. This chapter presents the quantified results of
the economic impact analysis and is organized into three sections. The first section
describes the methodology: data collection and analysis. The second section describes the
characteristics of the organizations that responded to the survey. The final section presents
the results of the economic impact analysis.
Methodology
The primary data collection tool for the economic impact analysis was a survey instrument
designed to gather information from both tax returns and from general accounting and
administrative records the organization maintains. CPW chose the survey as data collection
tool because it allowed us to gather information not available on financial statements
available to the public.
Recognizing that response rates may be compromised by survey complexity and time
required for completion, the survey instrument balanced both the desire for quantity of
information and for simplicity (a copy of the survey instrument is provided in Appendix A).
CPW worked closely with the project steering committee to design the survey instrument.
The project steering committee reviewed the content, format and layout, and CPW field-
tested the survey to identify problems or ambiguities before mailing to respondents.
The survey consisted of twenty-nine questions, with the primary focus on revenues,
expenses, and employment. Twelve questions asked respondents to transfer information
from their 1999 Internal Revenue Service 990 or 990-EZ tax returns to the corresponding
survey question.39 To further ease survey time burden, CPW also offered respondents the
option to submit a copy of their most recent 990 or 990-EZ. The remaining questions asked
about other financial and non-financial aspects of the organization, such as percentages of
total revenue generated from sources outside of the county, percentage of total expenses
spent within the county, the number of employees or members, wage ranges, benefits, and
volunteer participation.
The survey asked respondents to transfer information from their 1999 tax return.
However, at the time of survey administration, many organizations had not completed their
1999 return because they operate on fiscal years that do not coincide with calendar years.
In lieu of 1999 data, respondents completed the portions of the survey that asked for
transfer of 990 or 990-EZ data from their 1998 returns. Because not all nonprofits use the
same fiscal reporting year, the data collected could span from early 1998 through 1999.
While this does not allow us to report data for a specific calendar year, it does allow us to
report data for the most recent fiscal year.
39 The survey asked respondents for information from the year 1999. However, due to discrepancies in fiscal
years and reporting deadlines, respondents completed surveys with their most recent information (either 1998
or 1999).

Economic Impact of Douglas County Nonprofit Organizations CPW February 2001 Page 26
CPW obtained a list of 277 nonprofit organizations registered with the Corporation Division
of the Secretary of State’s office. We sent surveys to all 277 organizations – a 100 percent
sample of organizations registered in Douglas County. This list, however, did not include
organizations that may be active in the county but based in another Oregon county or
registered as a corporation in another state. One example is Habitat for Humanity, which
is not included on the nonprofits list. The list did not include churches or other religious
organizations.
Survey administration commenced in mid-August 2000 and proceeded through October
2000. Prior to the first mailing, CPW sent a postcard to each organization, telling
respondents to expect a survey in the next two weeks.40 The second mailing included the
survey, with cover letter attached, and a self-addressed business reply envelope.
Approximately three weeks later, CPW conducted a third mailing to those organizations
that had yet to respond. CPW received a total of 87 completed surveys—approximately one-
third of possible respondents.
Characteristics of respondents
This section describes the composition of the survey respondents. Knowing who responded
to the survey is as relevant as knowing how they responded. Understanding the
characteristics of the respondents provides a context for the economic impact analysis
results to follow, as well as establishes the limitations of the economic impact estimates.
The analysis does not estimate the economic impact of the entire Douglas County
nonprofit sector. It presents results for those organizations that responded to the survey.
The economic activity of nonprofits in Douglas County shows substantial variation. For
example, annual revenues range from a few hundred dollars to over $100 million. Because
the characteristics of the responding population (nonprofit organizations in Douglas
County) are not homogeneous, survey results cannot be used to infer results for the whole
sector.
This analysis does compute the economic impact of the 87 that organizations responded.
Moreover, our conversations with various experts in the County suggest that our survey
includes most of the County’s larger nonprofit organizations. CPW is confident that the 87
responding organizations represent a significant majority of the sector’s economic impact in
terms of employment, revenue, and payroll. Moreover, many of the non-respondents were
very small, volunteer-oriented groups, whose economic impact is likely to be small relative
to the entire sector.
The following subsections describe the following sample characteristics: tax exempt status,
years active in Douglas County, activity area, and organization size.
40 Several addresses were undeliverable. The list contained many street addresses when post office box
numbers were unknowingly required. Obtaining the correct addresses required additional effort, and succeeded
correcting most of the invalid addresses.

Economic Impact of Douglas County Nonprofit Organizations CPW February 2001 Page 27
Tax Exempt Status
The majority of survey respondents were 501(c)3 organizations (refer to definition in
Chapter Two). Of the 87 responses, 68 were completed by 501(c)3 organizations, seven
completed by 501(c)4 organizations, and the remaining were completed by organizations of
various tax-exempt statuses. The high proportion of 501(c)3 groups is not surprising, as it
reflects the composition of the nonprofit sector nationally. Recall that organizations
registered under Internal Revenue Code section 501(c)3 are eligible to receive private
contributions that are tax-deductible for the donor.
Years Active
Survey respondents’ average years active in the county equaled nearly 28 years,
demonstrating significant longevity. The median years active equaled 12 years, still a
fairly long period of activity. The oldest organization had 150 years of activity and one
organization had just formed within the last year. Figure 4-1 displays the distribution of
organizations by years active.
Figure 4-1. Distribution of respondents by years active
16
20
11
19
13
0
5
10
15
20
25
Under 5 5 to 10 11 to 20 21 to 50 Over 50
Years Active
Nu
mb
er
of
Org
an
iza
tio
ns
Activity Area
Q-20 asked respondents to indicate the nature of their organization by choosing from seven
categories or to write in an area of activity. The most responses came from organizations
involved in the “recreational, social, cultural” category—perhaps because it was fairly
broad. The types or organizations that could be found in this category are arts or music
groups, museums, or hobby and sports groups. The next most frequent area of activity was
charity and social services, followed by education and health or medical services. Overall,
the distribution suggests that the sector is relatively diverse in Douglas County, but
concentrated in charitable work, social service, and recreational activities. Table 4-1
displays the categories and the corresponding number of survey respondents.

Economic Impact of Douglas County Nonprofit Organizations CPW February 2001 Page 28
Table 4-1. Respondent activity areas
Activity Number of
respondents % of total
Recreational, social, cultural 24 27.6%
Charity or foundation 20 23.0%
Social Services 14 16.1%
Education 7 8.0%
Health/medical 7 8.0%
Historic Resources 4 4.6%
Environmental 3 3.4%
Fraternal organization 4 4.6%
Cemetery maintenance 3 3.4%
Professional 1 1.1%
Total 87 100.0%
Source: Douglas County Nonprofit Survey, CPW, 2000
Organization Size
The sample is not only varied with respect to activity area, but also with respect to
organization size. Some respondents were very large organizations like Mercy Medical
Center, which employs 864 people. Other responses came from quite small organizations
consisting of only a few members acting on a volunteer basis. This section presents three
ways to look at organization size: revenue, number of employees, and membership size.
Revenue
The first section of the survey asked about organizational revenue, including support in the
form of gifts or grants, fees for services or contracts, membership dues, interest or
investment income, and revenue from special events.41 The average revenue earned by
respondents equaled over $1,400,000. However, median revenue was only $14,600. The
difference can be explained by the upward pull by a few organizations with very high
revenues. The low median value, coupled with the fact that 60 percent of the sample
generated total revenues below $50,000 suggests that most responding organizations are
relatively small in revenue terms. Figure 4-2 shows the distribution of organizations by
total revenue.
41 As completed surveys were received, CPW sought additional information to supplement the revenue data.
CPW used phone and email contacts to selected organizations to gather information on revenue generated from
“special events” and “total revenue”. Of the 87 original responses, new data was added to 26. This supplemental
data increase total revenues by about $1.5 million.

Economic Impact of Douglas County Nonprofit Organizations CPW February 2001 Page 29
Figure 4-2. Total revenue
20
4 5
33
1213
0
5
10
15
20
25
30
35
40
< 1K 1K to 50K 50K to 100K 100K to 500K 500K to 1M > 1M
Revenue (for most recent year available)
Nu
mb
er
of
Org
an
iza
tio
ns
Number of Employees
Q-22 asked for the number of full-time and part-time employees on the payroll. Obviously,
not all nonprofits have employees—51 of the responding organizations did not. The 36
organizations with employees had an average of nearly 50 total (full and part time)
workers. Among these 36 organizations, the median was only 5.5 (3.5 full-time, 2 part-
time) employees, indicating once again that most nonprofits in the county are relatively
small.
Looking only at those organizations that employ at least one full-time person, the average
number of employees increases to just over 60 (38 full-time, 22 part-time) people. The
median number of employees was nine, with a median of eight full-time and two part-time
workers. The largest nonprofit employed 864 people in 1999 (495 full-time, 369 part-time),
for a full-time equivalent (FTE) of 651 persons. Table 4-2 summarizes some of the
preceding statistics and Figure 4-3 displays the distribution of organizations by number of
employees.
Table 4-2. Mean and median number of employees (full and part-time)
Classification N Mean Median
All organizations 87 20.3 0
Organizations with at least 1 employee (full or part-time)
36 49.2 5.5
Organizations with at least 1 full-time employee
29 60.6 9.0
Source: Douglas County Nonprofit Survey, CPW, 2000

Economic Impact of Douglas County Nonprofit Organizations CPW February 2001 Page 30
Figure 4-3. Distribution of organizations by number of employees
51
18
1
656
0
10
20
30
40
50
60
None 1 – 5 6 – 10 15 – 50 50 – 100 Over 100
Number of Employees
Nu
mb
er
of
Org
an
izati
on
s
Membership Size42
Many nonprofits, such as social, recreational, and hobby groups, are composed of members,
dues paying or not. Q-28 asked for the number of members in 1999. About half of the
sample did not reply to this question suggesting they are not membership organizations. In
addition, most organizations in the sample had relatively small memberships. Of the
groups with membership, the average number of members was 135 and the median number
equaled 45. Over 53 percent had 50 members or less, while just over 24 percent had 100
members or more. Figure 4-4 shows the distribution of organizations by membership size.
Figure 4-4. Distribution of organizations by membership size
13
6
45
7 5
11
0
10
20
30
40
50
None 1 to 20 21 to 50 51 to 100 101 to 300 Over 300
Number of Members
Nu
mb
er
of
Org
an
izati
on
s
42 Note: Membership does not preclude an organization from having employees.

Economic Impact of Douglas County Nonprofit Organizations CPW February 2001 Page 31
Economic Impact
Economists have long conducted economic impact analyses for a variety of different
economic sectors, industries, and activities. Such analyses are useful tools for
understanding the contributions of the subject of study on the larger economy. These
studies can also be powerful and affect decisions made by governmental officials. However,
economic impact analysis studies only provide estimates of economic impacts and are
subject to a margin of error. Therefore, one should be cautious when drawing conclusions
from the results of these studies.
CPW organized the economic impact analysis into two components—direct impacts and
indirect impacts. The direct impacts include revenue, expenditures, payroll, and
employment, all of which we obtained through the survey. In addition, CPW included
expenditures, and estimates of volunteer contributions of time—an aspect unique to the
nonprofit sector.
The indirect impacts include the additional income and employment stimulated by the
economic activity of the subject sector or industry. For example, say a nonprofit generates
$500,000 in revenue. It then spends 75 percent of that income in the local economy, paying
employees and purchasing goods and services from local businesses. With this additional
revenue flow, these businesses earn more income, are more likely to increase employment.
Through their consumption, these same businesses circulate some of their revenue in the
local economy through consumption, stimulating even more income and jobs. This
multiplier effect attempts to capture the “spin-off” economic activity generated as a result of
a particular sector or industry.
Quantifying indirect impacts is less than straightforward. Economists use complex
statistical and econometric methods to derive “multipliers” from various economic data. To
calculate indirect impacts, CPW used employment and income multipliers, which are both
industry and geography specific. Therefore, multipliers for the health care industry in
Douglas County will not be the same as multipliers for the health care industry in, say,
Jackson County. Furthermore, multipliers are commonly expressed as a coefficient of the
original benefits. For example, an employment multiplier of 1.5 means that for every single
job a particular sector generates, one half of another job is created elsewhere in the
economy.
As a final note, CPW recognized that the magnitude of the Ford Family Foundation (with
respect to revenue) and Mercy Medical Center (with respect to revenue and employment)
causes a dramatic upward pull on total and mean calculations. This pull can mislead the
reader, inflating the values to levels that exceed reality. Because Ford Family and Mercy
Medical Center are so much larger than the remaining nonprofits in the county, CPW has
taken care to isolate their impacts in circumstances in which it is relevant.
Direct Impacts
As mentioned above, the direct economic impacts include revenue, employment, and
payroll. This section also calculates expenditures and volunteer time.

Economic Impact of Douglas County Nonprofit Organizations CPW February 2001 Page 32
Revenue
In this subsection, CPW presents the findings from the revenue side of the balance sheet.
The analysis is organized by total revenue, revenue by source, and revenue by area of
activity.
Total Revenue
Adding the revenues for each organization (as they reported it for either 1998 or 1999), the
87 respondents generated a total revenue exceeding $299 million dollars. As mentioned
earlier, the average revenue per organization equaled $3.4 million, while the median
revenue was just $14,600. These results underscore the variability in nonprofit
organizations and indicate that most nonprofits are quite small and just a few
organizations are very large. Mercy Medical Center and the Ford Family Foundation
accounted for over 87 percent of the sample’s total revenue, with Ford Family alone
accounting for 65 percent.43
If we look solely at the remaining 85 nonprofits, total revenues equaled nearly $38 million.
The new average is $440,000 and the median remains $14,300, indicating once more that
most nonprofits in the county are small. Table 4-3 summarizes the results.
Table 4-3. Summary statistics for total revenue in dollars
Classification # of Org.’s Total Mean Median
All nonprofits 87 299,873,315 3,446,820 14,663
Excluding Mercy and Ford 85 38,298,516 450,570 14,351
Source: Douglas County Nonprofit Survey, CPW, 2000
Revenue by source
Nonprofits, like other organizational entities, derive income from various sources. The
survey asked respondents to break down revenue into the following categories:
Contributions, gifts, and grants
Services, including fees and contracts
Membership dues
Interest or investment income
Special events and miscellaneous income44
Contributions, gifts, and grants
The IRS considers contributions, gifts, and grants to be amounts of money received from
sources voluntary in nature, meaning at the individual or grantor’s discretion. This
category includes private donations from individuals as well as grants from government
43 Norman Smith, President of The Ford Family Foundation, noted that revenue levels from contributions, gifts,
or grants for 1999 are an extreme aberration due to the transfer of the deceased Kenneth Ford’s estate to the
Foundation. According to the Ford Family Foundation, they typically receive no revenue from contributions,
gifts or grants. 44 See footnote 4. CPW added revenue from special events to capture money earned from fundraising and other
activities.
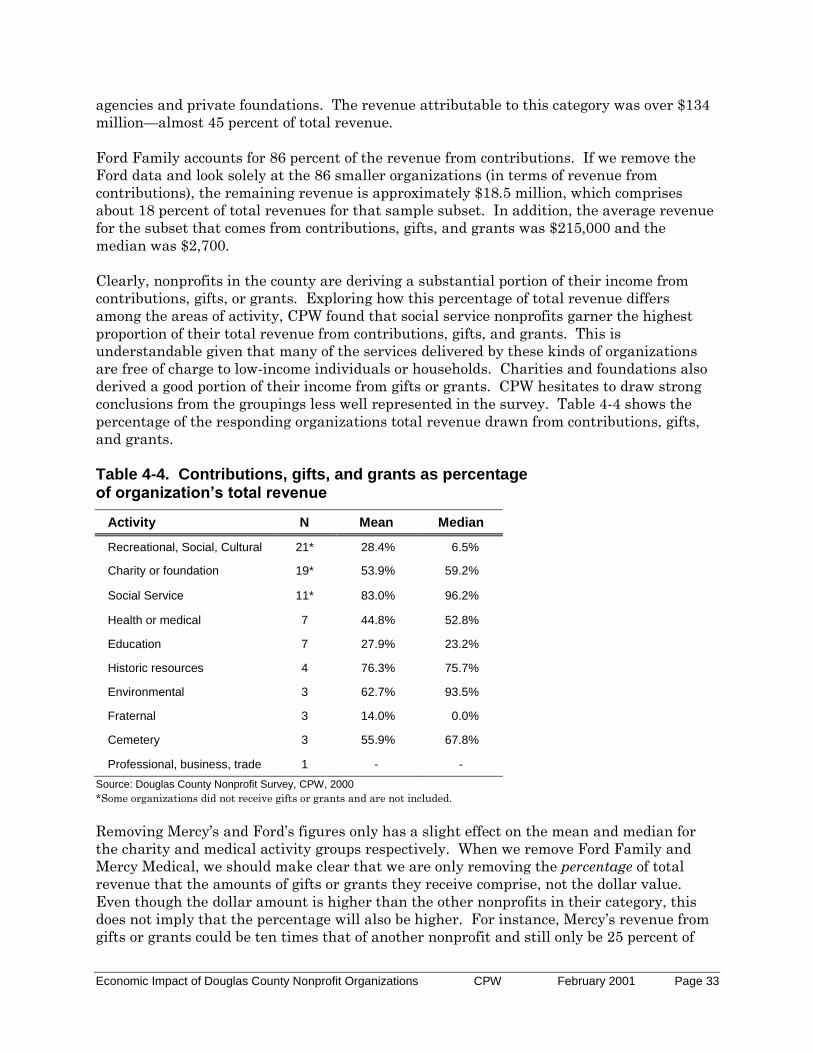
Economic Impact of Douglas County Nonprofit Organizations CPW February 2001 Page 33
agencies and private foundations. The revenue attributable to this category was over $134
million—almost 45 percent of total revenue.
Ford Family accounts for 86 percent of the revenue from contributions. If we remove the
Ford data and look solely at the 86 smaller organizations (in terms of revenue from
contributions), the remaining revenue is approximately $18.5 million, which comprises
about 18 percent of total revenues for that sample subset. In addition, the average revenue
for the subset that comes from contributions, gifts, and grants was $215,000 and the
median was $2,700.
Clearly, nonprofits in the county are deriving a substantial portion of their income from
contributions, gifts, or grants. Exploring how this percentage of total revenue differs
among the areas of activity, CPW found that social service nonprofits garner the highest
proportion of their total revenue from contributions, gifts, and grants. This is
understandable given that many of the services delivered by these kinds of organizations
are free of charge to low-income individuals or households. Charities and foundations also
derived a good portion of their income from gifts or grants. CPW hesitates to draw strong
conclusions from the groupings less well represented in the survey. Table 4-4 shows the
percentage of the responding organizations total revenue drawn from contributions, gifts,
and grants.
Table 4-4. Contributions, gifts, and grants as percentage of organization’s total revenue
Activity N Mean Median
Recreational, Social, Cultural 21* 28.4% 6.5%
Charity or foundation 19* 53.9% 59.2%
Social Service 11* 83.0% 96.2%
Health or medical 7 44.8% 52.8%
Education 7 27.9% 23.2%
Historic resources 4 76.3% 75.7%
Environmental 3 62.7% 93.5%
Fraternal 3 14.0% 0.0%
Cemetery 3 55.9% 67.8%
Professional, business, trade 1 - -
Source: Douglas County Nonprofit Survey, CPW, 2000
*Some organizations did not receive gifts or grants and are not included.
Removing Mercy’s and Ford’s figures only has a slight effect on the mean and median for
the charity and medical activity groups respectively. When we remove Ford Family and
Mercy Medical, we should make clear that we are only removing the percentage of total
revenue that the amounts of gifts or grants they receive comprise, not the dollar value.
Even though the dollar amount is higher than the other nonprofits in their category, this
does not imply that the percentage will also be higher. For instance, Mercy’s revenue from
gifts or grants could be ten times that of another nonprofit and still only be 25 percent of

Economic Impact of Douglas County Nonprofit Organizations CPW February 2001 Page 34
their total revenue, while the smaller nonprofit earns 75 percent of their total revenue from
this source.
In the case of charities and foundations, removing Ford Family has almost no effect on
mean and raises the median from 54 percent to 68 percent of total organization revenue.
Thus, Ford was actually less reliant upon gifts or grants (despite its extraordinary gift)
than the other charities. For health or medical nonprofits, removing Mercy Medical raises
the mean from nearly 45 percent to over 52 percent—a more substantial effect. The median
also increases five percentage points from 52.7 percent to 57.7 percent. This also suggests
that Mercy is less reliant upon contributions, gifts, and grants than the other health or
medical nonprofits. This is consistent with the fact that Mercy generates most of its
revenue from service fees.
Program services, including government fees and contracts
The second component of total revenue is program service revenue including government
fees and contracts. This category includes fees for services rendered and is most relevant to
nonprofits engaged in social services, health care, and education. Revenue drawn from
program service revenue totaled $76.7 million dollars, about 25 percent of the entire
sample’s total revenue.
Mercy Medical Center attributed for over 83 percent of service revenue. Apart from Mercy’s
contribution, the remaining 28 nonprofits that generate service revenue earned
approximately $12.3 million. The average was $441,000 and the median approximately
$18,000. Once again, most nonprofits in the county earn small revenues compared to a few
large organizations.
After investigating the impact of program service revenue on an organization’s total
revenue, CPW found the health and medical service nonprofits to be most reliant upon this
source of income. This is consistent with intuition because of the fee for service nature of
medical care. Of the seven nonprofits in this activity area, an average of 54 percent of their
total revenue came from fees. If we exclude Mercy Medical, this percentage drops slightly
to 46 percent. The median is also 46 percent of total organization revenue—suggesting
that, in this case, the responding organizations are relatively comparable.
The other activity areas that generate substantial income from program services are
recreational, social, cultural, education, and historic resources. Recall the social services’
high percentage of revenue from gifts or grants. Notice now the low percentage for revenue
for services for the social service nonprofits. Table 4-5 displays the percentage of total
organization revenue that service fees comprise by activity area.
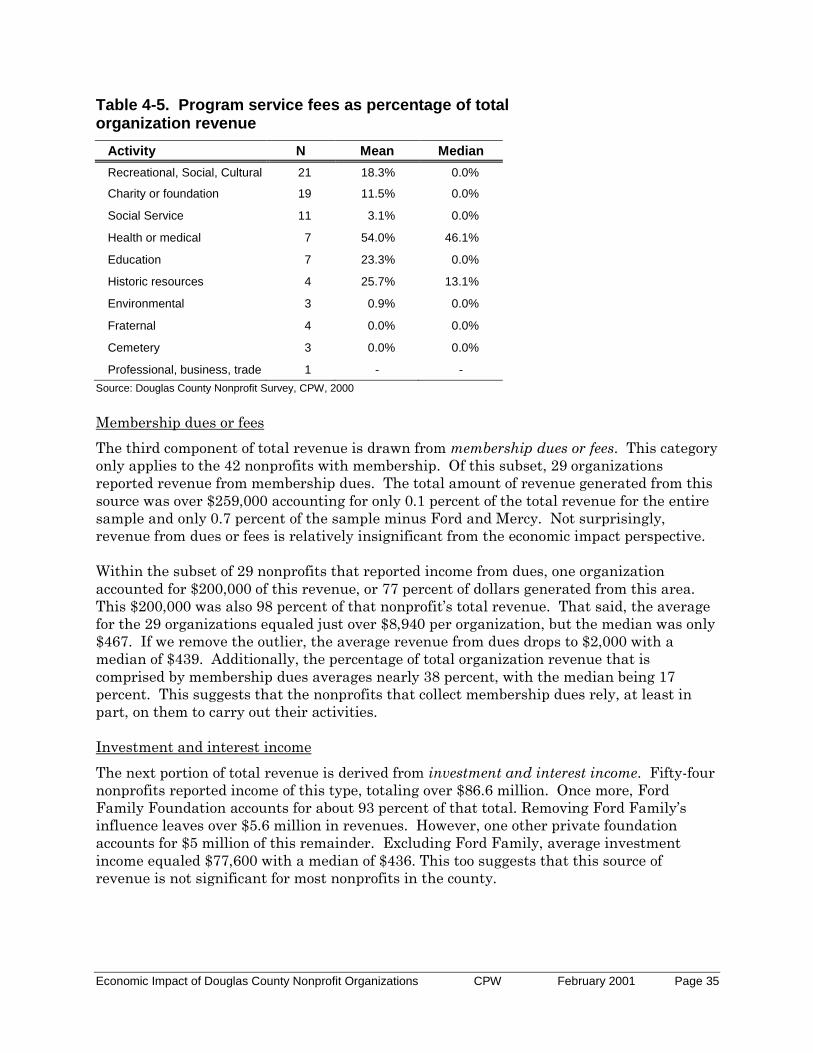
Economic Impact of Douglas County Nonprofit Organizations CPW February 2001 Page 35
Table 4-5. Program service fees as percentage of total organization revenue
Activity N Mean Median
Recreational, Social, Cultural 21 18.3% 0.0%
Charity or foundation 19 11.5% 0.0%
Social Service 11 3.1% 0.0%
Health or medical 7 54.0% 46.1%
Education 7 23.3% 0.0%
Historic resources 4 25.7% 13.1%
Environmental 3 0.9% 0.0%
Fraternal 4 0.0% 0.0%
Cemetery 3 0.0% 0.0%
Professional, business, trade 1 - -
Source: Douglas County Nonprofit Survey, CPW, 2000
Membership dues or fees
The third component of total revenue is drawn from membership dues or fees. This category
only applies to the 42 nonprofits with membership. Of this subset, 29 organizations
reported revenue from membership dues. The total amount of revenue generated from this
source was over $259,000 accounting for only 0.1 percent of the total revenue for the entire
sample and only 0.7 percent of the sample minus Ford and Mercy. Not surprisingly,
revenue from dues or fees is relatively insignificant from the economic impact perspective.
Within the subset of 29 nonprofits that reported income from dues, one organization
accounted for $200,000 of this revenue, or 77 percent of dollars generated from this area.
This $200,000 was also 98 percent of that nonprofit’s total revenue. That said, the average
for the 29 organizations equaled just over $8,940 per organization, but the median was only
$467. If we remove the outlier, the average revenue from dues drops to $2,000 with a
median of $439. Additionally, the percentage of total organization revenue that is
comprised by membership dues averages nearly 38 percent, with the median being 17
percent. This suggests that the nonprofits that collect membership dues rely, at least in
part, on them to carry out their activities.
Investment and interest income
The next portion of total revenue is derived from investment and interest income. Fifty-four
nonprofits reported income of this type, totaling over $86.6 million. Once more, Ford
Family Foundation accounts for about 93 percent of that total. Removing Ford Family’s
influence leaves over $5.6 million in revenues. However, one other private foundation
accounts for $5 million of this remainder. Excluding Ford Family, average investment
income equaled $77,600 with a median of $436. This too suggests that this source of
revenue is not significant for most nonprofits in the county.
Economic Impact of Douglas County Nonprofit Organizations CPW February 2001 Page 36
Special events or activities
The final part of the total revenue category is income generated from special events or
activities, such as dinners, raffles, dances, carnivals, bingo, etc. The IRS regards these
activities as only incidental to an “exempt purpose,” and that their “sole or primary purpose
is to raise funds that are other than contributions to finance the organization’s exempt
activities.”45
CPW noted earlier that this question was not included in the original survey form
distributed to respondents. CPW asked this question of selected nonprofits midway
through the survey administration time frame. In total, 24 nonprofits responded to this
question, with 16 organizations actually reporting income from events or activities. The
amount of funds generated from special events and activities reported in this document is
clearly underreported.
The nonprofits that responded generated over $315,000 in revenue from these activities.
The average revenue equaled approximately $19,700 and the median equaled just over
$4,100. Similar to revenue from dues, this category had negligible impact on the total
revenue for the entire sample. However, for the relevant organizations, revenue from
activities accounted for an average of 31 percent of total revenue. The nonprofits that
benefited most from events and activities revenue were fraternal organizations and those
involved in recreational, cultural, and social activities.
Figure 4-5 shows total revenue and percent of total revenue by source. CPW calculated the
percent of total revenue for the sample subset (minus Ford Family and Mercy Medical) by
dividing the source by the total revenue generated by the subset. Therefore the
denominators for the two categories are different.
Contributions, gifts, and grants were the most significant source of revenue, and this holds
true even when Ford and Mercy are removed from the analysis. Table 4-4 concluded that
among the various activity categories, social service nonprofits, on average, drew the
highest proportion of their total revenues from contributions, gifts, and grants.
Environmental groups ranked a very close second. Nonprofits involved in historic resource
and cemetery maintenance also relied heavily on this type of revenue. Drawing conclusions
from the data on these latter groups should be done with caution, as there is little data for
rigorous evidence.
45 Internal Revenue Service, Form 990 Instructions, p. 18.

Economic Impact of Douglas County Nonprofit Organizations CPW February 2001 Page 37
Figure 4-5. Percent of total revenue by source
1%
1%
3%
32%
15%
48%
0%
26%
29%
45%
0%
0%
0% 10% 20% 30% 40% 50% 60%
Membership dues
Special events and
activities
Miscellaneous
Program services
Investment and
interest
Contributions
All nonprofits
Minus Ford and Mercy
Revenue from service fees was the second most important source of revenue for nonprofits,
when we remove the investment income of Ford Family and the large service fees earned by
Mercy Medical Center. Even without Mercy’s numbers, medical nonprofits were most
impacted by this type of revenue, followed by nonprofits involved with historic resources,
education, and recreational, social, and cultural activities.
Table A-1 in Appendix A displays more summary data, including the mean and median
revenue values by revenue source.
Revenue by activity
Table 4-4 showed the mean and median percentages of total revenue comprised of revenue
earned from contributions, gifts, and grants. Table 4-5 showed the mean and median
percentages of total revenue composed of program service revenue. For both tables, the
mean and median percentages were calculated for organizations grouped by activity. These
tables served as an indicator of how significant a particular source of revenue is to the
operations of that category of nonprofits.
By contrast, this section organizes the total revenue dollar amounts by activity area to
compare the relative impacts of each activity group on the entire sample. It should be
obvious by now that Ford Family and Mercy Medical generated the most revenue for this
particular time period. Therefore, it is not surprising that charities and foundations is the
largest activity area, and health or medical is the second largest. However, presuming that
Mercy Medical’s revenue is relatively stable (unlike that of Ford’s revenue for this time
period), the health or medical nonprofits are then the largest nonprofit activity in Douglas
County.
However, when we remove Ford and Mercy, social service emerges as the largest subgroup
(in terms of total revenue) by about one percentage point or the equivalent of approximately

Economic Impact of Douglas County Nonprofit Organizations CPW February 2001 Page 38
$900,000. The charity or foundation subgroup falls to third largest. Figure 4-6 compares
the distribution of total revenue for the entire sample with the distribution for the sample
without Ford and Mercy. Tables A-3 and A-4 in Appendix A provide additional data for
revenue by activity.
Figure 4-6. Percentage of total revenue by activity
0%
0%
0%
1%
2%
5%
9%
31%
30%
0%
0%
0%
0%
0%
1%
1%
4%
25%
68%
21%
0% 10% 20% 30% 40% 50% 60% 70% 80%
Cemetery maintenance
Fraternal organization
Environmental
Professional
Historic Resources
Education
Recreational, social, cultural
Social Services
Health/medical
Charity or foundation
All nonprofits
Minus Mercy and Ford
Expenditures
Revenues are important measures of economic impact. Intuitively, the larger the revenue,
the larger the economic impact in terms of employment, payroll, and new dollars circulating
in the local economy. Expenditures are just as important. They represent the actual dollar
amounts spent locally, regionally, or otherwise. These dollar amounts are paying wages,
purchasing goods and services, providing goods and services, and potentially leveraging
other funds from sources such as the state and federal government, and other nonprofits.
As with revenue, the survey asked respondents to transfer expenses data from the 990 or
990-EZ, such as grants or contributions made, benefits paid to or for members, salaries,
professional fees, office supplies, etc. CPW organizes this section into three parts: (1) total
expenditures, (2) expenditures by type (3) and expenditures by activity.
Total expenditures
For purposes of this study, CPW defines total expenditures46 as the sum of the following
items:
Grants or contributions to other parties (Q-6)
Benefits to or for members (Q-7)
Salaries, employee benefits (Q-8)
46 This does not represent “total expenditures” as listed on line 44 of the 990 or line 17 of the 990-EZ, thus does
not account for ALL expenses. However, this study’s total expenditures captures the most significant
expenditure items.
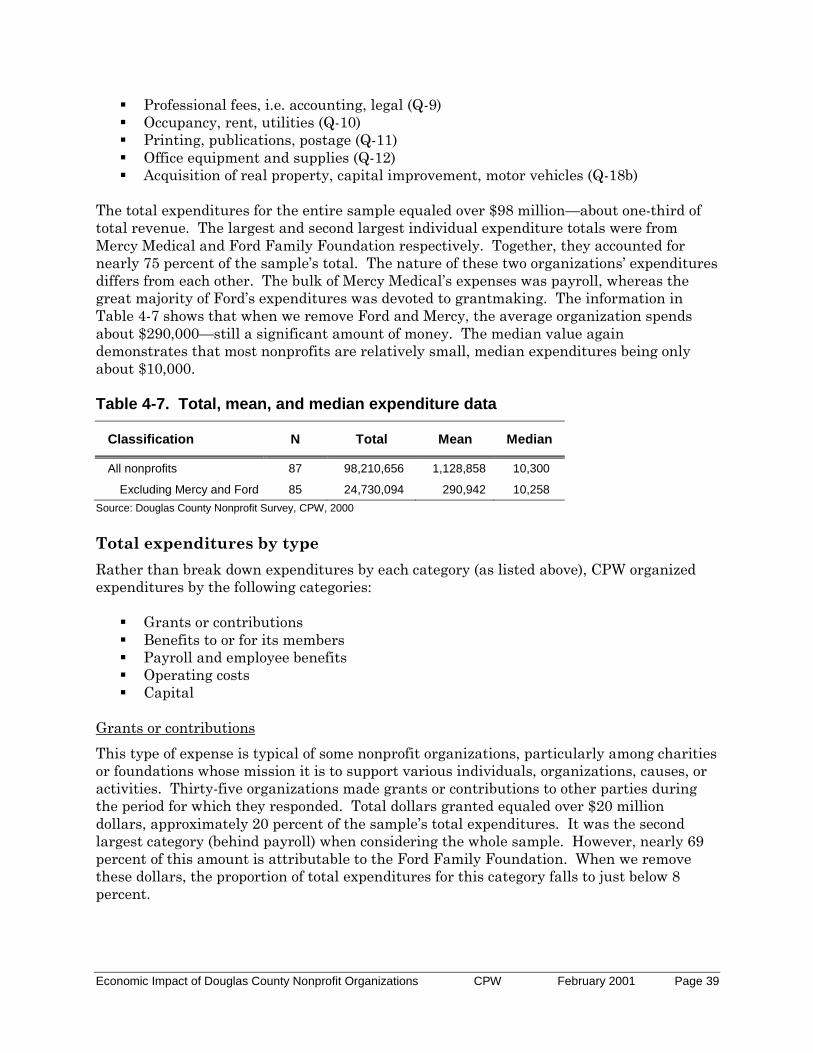
Economic Impact of Douglas County Nonprofit Organizations CPW February 2001 Page 39
Professional fees, i.e. accounting, legal (Q-9)
Occupancy, rent, utilities (Q-10)
Printing, publications, postage (Q-11)
Office equipment and supplies (Q-12)
Acquisition of real property, capital improvement, motor vehicles (Q-18b)
The total expenditures for the entire sample equaled over $98 million—about one-third of
total revenue. The largest and second largest individual expenditure totals were from
Mercy Medical and Ford Family Foundation respectively. Together, they accounted for
nearly 75 percent of the sample’s total. The nature of these two organizations’ expenditures
differs from each other. The bulk of Mercy Medical’s expenses was payroll, whereas the
great majority of Ford’s expenditures was devoted to grantmaking. The information in
Table 4-7 shows that when we remove Ford and Mercy, the average organization spends
about $290,000—still a significant amount of money. The median value again
demonstrates that most nonprofits are relatively small, median expenditures being only
about $10,000.
Table 4-7. Total, mean, and median expenditure data
Classification N Total Mean Median
All nonprofits 87 98,210,656 1,128,858 10,300
Excluding Mercy and Ford 85 24,730,094 290,942 10,258
Source: Douglas County Nonprofit Survey, CPW, 2000
Total expenditures by type
Rather than break down expenditures by each category (as listed above), CPW organized
expenditures by the following categories:
Grants or contributions
Benefits to or for its members
Payroll and employee benefits
Operating costs
Capital
Grants or contributions
This type of expense is typical of some nonprofit organizations, particularly among charities
or foundations whose mission it is to support various individuals, organizations, causes, or
activities. Thirty-five organizations made grants or contributions to other parties during
the period for which they responded. Total dollars granted equaled over $20 million
dollars, approximately 20 percent of the sample’s total expenditures. It was the second
largest category (behind payroll) when considering the whole sample. However, nearly 69
percent of this amount is attributable to the Ford Family Foundation. When we remove
these dollars, the proportion of total expenditures for this category falls to just below 8
percent.

Economic Impact of Douglas County Nonprofit Organizations CPW February 2001 Page 40
The survey did not ask for the percentage of dollars granted to parties in Douglas County.
However, because of the size of Ford Family’s contributions and their activity statewide,
CPW singled them out for this information. According to Norm Smith, Ford grants
approximately 17 percent of their annual contributions to parties in Douglas County. For
1999, this equaled over $2.3 million granted in the county. Table 4-8 shows the average
and median values for grant or contribution expenses.
Benefits to or for (an organization’s) members
According to the IRS, this type of expenditure includes benefits paid due to death, sickness,
hospitalization, disability, and unemployment compensation, among other more obscure
items. This type of expenditure was very insignificant—representing less than 0.2 percent
of the sample’s total expenditures. Nine organizations had this type of expense and the
total amount paid in this category was only $219,000.
Payroll and employee benefits
While the preceding expenditure item was the most insignificant, payroll, unsurprisingly, is
the largest expenditure category. It includes wages and salaries, pension plan
contributions, and payroll taxes. Payroll accounted for 41 percent of the sample’s total
expenditures.
Thirty-six nonprofits reported payroll expenses totaling over $41 million—approximately
4.4 percent of Douglas County’s $924 million total non-farm covered payroll reported for
1998.47 Nationwide in 1994, the nonprofit sector comprised 6.4 percent of total wages and
salaries.48 Mercy Medical Center again demonstrates its impact on the local economy,
accounting for 67 percent of payroll expenses. One contributing factor is that, as we saw in
Chapter Three, wages in the health industry are higher than in other industries in which
nonprofits are most prevalent. Another is simply the large number of employees they have.
Looking at the rest of the sample, the remaining 35 nonprofits paid approximately $13.5
million in wages and benefits, for an average of $386,000 per organization, and a median of
over $95,000. The social service nonprofits also contributed a significant share, paying out
nearly $6 million in salaries, wages, and benefits or about 14.5 percent of total payroll.
Table A-5 in Appendix A displays total dollar amounts and percentages of total payroll by
each activity.
Operating costs
This category captures various expenditures related to the organization’s activities (other
than payroll). The category includes such items as professional fees, payments to
independent contractors; occupancy, rent, and utilities costs; printing, postage, and
shipping; as well as office equipment and supplies. These expenses are good examples of
how money circulates through an economy and generate the multiplier effects discussed in
Chapter Two as well as earlier in this chapter. Operating costs represented 14 percent of
the sample’s total expenditures.
47 Because our payroll data is from a mixture of two years—1998 and 1999, the 4.4 percent should only be used
as an estimate of the nonprofit sector’s recent impact on the county’s total payroll 48 Nonprofit Almanac, p. 132

Economic Impact of Douglas County Nonprofit Organizations CPW February 2001 Page 41
Nearly all nonprofits, big or small, incur these kinds of expenses. Seventy-four
organizations reported operating costs expenditures totaling over $16.6 million. As
expected, Mercy Medical accounts for much of these expenditures. Nevertheless, the other
nonprofits spent over $5.3 million dollars in this category—the average organization
incurring $73,000 of costs and the median, just over $8,800.
Capital
This component of total expenditures includes acquisition of real property, capital
improvement, purchase of motor vehicles, or other assets. While only 13 organizations
reported expenses of this type, they collectively spent over $20 million dollars in this area.
Mercy Medical alone attributed for almost 79 percent of these capital outlays. Mercy and
Ford Family together accounted for 97 percent of the total. This should not obscure the fact
that the other 11 nonprofits did spend over $560,000 acquiring or improving capital, which
is an average of $51,000 per organization.
Table 4-8. Total, mean, and median expenditure data
Classification N Total Mean Median
Grants or contributions
All that made grants 35 20,140,910 575,454 5,000
Excluding Ford 34 6,264,192 184,240 4,748
Benefits to or for members
All nonprofits 9 219,746 24,416 642
Excluding Ford 8 66,057 8,257 571
Payroll
All nonprofits 36 41,162,441 1,143,401 97,839
Excluding Mercy 35 13,524,609 386,417 95,678
Operating costs
All nonprofits 74 16,678,526 225,385 8,867
Excluding Mercy 73 5,375,048 73,630 8,840
Capital
All nonprofits 13 20,009,033 1,539,156 18,000
Excluding Mercy and Ford
11 562,438 51,130 14,953
Source: Douglas County Nonprofit Survey, CPW, 2000
Table 4-9 presents the percentage of total expenditures by type. This shows the relative
significance of each expenditure type. Some explanation is needed. The “% of total
expenditures” column displays the percentage of total expenditures for that particular
subset of the sample. For example, the 20.5 percent for grants or contributions for all
organizations is the percentage of the entire sample’s total expenditures. The 7.8 percent
for nonprofits excluding Ford corresponds to the total expenditures for the sample
excluding Ford. Similarly, 31.4 percent represents the share of total expenditures for the
sample minus Mercy that was devoted to payroll.
CPW excluded Mercy Medical and Ford Family in instances in which the data they
provided represented a significant outlier from the rest of the sample. For example, Mercy

Economic Impact of Douglas County Nonprofit Organizations CPW February 2001 Page 42
did not earn much revenue from contributions, gifts, or grants, therefore, CPW elected to
leave them in the subset. CPW removed both Ford and Mercy in the capital expense
subset. Because Ford and Mercy were excluded in different cases, we cannot compare the
subset values.
Table 4-9. Percentage of total expenditures by type
Classification Sum % of Total
Expenditures
Grants or contributions
All nonprofits 20,140,910 20.5%
Excluding Ford 6,264,192 7.8%
Benefits to or for members
All nonprofits 219,746 0.2%
Excluding Ford 66,057 0.1%
Payroll
All nonprofits 41,162,441 41.9%
Excluding Mercy 13,524,609 31.4%
Operating costs
All nonprofits 16,678,526 17.0%
Excluding Mercy 5,375,048 12.5%
Capital
All nonprofits 20,009,033 20.4%
Excluding Mercy and Ford 562,438 2.3%
Source: Douglas County Nonprofit Survey, CPW, 2000
Unpaid accounts receivable and uncompensated services
Because unpaid accounts receivable and uncompensated services are essentially expenses
on behalf of the nonprofit, CPW chose to include them in this section. CPW asked
respondents to report any unpaid accounts receivable, with only 10 responding. Four of
these were medical nonprofits, 2 were charities or foundations, 2 educational, 1 social
service, and 1 community development. Total unpaid accounts receivable equaled over $4
million. Nearly $3.4 million was due to Mercy Medical.
CPW also asked respondents to report the value of services that went unbilled and
uncompensated. Many nonprofits provide services to low-income individuals or to other
organizations gratis, or free of charge. These activities contribute to the economy, as they
otherwise would have to be paid for by some party. Fifteen nonprofits reported unbilled
and uncompensated services, the dollar value of which totaled $10.3 million. Ten million of
this amount is attributable to Mercy.

Economic Impact of Douglas County Nonprofit Organizations CPW February 2001 Page 43
Figure 4-7. Average and median unpaid accounts receivable and unbilled and uncompensated services
409,068
76,854
691,677
24,4392,000
17,020 11,990 1,600
0
100,000
200,000
300,000
400,000
500,000
600,000
700,000
800,000
Unpaid accounts
receivable
Unpaid A/R
minus Mercy
Unbilled and
uncompensated
Unbilled,
uncomp. minus
Mercy
Exp
en
dit
ure
s in
do
llars
Average
Median
Total expenditures by activity
We now turn attention to a breakdown of expenditures by activity (charity, social service,
medical, etcetera). Spending should be proportionate with revenue, and as expected,
expenditures are again dominated by the health and charity subgroups. The health or
medical nonprofits accounted for almost two-thirds of total nonprofit spending in the
county. Charities and foundations contributed 25 percent. Collectively, these two
subgroups spent over $86.5 million.
Removing Mercy Medical, the distribution of expenditures looks dramatically different.
Ford Family’s expenditures (mostly grants and gifts) now dominate total expenditures,
attributing for one half of all spending (minus Mercy). Health and social service nonprofits
share relatively similar proportions of the expenditure pie. With or without Mercy, the
three largest spending groups in the nonprofit sector are health, charities, and social
services. Figure 4-8 depicts the relative distribution of total expenditures.

Economic Impact of Douglas County Nonprofit Organizations CPW February 2001 Page 44
Figure 4-8. Total expenditures by activity
16.2%
55.9%
0.0%
0.1%
0.2%
0.5%
1.7%
2.3%
7.1%
24.5%
63.7%
0.2%
0.1%
0.0%
17.1%
0.4%
1.1%
3.8%
5.3%
0.0%
0.0% 10.0% 20.0% 30.0% 40.0% 50.0% 60.0% 70.0%
Cemetary
Fraternal
Environmental
Professional
Historical
Recreation
Education
Social Service
Charity
Health
Percent of total expenditures
All nonprofits
Minus Mercy
Local spending
All of these expenditures are not necessarily made within the local economy. CPW only
asked respondents to estimate the percentages of total professional fees and the percentage
of office supplies and equipment spent within Douglas County. Of the $12.1 million spent on
these two categories, an estimated $3.4 million was spent within the county. With respect
to gifts or grants made locally, Ford Foundation accounted for $2.3 million. The percentage
of other gifts and grants made by nonprofits is unknown, but it is likely that the percentage
is very high. The same applies for payroll, the largest component of total expenditures. In
other words, it is likely that the majority of individuals employed by nonprofit
organizations in Douglas County also reside in the County.
Employment
Up to now, we have described the millions of dollars earned and spent by nonprofit
organizations in Douglas County. Now, we look at how those millions of dollars translate
into employment opportunities for residents of Douglas County. Job creation is, perhaps,
the most important component of economic impact. These jobs provide meaningful work
and generate household income. This section discusses the number and nature of the jobs
created within the nonprofit sector.
Total employment
For this analysis, CPW defines total employment as the sum of full-time and part-time
employees (in 1999). Earlier in the chapter, CPW noted that 36 of the 87 respondents had
at least one part-time employee. In addition, 29 respondents had at least one full-time
employee. These nonprofits employed a total of 1,771 individuals, approximately 4.3
percent of total employment in the county in 1999, which is consistent with the
respondent’s 4.4 percent share of the county’s total non-farm covered payroll, as noted in
the preceding section. As a matter of comparison, nonprofits employed 8.5 of the nation’s

Economic Impact of Douglas County Nonprofit Organizations CPW February 2001 Page 45
workers in 1994. Of these 1,771 Douglas County nonprofit workers, 1,111 were employed
on a full-time basis, 660 as part-time employees. As a share of the total employment,
almost two-thirds of the employment created by respondents were full-time positions, the
other one-third were part-time.
Figure 4-9. Full-time and part-time share of sample’s total employment
Part time
37%
Full time
63%
Employment by activity
Breaking down employment by activity allows us to see which sectors have the greatest
impact in terms of job creation. Figure 4-10 shows how employment is distributed by
activity. After health and medical, the social service nonprofits employ the second largest
number of employees. They account for almost 18 percent of total employment for the
sample. Figure 4-10 also furthers the understanding the dramatic impact of Mercy
Medical. While not shown here, Mercy alone accounts for 48 percent of the entire sample’s
employment. Removing Mercy does not affect the relative rankings between activities, but
does balance employment levels between the health and social service nonprofits. In
addition, the distribution of full-time and part-time workers by activity looks the same as
the distribution for total employment shown below in Figure 4-10.
Figure 4-10. Total employment by activity
0
2
5
5
10
23
76
131
314
1205
0 200 400 600 800 1000 1200 1400
Cemetary
Environmental
Fraternal
Professional
Historical
Charity
Education
Recreation
Social Service
Health

Economic Impact of Douglas County Nonprofit Organizations CPW February 2001 Page 46
Table 4-10 provides some information on the composition of total employment by activity.
It shows the percentage full-time employees and part-time employees comprise of the
activity subgroup’s total employment. For the three subgroups that have the largest
employment, full-time employees comprised a range of 61 to 68 percent of the total
employment for that particular subgroup. Education and charities posted slightly higher
percentages for full-time staff. The other subgroups have too little data to draw solid
conclusions.
Table 4-10. Full-time and part-time share of total employment by activity
Activity # Employees % Full-time % Part-time
Health 1205 61% 39%
Social service 314 63% 37%
Recreational, cultural, social 131 68% 32%
Education 76 83% 17%
Charity 23 70% 30%
Historic resources 10 90% 10%
Fraternal 5 60% 40%
Business, trade 5 40% 60%
Environmental 2 50% 50%
Cemetery 0 0% 0%
Source: Douglas County Nonprofit Survey, CPW, 2000
Wages and benefits
The expenditures section discussed dollars spent on payroll, which was the total of wages,
salaries, benefits, payroll taxes, etcetera. This section looks more closely at how wages and
benefits are distributed among those employed by respondents to explore what kinds of jobs
the nonprofits are creating.
Wages
Q-24 asked respondents to estimate the percentage of their employees that fell within the
following hourly wage ranges in 1999:
$6.50 to $9
$9.01 to $12
$12.01 to $15
$15.01 to $18
$18.01 to $21.0
Over $21
Figure 4-11 displays the distribution of hourly wage ranges for jobs created by the survey
respondents. CPW calculated these percentages by multiplying the percentage reported for
each wage range by the total number of employees (full and part time) reported. Because
respondents’ estimates sometimes did not add up to 100 percent, the product of multiplying
the percentage for each wage range by the number of employees sometimes did not equal

Economic Impact of Douglas County Nonprofit Organizations CPW February 2001 Page 47
their total employment. As a result, 19 jobs are not accounted for in Figure 4-11. This is
not significant enough to distort any statements CPW makes about the distribution of jobs
by wage.
Figure 4-11. Distribution of total jobs by wage range
38%
20%
8%
12%
9%
14%
0%
5%
10%
15%
20%
25%
30%
35%
40%
$6.50-$9.00 $9.01-
$12.00
$12.01-
$15.00
$15.01-
$18.00
$18.01-
$21.0
OVER
$21.99
Pe
rce
nt o
f to
tal*
The largest proportion of jobs (38 percent) paid $6.50 to $9.00 per hour. These jobs are
more likely to be part-time positions, however there is no way to confirm this with the data
available. Coincidentally, the percentage of part-time jobs was 39 percent.
The second largest group of jobs paid $9.00 to $12.00 per hour. If we make the assumption
that these jobs are more likely full-time positions, then we can calculate an annual wage
range for employees in this wage range. Based upon a 40-hour work week and a 52 week
year, the gross annual wage range would equal $18,720 - $24,960. The high end of this
range is just shy of the county’s average annual wage of $25,054 in 1998 (Table 3-3). The
remaining wage ranges are fairly well distributed.
Looking at how wages are distributed by activity reveals that the activities that tend to be
less associated with full-time work (environmental, fraternal, recreational), tend to have a
higher proportion of jobs in the lower paying ranges. The high share of lower wage
employment with educational nonprofits is a bit surprising, but even though these
nonprofits are likely to be engaged in educational activities, these nonprofits may not
necessarily have certified educators nor be private, nonprofit schools. This low wage also is
consistent with the data in Table 3-3, which shows that employment in the education
industry in Douglas County paid an annual average wage of only $15,000. Another
interesting revelation in the data is how well distributed the wages in the health, social
service, charity, and historic resources subgroups are. Table 4-12 shows the distribution of
jobs by wage range per activity.
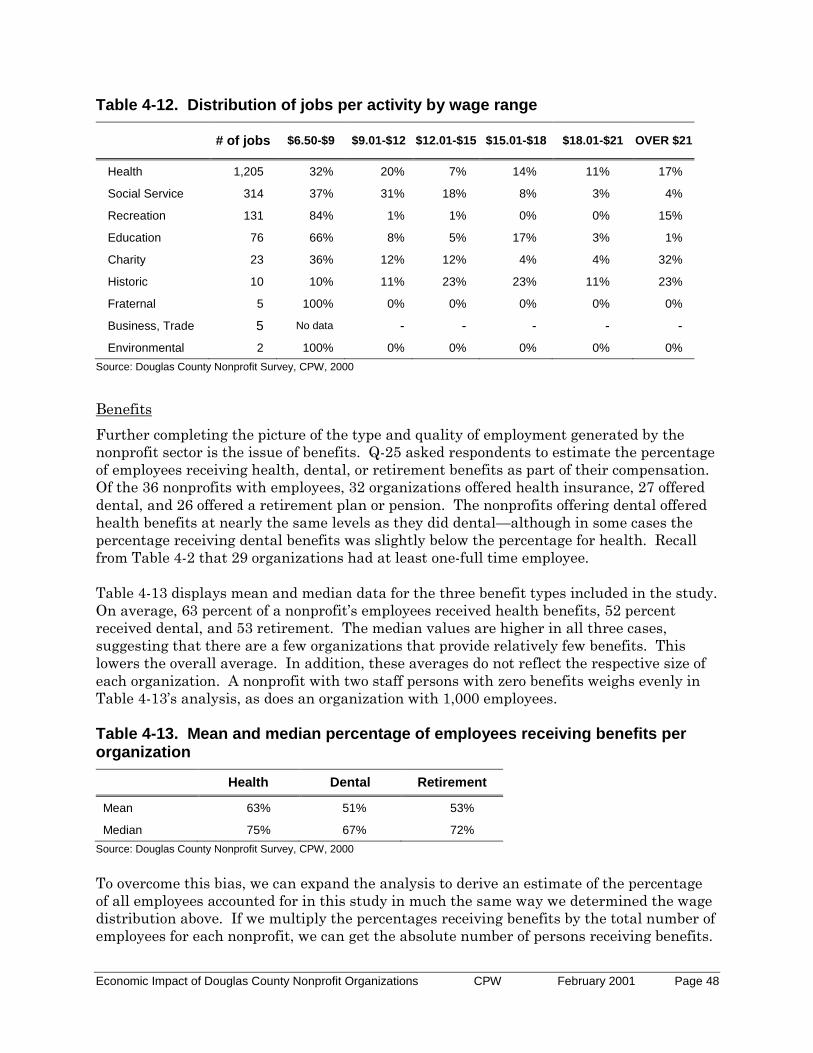
Economic Impact of Douglas County Nonprofit Organizations CPW February 2001 Page 48
Table 4-12. Distribution of jobs per activity by wage range
# of jobs $6.50-$9 $9.01-$12 $12.01-$15 $15.01-$18 $18.01-$21 OVER $21
Health 1,205 32% 20% 7% 14% 11% 17%
Social Service 314 37% 31% 18% 8% 3% 4%
Recreation 131 84% 1% 1% 0% 0% 15%
Education 76 66% 8% 5% 17% 3% 1%
Charity 23 36% 12% 12% 4% 4% 32%
Historic 10 10% 11% 23% 23% 11% 23%
Fraternal 5 100% 0% 0% 0% 0% 0%
Business, Trade 5 No data - - - - -
Environmental 2 100% 0% 0% 0% 0% 0%
Source: Douglas County Nonprofit Survey, CPW, 2000
Benefits
Further completing the picture of the type and quality of employment generated by the
nonprofit sector is the issue of benefits. Q-25 asked respondents to estimate the percentage
of employees receiving health, dental, or retirement benefits as part of their compensation.
Of the 36 nonprofits with employees, 32 organizations offered health insurance, 27 offered
dental, and 26 offered a retirement plan or pension. The nonprofits offering dental offered
health benefits at nearly the same levels as they did dental—although in some cases the
percentage receiving dental benefits was slightly below the percentage for health. Recall
from Table 4-2 that 29 organizations had at least one-full time employee.
Table 4-13 displays mean and median data for the three benefit types included in the study.
On average, 63 percent of a nonprofit’s employees received health benefits, 52 percent
received dental, and 53 retirement. The median values are higher in all three cases,
suggesting that there are a few organizations that provide relatively few benefits. This
lowers the overall average. In addition, these averages do not reflect the respective size of
each organization. A nonprofit with two staff persons with zero benefits weighs evenly in
Table 4-13’s analysis, as does an organization with 1,000 employees.
Table 4-13. Mean and median percentage of employees receiving benefits per organization
Health Dental Retirement
Mean 63% 51% 53%
Median 75% 67% 72%
Source: Douglas County Nonprofit Survey, CPW, 2000
To overcome this bias, we can expand the analysis to derive an estimate of the percentage
of all employees accounted for in this study in much the same way we determined the wage
distribution above. If we multiply the percentages receiving benefits by the total number of
employees for each nonprofit, we can get the absolute number of persons receiving benefits.

Economic Impact of Douglas County Nonprofit Organizations CPW February 2001 Page 49
Performing these calculations, CPW finds that the median values in Table 4-13 are quite
accurate. Table 4-14 confirms that most employees of nonprofit organizations are receiving
a variety of benefits from their employers.
Table 4-14. Number and percent of all employees receiving benefits
Type # of
employees % of all
employees
Health 1,321 75%
Dental 1,194 67%
Retirement 1,165 66%
Total employees 1,771
Source: Douglas County Nonprofit Survey, CPW, 2000
Table 4-15 presents the percentage of employees receiving health, dental, or retirement
benefits by activity. The data does not reveal anything startling. The sole business or
trade association had full benefits for all five of its employees. The historic resource
nonprofits also provided health and dental at high levels, but less so on retirement, for their
ten total employees. What is interesting is the parity between the social service, recreation,
and charity nonprofits. The percentage of employees receiving benefits in these
organizations is fairly consistent with the full-time, part-time distribution of their
employees.
Table 4-15. Percentage of employees receiving benefits by activity
Activity Total
employees % Health % Dental
% Retirement
Health 1,205 81% 74% 80%
Social Service 314 63% 61% 51%
Recreation 131 64% 63% -
Education 76 48% - 25%
Charity 23 65% 48% 48%
Historical 10 90% 90% 50%
Fraternal 5 - - -
Business, Trade 5 100% 100% 100%
Environmental 2 - - -
Cemetery 0 - - -
Source: Douglas County Nonprofit Survey, CPW, 2000
Volunteers
As we described in Chapter Two, nonprofits are distinct from the private for profit and
public sectors in many ways. One unique way is their successful deployment of volunteers
to assist in meeting the particular mission of the various organizations. Without
volunteers, many goods, services, and activities simply would not be provided, resulting in a

Economic Impact of Douglas County Nonprofit Organizations CPW February 2001 Page 50
net loss for the community. Despite this, the contributions of volunteers often go unnoticed,
especially in economic terms. A holistic view of the economic impact of nonprofit
organizations must include the contributions of volunteers.
Q-26 and Q-27 asked respondents about the number of volunteers that participated on
behalf of the organization and how many hours volunteers contributed respectively. The
results presented in Table 4-16 are quite remarkable. A total of 6,304 volunteers worked
with 77 nonprofits and contributed over 463,000 hours to nonprofit activities in 1999. This
equals approximately 73 hours per person for the year, or an equivalent of 235 full-time
employees. The disparity between mean and median once again suggest that a few large
nonprofits have a great number of volunteers. Nevertheless, a median value of 25
volunteers and 484 hours is not insignificant, especially for small organizations with few
resources.
Table 4-16. Summary data for volunteers and volunteer hours
Total Mean Median Maximum
# of Volunteers 6,304 82 25 911
# of hours 463,518 6,263 484 130,513
Source: Douglas County Nonprofit Survey, CPW, 2000
Next, we examine how voluntarism is distributed among the different activity areas in the
nonprofit sector. Figure 4-12 shows that the social service nonprofits incorporated the most
volunteers and volunteer hours into their activities. While the social service nonprofits
comprise only 16 percent of the sample, they have 28 percent of all volunteers and 43
percent of all volunteer hours. The nature of these organizations likely predisposes them to
deploy volunteers in the numbers that they do. The second tier of nonprofits (in terms of
voluntarism) includes the charity, health, and recreational, cultural and social nonprofits.
The numbers of volunteers are well distributed, but charities have contributed more hours
with similar numbers of volunteers.
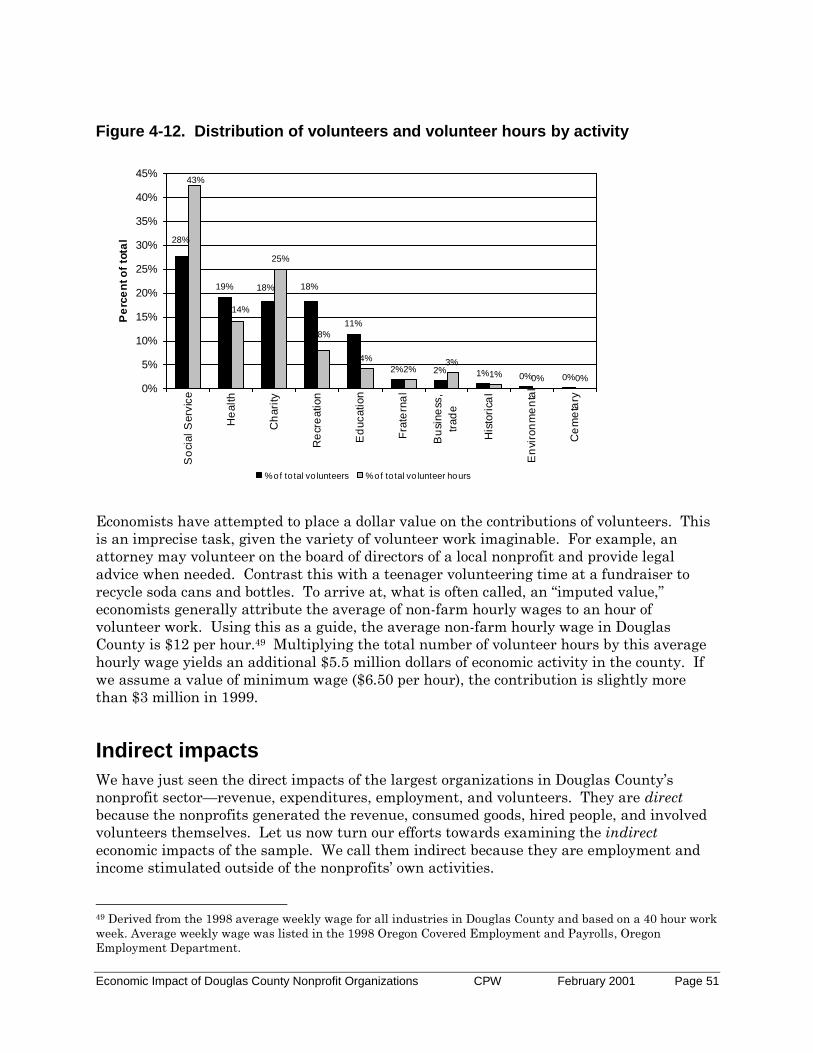
Economic Impact of Douglas County Nonprofit Organizations CPW February 2001 Page 51
Figure 4-12. Distribution of volunteers and volunteer hours by activity
19%
11%
2% 2% 1% 0% 0%
25%
4%
2%3%
1% 0% 0%
18%
28%
18%
43%
14%
8%
0%
5%
10%
15%
20%
25%
30%
35%
40%
45%
So
cial S
erv
ice
He
alth
Ch
ari
ty
Re
cre
ation
Ed
ucation
Fra
tern
al
Bu
sine
ss,
trad
e
His
tori
cal
En
viro
nm
en
tal
Ce
me
tary
Pe
rce
nt o
f to
tal
% of to tal vo lunteers % of to tal vo lunteer hours
Economists have attempted to place a dollar value on the contributions of volunteers. This
is an imprecise task, given the variety of volunteer work imaginable. For example, an
attorney may volunteer on the board of directors of a local nonprofit and provide legal
advice when needed. Contrast this with a teenager volunteering time at a fundraiser to
recycle soda cans and bottles. To arrive at, what is often called, an “imputed value,”
economists generally attribute the average of non-farm hourly wages to an hour of
volunteer work. Using this as a guide, the average non-farm hourly wage in Douglas
County is $12 per hour.49 Multiplying the total number of volunteer hours by this average
hourly wage yields an additional $5.5 million dollars of economic activity in the county. If
we assume a value of minimum wage ($6.50 per hour), the contribution is slightly more
than $3 million in 1999.
Indirect impacts
We have just seen the direct impacts of the largest organizations in Douglas County’s
nonprofit sector—revenue, expenditures, employment, and volunteers. They are direct
because the nonprofits generated the revenue, consumed goods, hired people, and involved
volunteers themselves. Let us now turn our efforts towards examining the indirect
economic impacts of the sample. We call them indirect because they are employment and
income stimulated outside of the nonprofits’ own activities.
49 Derived from the 1998 average weekly wage for all industries in Douglas County and based on a 40 hour work
week. Average weekly wage was listed in the 1998 Oregon Covered Employment and Payrolls, Oregon
Employment Department.

Economic Impact of Douglas County Nonprofit Organizations CPW February 2001 Page 52
Recall our discussion of multipliers at the beginning of the Economic Impact section of this
chapter. Economists derive “multipliers” that demonstrate how much change would occur
in the local economy by an increase or decrease of the industry in question. For example,
an income multiplier for the social service industry would measure the additional income
generated elsewhere in the economy as a result of a $1 increase in income for social service
firms. They are called multipliers because by multiplying the income by the multiplier
coefficient, we can estimate how much extra economic impact is contributed by the study
industry. The example we used earlier was an employment multiplier of 1.5, which means
that for every job a particular sector generates, 0.5 jobs are created elsewhere in the
economy.
Multipliers apply to export industries because they are bringing new dollars into an
economy. When an export industry sells goods or services to customers outside the local
economy, it exchanges that good or service for money. This money is new to the economy
and increases local wealth. It is this export income that circulates through the economy, by
means of linkages and interactions between the export firms and other businesses and
households, which we have already referred to.
One common analogy is the bathtub as an economy, with the water level acting as a
measure of local wealth. Export income is the faucet filling the tub—money enters the
economy from the outside. However, every tub (and every economy) has leaks that deplete
the overall wealth of a community. These leaks take the form of imported goods and
services because local money leaves the local economy to be exchanged for goods produced
by businesses outside of the economy. The bathtub analogy illustrates the connection
between community wealth and purchasing locally produced goods and services.
The multipliers were derived by the Minnesota IMPLAN Group, Inc. (MIG) and prepared
for the Oregon Departments of Forestry, Employment, Economic and Community
Development, and Administrative Services. MIG used 1996 data to derive various
multipliers for the state of Oregon and its sub-regions. These are the most recent
multipliers available to CPW for this region. The Employment Department’s Region 6
(Douglas County) economist provided CPW with the income and employment multipliers
used in this study.
There is not full agreement as to the accuracy of multiplier analysis, so we will use them
judiciously in this study. Many economists argue that multipliers tend to inflate indirect
impacts of a sector, industry, or event or activity for various reasons.50 In addition, the
following lists other factors that affect CPW’s use of multipliers:
Multipliers are industry and place specific. Thus, CPW will use different multiplier
values for different industries.
Multipliers are not calculated for all the activities encompassed within this study.
The categorization of multipliers does not coincide with the classification CPW
incorporated in this study. For example, “hospitals” and “other medical or health
services” have separate multiplier values, while CPW grouped them together.
50 Hustedde, Shaffer, Pulver, p. 20.

Economic Impact of Douglas County Nonprofit Organizations CPW February 2001 Page 53
Multipliers are developed using data from both for-profit and nonprofit sources—
they are not nonprofit specific (unless otherwise stated)—which may introduce other
distortions.
There is also a time delay factor. The data used to derive the multipliers CPW is
using were collected in 1996.
Given these constraints, CPW organizes the indirect impacts into two categories—income
and employment.
Income
CPW’s premise behind using multipliers in this study is that nonprofits can be thought of
as export industries, in that they bring in dollars from outside the local economy—which we
have defined as Douglas County. Income multipliers will provide us with an estimate of
additional income created within the economy for every $1 of revenue brought into the
economy. Q-13 asked respondents to estimate the percentage of gifts or grants that came
from sources outside of county. This will capture the amount of revenue from contributions,
gifts, or grants that can be considered “export” income.
The first step is to calculate export income. A total of 27 nonprofits (33 percent) reported
some percentage of their revenue from gifts or grants originated from a source outside of
the county. The total dollars that CPW can classify as export income is over $13.9 million,
or approximately 4.5 percent of the sample’s total revenue. However, it is likely that CPW
is under representing revenue from outside sources.
The next step is to break down the export income into the same categories developed for the
multipliers. These categories were more specific than the ones created by CPW for this
report, and include membership sports and recreation clubs, elementary and secondary
schools, other medical and health services, social services, and others. The final step was to
multiply the appropriate dollar amount by the corresponding multiplier for that industry.
CPW is using a labor income multiplier, which captures all payroll costs of wage and salary
workers as well as self-proprietors.
Table 4-17 shows the results of our calculations. Note that Mercy Medical reported no
income from gifts or grants originating from outside the county. The labor income
multiplier coefficient (column A) represents the amount of additional income (for wage
earners) created by one dollar of export revenue generated by that particular industry. For
example, job training’s income multiplier was 1.3524 meaning that for every one dollar
brought in by firms in this industry, an additional 35 cents (.3524) of income is created from
circulating that original one dollar through the economy. The multiplier effect column
simply equals column A times column B. The net effect column, then, represents the
amount of additional income created by that industry.

Economic Impact of Douglas County Nonprofit Organizations CPW February 2001 Page 54
Table 4-17. Income multiplier calculations
Category (A)
Income multiplier
(B) Export
revenue
(C) Multiplier
effect
(D) Net effect
(C minus B)
Elementary or secondary schools 1.845541 234,001 431,858 197,857
Job training and related services 1.352419 2,436,493 3,295,159 858,666
Social services (not elsewhere classified) 1.34725 9,908,637 13,349,411 3,440,774
Other nonprofits (including charities and foundations)
1.890707 829,692 1,568,704 739,012
Other educational services 1.38418 392,000 542,599 150,599
Theatrical producers, bands, etc. 7.140559 35,901 256,350 220,450
Amusement and recreation services 1.445303 44,251 63,956 19,705
Other medical services 1.369347 81,617 111,762 30,145
Total $13,962,732 $19,619,799 $5,657,067
Source: Douglas County Nonprofit Survey, Analysis by CPW, 2000
The total net multiplier effect was over $5.6 million dollars of additional income for wage
earners in the county (in addition to the original $13.9 million generated directly). Social
service nonprofits contributed just over 68 percent of the multiplier effect. Notice also that
the multiplier for theatrical producers, bands, etc. was very high. One possible explanation
that CPW speculates could be affecting the high multiplier is heavy local spending patterns
among the organizations that data was on.
Here, we have used multipliers retroactively, attempting to estimate the amount of income
that could be attributed to the nonprofit sector. However, economists generally use
multipliers to predict changes in the economy as the result of changes to the
industry or sector in question.51 For example, a more common use of multipliers is to
say that if income for industry A increases by one million dollars, we can expect X dollars of
additional income created. Using this logic, we can determine the income multiplier for the
nonprofits included in the indirect effects analysis. By dividing column C by column B, we
arrive at a result of 1.405, which means for every new dollar generated by this subset of
nonprofits, 40 cents of income will be created elsewhere in the economy.
Employment
Employment multipliers measure how many new jobs may be created as a result of one job
generated by a particular export industry. Because our sample does not consist of any pure
“export industries”—those that received 100 percent of their income from outside of the
local economy, the primary difficulty with calculating an employment multiplier effect was
determining how many jobs could be attributed to “export” activities. In order to derive this
number of jobs, CPW determined the percentage of total organization revenue that was
attributable to contributions, gifts, or grants from outside of the county. We then
multiplied this percentage by the number of total jobs to estimate the number of jobs that
could be considered export-related.
51 Telephone conversation with Art Ayre, State Labor Economist, Oregon Employment Department, 12/14/00.

Economic Impact of Douglas County Nonprofit Organizations CPW February 2001 Page 55
CPW’s calculations yielded a net effect of 103 additional jobs created as a result the 336
“export-related” jobs in the nonprofits in this subset. As in the previous section, social
services created the most jobs indirectly, primarily because they had the most jobs
attributable to funds outside of the county. Once again, theatrical producers had the
highest multiplier of the group. Table 4-18 displays the results.
Finally, when we aggregated the individual employment multiplier effects, CPW found that
one job created in this subset of nonprofits stimulated 0.3 jobs elsewhere in the local
economy. Table 4-18 shows the results by category.
Table 4-18. Employment multiplier calculations
Category (A)
Employment multiplier
(B) Export
related jobs
(C) Multiplier
effect
(D) Net effect
(C minus B)
Elementary or secondary schools 1.359418 4.9 6.6 1.7
Job training and related services 1.296088 23.3 30.2 6.9
Social services (not elsewhere classified) 1.304864 296.7 387.2 90.5
Other nonprofits (including charities and foundations)
1.455688 1.5 2.2 0.7
Other educational services 1.402491 5.8 8.1 2.3
Theatrical producers, bands, etc. 1.559716 0.3 0.5 0.2
Amusement and recreation services 1.262209 1.8 2.3 0.5
Other medical services 1.389345 2.5 3.4 1.0
Total 336.7 440.4 103.7
Source: Douglas County Nonprofit Survey, analysis by CPW, 2000
Industry comparison
A comparison of nonprofit-related multipliers to other leading industries in Douglas County
reveals that nonprofits generate comparable indirect impacts—per dollar or per job—as
other industries. The timber industry (Forestry Products, Sawmills and planing mills)
creates the most indirect impact, at the margin. This is no surprise since the industry is
very export-oriented, drawing in new dollars that are circulated in the form of wages,
salaries, goods, and services. Construction of new residential and commercial buildings
also had higher multipliers than the nonprofit sector, which can be explained by the
amount of supplies needed in construction and the probability that many clients are outside
of the local economy. However nonprofits are on par with other industries, such as
accounting services, educational services, eating and drinking establishments, and hotels
and lodges. Table 4-19 displays the income and employment multipliers.

Economic Impact of Douglas County Nonprofit Organizations CPW February 2001 Page 56
Table 4-19. Income and employment multipliers for leading county industries
Industry category Income
Multiplier Employment
Multiplier
Forestry products52
5.846339 6.350090
New residential structures 1.671176 1.702361
New industrial and commercial buildings 1.493950 1.779658
Logging camps and logging contractors53
1.379643 1.617791
Sawmills and planing mills 1.741842 2.201820
Wholesale Trade 1.343856 1.485891
Eating and Drinking 1.409781 1.206464
Hotels and lodging places 1.572937 1.350881
Accounting auditing and book keeping 1.220232 1.188737
Elementary or secondary schools 1.845541 1.359418
Job training and related services 1.352419 1.296088
Social services (not elsewhere classified) 1.347250 1.304864
Other nonprofits (including charities and foundations) 1.890707 1.455688
Other educational services 1.384180 1.402491
Theatrical producers, bands, etc. 7.140559 1.559716
Amusement and recreation services 1.445303 1.262209
Other medical services 1.369347 1.389345
Source: Minnesota IMPLAN Group
Summary
This chapter presented an in-depth analysis of the economic contributions of the nonprofit
organizations that responded to the survey. CPW strove to present the big picture as well
as trends or tendencies among sources of revenue, expenditure items, and across activity
areas. Based upon an understanding of the linkages and interactions between firms and
households, CPW also attempted to capture some of these indirect economic impacts.
General observations
Mercy Medical Center is a key player in the entire economy (all sectors) of Douglas
County. It generates a great deal of income and employs hundreds of people.
The one-time gift from the Kenneth Ford estate to the Ford Family Foundation
during the study period significantly inflates the revenue numbers for the entire
52 This major group includes establishments primarily engaged in the operation of timber tracts, tree farms,
forest nurseries, and related activities such as reforestation services and the gathering of gums, barks, balsam
needles, maple sap, Spanish moss, and other forest products. (http://www.osha.gov/oshstats/sicser.html) 53 This major group includes establishments engaged in cutting timber and pulpwood; merchant sawmills, lath
mills, shingle mills, cooperage stock mills, planing mills, and plywood mills and veneer mills engaged in
producing lumber and wood basic materials; and establishments engaged in manufacturing finished articles
made entirely or mainly of wood or related materials. Certain types of establishments producing wood products
are classified elsewhere. (http://www.osha.gov/oshstats/sicser.html)

Economic Impact of Douglas County Nonprofit Organizations CPW February 2001 Page 57
sector over by $116 million. Nevertheless, Ford Family has a significant impact on
the county through the millions of dollars it grants to local parties annually.
Removing the impacts of Mercy Medical and Ford Family, CPW finds that the social
service nonprofits become the leading economic presence in the county’s nonprofit
sector.
Revenue
Nonprofits earned a total of over $299 million in revenue. Without Ford and Mercy,
nonprofits earned over $38.2 million.
Contributions, gifts, and grants were the largest sources of revenue for the study
time period, comprising 45 percent of total revenue. It remains the largest source of
revenue after removing Ford Family and Mercy Medical from the analysis. Interest
and investments as the second largest source of revenue, but when we remove Ford’s
and Mercy’s influence, it drops to third largest. As a result, program service fees
move from third to second after removing Ford and Mercy.
Of total contributions, gifts, or grants, $13.9 million came from sources outside of the
Douglas County economy.
Expenditures
Nonprofits spent over $98 million over the study period.
Payroll was the largest expenditure category. Nonprofits spent over $41 million
dollars on wages, salaries, and benefits. The next largest expenditure item was gifts
or grants to other parties of over $20 million.
The health and medical nonprofit subgroup was the largest in terms of expenditures.
The social service subgroup was second largest. However, removing Mercy Medical
makes the charities or foundations the largest spenders, attributing for over 50
percent of expenditures (minus Mercy). Social services is the third largest spender.
Employment
Nonprofits accounted for 1,771 jobs in the county (1,111 full-time, 660 part time)
42 percent of all nonprofit jobs paid over $12 per hour. 75 percent of jobs came with
health insurance.
Nonprofits mobilized over 6,300 volunteers and 460,000 volunteer hours at an
estimated value of $5.5 million.
Indirect effects
Economic activity stimulates additional economic activity via the circulation of
dollars through a local economy. Using income and employment multipliers, CPW
estimates that nonprofit activities generated an additional $5.6 million of labor
income (wage earners and self-proprietors) and 103 additional jobs elsewhere in
the local economy

Economic Impact of Douglas County Nonprofit Organizations CPW February 2001 Page 58
For every new dollar brought in from outside the local economy an additional 40
cents in income is created locally. For every job generated from revenues from
outside the economy, one-third of a new job is created
It is easy to become overwhelmed by the amount of data presented in this chapter (the
author certainly did at times). Table 4-19 highlights some of the chapter’s information.
Table 4-19. Economic impact summary table
Category Impact
Direct Impacts
Revenue: $299,873,315
Expenses: $102,301,345
Employment:
Full-time jobs 1,111
Part-time 660
Total employment 1,771
Payroll $ 41,162,441
Volunteers
Number of volunteers 6,304
Volunteer hours 463,518
Imputed value of volunteer time 5,562,216
Indirect Impacts
Gifts, grants from outside county 13,962,732
Income multiplier effect ($) 5,657,067
"Export-related jobs" 336
Employment multiplier effect (jobs) 103
Source: CPW, 2000

Economic Impact of Douglas County Nonprofit Organizations CPW February 2001 Page 59
Appendix A: Miscellaneous data tables
Table A-1. Mean and median revenue by source
Source Subset
size Total Mean Median
Contributions
All reporting contributions 56 134,593,987 2,403,464 45,000
Minus Ford Family 55 18,493,053 336,237 40,000
Program services
All with program revenue 29 76,731,363 2,645,909 22,016
Minus Mercy Medical 28 12,351,240 441,116 18,258
Membership dues
All with dues revenue 29 259,460 8,947 467
Investment and interest
All reporting investment revenue 54 86,677,743 1,605,143 1,735
Minus Ford Family 53 5,665,117 106,889 1,716
Special events and activities*
All with event revenue 16 315,217 19,701 4,147
Source: CPW, Economic impact survey Notes: Ford and Mercy are addressed specifically because they are statistical outliers.
Table A-2. Revenue and percent of total revenue by source
Source Entire Sample Minus Ford and Mercy
Revenue by
Source Percent of Total Revenue by
Source Percent of Total
Membership dues 259,460 0.10% 259,460 0.70%
Special events and activities 315,217 0.10% 315,217 0.80%
Miscellaneous 1,295,545 0.40% 1,295,545 3.40%
Program services 76,731,363 25.60% 12,351,240 32.20%
Investment and interest 86,677,743 28.90% 5,604,061 14.60%
Contributions 134,593,987 44.90% 18,472,993 48.20%
Total 299,873,315 100.00% 38,298,516 100.00%

Economic Impact of Douglas County Nonprofit Organizations CPW February 2001 Page 60
Table A-3. Revenue by activity for entire sample
Activity N Mean Median Sum % of total revenue
Cemetery maintenance 3 1,194 1,600 3,584 0.0%
Fraternal organization 4 13,718 923 54,872 0.0%
Environmental 3 20,088 17,843 60,264 0.0%
Business, Trade 1 205,000 205,000 205,000 0.1%
Historic Resources 4 223,557 33,287 894,231 0.3%
Education 7 281,300 39,353 1,969,106 0.7%
Recreational, social, cultural 24 149,315 1,642 3,583,568 1.2%
Social Services 14 858,758 102,353 12,022,614 4.0%
Health/medical 7 10,831,074 2,097,056 75,817,519 25.3%
Charity or foundation 20 10,263,128 48,659 205,262,557 68.4%
Total 87 22,847,132 2,547,716 299,873,315 100.0%
Table A-4. Revenue by activity for sample excluding Mercy and Ford
Activity N Mean Median Sum % of total revenue
Cemetery maintenance 3 1,194 1,600 3,584 0.0%
Fraternal organization 4 13,718 923 54,872 0.1%
Environmental 3 20,088 17,843 60,264 0.2%
Business, Trade 1 205,000 205,000 205,000 0.5%
Historic Resources 4 223,557 33,287 894,231 2.3%
Education 7 281,300 39,353 1,969,106 5.1%
Recreational, social, cultural 24 149,315 1,642 3,583,568 9.4%
Charity or foundation 19 428,894 42,237 8,148,997 21.3%
Health/medical 6 1,892,713 1,253,028 11,356,280 29.7%
Social Services 14 858,758 102,353 12,022,614 31.4%
Total 85 4,074,537 1,697,266 38,298,516 100.0%

Economic Impact of Douglas County Nonprofit Organizations CPW February 2001 Page 61
Table A-5. Payroll by Activity
Activity Payroll % of total
Cemetary 950 0.0%
Environmental 4,500 0.0%
Fraternal 8,069 0.0%
Business, Trade 100,000 0.2%
Historical 322,433 0.8%
Recreation 574,433 1.4%
Charity 731,253 1.8%
Education 922,542 2.2%
Social Service 5,988,129 14.5%
Health 32,510,132 79.0%
Total 41,162,441 100.0%
Table A-6. Distribution of jobs by wage range for each activity
$6.50-$9.00 $9.01-$12.00 $12.01-$15.00 $15.01-$18.00 $18.01-$21.0 OVER $21
Charity 36% 12% 12% 4% 4% 32%
Education 66% 8% 5% 17% 3% 1%
Enviro. 100% 0% 0% 0% 0% 0%
Fraternal 100% 0% 0% 0% 0% 0%
Health 32% 20% 7% 14% 11% 17%
Historic 10% 11% 23% 23% 11% 23%
Recreation 84% 1% 1% 0% 0% 15%
Social Service 36.5% 31% 18% 8% 3% 4%
Business, Trade No data

Economic Impact of Douglas County Nonprofit Organizations CPW February 2001 Page 63
Appendix B: Q-30 transcription and survey form
Late due to first vote not to participate. Next meeting voted to reconsider and voted to
participate.
We are a new organization, receiving our 501 (c) status Oct. 4, 1999.
This is not a Douglas County organization. We have members in Oregon, Washington,
and Idaho. I am the President and I live in Douglas County. I don’t believe we should
take part in the survey.
In addition to books donated to Douglas Co. Libraries (in Q-6) we put on a 2 day gem
and mineral show with free admission and give away door prizes and rocks to kids.
We found that this form was hard to fill out since so much of it did not seem to fit our
situation.
Provides Nursing Home Christmas Parties, Red Cross cookies, bell ringing, flower
planting, SMART readers and fund raising—fundraising is run thru Zonta Foundation
to qualify under 501 (c) 3.
This organization should be paired with Zonta Club as fundraising in the club is run
through Foundation so donations will qualify under 501 (c) 3.
Foster Grandparent and Senior Companion pay their volunteers a tax free stipend--
$2.55 an hour. Also meal and mileage reimbursement to low income seniors.
Our big expense last year was Amer. Legion Baseball. Insurance on building and
property about $8000 to Oregon Mutual by local Sutherlin agent. We deal locally for
everything we can.
This organization administers programs funded by grants. Employees are staffed by
the housing authority of Douglas County. Compensation for payroll is by approved
grant funded program budgets.
Pomona Grange is the county level of Grange. They meet in the subordinate Grange
halls throughout the county once a quarter so own no property.
Our organization is 100 percent volunteers. Our major expenditures are for drama
camp, directors, sound and light production and performers. The performers and
booking agent are the only expenditures that are not local. We are a youth theater and
4 concerts—all free to the public.
We have not found Douglas County professional services (attorney and CPA) to
completely meet our needs. Telecommunications (lack of) has caused us to consider
moving to Eugene or Medford.
Friends of Gardiner Cemetery accept donation to help care for the cemetery—all
volunteer basis—no pay. Any money is used to repair vandalism, upkeep, etc.
Thanks—sorry can’t supply more information!
New organization started 12/99 (Winston Area Community Partnership).
Operating budget only. Capital campaign not included. School enrollment and parents
and infants = 813. (Phoenix School)
We are a small group of volunteers that have adopted the Beaver Creek Trail on the
Tiller Ranger District of the Umpqua National Forest. We do maintenance such as
clearing brush, fallen trees, etc, putting gravel on wet areas and water bars to provide
drainage. This year due to hot weather we haven’t done much at all!
Our foundation is very specialized in that we assist quadriplegic individuals only for
their specific needs. Identified individuals are typically assisted through fundraising
efforts for medical type equipment, i.e. wheelchairs, ramps, etc. We have been fortunate

Economic Impact of Douglas County Nonprofit Organizations CPW February 2001 Page 64
to help some fine people and also fortunate that our services have not been needed on a
frequent basis…meaning no spinal cord injuries coming to our attention.
This is a cemetery association. We sell membership not plots. Members do pick their
plots. On clean up day we do have around 20 people come to help otherwise we contract
the mowing.
Numbers used are for UCDC’s operational. Also have subsidiaries with operating accts
that are not kept on UCDC’s book. Total assets for UCDC per 1999 audit are
$4,399,657.
This did not fit us very well—We donated 2000 items of food (collected at our event) to
the Sutherlin/Oakland food pantry and provided a free rodeo for our spectators.
Our organization is a cooperative preschool. We are exempt from filing form 990 and
therefore our survey is incomplete.
Do not feel this is appropriate for fraternal organizations, especially this small.
The IRS 990 responses come from our 1998 filing. Our 1999 filing is not due until
November 2000. (UTEP)
Community would really like to see organization such as mine in area. Everyone think
it’s good idea and support but area is very low economic….
Our organization is a charitable corporation—all volunteer, which includes the
members of the Cow Creek Historical Society and the Cow Creek Valley Fine Arts
Association, and C.A.R.T. Many members belong to all 3 groups.
Please check the submitted survey from Glendale –Azalea CART.
We buy glasses, shoes, and other items for children in the community, donate to
community projects, such as equipment for Glendale youth baseball, school projects and
to the ambulance and fire districts (equipment, education for the volunteers) and also
some scholarships.
We were organized in January of 2000. We are in the processes of remodeling a
Community building for meetings, socials, fund raising projects and whatever will
benefit the community.
In October 1999 we changed our name and added new services that of Camp
millennium. But prior to this our organization did minimal—only 1 event a year.
This is done to the best of my ability. On Friday each person brings a dish for pot luck
and puts in 50 cents for meat (it never covers the cost). We give door prizes which
consists of canned fruit or vegetables—1 collection each month goes to UCAN or they
can bring canned food for UCAN.
We run a 1988 van to transport seniors to and from the dining site. All funds are
donated from local sources. All expenditures are made in Douglas County. The
organization is all volunteer.
We are a former school facility (former Umpqua School) and we now serve as a nonprofit
community center (incorporated) for a rural area with approximately 500 families.
Myrtle Creek Performing arts Center was formed in November 1999. We are in the
process of doing the paperwork, i.e., plans, budget, 501 (c) 3, etc. A 2000 survey will be
more responsive.
We are a service organization for a volunteer Fire Department. We raise money to help
support the department.

Economic Impact of Douglas County Nonprofit Organizations CPW February 2001 Page 65
Douglas County Nonprofit Coalition c/o Community Planning Workshop
1209 University of Oregon
(541) 346-3653
Dear nonprofit professional,
The Douglas County Nonprofit Coalition is an informal group of nonprofit agencies that meets regularly to share ideas, provide mutual support, and discuss topics of common interest. Many of us see ourselves as businesses as well as nonprofit agencies trying to better our community. As businesses we realize we are an important part of the economic health of our county. That is, many of us spend money locally, provide employment, and bring dollars into our communities from outside sources. Even though we know we benefit the Douglas County economy, we are unable to quantify what the actual economic impact is. Therefore we have decided to partner with the University of Oregon to conduct an Economic Impact Survey to better understand how we benefit the local economy.
Beyond wanting to know what our economic impact is, there are several reasons why we
have decided to undertake this endeavor. One is to educate the community that nonprofits
give back to the community in economic terms and not just take from it. It is our
impression that the public sees nonprofits as always having their hand out for donations.
Another reason is to help build the understanding that nonprofits are businesses.
Quantifying the economic impact, especially the number of dollars we bring into the
community, helps to underscore this fact. Finally we hope to use this data to show that
time and energy supporting nonprofits is a good investment in dollar-and-cents terms
because of the value nonprofits and their services provide to the community.
We encourage you to take the time to complete and return the survey because the results
will be beneficial to all nonprofits in the county, and can aid you in carrying out your
missions. As a token of our appreciation, we will share a copy of the survey results with
everyone who returns a survey and enter them in a drawing for a very special prize. We
appreciate your assistance and look forward to your responses.
Thank you for your time.
Sincerely yours,
The Douglas County Nonprofit Coalition

Economic Impact of Douglas County Nonprofit Organizations CPW February 2001 Page 66
Douglas County Nonprofit Economic Impact Survey
The Douglas County Nonprofit Coalition is gathering information from the county’s nonprofit organizations to estimate their impact on the local economy. This survey asks a series of questions about your organization’s activities, sources of support, and staffing. The questions are designed to reflect the wide range of nonprofits in Douglas County, including social service organizations, social and recreational groups, and political advocacy groups. Several questions will ask you to refer to your 1999 IRS Form 990, return of organizations exempt from income tax. All responses will be kept
strictly confidential. As a token of our appreciation, we will include all survey respondents in a drawing for a special prize. Please return your completed response by Friday, September 4.
Questions 1-12 ask about your organization’s revenue, expenses, and assets. These questions ask you to enter information from the 990 or 990-EZ to the spaces provided below. As an alternative, you may submit a copy of your 990 or 990-EZ and skip to Q-13.
Revenue
Q-1. What is your organization’s tax-exempt status? 501(c) __________
Other __________ Q-2. How much support did your organization receive in the form of gifts or
grants in 1999? (990 line 1d; 990-EZ line 1) $
Q-3. If your organization earns revenue from services (including government
fees and contracts) that it provides, what were your total earnings in 1999? (990 line 2; 990-EZ line 2) $
Q-4. If your organization assesses membership fees or dues, what were your
total dues received in 1999? (990 line 3; 990-EZ line 2) $ Q-5. If your organization earned interest or investment income in 1999,
what was the total amount? (990 lines 4, 5; 990-EZ line 4) $
Expenses Q-6. If your organization made any grants or contributions to other parties in
1999, what was the total amount granted or contributed? (990 line 22; 990-EZ line 10) $
Q-7. If your organization paid any benefits to or for its members in 1999,
what was the total amount of benefits? (990 line 24, 990-EZ line 11) $

Economic Impact of Douglas County Nonprofit Organizations CPW February 2001 Page 67
Q-8. How much did your organization pay in salaries, other compensation, employee benefits, and compensation for officers or directors in 1999? (990 lines, 25, 26, 27, 28, 29; 990-EZ line 12) $
Q-9. How much did your organization pay in professional fees (accounting,
legal, fundraising, etc.) or payments to independent contractors in 1999? (990 Lines 30, 31, 32; 990-EZ line 13) $
Q-10. How much did your organization pay in occupancy, rent, utilities and
maintenance in 1999? (990 lines 34, 36, 37; 990-EZ line 14) $
Q-11. How much did your organization pay in printing, publications, postage, and shipping in 1999? (990 lines 35, 38; 990-EZ line 15) $
Q-12. How much did your organization pay in office equipment and supplies
in 1999? (990 line 33, 990-EZ Line 16 or from your records) $
The next section asks about financial information, not included within the 990 or 990-EZ. Q-13. What percent of the gifts or grants your organization received in 1999 came from
sources outside of Douglas County? % Q-14. What percent of the total professional fees (legal, accounting, etcetera) or
payments to independent contractors in 1999 was paid to Douglas County firms? % Q-15. What percent of the amount paid on office supplies and equipment in 1999 was
spent in Douglas County? %
Q-16. Did your organization have any accounts receivable that went unpaid in 1999?
YES NO
If yes, what were the total unpaid accounts receivable in 1999? $
Q-17. In contrast to Q-16, did your organization provided any services in 1999
that were unbilled and uncompensated? YES NO
If yes, what was the value of these services? $
Q-18. Did your organization incur any other substantial expenses such as acquisition of real property, capital improvement, motor vehicles, or other assets in 1999?
YES NO
If yes, how much did you spend on these items in 1999? $
Q-19. If your organization owns real estate, what is the assessed value of your
property or properties in 1999? $

Economic Impact of Douglas County Nonprofit Organizations CPW February 2001 Page 68
Now we would like to ask you about your organization’s operations and activities?
Q-20. What is the nature of your organization?
Charity or foundation Social Service Recreational, social, cultural Health/Medical
Environmental Professional/Business/Trade association Political Other ____________________________
Q-21. How many years has your organization been active in Douglas County?
Q-22. How many persons did your organization employ in 1999?
Full time __________ Part time __________
Q-23. What is the total Full Time Equivalency (FTE) for your employees in 1999? FTE
Q-24. What percentage of your employees fall into the following hourly wage ranges in 1999?
$6.50 - $9.00: ________%
$9.01 - $12.00: ________%
$12.01 - $15.00: ________%
$15.01 - $18.00: ________%
$18.01 - $21.0: ________%
Over $21.00: ________%
Q-25. What percentage of your employees received the following benefits in 1999?
Health _________% Dental _________% Retirement _________%
Q-26. How many volunteers do you estimate participated on behalf of your
organization in 1999?
Q-27. How many hours do you estimate your volunteers contributed in 1999?
Q-28. If your organization is comprised of membership, how many members did
you have in 1999?
Q-29. If you have any comments that you would like to share with us, please use the space provided below.
Q-30. Organization:
Telephone:
Contact person:
Email:
Thanks for your participation!

Economic Impact of Douglas County Nonprofit Organizations CPW February 2001 Page 69
Appendix C: Bibliography and References
Ackerman, Susan Rose. 1986. The Economics of Nonprofit Institutions: Studies in
Structure and Policy. New York: Oxford University Press.
Hustedde, Ron, Ron Shaffer, Glen Pulver. 1984. Community Economic Analysis: A How to
Manual. Madison, WI: North Central Regional Center for Regional Development,
University of Wisconsin.
Independent Sector. 1997. The Nonprofit Almanac. San Francisco: Jossey-Bass
Publishers.
Internal Revenue Service. 1999. Instructions for Form 990 and Form 990-EZ. Department
of the Treasury.
Oregon Employment Department. 1999. 1998 Covered Employment and Payrolls.
Oregon Employment Department. 1999. 2000 Regional Economic Profile: Region 6.
Oregon Employment Department. 2001. Roseburg Labor Trends.
Powell, Walter (ed.). 1987. The Nonprofit Sector: A research handbook. New Haven: Yale
University Press.
Salamon, Lester M. 1999. America’s Nonprofit Sector: A Primer. New York: The
Foundation Center.
Snavely, Keith, Roger Beck. 1993. “Defining the Role of Nonprofit Corporations in
Community Economic Development.” Journal of the Community Development Society.
Columbia, MO.