economic impact analysis of the proposed stationary ... combustion... · economic impact analysis...
TRANSCRIPT

United States Office Of Air QualityEnvironmental Protection Planning And Standards November 2002Agency Research Triangle Park, NC 27711 FINAL REPORT
Air
Economic Impact Analysis of the ProposedStationary Combustion Turbines NESHAP
Final Report

This report contains portions of the economic impact analysis report that are related to the industryprofile.

1Combustion turbine technology used for aircraft engines is virtually the same except the energy is used togenerate thrust.
1
SECTION 2
COMBUSTION TURBINE TECHNOLOGIES AND COSTS
This section provides background information on combustion turbine technologies. Included isa discussion of simple-cycle combustion turbines (SCCTs) and combined-cycle combustion turbines(CCCTs), along with a comparison of fuel efficiency and capital costs between the two classes ofturbines.
2.1 Simple-Cycle Combustion Turbine Technologies
Most stationary combustion turbines use natural gas to generate shaft power that is convertedinto electricity.1 Combustion turbines have four basic components, as shown in Figure 2-1.
1. The compressor raises the air pressure up to thirty times atmospheric.
2. A fuel compressor is used to pressurize the fuel.
3. The compressed air is heated in the combustion chamber at which point fuel is added andignited.
4. The hot, high pressure gases are then expanded through a power turbine, producing shaftpower, which is used to drive the air and fluid compressors and a generator or othermechanical drive device. Approximately one-third of the power developed by the powerturbine can be required by the compressors.
Electric utilities primarily use simple-cycle combustion turbines as peaking or backup units. Theirrelatively low capital costs and quick start-up capabilities make them ideal for partial operation to

2Spinning reserves are unloaded generating capacity that is synchronized to the grid that can begin to respondimmediately to correct for generation/load imbalances caused by generation and transmission outages andthat is fully available within 10 minutes. Black-start capacity refers to generating capacity that can be madefully available within 30 to 60 minutes to back up operating reserves and for commercial purposes.
2
generate power at periods of high demand or to provide ancillary services, such as spinning reserves orblack-start back-up capacity.2 The disadvantage of simple-cycle systems is that they are relativelyinefficient, thus making them less attractive as base load generating units.
2.2 Combined-Cycle Combustion Turbines Technologies
The combined-cycle system incorporates two simple-cycle systems into one generation unit tomaximize energy efficiency. Energy is produced in the first cycle using a gas turbine; then the heat thatremains is used to create steam, which is run through a steam turbine. Thus, two single units, gas andsteam, are put together to minimize lost potential energy.
The second cycle is a steam turbine. In a CCCT, the waste heat remaining from the gas turbinecycle is used in a boiler to produce steam. The steam is then put through a steam turbine, producing
Com
pres
sor
Tur
bine
CombustionChamber
Fuel
Air
Fuel Compressor
Turbine Shaft
WorkOutput
Exhaust
Gas Turbines
Figure 2-1. Simple-Cycle Gas Turbine
Source: Hay, Nelson E., ed. 1988. Guide to Natural Gas Cogeneration. Lilburn, GA: The Fairmont Press, Inc.
3
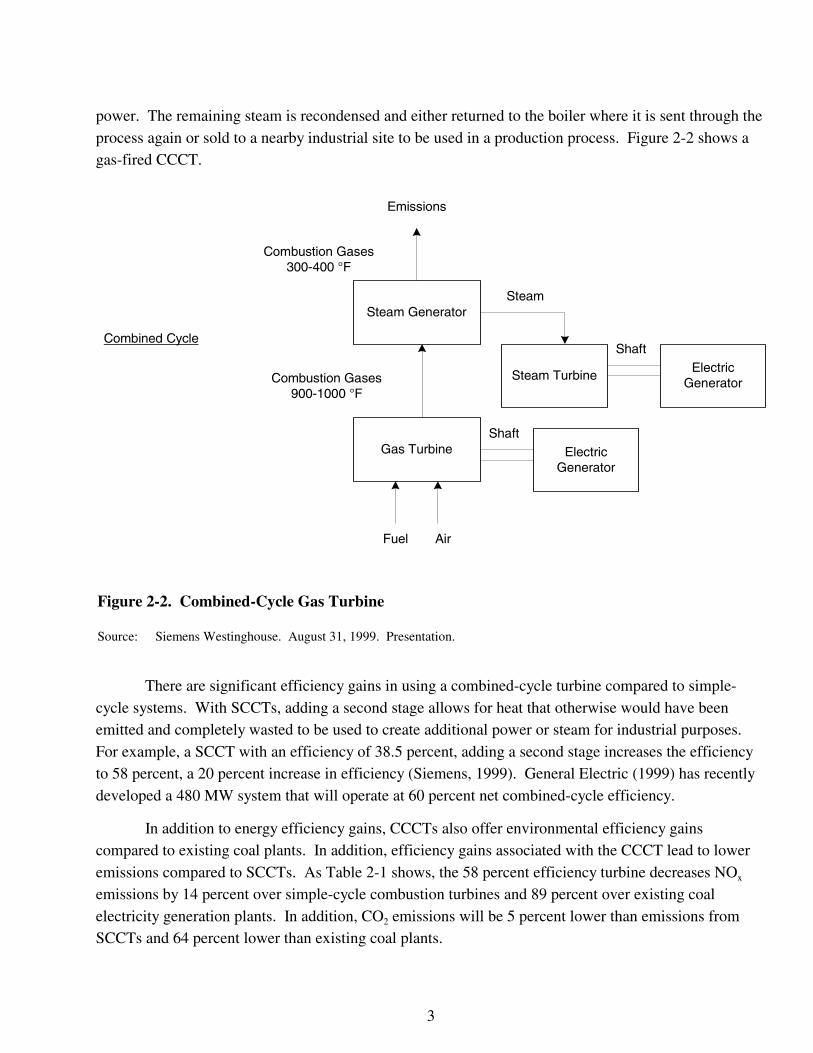
power. The remaining steam is recondensed and either returned to the boiler where it is sent through theprocess again or sold to a nearby industrial site to be used in a production process. Figure 2-2 shows agas-fired CCCT.
There are significant efficiency gains in using a combined-cycle turbine compared to simple-cycle systems. With SCCTs, adding a second stage allows for heat that otherwise would have beenemitted and completely wasted to be used to create additional power or steam for industrial purposes. For example, a SCCT with an efficiency of 38.5 percent, adding a second stage increases the efficiencyto 58 percent, a 20 percent increase in efficiency (Siemens, 1999). General Electric (1999) has recentlydeveloped a 480 MW system that will operate at 60 percent net combined-cycle efficiency.
In addition to energy efficiency gains, CCCTs also offer environmental efficiency gainscompared to existing coal plants. In addition, efficiency gains associated with the CCCT lead to loweremissions compared to SCCTs. As Table 2-1 shows, the 58 percent efficiency turbine decreases NOx
emissions by 14 percent over simple-cycle combustion turbines and 89 percent over existing coalelectricity generation plants. In addition, CO2 emissions will be 5 percent lower than emissions fromSCCTs and 64 percent lower than existing coal plants.
Combustion Gases300-400 °F
Emissions
Steam Generator
Steam Turbine
Steam
ElectricGenerator
ShaftCombined Cycle
Gas Turbine
Fuel Air
ElectricGenerator
Shaft
Combustion Gases900-1000 °F
Figure 2-2. Combined-Cycle Gas Turbine
Source: Siemens Westinghouse. August 31, 1999. Presentation.

4
2.3 Capital and Installation Costs
CCCT capital and installation costs are approximately 30 percent less ($/MW) than aconventional coal or oil steam power plant’s capital and installation costs, and CCCT costs are likely todecrease over the next 10 years. Gas turbine combined-cycle plants range from approximately $300 perkW installed for very large utility-scale plants to $1,000 per kW ($1998) for small industrialcogeneration installation (GTW Handbook, 1999). However, the prices of construction can vary as aresult of local labor market conditions and the geographic conditions of the site (GTW Handbook, 1999). SCCTs are approximately half the cost of CCCT units.
Table 2-2 breaks down the budgeted construction costs of a gas-fired 107 MW combined-cyclecogenerating station at John F. Kennedy International Airport that was installed several years ago. Asshown in Table 2-2, the construction price can range dramatically. This job finished near the top of thebudget, close to $133,600,000. According to Gas Turbine World, the typical budget price for a 168 MWplant is $80,600,000, ($480/kW) for a plant with net efficiency of 50.9 percent (GTW Handbook, 1999).
Table 2-1. Comparison of Emissions from Coal-Fired and Simple-Cycle Turbines and Combined-Cycle Turbines
NOx
(lb/MW-hr)CO2
(lb/MW-hr)
Coal electricity generation 5.7 2,190
Simple-cycle turbines 0.7 825
Combined-cycle turbines 0.6 780
Source: Siemens Westinghouse. August 31, 1999. Presentation.

5
2.4 O&M Costs Including Fuel
Fuel accounts for one-half to two-thirds of total production costs (annualized capital, operationand maintenance, fuel costs) associated with generating power using combustion turbines. Table 2-3compares the percentage of costs spent on annualized capital, operation and maintenance, and fuel forboth simple turbines and CCCTs.
The fuel costs may vary depending on the plant’s location. In areas where gas costs are high, fora base-load CCCT power plant, fuel costs can account for up to 70 percent of total plantcosts—including acquisition, owning and operating costs, and debt service (GTW Handbook, 1999). General Electric’s “H” design goals for future CCCT systems are to reduce power plant operating costsby at least 10 percent compared to today’s technology as a direct result of using less fuel. The higherefficiency allows more power to be generated with the same amount of fuel, resulting in a substantialfuel cost savings for the plant owner (General Electric, 1999).
Table 2-2. Overall Installation Costs
Construction costs can vary dramatically. This table shows the budgeted cost for a gas-fired 107 MWcombined-cycle cogenerating station at John F. Kennedy International Airport in Brooklyn, New York. Thepower plant uses two 40 MW Stewart & Stevenson LM6000 gas turbine generators each exhausting into atriple pressure heat recovery steam generator raising steam for processes and to power a nominal 27 MW steamturbine generator. Budgeted prices are in 1995–1996 U.S. dollars.
Budget Equipment Pricing $ Amount
Gas turbine generators $24,000,000
Heat recovery steam generators 10,000,000
Steam turbine generator set 4,000,000
Condenser 300,000
Cooling towers 800,000
Transformer and switchgear 8,000,000
Balance of plant equipment 7,500,000
Subtotal, equipment $54,600,000
Budget Services and Labor
Mechanical and electrical construction $20-75,000,000
Engineering 4,000,000
Subtotal, services $24-79,000,000
Total Capital Cost $78,600,000-133,600,000
Source: 1998–99 GTW Handbook. “Turnkey Combined Cycle Plant Budget Price Levels.” Fairfield, CT: Pequot Pub. Pgs.16–26.

6
Table 2-3. Comparison of Percentage of Costsa
Simple Cycle Combined Cycle
% Capital costs 50 25
% Operation and maintenance 10 10
% Fuel 40 65
a Based on a review of marketing information from turbine manufacturers and the GTW Handbook.

7
SECTION 4
PROJECTION OF UNITS AND FACILITIES IN AFFECTED SECTORS
The proposed regulation will affect existing and new combustion turbine units with capacityover 1 MW. As a result, the economic impact estimates presented in Section 6 and the small businessscreening analysis presented in Section 7 are based on the population of existing units and the projectionof new combustion turbine units through the year 2005. This section begins with a review of thetechnical characteristics and industry distribution of existing combustion turbines contained in theAgency’s Inventory Database. It presents projected growth estimates for combustion turbines greaterthan 1 MW and describes trends in the electric utility industry. It also presents (in Section 4.3) theestimated number of existing and new combustion turbines that will be affected by this proposed rule.
4.1 Profile of Existing Combustion Turbine Units
This section profiles existing combustion turbine units (greater than 1 MW) with respect tobusiness applications, industry of parent company, and fuel use. For nonutility combustion turbines, thepopulation of existing sources will be used to provide the characteristics of new combustion turbinesconstructed through the year 2005.
The population of existing combustion turbine units used in the analysis was developed from theEPA Inventory Database V.4— Turbines (referred to as the Inventory Database). The combustionturbines contained in the Inventory Database are based on information from the Aerometric InformationRetrieval System (AIRS) and Ozone Transport Assessment Group (OTAG) databases, state and localpermit records, and the combustion source Information Collection Request (ICR) conducted by theAgency in 1997. The list of combustion turbine units contained in the Inventory Database was reviewedand updated by industry and environmental stakeholders as part of the Industrial CombustionCoordinated Rulemaking (ICCR), chartered under the Federal Advisory Committee Act (FACA).
From the Inventory Database, EPA identified 2,072 combustion turbines with greater than 1MW capacity. More than 2,800 additional turbines were listed in the database, but their records lackedcapacity information and/or industry information, so these units are excluded from this analysis. Thetotal estimated population of existing combustion turbines is about 8,000, so the coverage in theInventory Database of the estimated existing combustion turbine population is approximately 60percent. The profiles presented below are based in the 2,072 combustion turbines in the InventoryDatabase above 1 MW of capacity with valid information for inclusion in the analyses conducted forthis proposed rule.

8
4.1.1 Distribution of Units and Facilities by Industry
Table 4-1 presents the number of combustion turbines and facilities owning turbines by NAICScode. Forty-seven percent of existing combustion turbines are in Utilities (NAICS 221), 22 percent arein Pipeline Transportation, and 18 percent are in Oil and Gas Extraction (NAICS 211). Section 4presents industry profiles for the electric power, natural gas pipelines, and oil and gas industries. Theremaining units are primarily distributed across the manufacturing sector and are concentrated in thechemical and petroleum industries.
4.1.2 Technical Characteristics
This section characterizes the population of 2,072 units by MW capacity, fuel type, hours ofoperation, annual MWh produced (or equivalent), and simple or combined cycle.
� MW Capacity: Unit capacities in the population range between 1 and 368 MW. Althoughsome units have large capacities in excess of 100 MW, about half (1,000 units) havecapacities between 1 and 10 MW (see Figure 4-1). Only approximately 13 percent (278units) have capacities greater than 100 MW. The total estimated capacity of all the units inthe population is 79,909 MW.
� Fuel type: Natural gas is the most common fuel consumed by units in the population. About28 percent (579 units) use distillate oil, which is more commonly known as diesel fuel. Arelatively small number (53 units) consume other fuels, such as landfill gas, crude oil, andresidual fuel oil.
Although only 28 percent of units use distillate oil, in terms of the total MW capacity of thepopulation, distillate oil fuels a disproportionate percentage, nearly 43 percent. This implieseither that many of the mid- to large-sized turbines are fueled by distillate oil, that naturalgas is more common in smaller units, or that a combination of the two explains this fact.
� Hours of Operation: Nearly half of all turbines (925 units) operate more than 7,500 hoursper year (see Table 4-2). A year consists of approximately 8,760 hours. Although 488 unitsoperate less than 500 hours per year, only 414 units operate between 500 and 7,500 hours peryear. Information on annual hours of operation was unavailable for 245 (or 12 percent) ofthe 2,072 units. Because the

9
Table 4-1. Facilities With Units Having Capacities Above 1 MW by Industry Grouping andGovernment Sector
NAICS Description # Units # Facilities
112 Animal Production 1 1211 Oil and Gas Extraction 365 105212 Mining (Except Oil and Gas) 3 3221 Utilities 983 393233 Building, Developing, and General Contracting 1 1235 Special Trade Contractors 2 1311 Food Manufacturing 18 11321 Wood Products Manufacturing 3 2322 Paper Manufacturing 17 11324 Petroleum and Coal Products Manufacturing 34 11325 Chemical Manufacturing 63 39326 Plastics and Rubber Products Manufacturing 4 3327 Nonmetallic Mineral Product Manufacturing 1 1331 Primary Metal Manufacturing 13 4332 Fabricated Metal Product Manufacturing 2 2333 Machinery Manufacturing 2 2334 Computer and Electronic Product Manufacturing 6 5335 Electrical Equipment, Appliance, and Component
Manufacturing1 1
336 Transportation Equipment Manufacturing 3 3337 Furniture and Related Product Manufacturing 1 1339 Miscellaneous Manufacturing 3 3422 Wholesale Trade, Nondurable Goods 6 4486 Pipeline Transportation 448 244488 Support Activities for Transportation 1 1513 Broadcasting and Telecommunications 1 1522 Credit Intermediation and Related Activities 3 1541 Professional, Scientific, and Technical Services 2 2561 Administrative and Support Services 1 1611 Educational Services 10 8622 Hospitals 23 14721 Accommodation 1 1923 Administration of Human Resource Programs 1 1926 Administration of Economic Programs 1 1928 National Security and International Affairs 42 12
Unknown Industry Classification Unknown 6 5
Total 2,072 899
Source: Industrial Combustion Coordinated Rulemaking (ICCR). 1998. Data/Information Submitted to the CoordinatingCommittee at the Final Meeting of the Industrial Combustion Coordinated Rulemaking Federal AdvisoryCommittee. EPA Docket Numbers A-94-63, II-K-4b2 through -4b5. Research Triangle Park, North Carolina. September 16-17.

10
785
215 227
325
242 221
57
0
100
200
300
400
500
600
700
800
900
1 to 5 5 to 10 10 to 25 25 to 50 50 to 100 100 to 200 >200
MW Capacity Range
Nu
mb
er o
f U
nit
s
Figure 4-1. Number of Units by MW Capacity
Table 4-2. Stationary Combustion Turbine Projections
Total Number of New Units
Utility Turbines
Base load energy (combined cycle) 480
Peak power (simple cycle) 235
Nonutility Turbines
Small 10
Medium 31
Large 15
Total in 5th year 771
Average per year 154

11
vast majority of those units were located on pipelines, which operate 24 hours a day, or atelectric utility plants, many of the 245 units probably operate more than 7,500 hours a year.
� Annual MWh Equivalent: Figure 4-2 presents the distribution of units by the estimatedannual MWh equivalent produced by each unit. For units that are used for compression orother functions, their likely MWh output was estimated using their MW capacity and annualhours of operation. Annual MWh for 245 units lacking annual hours of operationinformation was not calculated. Figure 4-3 includes data for the other 1,827 units, more thanone-third of which have output of between 10,000 and 50,000 MWh a year. 360 units haveoutput of less than 5,000 MWh, and 217 units have output greater than 500,000 MWh.
� Simple vs. combined cycle: Information was not available from the Inventory Database onthe type of turbine. However, based on industry sales data, a breakdown of 1998 industryorders shows that 32 percent of the orders were for peak SCCTs and the remaining 68percent were for CCCTs. Sixty percent of the buyers were merchant plants, 10 percent wereindependent power producers (IPPs), and the remaining 30 percent were rate-base utilitygenerators (Siemens Westinghouse, 1999).
4.2 Projected Growth of Combustion Turbines
The Agency estimates there will be a total of 771 new stationary combustion turbines over thenext 5 years (see Table 4-2). This projection is based on information supplied from the turbinemanufacturing industry, state permit data compiled by EPA, and Gas Turbine World’s 1999-2000Handbook on Gas Turbine Orders and Installations.
4.2.1 Comparison of Alternative Growth Estimates
Specific growth projections for combustion turbines vary with respect to the timing of theconstruction of new units. Table 4-3 shows that according to 1998 projections, U.S. electric utilitieswere planning to install 316 new units between 1998 and 2007. The units are expected to average165 MW. The majority of these units are projected to be CCCTs (DOE, 1999d). According to a secondstudy, the Department of Energy projects 300 GW of new generation capacity will be needed by theyear 2020 (Reuters News Service, 1999).
Because the electric utility industry accounts for 70 percent of the projected new units and 97percent of the projected new capacity in MW and nearly half of the existing units and 72 percent of theexisting capacity in MW, the remainder of this section focuses on the trends in the electric utilityindustry.

12
488
106 111 90 107
925
0
100
200
300
400
500
600
700
800
900
1,000
<500 500 to 1,500 1,500 to 3,500 3,500 to 5,500 5,500 to 7,500 >7,500
Annual Hours of Unit Operation
Nu
mb
er o
f U
nit
s
Figure 4-3. Number of Units by Annual Hours of Operation
Note: Excludes 245 units for which information on annual hours of operation was unavailable.

13
132
228183
624
149
294
217
0
100
200
300
400
500
600
700
<500 500 to 5,000 5,000 to10,000
10,000 to50,000
50,000 to100,000
100,000 to500,000
>500,000
Annual MWh Equivalent
Nu
mb
er o
f U
nit
s
Figure 4-2. Number of Units by Annual MWh Output Equivalent
Note: Excludes 245 units for which information on annual hours of operation was unavailable.

14
Table 4-3. Planned Capacity Additions at U.S. Public Utilities, 1998 through 2007, as of January1, 1998
Year Number of Units Generator Nameplate Capacity (MW)
U.S. Total 316 52,0441998 60 2,0201999 25 2,2982000 31 3,8752001 31 5,8432002 35 5,9782003 34 8,2012004 26 5,7072005 31 7,5762006 22 5,8792007 21 4,667
Notes: Total may not equal the sum of components because of independent rounding.Source: U.S. Department of Energy, Energy Information Administration. 1999c. Electric Power Annual 1998. Volumes I
and II. Washington, DC: U.S. Department of Energy.
4.3 Number of Affected Stationary Combustion Turbines
We estimate that 20 percent of the stationary combustion turbines affected by this proposed rulewill be located at major sources. This estimate is based on an examination by EPA of permit data,which indicated that utility turbines will primarily be installed at greenfield power plants where no othersources of HAP emissions will be present. Greenfield power plants that had a total capacity of morethan the calculated MW were assumed to be major sources, while those that were less were assumed tobe area sources. Industrial turbines were all assumed to go into brownfield sites that were already majorHAP sites. Based on this analysis of permit data, it is expected that twenty percent of new turbines willbe major sources. The EPA also assumed that this percentage applied to existing sources. Since onlyexisting LPC turbines have a MACT requirement, the EPA estimated the number of existing LPCturbines to be about ten percent of the total number of turbines. This amounts to 800 existing LPCturbines, of which twenty percent are major or an estimated 160 LPC turbines that are major. Sincethese 160 turbines are located at major sources, these turbines can be defined as potentially subject to aMACT standard (since all other sources would not be subject to a MACT such as this one). Of these160 turbines, 10 or about six percent are expected to install an oxidation catalyst system to comply withthe emission limitations. This estimate is for the fifth year after promulgation. The calculation thatderives this estimate is in the “Cost Impacts Associated with Stationary Combustion Turbine MACT,” amemo that is in the public docket. As a result, the environmental and energy impacts presented herereflect these estimates.
For new stationary combustion turbines, 771 new turbines are projected to come online by thefifth year after promulgation as shown in Table 4-2; 20 percent or 154 are expected to be at major

15
sources. Ten of these 154 turbines are expected to require installation of an oxidation catalyst to meetthe emission limitations in the rule for new sources. Thus, the percentage of new stationary combustionturbines affected is about 6.5 percent. A breakdown of these 154 turbines shows that 75 new base loadenergy turbines and 24 peak power turbines will be affected in the next five years. For new nonutilityturbines, 56 new units will be affected in the next five years.
Based on the description in the previous two paragraphs, twenty stationary combustion turbineswill have to apply an oxidation catalyst to meet the emission limitations associated with this proposedrule.
Finally, in the fifth year after promulgation, 59 turbines are expected to require performancetesting. This total includes the 31 new turbines (which is 20 percent of 154) that come online that yearand are required to conduct an initial performance test to demonstrate compliance. The EPA alsoestimates that an additional 10 percent of combustion turbines installed prior to the fifth year may berequired to conduct performance testing to demonstrate compliance if the enforcing agency has reasonto believe the turbine is not performing correctly. Therefore, 10 percent of the 123 affected turbinesprojected to be installed in the first four years after promulgation, 10 percent of the 160 affected turbinesthat existed before promulgation, and 31 new turbines will conduct performance testing in the fifth year,which equals 59 (12 + 16 + 31) turbines total. The calculations of these estimates are in “Cost ImpactsAssociated with Stationary Combustion MACT,” a memo that is in the public docket
4.4 HAP and Other Emission Reductions
The proposed rule will reduce total national HAP emissions by an estimated 81 tons/year in the5th year after the standards are promulgated. The emissions reductions achieved by the proposed rulewould be come from the sources that install an oxidation catalyst control system. We estimate thatabout 10 existing lean premix combustion turbines will install oxidation catalyst control to comply withthe standard. In addition, we estimate that about 5 percent of new stationary combustion turbines willinstall oxidation catalyst control to comply with the standards. The other 95 percent of new stationarycombustion turbines will be lean premix, a pollution prevention technology which in most cases doesnot require the use of oxidation catalyst control. The lean premix turbines are currently being installedto meet NOx emission standards. The reduction of HAP emissions for these stationary combustionturbines is difficult to assess because it is a pollution prevention technology and is being installed tomeet NOx limits, not as a result of MACT for stationary combustion turbines. Therefore, as statedpreviously, the HAP emissions reductions obtained by the proposed rule result only from the sourcesthat install an oxidation catalyst control system.
To estimate the baseline HAP emissions and reductions associated with this proposed rule,national HAP emissions in the absence of the proposed rule were calculated using an emission factorfrom the emissions database. We assumed new stationary combustion turbines are operated 8,760 hoursannually. We then assumed a HAP reduction of 95 percent, achieved by using oxidation catalystemission control devices to comply with the emission limitation to reduce CO emissions, and applied

16
this reduction to the baseline HAP emissions to estimate total national HAP emission reduction. Thetotal national HAP emission reduction of 81 tons per year in the fifth year following promulgation is thesum of formaldehyde, acetaldehyde, benzene, and toluene emission reductions.
In addition to HAP emission reductions, the proposed rule will reduce criteria air pollutantemissions, primarily CO emissions, though there will be a very small amount of PM and VOC emissionreductions as well. There are estimated to be 3,800 tons of CO emission reductions associated with thisproposed rule. PM emissions are very low from stationary combustion turbines since virtually all of theaffected turbines burn natural gas or similar gaseous fuels. Very few existing turbines burn oils, and wedo not believe any new affected turbines in the next five years will exclusively use an oil fuel. Anyturbines that are built to use oils are likely to be dual fuel-fired, which means they can operate off of twodifferent types of fuel that are likely to be natural gas and diesel oil. In any event, oxidation catalystcontrol systems will reduce PM emissions by 25 to 50 percent. Oxidation catalyst control systems willreduce VOC emissions as well. The control efficiency depends on the specific compounds. However,we believe that VOC (and hydrocarbon (HC)) emissions from combustion turbines that are not HAP arevery low and we have been unable to quantify emission reductions for these pollutants.
4.5 Energy and Other Impacts from Direct Application of Control Measures
The only energy impact from the direct application of oxidation catalyst control systems is thepressure drop across the oxidation catalyst bed of typically 1 to 1-1/2 inches of water pressure drop. According to information contained in the Gas Turbine World 1999-2000 Handbook (GTWH), a roughrule of thumb for heavy frame turbines, which are the types of turbines which we believe will mostly beinstalled in the next five years, is that every four inches of water pressure outlet loss is equivalent to a0.6 percent heat rate loss resulting in a 0.6 percent power output loss. (Heat rate is a measure of theamount of inlet heat input to a turbine required to produce a certain amount of power. When the turbineheat rate increases, more inlet heat is required to produce the same amount of power resulting in adecrease in the thermal efficiency.)
Vendors state that an oxidation catalyst system can be designed so that the maximum pressuredrop across the control device does not exceed 1.5 inches of water pressure drop including the catalystsystem and housing. Therefore, the heat rate increase is expected to be about 0.15 percent (1/4 x 0.6percent) increase per inch of water pressure drop increase in the turbine outlet. (Other studies by GasTechnology Institute have indicated that this value is 0.105 percent per inch of turbine outlet pressuredrop. However we chose to use the GTWH value for this calculation.) Therefore for a 1.5 inch pressuredrop across an oxidation catalyst system, the power output loss is estimated to be 0.225 percent (1.5 x0.15). This represents the energy impact which is very low.
4.5.1 Water Impacts
Oxidation catalyst systems do not use water or produce water so the water impacts are expectedto be very low.

17
4.5.2 Solid Waste Impacts
Oxidation catalyst are made with precious metals. When the catalyst charge is replaced (aboutevery six years), the old catalyst is usually sent to a catalyst metal processor who reclaims the preciousmetals and the owner/operator gets a reimbursement from the processor. Therefore, because the spentcatalyst is recycled, the solid waste impact is very small.
4.6 Trends in the Electric Utility Industry
Most industry and government forecasts project sizable growth of new electric power generationcapacity in the near future to meet the increase in consumer demand for electricity and the retirement ofaging coal and nuclear units. Experts agree that this new capacity will mainly come from SCCTs andCCCT units fueled by natural gas. Three factors have contributed to recent and projected dominance ofgas combustion turbines to meet the demand for new generation capacity:
� Technology advances in combustion turbines have increased efficiency.
� Lower and less-volatile natural gas prices have increased cost-effectiveness and lowered risk.
� Deregulation of the electric utility industry has opened the market to smaller independentoperators with applications ideally suited for combustion turbines.
Over the next 5 years deregulation of the electric power industry will be the main factorinfluencing the growth of combustion turbines to generate electric power. Deregulation is influencingthe demand for utility combustion turbines in the following ways:
1. Competitive markets for wholesale power are leading to the replacement of less-efficientcoal and nuclear power plants. Because of advances in gas turbine technology, new SCCTsand CCCTs are more economical compared to new oil and coal power plants and less-efficient existing plants.
2. Competitive markets for wholesale power have led to an increased demand for bulktransmission resources. However, economic and political factors continue to limit thegrowth in new transmission corridors. Combustion turbine units that are smaller in size andmore environmentally friendly (compared to coal or nuclear power plants) can be placedthroughout the grid (referred to as distributed generation) to alleviate transmissionconstraints.
3. Deregulation has opened the market to merchant power producers and IPPs. Thesmaller-scale combustion turbine power plants are ideal for these market players who

3Most industry experts agree that (at least in the short run) deregulation will lead to four major regional powermarkets in the U.S. Bulk transmission interfaces between these four regional markets will continue to becapacity strained, implying that electricity prices may continue to vary from region to region. In addition,there will be local metropolitan areas or geographically isolated areas, such as San Francisco, wheretransmission constraints will restrict “perfect” competition. In these areas, small-scale distributedgeneration, such as CCCTs, will be able to command price premiums for electric power.
18
generally serve niche markets where there are capacity shortages or where industrial steamloads are high.3

19
SECTION 5
PROFILES OF AFFECTED INDUSTRIES
This section contains profiles of the major industries affected by the proposed regulation ofstationary combustion turbines. The Agency anticipates that most of the direct costs of the regulationwill be borne by the electric services (NAICS 22111) sector. However, the crude oil and natural gasextraction (NAICS 211) and natural gas pipelines (NAICS 486) sectors will be indirectly affectedthrough changes in industry production and fuel switching. Together, these energy sectors account forabout 90 percent of the existing combustion turbines (greater than 1 MW) identified by the Agency inthe Inventory Database. The remaining combustion turbines are spread across a wide variety ofindustries, most notably chemicals and allied products, petroleum products, health services, and nationalsecurity agencies, and are primarily used for self-generated electricity or co-generated electricity andprocess steam. Direct costs on these industries are expected to be minimal.
The Agency projects that growth in new combustion turbines that will be affected by theproposed regulation will also be concentrated in the electric services, crude oil and natural gasextraction, and natural gas industries. This section contains background information on these threeindustries to help inform the regulatory process.
5.1 Electric Utility Industry (NAICS 22111)
This profile of the U.S. electric power industry provides background information on theevolution of the electricity industry, the composition of a traditional regulated electric utility, the currentmarket structure of the electric industry, and deregulation trends and the potential future marketstructure of the electricity market. This profile also discusses current industry characteristics and trendsthat will influence the future generation and consumption of electricity.
5.1.1 Market Structure of the Electric Power Industry
The ongoing process of deregulation of wholesale and retail electric markets is changing thestructure of the electric power industry. Deregulation is leading to the functional unbundling ofgeneration, transmission, and distribution and to competition in the generation segment of the industry. This section provides background on the current structure of the industry and future deregulation trends. It begins with a brief overview of the evolution of the electric power industry because the future marketstructure will, in large part, be determined by the existing infrastructure and capital assets that haveevolved over the past decades.
20
5.1.1.1 The Evolution of the Electric Power Industry
The electric utility industry began as isolated local service systems with the first electriccompanies evolving in densely populated metropolitan areas like New York and Chicago. Prior toWorld War I, rural electrification was a piecemeal process. Only small, isolated systems existed,typically serving a single town. The first high-voltage transmission network was built in the Chicagoarea in 1911 (the Lake County experiment). This new network connected the smaller systemssurrounding Chicago and resulted in substantial production economies, lower customer prices, andincreased company profits.
In light of the success of the Lake County experiment, the 1910s and 1920s saw increasedconsolidation and rapid growth in electricity usage. During this period, efficiency gains and demandgrowth provided the financing for system expansions. Even though the capacity costs (fixed costs perpeak kW demanded) were typically twice as large with the consolidated/interconnected supply systems,the fixed costs per unit of energy production (kWh) were comparable to those of the old single-citysystem. This was the case because of load factor improvements, which resulted from aggregatingcustomer demand.
Whereas the average fixed cost per customer was relatively unchanged as a result of the movefrom single-city to consolidated supply systems, large savings were realized from decreases in operatingcosts. In particular, fuel costs per kWh decreased 70 percent because of the improved combustionefficiency of larger plants and lower fuel prices for purchases of large quantities. In addition, operationand maintenance costs decreased 85 percent, primarily as a result of decreased labor intensity.
During the 1920s, only a small part of the efficiency gains were passed on to customers in theform of lower prices. Producers retained the bulk of the productivity increases as profits. These profitsprovided the internal capital to finance system expansions and to buy out smaller suppliers. Industryexpansion and consolidation led to the development of large utility holding companies whose assetswere shares of common stock in many different operating utilities.
The speculative fever of the 1920s led to holding companies purchasing one another, creatingfinancial pyramids based on inflated estimates of company assets. With the stock market crash in 1929,shareholders who had realized both real economic profits and speculative gains lost large amounts ofmoney. The financial collapse of the utility holding companies led to new levels of utility regulation.
From the 1930s through the 1960s, the regulated mandate of electric utilities was basicallyunchanged: to provide safe, adequate, and reliable service to all electricity users. The majority of thestate and federal laws regulating utilities in place during this era had been written shortly after theDepression. The laws were primarily designed to prevent “ruinous competition” through costlyduplication of utility functions and to protect customers against exploitation from a monopoly supplier.
During this period, most utilities were vertically integrated, controlling everything fromgeneration to distribution. Economies of scale in generation and the inefficiency of duplicating

21
transmission and distribution systems made the electric utility industry a textbook example of a naturalmonopoly. Electricity was viewed as a homogeneous good from which there were no productunbundling opportunities or unique product offerings on which competition could get a foothold. Inaddition, the industry was extremely capital-intensive, providing a sizable barrier to entry even if themonopoly status of the utilities had not been protected.
From the 1930s to the 1960s, the electric industry experienced almost continuous growth indemand. In addition, there was a steady stream of technological innovations in generation,transmission, and distribution operations. The increased economies of scale, technological advances,and fast demand growth led to steadily declining unit costs. However, in an environment of decreasingunit costs, there were few rate cases and almost no pressure from customers to change the system. Thisperiod is often referred to as the golden era for the electric utility industry.
5.1.1.2 Structure of the Traditional Regulated Utility
The utilities vary substantially in size, type, and function. Figure 5-1 illustrates the typicalstructure of the electric utility market. Even with the technological and regulatory changes in the 1970sand 1980s, at the beginning of the 1990s the structure of the electric utility industry could still becharacterized in terms of generation, transmission, and distribution. Commercial and retail customerswere in essence “captive,” and rates and service quality were primarily determined by public utilitycommissions.

22
The majority of utilities are interconnected and belong to a regional power pool. Poolingarrangements enable facilities to coordinate the economic dispatch of generation facilities and managetransmission congestion. In addition, pooling diverse loads can increase load factors and decrease costsby sharing reserve capacity.
Generation. Coal-fired plants have historically accounted for the bulk of electricity generationin the United States. With abundant national coal reserves and advances in pollution abatement
Large C/ICustomers
Small C/ICustomers
ResidentialCustomers
Transformer
Generation
Electricity
Distribution
High Voltage Lines
Trans-mission
Power Plants
Figure 5-1. Traditional Electric Power Industry Structure

4The electric power supply chain includes all generation, transmission, distribution, administrative, and marketactivities needed to deliver electric power to consumers.
23
technology, such as advanced scrubbers for pulverized coal and flue gas-desulfurization systems, coalwill likely remain the fuel of choice for most existing generating facilities over the near term.
Natural gas accounts for approximately 10 percent of current generation capacity but is expectedto grow; advances in natural gas exploration and extraction technologies and new coal gasification havecontributed to the use of natural gas for power generation.
Nuclear plants and renewable energy sources (e.g., hydroelectric, solar, wind) provideapproximately 20 percent and 10 percent of current generating capacity, respectively. However, thereare no plans for new nuclear facilities to be constructed, and there is little additional growth forecastedin renewable energy.
Transmission. Transmission refers to high voltage lines used to link generators to substationswhere power is stepped down for local distribution. Transmission systems have been traditionallycharacterized as a collection of independently operated networks or grids interconnected by bulktransmission interfaces.
Within a well-defined service territory, the regulated utility has historically had responsibility forall aspects of developing, maintaining, and operating transmissions. These responsibilities included
� system planning and expanding,
� maintaining power quality and stability, and
� responding to failures.
Isolated systems were connected primarily to increase (and lower the cost of) power reliability. Mostutilities maintained sufficient generating capacity to meet customer needs, and bulk transactions wereinitially used only to support extreme demands or equipment outages.
Distribution. Low-voltage distribution systems that deliver electricity to customers compriseintegrated networks of smaller wires and substations that take the higher voltage and step it down tolower levels to match customers’ needs.
The distribution system is the classic example of a natural monopoly because it is not practical tohave more than one set of lines running through neighborhoods or from the curb to the house.
5.1.1.3 Current Electric Power Supply Chain
This section provides background on existing activities and emerging participants in the electricpower supply chain.4 Because the restructuring plans and time tables are made at the state level, theissues of asset ownership and control throughout the current supply chain in the electric power industryvary from state to state. However, the activities conducted throughout the supply chain are generally thesame.

24
Table 5-1 shows costs by utility ownership and by segment of the supply chain. Generationaccounts for approximately 75 percent of the cost of delivered electric power.
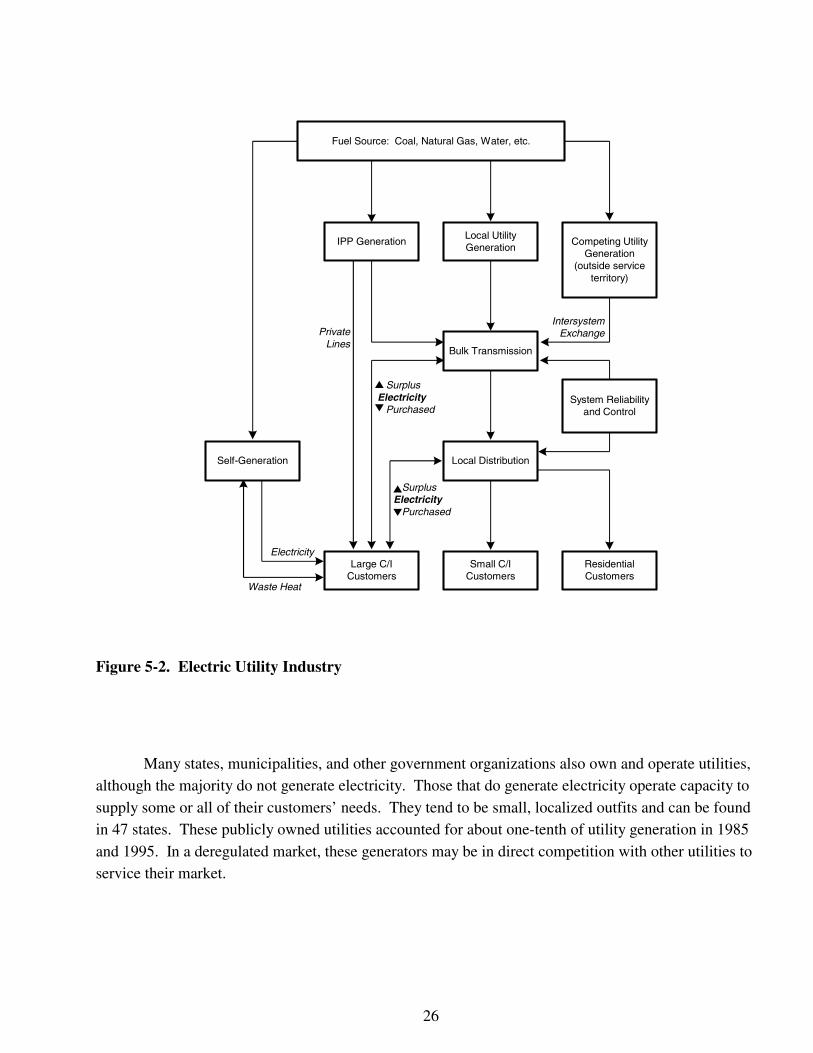
Figure 5-2 provides an overview of the electric power supply chain, highlighting a combinationof activities and service providers. The activities/members of the electric power supply chain aretypically grouped into generation, transmission, and distribution. These three segments are described inthe following sections.
Generation. As part of deregulation, the transmission and distribution of electricity are beingseparated from the business of generating electricity, and a new competitive market in electricitygeneration is evolving. As power generators prepare for the competitive market, the share of electricitygeneration attributed to nonutilities and utilities is shifting.
More than 7,000 electricity suppliers currently operate in the U.S. market. As shown in Table5-2, approximately 42 percent of suppliers are utilities and 58 percent are nonutilities. Utilities includeinvestor-owned, cooperatives, and municipal systems. Of the approximately 3,100 utilities operating inthe United States, only about 700 generate electric power. The majority of utilities distribute electricitythat they have purchased from power generators via their own distribution systems.
Utility and nonutility generators produced a total of 3,369 billion kWh in 1995. Althoughutilities generate the vast majority of electricity produced in the United States, nonutility generators arequickly eroding utilities’ shares of the market. Nonutility generators include private entities thatgenerate power for their own use or to sell to utilities or other end users. Between 1985 and 1995,nonutility generation increased from 98 billion kWh (3.8 percent of total generation) to 374 billion kWh(11.1 percent). Figure 5-3 illustrates this shift in the share of utility and nonutility generation.

25
Utilities. There are four categories of utilities: investor-owned utilities (IOUs), publicly ownedutilities, cooperative utilities, and federal utilities. Of the four, only IOUs always generate electricity.
IOUs are increasingly selling off generation assets to nonutilities or converting those assets intononutilities (Haltmaier, 1998). To prepare for the competitive market, IOUs have been lowering theiroperating costs, merging, and diversifying into nonutility businesses.
In 1995, utilities generated 89 percent of electricity, a decrease from 96 percent in 1985. IOUsgenerate the majority of the electricity produced in the United States. IOUs are either individualcorporations or a holding company, in which a parent company operates one or more utilities integratedwith one another. IOUs account for approximately three-quarters of utility generation, a percentage thatheld constant between 1985 and 1995.
Utilities owned by the federal government accounted for about one-tenth of generation in both1985 and 1995. The federal government operated a small number of large utilities in 1995 that suppliedpower to large industrial consumers or federal installations. The Tennessee Valley Authority is anexample of a federal utility.
Table 5-1. Total Expenditures in 1996 ($103)
UtilityOwnership Generation Transmission Distribution
CustomerAccountsand Sales
Administrationand General
Expenses
Investor-owned
80,891,644 2,216,113 6,124,443 6,204,229 13,820,059
Publiclyowned
12,495,324 840,931 1,017,646 486,195 1,360,111
Federal 3,685,719 327,443 1,435 55,536 443,809
Cooperatives 15,105,404 338,625 1,133,984 564,887 1,257,015
112,178,091 3,723,112 8,277,508 7,310,847 16,880,994
75.6% 2.5% 5.6% 4.9% 11.4%
148,370,552
Sources: U.S. Department of Energy, Energy Information Administration (EIA). 1998a. Financial Statistics of MajorPublicly Owned Electric Utilities, 1997. Washington, DC: U.S. Department of Energy.
U.S. Department of Energy, Energy Information Administration (EIA). 1997. Financial Statistics of Major U.S.Investor-Owned Electric Utilities, 1996. Washington, DC: U.S. Department of Energy.
26
Many states, municipalities, and other government organizations also own and operate utilities,although the majority do not generate electricity. Those that do generate electricity operate capacity tosupply some or all of their customers’ needs. They tend to be small, localized outfits and can be foundin 47 states. These publicly owned utilities accounted for about one-tenth of utility generation in 1985and 1995. In a deregulated market, these generators may be in direct competition with other utilities toservice their market.
Electricity
Waste Heat
IntersystemExchangePrivate
Lines
▲
▼
▲ SurplusElectricity Purchased▼
Fuel Source: Coal, Natural Gas, Water, etc.
SurplusElectricity Purchased
Self-Generation
Large C/ICustomers
Small C/ICustomers
ResidentialCustomers
Local Distribution
System Reliabilityand Control
Bulk Transmission
IPP GenerationLocal UtilityGeneration
Competing UtilityGeneration
(outside serviceterritory)
Figure 5-2. Electric Utility Industry

27
Rural electric cooperatives are the fourth category of utilities. They are formed and owned bygroups of residents in rural areas to supply power to those areas. Cooperatives generally purchase fromother utilities the energy that they sell to customers, but some generate their own power. Cooperativesonly produced 5 percent of utility generation in 1985 and only 6 percent in 1995.
Nonutilities. Nonutilities are private entities that generate power for their own use or to sell toutilities or other establishments. Nonutilities are usually operated at mines and manufacturing facilities,such as chemical plants and paper mills, or are operated by electric and gas service companies (DOE,EIA, 1998b). More than 4,200 nonutilities operate in the United States.
Between 1985 and 1995, nonutility generators increased their share of electricity generationfrom 4 percent to 11 percent (see Figure 5-3). In 1978, the Public Utilities Regulatory Policies Act(PURPA) stipulated that electric utilities must interconnect with and purchase capacity and energyoffered by any qualifying nonutility. In 1996, FERC issued Orders 888 and 889 that openedtransmission access to nonutilities and required utilities to share information about availabletransmission capacity. These moves established wholesale
Table 5-2. Number of Electricity Suppliers in 1999
Electricity Suppliers Number Percent
Utilities 3,124 42%Investor-owned utilities 222Cooperatives 875Municipal systems 1,885Public power districts 73State projects 55Federal agencies 14
Nonutilities 4,247 58%Nonutilities (excluding EWGs) 4,103Exempt wholesale generators 144
Total 7,371 100%
Source: U.S. Department of Energy, Energy Information Administration (EIA). 1999g. The Changing Structure of theElectric Power Industry 1999: Mergers and Other Corporate Combinations. Washington, DC: U.S. Department ofEnergy.

28
a Includes facilities classified in more than one of the following FERC designated categories: cogenerator QF, small power producer QF,or exempt wholesale generator.Cogen = Cogenerator.
EWG = Exempt wholesale generator.Other Non-QF = Nocogenerator Non-QF.QF = Qualifying facility.SPP = Small power producer.Note: Sum of components may not equal total due to independent rounding. Classes for nonutility generation are determined by the
class of each generating unit. Sources: Utility data: U.S. Department of Energy, Energy Information Administration (EIA). 1996b. Electric Power Annual 1995.
Volumes I and II. DOE/EIA-0348(95)/1. Washington, DC: U.S. Department of Energy; Table 8 (and previous issues); 1985nonutility data: Shares of generation estimated by EIA; total generation from Edison Electric Institute (EEI). 1998. StatisticalYearbook of the Electric Utility Industry 1998. November. Washington, DC; 1995 nonutility data: U.S. Department ofEnergy, Energy Information Administration (EIA). 1996b. Electric Power Annual 1995. Volumes I and II. DOE/EIA-0348(95)/1. Washington, DC: U.S. Department of Energy.
Figure 5-3. Utility and Nonutility Generation and Shares by Class, 1988 and 1998

29
competition, spurring nonutilities to increase generation and firms to invest in nonutility generation.
Nonutilities are frequently categorized by their FERC classification and the type of technologythey employ. There are three categories of nonutilities: cogenerators, small power producers (SPPs),and exempt wholesale generators (EWGs).
Cogenerators are nonutilities that sequentially or simultaneously produce electricity and anotherform of energy (such as heat or steam) using the same fuel source. At cogeneration facilities, steam isused to drive a turbine to generate electricity. The waste heat and steam from driving the turbine is thenused as an input in an industrial or commercial process. For a cogenerator to qualify or interconnectwith utilities, it must meet certain ownership, operating, and efficiency criteria specified by FERC. In1985, about 55 percent of nonutility generation was produced by cogenerators that qualified or metFERC’s specifications and sold power to utilities. By 1995 the percentage increased to 67 percent as thepush for deregulation gathered momentum. At the same time, the percentage that was produced bynonqualifying cogenerators decreased from 25 percent to 9 percent.
SPPs typically generate power using renewable resources, such as biomass, solar energy, wind,or water. However, increasingly SPPs include companies that self-generate power using combustionturbines and sell excess power back to the grid. As with cogenerators, SPPs must fulfill a series ofFERC requirements to interconnect with utilities. PURPA revisions enabled nonutility renewableelectricity to grow significantly, and SPPs have responded by improving technologies, decreasing costs,and increasing efficiency and reliability (DOE, EIA, 1998b). Between 1985 and 1995, the percentage ofSPP nonutility generation nearly doubled to 13 percent.
EWGs produce electricity for the wholesale market. Also known as IPPs, EWGs typicallycontract directly with large bulk customers, such as large industrial and commercial facilities andutilities. They do not operate any transmission or distribution facilities but pay tariffs to use facilitiesowned and operated by utilities. Unlike with qualifying cogenerators and SPPs, utilities are not requiredto purchase energy produced by EWGs, but they may do so at market-based prices. EWGs did not existuntil the Energy Policy Act created them in 1992, and by 1995 they generated about 2 percent ofnonutility electricity.
In 1995, about 4 percent of nonutility generation was produced by facilities that were classifiedas any combination of cogenerator, SPP, and EWG. An additional 6 percent was produced by facilitiesthat generate electricity for their own consumption.
Transmission. Whereas the market for electricity generation is moving toward a competitivestructure, the transmission of electricity is currently (and will likely remain) a regulated, monopolyoperation. In areas where power markets are developing, generators pay tariffs to distribute theirelectricity over established lines owned and maintained by independent organizations. Independentservice operators (ISOs) will most likely coordinate transmission operations and generation dispatchover the bulk power system.

30
The bulk power transmission system consists of three large regional networks, which alsoencompass smaller groups. The three networks are geographically defined: the Eastern Interconnect inthe eastern two-thirds of the nation; the Western Interconnect in the western portion; and the TexasInterconnect, which encompasses the majority of Texas. The western and eastern networks are eachfully integrated with Canada. The western is also integrated with Mexico. Within each network, theelectricity producers are connected by extra high-voltage connections that allow them to transferelectrical energy from one part of the network to the other.
The bulk power system makes it possible for electric power producers to engage in wholesaletrade. In 1995, utilities sold 1,283 billion kWh to other utilities. The amount of energy sold bynonutilities has increased dramatically from 40 billion kWh in 1986 to 222 billion kWh in 1995, anaverage annual increase of 21 percent (DOE, EIA, 1996a). Distribution utilities and large industrial andcommercial customers also have the option of purchasing electricity in bulk at market prices from theirlocal utility, a nonutility, or another utility. The process of transmitting electricity between suppliers viaa third party is known as wholesale wheeling.
The wholesale trade for electricity is increasingly handled by power marketers (brokers). Powermarketers act as independent middlemen that buy and sell wholesale electricity at market prices (EEI,1999). Customers include large commercial and industrial facilities in addition to utilities. Powermarketers emerged in response to increased competition. Brokers do not own generation facilities,transmissions systems, or distribution assets, but they may be affiliated with a holding company thatoperates generation facilities. Currently, 570 power marketers operate in the United States. The amountof power sold by marketers increased from 3 million MWh to 2.3 billion MWh between 1995 and 1998. This is the equivalent of going from powering 1 million homes to powering 240 million homes (EEI,1999). Table 5-3 lists the top ten power marketers by sales for the first quarter of 1999.

31
Distribution. The local distribution system for electricity is expected to remain a regulatedmonopoly operation. But power producers will soon be able to compete for retail customers by payingtariffs to entities that distribute the power. Utilities may designate an ISO to operate the distributionsystem or continue to operate it themselves. If the utility operates its own system, it is required by lawto charge the same tariff to other power producers that it charges producers within its own corporateumbrella. The sale of electricity by a utility or other supplier to a customer in another utility’s retailservice territory is known as retail wheeling.
Supporters of retail wheeling claim that it will help lower the average price paid for electricity. The states with the highest average prices for electricity are expected to be the first to permit retailwheeling; wholesale wheeling is already permitted nationwide. In 1996, California, New England, andthe Mid-Atlantic States had the highest average prices for electricity, paying 3 cents or more perkilowatt-hour than the national average of 6.9 cents (DOE, EIA, 1998b). Open access to the electricitysupply, coupled with a proliferation of electricity suppliers, should combine to create falling electricityprices and increasing usage. By 2002, the nationwide average price for electricity is projected to be11 percent lower than in 1995, an average annual decline of roughly 2 percent (Haltmaier, 1998).
The explosion in computer and other information technology usage in the commercial sector isexpected to offset energy efficiency gains in the residential and industrial sectors and lead to a netincrease in the demand for electricity. Retail wheeling has the potential to allow customers to lowertheir costs per kilowatt-hour by purchasing electricity from suppliers that best fit their usage profiles.
Table 5-3. Top Power Marketing Companies, First Quarter 1999
Company Total MWh Sold
Enron Power Marketing, Inc. 78,002,931
Southern Company Energy Marketing, L.P. 38,367,107
Aquila Power Corp. 29,083,612
PG&E Energy Trading-Power, L.P. 28,463,487
Duke Energy Trading & Marketing, L.L.C. 22,276,608
LG&E Energy Marketing, Inc. 15,468,749
Entergy Power Marketing Corp. 12,670,520
PacifiCorp Power Marketing, Inc. 11,800,263
Tractebel Energy Marketing, Inc. 10,041,039
NorAm Energy Services, Inc. 9,817,306
Source: Resource Data International. 1999. “PMA Online Top 25 Power Marketer Rankings.” Power Marketers OnlineMagazine. <http://www.powermarketers.com/top25a.htm.> As obtained on August 11, 1999.

32
Large commercial and industrial customers engaged in self-generation or cogeneration will also be ableto sell surplus electricity in the wholesale market.
5.1.1.4 Overview of Deregulation and the Potential Future Structure of the Electricity Market
Beginning in the latter part of the 19th century and continuing for about 100 years, the prevailingview of policymakers and the public was that the government should use its power to require orprescribe the economic behavior of “natural monopolies” such as electric utilities. The traditionalargument is that it does not make economic sense for there to be more than one supplier—running twosets of wires from generating facilities to end users is more costly than one set. However, sincemonopoly supply is not generally regarded as likely to provide a socially optimal allocation ofresources, regulation of rates and other economic variables was seen as a necessary feature of thesystem.
Beginning in the 1970s, the public policy view shifted against traditional regulatory approachesand in favor of deregulation for many important industries including transportation, communications,finance, and energy. The major drivers for deregulation of electric power included the following:
� existence of rate differentials across regions offering the promise of benefits from moreefficient use of existing generation resources if the power can be transmitted across largergeographic areas than was typical in the era of industry regulation;
� the erosion of economies of scale in generation with advances in combustion turbinetechnology;
� complexity of providing a regulated industry with the incentives to make socially efficientinvestment choices;
� difficulty of providing a responsive regulatory process that can quickly adjust rates andconditions of service in response to changing technological and market conditions; and
� complexity of monitoring utilities’ cost of service and establishing cost-based rates forvarious customer classes that promote economic efficiency while at the same time addressingequity concerns of regulatory commissions.
Viewed from one perspective, not much changes in the electric industry with restructuring. Thesame functions are being performed, essentially the same resources are being used, and in a broad sensethe same reliability criteria are being met. In other ways, the very nature of restructuring, the harnessingof competitive forces to perform a previously regulated function, changes almost everything. Eachprovider and each function become separate competitive entities that must be judged on their own.
This move to market-based provision of generation services is not matched on the transmissionand distribution side. Network interactions on AC transmission systems have made it impossible tohave separate transmission paths compete. Hence, transmission and distribution remain regulated. Transmission and generation heavily interact, however, and transmission congestion can preventspecific generation from getting to market. Transmission expansion planning becomes an open process
5Nonutility power producers have approximately 10 percent of the capacity of utility power producers.
33
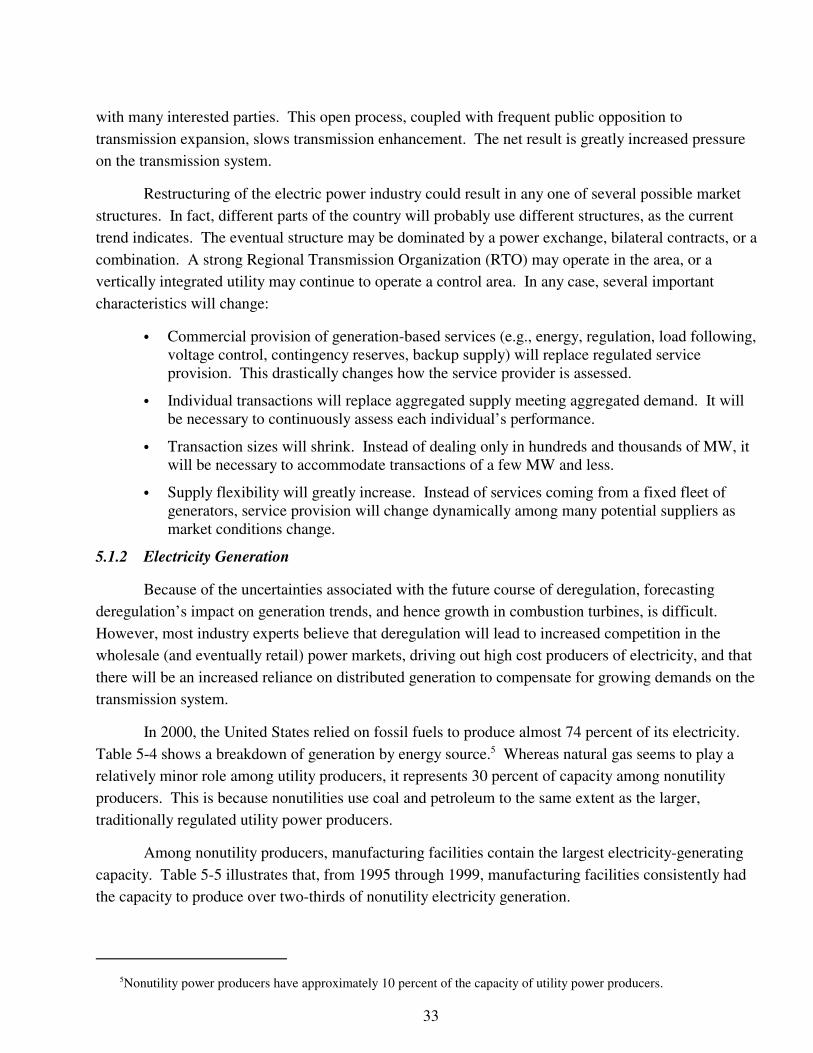
with many interested parties. This open process, coupled with frequent public opposition totransmission expansion, slows transmission enhancement. The net result is greatly increased pressureon the transmission system.
Restructuring of the electric power industry could result in any one of several possible marketstructures. In fact, different parts of the country will probably use different structures, as the currenttrend indicates. The eventual structure may be dominated by a power exchange, bilateral contracts, or acombination. A strong Regional Transmission Organization (RTO) may operate in the area, or avertically integrated utility may continue to operate a control area. In any case, several importantcharacteristics will change:
� Commercial provision of generation-based services (e.g., energy, regulation, load following,voltage control, contingency reserves, backup supply) will replace regulated serviceprovision. This drastically changes how the service provider is assessed.
� Individual transactions will replace aggregated supply meeting aggregated demand. It willbe necessary to continuously assess each individual’s performance.
� Transaction sizes will shrink. Instead of dealing only in hundreds and thousands of MW, itwill be necessary to accommodate transactions of a few MW and less.
� Supply flexibility will greatly increase. Instead of services coming from a fixed fleet ofgenerators, service provision will change dynamically among many potential suppliers asmarket conditions change.
5.1.2 Electricity Generation
Because of the uncertainties associated with the future course of deregulation, forecastingderegulation’s impact on generation trends, and hence growth in combustion turbines, is difficult. However, most industry experts believe that deregulation will lead to increased competition in thewholesale (and eventually retail) power markets, driving out high cost producers of electricity, and thatthere will be an increased reliance on distributed generation to compensate for growing demands on thetransmission system.
In 2000, the United States relied on fossil fuels to produce almost 74 percent of its electricity. Table 5-4 shows a breakdown of generation by energy source.5 Whereas natural gas seems to play arelatively minor role among utility producers, it represents 30 percent of capacity among nonutilityproducers. This is because nonutilities use coal and petroleum to the same extent as the larger,traditionally regulated utility power producers.
Among nonutility producers, manufacturing facilities contain the largest electricity-generatingcapacity. Table 5-5 illustrates that, from 1995 through 1999, manufacturing facilities consistently hadthe capacity to produce over two-thirds of nonutility electricity generation.

34
In 1997 cogenerators produced energy totaling 146 billion kWh for their own use. Cogeneratorsare expected to continue to increase their generation capabilities at a slightly slower rate than utilities.
Table 5-6 further disaggregates capacity by prime mover and energy source at electric utilities. As the table shows, hydroelectric and steam are the two prime movers with the most units, while steamand nuclear generators have the greatest total capacity. Combustion turbines’ (including the secondstage of CCCTs) generation represents approximately 10 percent of total U.S. capacity.

35
Table 5-4. Industry Capability by Energy Source, 2000
Energy SourceUtility Generators
(MW)Nonutility Generators
(MW) Total (MW)
Fossil fuels 424,218 173,320 597,538
Coal 259,059 56,190 315,249
Natural gas 38,964 58,668 97,632
Petroleum 26,250 13,003 39,253
Duel-fired 99,945 45,549 145,494
Nuclear 85,519 12,038 97,557
Hydroelectric 91,590 7,478 99,068
Renewable/other 1,050 16,322 17,372
Total 602,377 209,248 811,625
Sources: U.S. Department of Energy, Energy Information Administration. 2000. Electric Power Annual, 1999, Vol. 2. DOE/EIA-0348(99)/2. Washington, DC: U.S. Department of Energy.
Table 5-5. Installed Capacity at U.S. Nonutility Attributed to Major Industry Groups and CensusDivision, 1995 through 1999 (MW)
Year ManufacturingTransportation
and Public Utilities Services MiningPublic
Administration
OtherIndustryGroups Total
1995 47,606 15,124a 2,165 3,428 544 1,388a 70,254
1996 49,529 16,050 2,181 3,313 542 1,575 73,189
1997 49,791 16,559 2,223 3,306 616 1,510 74,004
1998 51,255 24,527 2,506 3,275 534 15,989 98,085
1999 52,430 78,419 2,342 5,123 536 28,506 167,357
a Revised data.
Notes: All data are for 1 MW and greater. Data for 1997 are preliminary; data for prior years are final. Totals may notequal sum of components because of independent rounding.
Source: U.S. Department of Energy, Energy Information Administration (EIA). 2000. Electric Power Annual 1999, VolumeII. Washington, DC: U.S. Department of Energy.

36
Table 5-6. Existing Capacity at U.S. Electric Utilities by Prime Mover and Energy Source, as ofJanuary 1, 1998
Prime Mover Energy Source Number of Units Generator Nameplate Capacity (MW)
U.S. Total 10,421 754,925Steam 2,117 469,210
Coal only 911 276,895Other solidsa 15 334Petroleum only 137 22,476Gas only 117 10,840Other solids/coala 1 2Solids/petroleumb 72 10,796Solids/gasb 232 36,763Solids/petroleum/gasb 1 558Petroleum/gas 624 110,324
Internal Combustion 2,892 5,075Petroleum only 1,799 2,671Gas only 48 66Petroleum/gas 1,044 2,335Other solids onlya 1 3
Combustion Turbine 1,549 63,131Petroleum only 625 22,802Gas only 179 5,776Petroleum/gas 745 34,554
Second Stage of CCCTs 202 16,224Petroleum only 11 470Gas only 29 2,331Coal/petroleum 1 326Coal/gas 1 113Petroleum/gas 100 8,852Waste heat 60 4,130
Nuclear 107 107,632Hydroelectric (conventional) 3,352 73,202Hydroelectric (pumped storage) 141 18,669Geothermal 27 1,746Solar 11 5Wind 19 14
a Includes wood, wood waste, and nonwood waste.b Includes coal, wood, wood waste, and nonwood waste.
Source: U.S. Department of Energy, Energy Information Administration (EIA). 1999c. Electric Power Annual 1998. Volumes I and II. Washington, DC: U.S. Department of Energy.

37
5.1.2.1 Growth in Generation Capacity
The electric industry is continuing to grow and change. Throughout the country, electric utilitycapacity additions are slightly outpacing capacity retirements. The trend goes beyond an increasingcapacity but also shows that coal units are slowly being replaced by newer, more efficient methods ofproducing energy. In 1997, 71 electric utility units were closed, decreasing capacity by 2,127 MW. Ofthose, six were coal facilities and 43 were petroleum facilities. However, of the 62 facility additions(2,918 MW), none were coal powered, while 24 use petroleum. Gas installations slightly outpacedpetroleum ones, totaling 25 new units at electric utilities in 1997. Table 5-7 outlines capacity additionsand retirements at U.S. electric utilities by energy source.
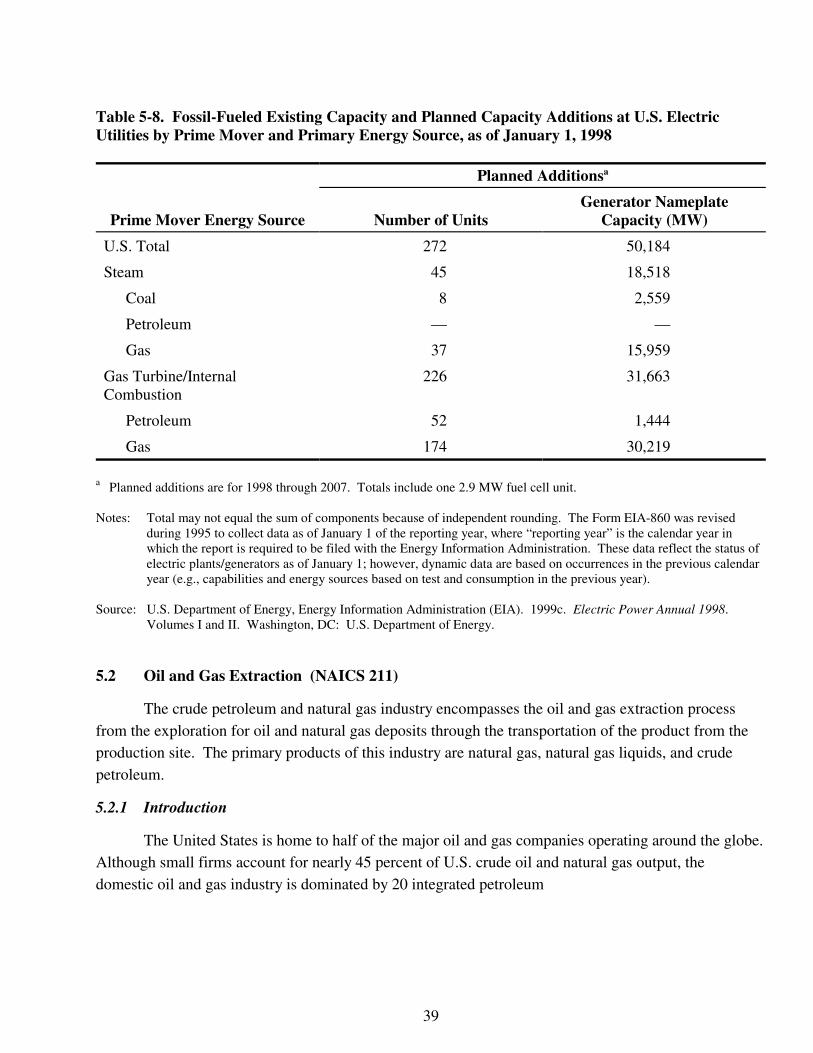
Planned additions indicate a strong trend towards gas-powered turbine/stationary combustionunits. Three-quarters of the gas turbine/stationary combustion units are expected to be gas-poweredwith the remaining quarter petroleum-powered. Based on 1998 planned additions, it is likely that alladditional petroleum-fueled units in the near future will be gas turbine/stationary combustion units, notsteam. Table 5-8 shows planned capacity additions by prime mover and energy source.
5.1.3 Electricity Consumption
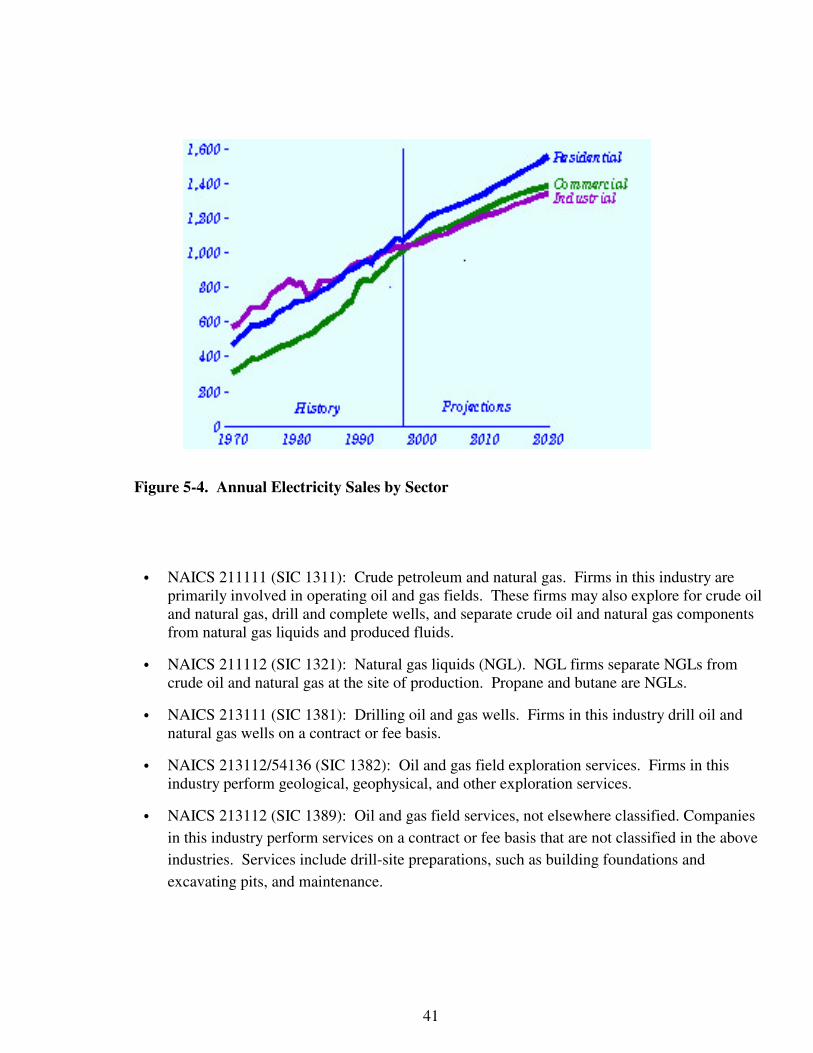
This section analyzes the growth projections for electricity consumption as well as the priceelasticity of demand for electricity. Growth in electricity consumption has traditionally paralleled GDPgrowth. However, improved energy efficiency of electrical equipment, such as high-efficiency motors,has slowed demand growth over the past few decades. The magnitude of the relationship has beendecreasing over time, from growth of 7 percent per year in the 1960s down to 1 percent in the 1980s. As a result, determining what the future growth will be is difficult, although it is expected to be positive(DOE, EIA, 1999a). Table 5-9 shows consumption by sector of the economy over the past 10 years. The table shows that since 1989 electricity sales have increased at least 10 percent in all four sectors. The commercial sector has experienced the largest increase, followed by residential consumption.
In the future, residential demand is expected to be at the forefront of increased electricityconsumption. Between 1997 and 2020, residential demand is expected to increase at 1.6 percentannually. Commercial growth in demand is expected to be approximately 1.4 percent, while industry isexpected to increase demand by 1.1 percent (DOE, EIA, 1999a).

38
Figure 5-4 shows the annual electricity sales by sector from 1970 with projections through 2020.
The literature suggests that electricity consumption is relatively price inelastic. Consumers aregenerally unable or unwilling to forego a large amount of consumption as the price increases. Numerous studies have investigated the short-run elasticity of demand for electricity. Overall, thestudies suggest that, for a 1 percent increase in the price of electricity, demand will decrease by 0.15percent. However, as Table 5-10 shows, elasticities vary greatly, depending on the demandcharacteristics of end users and the price structure. Demand elasticities are estimated to range from a–0.05 percent elasticity of demand for a “flat rates” case (i.e., no time-of-use assumption) up to a –0.50percent demand elasticity for a “high consumer response” case (DOE, EIA, 1999b).
Table 5-7. Capacity Additions and Retirements at U.S. Electric Utilities by Energy Source, 1997
Primary Energy Source
Additions Retirements
Number ofUnits
GeneratorNameplate
Capacity (MW)Number of
Units
GeneratorNameplate
Capacity (MW)
U.S. total 62 2,918 71 2127
Coal — — 6 281
Petroleum 24 199 43 445
Gas 25 2,475 18 405
Water (pumped storagehydroelectric)
— — — —
Nuclear — — 2 995
Waste heat 3 171 — —
Renewablea 10 73 2 1
a Includes conventional hydroelectric; geothermal; biomass (wood, wood waste, nonwood waste); solar; and wind.Note: Total may not equal the sum of components because of independent rounding.
Source: U.S. Department of Energy, Energy Information Administration (EIA). 1999c. Electric Power Annual 1998. Volumes I and II. Washington, DC: U.S. Department of Energy.
39
5.2 Oil and Gas Extraction (NAICS 211)
The crude petroleum and natural gas industry encompasses the oil and gas extraction processfrom the exploration for oil and natural gas deposits through the transportation of the product from theproduction site. The primary products of this industry are natural gas, natural gas liquids, and crudepetroleum.
5.2.1 Introduction
The United States is home to half of the major oil and gas companies operating around the globe. Although small firms account for nearly 45 percent of U.S. crude oil and natural gas output, thedomestic oil and gas industry is dominated by 20 integrated petroleum
Table 5-8. Fossil-Fueled Existing Capacity and Planned Capacity Additions at U.S. ElectricUtilities by Prime Mover and Primary Energy Source, as of January 1, 1998
Planned Additionsa
Prime Mover Energy Source Number of UnitsGenerator Nameplate
Capacity (MW)
U.S. Total 272 50,184
Steam 45 18,518
Coal 8 2,559
Petroleum — —
Gas 37 15,959
Gas Turbine/InternalCombustion
226 31,663
Petroleum 52 1,444
Gas 174 30,219
a Planned additions are for 1998 through 2007. Totals include one 2.9 MW fuel cell unit.
Notes: Total may not equal the sum of components because of independent rounding. The Form EIA-860 was revisedduring 1995 to collect data as of January 1 of the reporting year, where “reporting year” is the calendar year inwhich the report is required to be filed with the Energy Information Administration. These data reflect the status ofelectric plants/generators as of January 1; however, dynamic data are based on occurrences in the previous calendaryear (e.g., capabilities and energy sources based on test and consumption in the previous year).
Source: U.S. Department of Energy, Energy Information Administration (EIA). 1999c. Electric Power Annual 1998. Volumes I and II. Washington, DC: U.S. Department of Energy.

40
and natural gas refiners and producers, such as Exxon Mobil, BP Amoco, and Chevron (Lillis, 1998). Despite the presence of many large global players, the industry experiences a more turbulent businesscycle than most other major U.S. industries. Because the industry imports 60 percent of the crude oilused as an input into refineries, it is susceptible to fluctuations in crude oil output and prices, which arestrongly influenced by the Organization of Petroleum Exporting Countries (OPEC). OPEC is a cartelconsisting of most of the world’s largest petroleum-producing countries that acts to increase the profitsof member countries. In contrast, natural gas markets in the United States are competitive and relativelystable. Most natural gas used in the United States comes from domestic and Canadian sources.
NAICS 211 includes five major industry groups (see Table 5-11):
Table 5-9. U.S. Electric Utility Retail Sales of Electricity by Sector, 1989 Through July 1999(Million kWh)
Period Residential Commercial Industrial Othera All Sectors1989 905,525 725,861 925,659 89,765 2,646,8091990 924,019 751,027 945,522 91,988 2,712,5551991 955,417 765,664 946,583 94,339 2,762,0031992 935,939 761,271 972,714 93,442 2,763,3651993 994,781 794,573 977,164 94,944 2,861,4621994 1,008,482 820,269 1,007,981 97,830 2,934,5631995 1,042,501 862,685 1,012,693 95,407 3,013,2871996 1,082,491 887,425 1,030,356 97,539 3,097,8101997 1,075,767 928,440 1,032,653 102,901 3,139,7611998 1,124,004 948,904 1,047,346 99,868 3,220,121Percentagechange1989-1998
19% 24% 12% 10% 18%
a Includes public street and highway lighting, other sales to public authorities, sales to railroads and railways, andinterdepartmental sales.
Sources: U.S. Department of Energy, Energy Information Administration (EIA). 1999c. Electric Power Annual1998. Volumes I and II. Washington, DC: U.S. Department of Energy.
U.S. Department of Energy, Energy Information Administration (EIA). 1996b. Electric Power Annual 1995. Volumes I and II. Washington, DC: U.S. Department of Energy.
41
� NAICS 211111 (SIC 1311): Crude petroleum and natural gas. Firms in this industry areprimarily involved in operating oil and gas fields. These firms may also explore for crude oiland natural gas, drill and complete wells, and separate crude oil and natural gas componentsfrom natural gas liquids and produced fluids.
� NAICS 211112 (SIC 1321): Natural gas liquids (NGL). NGL firms separate NGLs fromcrude oil and natural gas at the site of production. Propane and butane are NGLs.
� NAICS 213111 (SIC 1381): Drilling oil and gas wells. Firms in this industry drill oil andnatural gas wells on a contract or fee basis.
� NAICS 213112/54136 (SIC 1382): Oil and gas field exploration services. Firms in thisindustry perform geological, geophysical, and other exploration services.
� NAICS 213112 (SIC 1389): Oil and gas field services, not elsewhere classified. Companiesin this industry perform services on a contract or fee basis that are not classified in the aboveindustries. Services include drill-site preparations, such as building foundations andexcavating pits, and maintenance.
Figure 5-4. Annual Electricity Sales by Sector

42
Table 5-10. Key Parameters in the Cases
Case Name
Key Assumptions
Cost Reductionand EfficiencyImprovements
Short-RunElasticity
of Demand (Percent) Natural Gas Prices Capacity Additions
AEO97 Reference Case AEO97 Reference Case — AEO97 ReferenceCase
As neededto meet demand
No Competition No change from 1995 — AEO97 ReferenceCase
As neededto meet demand
Flat Rates (no time-of-use rates)
AEO97 Reference Case -0.05 AEO97 ReferenceCase
As neededto meet demand
Moderate ConsumerResponse
AEO97 Reference Case -0.15 AEO97 ReferenceCase
As neededto meet demand
High Consumer Response AEO97 Reference Case -0.50 AEO97 ReferenceCase
As neededto meet demand
High Efficiency Increased cost savingsand efficiencies
-0.15 AEO97 ReferenceCase
As neededto meet demand
No Capacity Additions AEO97 Reference Case -0.15 AEO97 Low Oil andGas Supply
Technology Case
Not allowed
High Gas Price AEO97 Reference Case -0.15 AEO97 High Oil andGas Supply
Technology Case
As neededto meet demand
Low Gas Price AEO97 Reference Case -0.15 AEO97 ReferenceCase
As neededto meet demand
High Value of Reliability AEO97 Reference Case -0.15 AEO97 ReferenceCase
As neededto meet demand
Half O&M AEO97 Reference Case -0.15 AEO97 ReferenceCase
As neededto meet demand
Intense Competition AEO97 Reference Case -0.15 AEO97 ReferenceCase
As needed to meetdemand
— = not applicable.
Source: U.S. Department of Energy, Energy Information Administration, Office of Integrated Analysis and Forecasting. “Competitive Electricity Price Projections.” <http://www.eia.doe.gov/oiaf/elepri97/chap3.html>. As obtained onNovember 15, 1999b.

43
In 1997, more than 6,800 crude oil and natural gas extraction companies (NAICS 211111)generated $75 billion in revenues. Revenues for 1997 were approximately 5 percent higher thanrevenues in 1992, although the number of companies and employees declined 11.5 and 42.5 percent,respectively.
Table 5-12 shows the NGL extraction industry (NAICS 211112) experienced a decline in thenumber of companies, establishments, and employees. The industry’s revenues declined nearly8.0 percent between 1992 and 1997, from $27 billion per year to $24.8 billion per year.
Revenues for NAICS 213111, drilling oil and gas wells, more than doubled between 1992 and1997. In 1992, the industry employed 47,700 employees at 1,698 companies and generated $3.6 billionin annual revenues. By the end of 1997, the industry’s annual revenues were $7.3 billion, a 106 percentimprovement. Although the total number of companies and establishments decreased from 1992 levels,industry employment increased 13 percent to 53,865.
The recent transition from the SIC system to the North American Industrial ClassificationSystem (NAICS) changed how some industries are organized for information collection purposes andthus how certain economic census data are aggregated. Some SIC codes were combined, others wereseparated, and some activities were classified under one NAICS code and the remaining activitiesclassified under another. The oil and gas field services industry is an example of an industry code thatwas reclassified. Under NAICS, SIC 1382, Oil and Gas Exploration Services, and SIC 1389, Oil andGas Services Not Elsewhere Classified, were combined. The geophysical surveying and mappingservices portion of SIC
Table 5-11. Crude Petroleum and Natural Gas Industries Likely to Be Affected by the Regulation
SIC NAICS Description
1311 211111 Crude Petroleum and Natural Gas
1321 211112 Natural Gas Liquids
1381 213111 Drilling Oil and Gas Wells
1382 213112 Oil and Gas Exploration Services
54136 Geophysical Surveying and Mapping Services
1389 213112 Oil and Gas Field Services, N.E.C.

44
1382 was reclassified and grouped into NAICS 54136. The adjustments to SIC 1382/89 have madecomparison between the 1992 and 1997 economic censes difficult at this time. The U.S. Census Bureauhas yet to publish a comparison report. Thus, for this industry only 1997 census data are presented. Forthat year, nearly 6,400 companies operated under SIC 1382/89 (NAICS 213112), employing more than100,000 people and generating $11.5 billion in revenues.
5.2.2 Supply Side
Characterizing the supply side of the industry involves describing the production processes, thetypes of output, major by-products, costs of production, and capacity utilization.
5.2.2.1 Production Processes
There are four major processes in the oil and gas extraction industry: exploration, welldevelopment, production, and site abandonment (EPA, 1999b). Exploration is the search for rock
Table 5-12. Summary Statistics, Crude Oil and Natural Gas Extraction and Related Industries
NAICS IndustryNumber ofCompanies
Number ofEstablishments
Revenues($1997 103) Employees
211111 Crude Oil and NaturalGas Extraction
1992 7,688 9,391 71,622,600 174,300
1997 6,802 7,781 75,162,580 100,308
211112 Natural Gas LiquidExtraction
1992 108 591 26,979,200 12,000
1997 89 529 24,828,503 10,549
213111 Drilling Oil and GasWells
1992 1,698 2,125 3,552,707 47,700
1997 1,371 1,638 7,317,963 53,865
213112 Oil and Gas FieldServices
1997 6,385 7,068 11,547,563 106,339
Sources: U.S. Department of Commerce, Bureau of the Census. 1999a. 1997 Economic Census, Mining IndustrySeries: Crude Petroleum and Natural Gas Extraction. EC97N-2111A. Washington, DC: U.S. Departmentof Commerce.
U.S. Department of Commerce, Bureau of the Census. 1995a. 1992 Census of Mineral Industries, Industry Series: Crude Petroleum and Natural Gas. MIC92-I-13A. Washington, DC: U.S. Department of Commerce.

45
formations associated with oil and/or natural gas deposits. Nearly all oil and natural gas deposits arelocated in sedimentary rock. Certain geological clues, such as porous rock with an overlying layer oflow-permeability rock, help guide exploration companies to a possible source of hydrocarbons. Whileexploring a potential site, the firm conducts geophysical prospecting and exploratory drilling.
After an economically viable field is located, the well development process begins. Well holes,or well bores, are drilled to a depth of between 1,000 and 30,000 feet, with an average depth of about5,500 feet (EPA, 1999b). The drilling procedure is the same for both onshore and offshore sites. Asteel or diamond drill bit, which may be anywhere between 4 inches and 3 feet in diameter, is used tochip off rock to increase the depth of the hole. The drill bit is connected to the rock by several pieces ofhardened pipe known collectively as the drill string. As the hole is drilled, casing is placed in the wellto stabilize the hole and prevent caving. Drilling fluid is pumped down through the center of the drillstring to lubricate the equipment. The fluid returns to the surface through the space between the drillstring and the rock formation or casing. Once the well has been drilled, rigging, derricks, and otherproduction equipment are installed. Onshore fields are equipped with a pad and roads; ships, floatingstructures, or a fixed platform are procured for offshore fields.
Production is the process of extracting hydrocarbons through the well and separating saleablecomponents from water and silt. Oil and natural gas are naturally occurring co-products, and mostproduction sites handle crude oil and gas from more than one well. Once the hydrocarbons are broughtto the surface, they are separated into a spectrum of substances, including liquid hydrocarbons, gas, andwater and other nonsaleable constituents. After being extracted, crude oil is always delivered to arefinery for processing; natural gas may be processed at the field or at a natural gas processing plant toremove impurities. Natural gas is separated from crude oil by passing the hydrocarbons through one ortwo decreasing pressure chambers. Excess water is removed from the crude oil, at which point the oil isabout 98 percent pure, a purity sufficient for storage or transport to a refinery (EPA, 1999b). Excesswater is returned to the well to facilitate the production process, but silt is discarded. If enough naturalpressure does not exist in the reservoir to force the hydrocarbons through the well, then the reservoir ispressurized using pumps or excess water to lift the hydrocarbons.
Natural gas is conditioned using a dehydration and a sweetening process, which removeshydrogen sulfide and carbon dioxide, so that it is of high enough quality to pass through transmissionsystems. The gas may be conditioned at the field or at one of the 623 operating gas-processing facilitieslocated in gas-producing states, such as Texas, Louisiana, Oklahoma, and Wyoming. These plants alsoproduce the nation’s NGLs, propane and butane (NGSA et al., 2000c).
Site abandonment occurs when a site lacks the potential to produce economic quantities ofnatural gas or when a production well is no longer economically viable. The well(s) are plugged usinglong cement plugs and steel plated caps, and supporting production equipment is disassembled andmoved offsite.

46
5.2.2.2 Types of Output
The oil and gas industry’s principal products are crude oil, natural gas, and NGLs (see Tables 5-13 and 5-14). Refineries process crude oil into several petroleum products. These products includemotor gasoline (40 percent of crude oil); diesel and home heating oil (20 percent); jet fuels (10 percent);waxes, asphalts, and other nonfuel products (5 percent); feedstocks for the petrochemical industry(3 percent); and other lesser products (DOE, EIA, 1999d).
Natural gas is produced from either oil wells (known as “associated gas”) or wells that aredrilled for the primary purpose of obtaining natural gas (known as “nonassociated gas”) (see Table 5-14). Methane is the predominant component of natural gas (about 85 percent), but ethane (about10 percent), propane, and butane are also significant components (see Table 5-13). Propane and butane,the heavier components of natural gas, exist as liquids when cooled and compressed. These latter twocomponents are usually separated and processed as NGLs (EPA, 1999b).
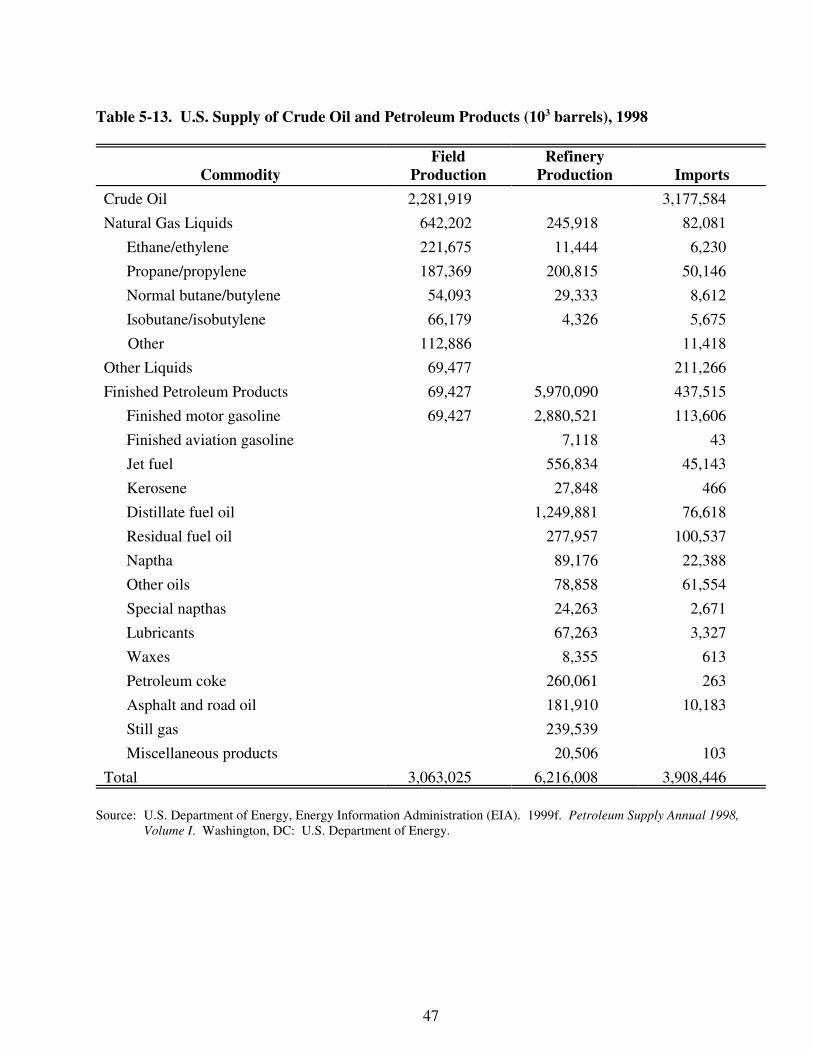
47
Table 5-13. U.S. Supply of Crude Oil and Petroleum Products (103 barrels), 1998
CommodityField
ProductionRefinery
Production Imports
Crude Oil 2,281,919 3,177,584
Natural Gas Liquids 642,202 245,918 82,081
Ethane/ethylene 221,675 11,444 6,230
Propane/propylene 187,369 200,815 50,146
Normal butane/butylene 54,093 29,333 8,612
Isobutane/isobutylene 66,179 4,326 5,675
Other 112,886 11,418
Other Liquids 69,477 211,266
Finished Petroleum Products 69,427 5,970,090 437,515
Finished motor gasoline 69,427 2,880,521 113,606
Finished aviation gasoline 7,118 43
Jet fuel 556,834 45,143
Kerosene 27,848 466
Distillate fuel oil 1,249,881 76,618
Residual fuel oil 277,957 100,537
Naptha 89,176 22,388
Other oils 78,858 61,554
Special napthas 24,263 2,671
Lubricants 67,263 3,327
Waxes 8,355 613
Petroleum coke 260,061 263
Asphalt and road oil 181,910 10,183
Still gas 239,539
Miscellaneous products 20,506 103
Total 3,063,025 6,216,008 3,908,446
Source: U.S. Department of Energy, Energy Information Administration (EIA). 1999f. Petroleum Supply Annual 1998,Volume I. Washington, DC: U.S. Department of Energy.

48
5.2.2.3 Major By-products
The engines that provide pumping action at wells and push crude oil and natural gas throughpipes to processing plants, refineries, and storage locations produce HAPs. HAPs produced in enginesinclude formaldehyde, acetaldehyde, acrolein, and methanol.
5.2.2.4 Costs of Production
The 42 percent decrease in the number of people employed by the crude oil and natural gasextraction industry between 1992 and 1997 was matched by a corresponding 40 percent decrease in theindustry’s annual payroll (see Table 5-15). During the same period, industry outlays for supplies, suchas equipment and other supplies, increased over 32 percent, and capital expenditures nearly doubled. Automation, mergers, and corporate downsizing have made this industry less labor-intensive (Lillis,1998).
Unlike the crude oil and gas extraction industry, the NGL extraction industry’s payroll increasedover 6 percent even though total industry employment declined 12 percent. The industry’s expenditureson capital projects, such as investments in fields, production facilities, and other investments, increased11.4 percent between 1992 and 1997. The cost of supplies did, however, decrease 13 percent from$23.3 billion in 1992 to $20.3 billion in 1997.
Employment increased in Drilling Oil and Gas Wells. In 1992, the industry employed 47,700people, increasing 13 percent to 53,865 in 1997. During a period where industry revenues increasedover 100 percent, the industry’s payroll increased 41 percent and the cost of supplies increased182 percent.
Table 5-14. U.S. Natural Gas Production, 1998
Gross Withdrawls Production (106 cubic feet)
From gas wells 17,558,621
From oil wells 6,365,612
Less losses and repressuring 5,216,477
Total 18,707,756
Source: U.S. Department of Energy, Energy Information Administration (EIA). 1999e. Natural Gas Annual 1998. Washington, DC: U.S. Department of Energy.

49
5.2.2.5 Capacity Utilization
U.S. annual oil and gas production is a small percentage of total U.S. reserves. In 1998, oilproducers extracted approximately 1.5 percent of the nation’s proven crude oil reserves (see Table 5-16). A slightly lesser percentage of natural gas was extracted (1.4 percent), and an even smallerpercentage of NGLs was extracted (0.9 percent). The
Table 5-15. Costs of Production, Crude Oil and Natural Gas Extraction and Related Industries
NAICS Industry EmployeesPayroll
($1997 103)
Cost of Supplies Used,Purchased MachineryInstalled, Etc. ($1997
103)
CapitalExpenditures
($1997 103)
211111 Crude Oil andNatural GasExtraction
1992 174,300 $8,331,849 $16,547,510 $10,860,260
1997 100,308 $4,968,722 $21,908,191 $21,117,850
211112 Natural GasLiquid Extraction
1992 12,000 $509,272 $23,382,770 $609,302
1997 10,549 $541,593 $20,359,528 $678,479
213111 Drilling Oil andGas Wells
1992 47,700 $1,358,784 $1,344,509 $286,509
1997 53,865 $1,918,086 $7,317,963 $2,209,300
213112 Oil and Gas FieldServices
1997 106,339 $3,628,416 $3,076,039 $1,165,018
Sources: U.S. Department of Commerce, Bureau of the Census. 1999a. 1997 Economic Census, Mining, IndustrySeries: Crude Petroleum and Natural Gas Extraction. EC97N-2111A. Washington, DC: U.S. Departmentof Commerce.
U.S. Department of Commerce, Bureau of the Census. 1995a. 1992 Census of Mineral Industries, Industry Series: Crude Petroleum and Natural Gas. MIC92-I-13A. Washington, DC: U.S. Department of Commerce.

50
United States produces approximately 40 percent (2,281 million barrels) of its annual crude oilconsumption, importing the remainder of its crude oil from Canada, Latin America, Africa, and theMiddle East (3,178 million barrels). Approximately 17 percent (3,152 billion cubic feet) of U.S. naturalgas supply is imported. Most imported natural gas originates in Canadian fields in the Rocky Mountainsand off the Coast of Nova Scotia and New Brunswick.
5.2.3 Demand Side
Characterizing the demand side of the industry involves describing product characteristics. Crude oil, or unrefined petroleum, is a complex mixture of hydrocarbons that is the most important ofthe primary fossil fuels. Refined petroleum products are used for petrochemicals, lubrication, heating,and fuel. Petrochemicals derived from crude oil are the source of chemical products such as solvents,paints, plastics, synthetic rubber and fibers, soaps and cleansing agents, waxes, jellies, and fertilizers. Petroleum products also fuel the engines of automobiles, airplanes, ships, tractors, trucks, and rockets. Other applications include fuel for electric power generation, lubricants for machines, heating, andasphalt (Berger and Anderson, 1978). Because the market for crude oil is global and its price set byOPEC, slight increases in the cost of producing crude oil in the United States will have little effect onthe price of products that use crude oil as an intermediate good. Production cost increases will beabsorbed by the producer, not passed along to consumers.
Natural gas is a colorless, flammable gaseous hydrocarbon consisting for the most part ofmethane and ethane. The largest single application for natural gas is as a domestic or industrial fuel. However, other specialized applications have emerged over the years, such as a nonpolluting fuel forbuses and other motor vehicles. Carbon black, a pigment made by burning natural gas with little air andcollecting the resulting soot, is an important ingredient in dyes, inks, and rubber compoundingoperations. Also, much of the world’s ammonia is manufactured from natural gas; ammonia is used
Table 5-16. Estimated U.S. Oil and Gas Reserves, Annual Production, and Imports, 1998
Category ReservesAnnual
Production Imports
Crude oil (106 barrels) 152,453 2,281 3,178
Natural gas (109 cubic feet) 1,330,930 18,708 3,152
Natural gas liquids (106 barrels) 26,792 246 NA
Sources: U.S. Department of Energy, Energy Information Administration (EIA). 1999h. U.S. Crude Oil, NaturalGas, and Natural Gas Liquids Reserves 1998 Annual Report. Washington, DC: U.S. Department ofEnergy.
U.S. Department of Energy, Energy Information Administration (EIA). 1999f. Petroleum Supply Annual 1998,Volume I. Washington DC: U.S. Department of Energy.

51
either directly or indirectly in urea, hydrogen cyanide, nitric acid, and fertilizers (Tussing and Tippee,1995).
5.2.4 Organization of the Industry
Many oil and gas firms are merging to remain competitive in both the global and domesticmarketplaces. By merging with their peers, these companies may reduce operating expenses and reapgreater economies of scale than they would otherwise. Recent mergers, such as BP Amoco and ExxonMobil, have reduced the number of companies and facilities operating in the United States. Currently,there are 20 domestic major oil and gas companies, and only 40 major global companies in the world(Conces, 2000). Most U.S. oil and gas firms are concentrated in states with significant oil and gasreserves, such as Texas, Louisiana, California, Oklahoma, and Alaska.
Tables 5-17 through 5-20 present the number of facilities and value of shipments by facilityemployee count for each of the four NIACS 211 industries. In 1997, 6,802 oil and gas extractioncompanies operated 7,781 facilities, an average of 1.14 facilities per company (see Table 5-17). Facilities with more than 100 employees produced more than 55 percent of the industry’s value ofshipments. Although the number of companies and the number of facilities operating in 1992 were bothgreater then than in 1997, the distribution of shipment values by employee size was similar to that of1992.
Facilities employing fewer than 50 people in the NGLs extraction industry accounted for64 percent, or $15.8 billion, of the industry’s total value of shipments in 1997 (see Table 5-18). Fourhundred eighty-seven of the industry’s 529 facilities are in that employment category. This also meansthat a relatively small number of larger facilities produced 36 percent of the industry’s annual output, interms of dollar value. The number of facilities with zero to four employees and the number with 50 ormore employees decreased during the 5-year period, accounting for most of the 10.5 percent decline inthe number of facilities from 1992 to 1997. The average number of facilities per company was 5.5 and5.9 in 1992 and 1997, respectively.

52
As mentioned earlier, the oil and gas well drilling industry’s 1997 value of shipments were106 percent larger than 1992’s value of shipments (see Table 5-19). However, the number of companiesprimarily involved in this industry declined by 327 over 5 years, and 487 facilities closed during thesame period. The distribution of the number of facilities by employment size shifted towards those thatemployed 20 or more people. In 1997, those facilities earned two-thirds of the industry’s revenues.
Table 5-17. Size of Establishments and Value of Shipments, Crude Oil and Natural GasExtraction Industry (NAICS 211111), 1997 and 1992
1997 1992
Average Number ofEmployees in Facility
Number ofFacilities
Value ofShipments ($1997
103)Number ofFacilities
Value ofShipments ($1997
103)
0 to 4 employees 5,249 $5,810,925 6,184 $5,378,330
5 to 9 employees 1,161 $3,924,929 1,402 $3,592,560
10 to 19 employees 661 $4,843,634 790 $4,504,830
20 to 49 employees 412 $10,538,529 523 $8,820,100
50 to 99 employees 132 $8,646,336 203 $5,942,130
100 to 249 employees 105 154 $11,289,730
250 to 499 employees 40 68 $8,135,850
500 to 999 employees 14 $41,318,227 46 $14,693,630
1,000 to 2,499 employees 5 18 $9,265,530
2,500 or more employees 2 3 D
Total 7,781 $75,162,580 9,391 $71,622,600
D = undisclosedSums do not add to totals due to independent rounding.
Sources: U.S. Department of Commerce, Bureau of the Census. 1999a. 1997 Economic Census, Mining, IndustrySeries: Crude Petroleum and Natural Gas Extraction. EC97N-2111A. Washington, DC: U.S.Department of Commerce.
U.S. Department of Commerce, Bureau of the Census. 1995a. 1992 Census of Mineral Industries, Industry Series:Crude Petroleum and Natural Gas. MIC92-I-13A. Washington, DC: U.S. Department of Commerce.

53
In 1997, 6,385 companies operated 7,068 oil and gas field services facilities, an average of 1.1facilities per company. Most facilities employed four or fewer employees; however, those facilitieswith 20 or more employees accounted for the majority of the industry’s revenues (see Table 5-20).
Table 5-18. Size of Establishments and Value of Shipments, Natural Gas Liquids Industry(NAICS 211112), 1997 and 1992
1997 1992
Average Number ofEmployees in Facility
Number ofFacilities
Value ofShipments ($1997
103)Number ofFacilities
Value ofShipments ($1997
103)
0 to 4 employees 143 $1,407,192 190 $2,668,000
5 to 9 employees 101 $1,611,156 92 $1,786,862
10 to 19 employees 122 $4,982,941 112 $5,240,927
20 to 49 employees 121 $7,828,439 145 $10,287,200
50 to 99 employees 35 $5,430,448 36 $4,789,849
100 to 249 employees 3 D 14 $2,205,819
250 to 499 employees 3 D 2 D
500 to 999 employees 1 D 0 —
1,000 to 2,499 employees 0 — 0 —
2,500 or more employees 0 — 0 —
Total 529 $24,828,503 591 $26,979,200
D = undisclosedSums do not add to totals due to independent rounding.
Sources: U.S. Department of Commerce, Bureau of the Census. 1999b. 1997 Economic Census, Mining, IndustrySeries: Natural Gas Liquid Extraction. EC97N-2111b. Washington, DC: U.S. Department of Commerce.
U.S. Department of Commerce, Bureau of the Census. 1995b. 1992 Census of Mineral Industries, Industry Series: Natural Gas Liquids. MIC92-I-13B. Washington, DC: U.S. Department of Commerce.

54
5.2.5 Markets and Trends
Between 1990 and 1998, crude oil consumption increased 1.4 percent per year, and natural gasconsumption increased 2.0 percent per year. The increase in natural gas consumption came mostly atthe expense of coal consumption (EPA, 1999b). The Energy Information Administration (EIA), a unitof the Department of Energy, anticipates that natural gas consumption will continue to grow at a similarrate through the year 2020 to 32 trillion cubic feet/year (DOE, EIA, 1999d). They also expect crude oilconsumption to grow at an annual rate of less than 1 percent over the same period.
Table 5-19. Size of Establishments and Value of Shipments, Drilling Oil and Gas Wells Industry(NAICS 213111), 1997 and 1992
1997 1992
Average Number ofEmployees in Facility
Number ofFacilities
Value ofShipments ($1997
103)Number ofFacilities
Value ofShipments ($1997
103)
0 to 4 employees 825 $107,828 1,110 $254,586
5 to 9 employees 215 $231,522 321 $182,711
10 to 19 employees 197 $254,782 244 $256,767
20 to 49 employees 200 $1,008,375 233 $572,819
50 to 99 employees 95 $785,804 120 $605,931
100 to 249 employees 75 $1,069,895 70 $816,004
250 to 499 employees 10 $435,178 19 $528,108
500 to 999 employees 14 $1,574,139 5 $97,254
1,000 to 2,499 employees 6 D 3 $238,427
2,500 or more employees 1 D — —
Total 1,638 $7,317,963 2,125 $3,552,707
D = undisclosedSums do not add to totals due to independent rounding.
Sources: U.S. Department of Commerce, Bureau of the Census. 1999c. 1997 Economic Census, Mining, IndustrySeries: Drilling Oil and Gas Wells. EC97N-2131A. Washington, DC: U.S. Department of Commerce.
U.S. Department of Commerce, Bureau of the Census. 1995c. 1992 Census of Mineral Industries, Industry Series: Oil and Gas Field Services. MIC92-I-13C. Washington, DC: U.S. Department of Commerce.

55
5.3 Natural Gas Pipelines
The natural gas pipeline industry (NAICS 4862) comprises establishments primarily engaged inthe pipeline transportation of natural gas from processing plants to local distribution systems. Alsoincluded in this industry are natural gas storage facilities, such as depleted gas fields and aquifers.
5.3.1 Introduction
The natural gas industry can be divided into three segments, or links: production, transmission,and distribution. Natural gas pipeline companies are the second link, performing the vital function oflinking gas producers with the local distribution companies and their customers. Pipelines transmitnatural gas from gas fields or processing plants through high compression steel pipe to their customers. By the end of 1998, there were more than 300,000 miles of transmission lines (OPS, 2000).
The interstate pipeline companies that linked the producing and consuming markets functionedmainly as resellers or merchants of gas until about the 1980s. Rather than acting as common carriers
Table 5-20. Size of Establishments and Value of Shipments, Oil and Gas Field Services (NAICS213112), 1997 and 1992
1997
Average Number of Employees at Facility Number of FacilitiesValue of Shipments
($1997 103)
0 to 4 employees 4,122 $706,396
5 to 9 employees 1,143 $571,745
10 to 19 employees 835 $904,356
20 to 49 employees 629 $1,460,920
50 to 99 employees 211 $1,480,904
100 to 249 employees 84 $1,175,766
250 to 499 employees 21 $754,377
500 to 999 employees 13 $1,755,689
1,000 to 2,499 employees 9 D
2,500 or more employees 1 D
Total 7,068 $11,547,563
D = undisclosedSums do not add to totals due to independent rounding.
Source: U.S. Department of Commerce, Bureau of the Census. 1999d. 1997 Economic Census, Mining, Industry Series: Support Activities for Oil and Gas Operations. EC97N-2131B. Washington, DC: U.S. Department of Commerce.

56
(i.e., providers only of transportation), pipelines typically bought and resold the gas to a distributioncompany or to some other downstream pipelines that would later resell the gas to distributers. Today,virtually all pipelines are common carriers, transporting gas owned by other firms instead ofwholesaling or reselling natural gas (Tussing and Tippee, 1995).
According to the U.S. Bureau of the Census, the natural gas pipeline industry’s revenues totaled$19.6 billion in 1997. Pipeline companies operated 1,450 facilities and employed 35,789 people(see Table 5-21). The industry’s annual payroll is nearly $1.9 billion.
As noted previously, the recent transition from the SIC system to the NAICS changed how someindustries are organized for information collection purposes and thus how certain economic census dataare aggregated. Some SIC codes were combined, others were separated, and some activities wereclassified under one NAICS code and the remaining activities classified under another. The natural gastransmission (pipelines) industry is an example of an industry code that was reclassified. Under NAICS,SIC 4922, natural gas transmission (pipelines), and a portion of SIC 4923, natural gas distribution, werecombined. The adjustments have made comparison between the 1992 and 1997 economic censesdifficult at this time. The U.S. Census Bureau has yet to publish a comparison report. Thus, for thisindustry only 1997 census data are presented.
5.3.2 Supply Side
Characterizing the supply side involves describing services provided by the industry,by-products, the costs of production, and capacity utilization.
5.3.2.1 Service Description
Natural gas is delivered from gas processing plants and fields to distributers via a nationwidenetwork of over 300,000 miles of transmission pipelines (NGSA et al., 2000a). The majority ofpipelines are composed of steel pipes that measure from 20 to 42 inches in diameter and operate 24hours a day. Natural gas enters pipelines at gas fields, storage facilities, or gas processing plants and is“pushed” through the pipe to the city gate or interconnections, the point at which distribution companies
Table 5-21. Summary Statistics for the Natural Gas Pipeline Industry (NAICS 4862), 1997
Establishments 1,450
Revenue ($103) $19,626,833
Annual payroll ($103) $1,870,950
Paid employees 35,789
Source: U.S. Department of Commerce, Bureau of the Census. 2000. 1997 Economic Census, Transportation andWarehousing: Geographic Area Series. EC97T48A-US. Washington, DC: Government Printing Office.

57
receive the gas. Pipeline operators use sophisticated computer and mechanical equipment to monitor thesafety and efficiency of the network.
Reciprocating stationary combustion engines compress and provide the pushing force needed tomaintain the flow of gas through the pipeline. When natural gas is transmitted, it is compressed toreduce the volume of gas and to maintain pushing pressure. The gas pressure in pipelines is usuallybetween 300 and 1,300 psi, but lesser and higher pressures may be used. To maintain compression andkeep the gas moving, compressor stations are located every 50 to 100 miles along the pipeline. Mostcompressors are large reciprocating engines powered by a small portion of the natural gas beingtransmitted through the pipeline.
There are over 8,000 gas compressing stations along U.S. gas pipelines, each equipped with oneor more engines. The combined output capability of U.S. compressor engines is over 20 million hp(NGSA et al., 2000a). Nearly 5,000 engines have individual output capabilities from 500 to over 8,000hp. The replacement cost of this subset of larger engines is estimated by the Gas Research Institute tobe $18 billion (Whelan, 1998).
Before or after natural gas is delivered to a distribution company, it may be stored in anunderground facility. Underground storage facilities are most often depleted oil and/or gas fields,aquifers, or salt caverns. Natural gas storage allows distribution and pipeline companies to serve theircustomers more reliably by withdrawing more gas from storage during peak-use periods and reduces thetime needed to respond to increased gas demand (NGSA et al., 2000b). In this way, storage guaranteescontinuous service, even when production or pipeline transportation services are interrupted.
5.3.2.2 By-products
According to the Natural Gas Supply Association (NGSA), about 3 percent of the natural gasmoved through pipelines escapes. The engines that provide pumping action at plants and push crude oiland natural gas through pipelines to customers and storage facilities produce HAPs. As notedpreviously, HAPs produced in engines include formaldehyde, acetaldehyde, acrolein, and methanol.
5.3.2.3 Costs of Production
Between 1996 and 2000, pipeline firms committed over $14 billion to 177 expansion and newconstruction projects. These projects added over 15,000 miles and 36,178 million cubic feet per day(MMcf/d) capacity to the transmission pipeline system. Table 5-22 summarizes the investments madein pipeline projects during the past 5 years. Building new pipelines is more expensive than expandingexisting pipelines. For the period covered in the table, the average cost per project mile was $862,000. However, the costs for pipeline expansions averaged $542,000, or 29 cents per cubic foot of capacityadded. New pipelines averaged $1,157,000 per mile at 48 cents per cubic foot of capacity.
Pipelines must pay for the natural gas that is consumed to power the compressor engines. Theamount consumed and the price paid have fluctuated in recent years. In 1998, pipelines consumed635,477 MMcf of gas, paying, on average, $2.01 per 1,000 cubic feet. Pipelines used less natural gas in

58
Tab
le 5
-22.
Sum
mar
y P
rofi
le o
f C
ompl
eted
and
Pro
pose
d N
atur
al G
as P
ipel
ine
Pro
ject
s, 1
996
to 2
000
All
Typ
e P
roje
cts
New
Pip
elin
esE
xpan
sion
s
Yea
r
Num
ber
ofP
roje
cts
Syst
emM
ileag
e
New
Cap
acit
y(M
Mcf
/d)
Pro
ject
Cos
ts (
$106 )
Ave
rage
Cos
tpe
r M
ile (
$103 )
Cos
ts p
erC
ubic
Foo
tC
apac
ity
(cen
ts)
Ave
rage
Cos
t pe
rM
ile (
$103 )
Cos
ts p
erC
ubic
Foo
tC
apac
ity
(cen
ts)
Ave
rage
Cos
t pe
rM
ile (
$103 )
Cos
ts p
erC
ubic
Foo
tC
apac
ity
(cen
ts)
1996
261,
029
2,57
4$5
52$4
4821
$983
17$2
8827
1997
423,
124
6,54
2$1
,397
$415
21$5
5422
$360
21
1998
543,
388
11,0
60$2
,861
$1,2
5730
$1,3
0131
$622
22
1999
363,
753
8,20
5$3
,135
$727
37$8
0546
$527
31
2000
194,
364
7,79
5$6
,339
$1,4
5081
$1,4
5591
$940
57
Tot
al17
715
,660
36,1
78$1
4,28
5$8
6239
$1,1
5748
$542
29
Not
e:Su
ms
may
not
add
to to
tals
bec
ause
of
inde
pend
ent r
ound
ing.
Sour
ce:
U.S
. Dep
artm
ent o
f E
nerg
y, E
nerg
y In
form
atio
n A
dmin
istr
atio
n (E
IA).
199
9d.
Nat
ural
Gas
199
8: I
ssue
s an
d T
rend
s. W
ashi
ngto
n, D
C:
U.S
. Dep
artm
ent
of E
nerg
y.

59
1998 than in previous years; the price paid for that gas fluctuated between $1.49 and $2.29 between1994 and 1997 (see Table 5-23). For companies that transmit natural gas through their own pipelinesthe cost of the natural gas consumed is considered a business expense.
5.3.2.4 Capacity Utilization
During the past 15 years, interstate pipeline capacity has increased significantly. In 1990, thetransmission pipeline system’s capacity was 74,158 MMcf/day (see Table 5-24). By the end of 1997,capacity reached 85,847 MMcf/day, an increase of approximately 16 percent. The system’s usage hasincreased at a faster rate than capacity. The average daily flow was 60,286 MMcf/day in 1997, a22 percent increase over 1990’s rates. Currently, the system operates at approximately 72 percent ofcapacity.
Table 5-23. Energy Usage and Cost of Fuel, 1994-1998
Year Pipeline Fuel (MMcf)Average Price ($ per 1,000 cubic
feet)
1994 685,362 1.70
1995 700,335 1.49
1996 711,446 2.27
1997 751,470 2.29
1998 635,477 2.01
Source: U.S. Department of Energy, Energy Information Administration (EIA). 1999e. Natural Gas Annual 1998. Washington, DC: US Department of Energy.
Table 5-24. Transmission Pipeline Capacity, Average Daily Flows, and Usage Rates, 1990 and1997
1990 1997 Percent Change
Capacity (MMcf per day) 74,158 85,847 16
Average Flow (MMcf per day) 49,584 60,286 22
Usage Rate (percent) 68 72 4
Source: U.S. Department of Energy, Energy Information Administration. 1999d. Natural Gas 1998: Issues and Trends. Washington, DC: US Department of Energy.
60
5.3.3 Demand Side
Most pipeline customers are local distribution companies that deliver natural gas from pipelinesto local customers. Many large gas users will buy from marketers and enter into special deliverycontracts with pipelines. However, local distribution companies (LDCs) serve most residential,commercial, and light industrial customers. LDCs also use compressor engines to pump natural gas toand from storage facilities and through the gas lines in their service area.
While economic considerations strongly favor pipeline transportation of natural gas, liquifiednatural gas (LNG) emerged during the 1970s as a transportation option for markets inaccessible topipelines or where pipelines are not economically feasible. Thus, LNG is a substitute for natural gastransmission via pipelines. LNG is natural gas that has been liquified by lowering its temperature. LNGtakes up about 1/600 of the space gaseous natural gas takes up, making transportation by ship possible. However, virtually all of the natural gas consumed in the United States reaches its consumer market viapipelines because of the relatively high expense of transporting LNG and its volatility. Most marketsthat receive LNG are located far from pipelines or production facilities, such as Japan—the world’slargest LNG importer, Spain, France, and Korea (Tussing and Tippee, 1995).
5.3.4 Organization of the Industry
Much like other energy-related industries, the natural gas pipeline industry is dominated by largeinvestor-owned corporations. Smaller companies are few because of the real estate, capital, andoperating costs associated with constructing and maintaining pipelines (Tussing and Tippee, 1995). Many of the large corporations are merging to remain competitive as the industry adjusts torestructuring and increased levels of competition. Increasingly, new pipelines are built by partnerships: groups of energy-related companies share capital costs through joint ventures and strategic alliances(DOE, EIA, 1999d). Ranked by system mileage, the largest pipeline companies in the United States areEl Paso Energy (which recently merged with Southern Natural Gas Co.), Enron, Williams Cos., CoastalCorp., and Duke Energy (see Table 5-25). El Paso Energy and Coastal intend to merge in mid-2000.
5.3.5 Markets and Trends
During the past decade, interstate pipeline capacity has increased 16 percent. Many existingpipelines underwent expansion projects, and 15 new interstate pipelines were constructed. In 1999 and2000, proposals for pipeline expansions and additions called for a

61
$9.5 billion investment, an increase of 16.0 billion cubic feet per day of capacity (DOE, EIA, 1999d).
The EIA (1999d) expects natural gas consumption to grow steadily, with demand forecasted toreach 32 trillion cubic feet by 2020. The expected increase in natural gas demand has significantimplications for the natural gas pipeline system.
The EIA (1999d) expects the interregional pipeline system, a network that connects the lower 48states and the Canadian provinces, to grow at an annual rate of 0.7 percent between 2001 and 2020. However, natural gas consumption is expected to grow at more than twice that annual rate, 1.8 percent,over that same period. The majority of the growth in consumption is expected to be fueled by theelectric generation sector. According to the EIA, a key issue is what kinds of infrastructure changes willbe required to meet this demand and what the financial and environmental costs will be of expanding thepipeline network.
The EIA addresses the discrepancy between annual consumption growth and interregionalpipeline capacity growth with the following explanation: “Overall, interregional pipeline capacity
Table 5-25. Five Largest Natural Gas Pipeline Companies by System Mileage, 2000
Company HeadquartersSales
($1999 106)Employment
(1999)Miles ofPipeline
El Paso Energy CorporationIncl. El Paso Natural Gas Co.
Southern Natural Gas Co.Tennessee Gas Pipe Line Co.
Houston, TX $5,782 4,700 40,200
Enron CorporationIncl. Northern Border Pipe Line Co.
Northern Natural Gas Co.Transwestern Pipeline Co.
Houston, TX $40,112 17,800 32,000
Williams Companies, Inc.Incl. Transcontinental Gas Pipe Line
Northwest Pipe Line Co.Texas Gas Pipe Line Co.
Tulsa, OK $8,593 21,011 27,000
The Coastal CorporationIncl. ANR Pipeline Co.
Colorado Interstate Gas Co.
Houston, TX $8,197 13,000 18,000
Duke Energy CorporationIncl. Panhandle Eastern Pipeline Co.
Algonquin Gas Transmission Co.Texas Eastern Transmission Co.
Charlotte, NC $21,742 21,000 11,500
Sources: Heil, Scott F., Ed. Ward’s Business Directory of U.S. Private and Public Companies 1998, Volume 5.Detroit, MI: Gale Research Inc.
Sales, employment, and system mileage: Hoover’s Incorporated. 1998. Hoover’s Company Profiles. Austin, TX: Hoover’s Incorporated. <http://www.hoovers.com/>.

62
(including imports) is projected to grow at an annual rate of only about 0.7 percent between 2001 and2020 (compared with 3.7 percent between 1997 and 2000 and 3.8 percent between 1990 and 2000). However, EIA also forecasts that consumption will grow at a rate of 27 Bcf per day (1.8 percentannually) during the same period. The difference between these two growth estimates is predicted uponthe assumption that capacity additions to support increased demand will be local expansions of facilitieswithin regions (through added compression and pipeline looping) rather than through new long-haul(interregional) systems or large-scale expansions” (1999d, p. 125).

63
REFERENCES
1998-99 GTW Handbook. “Turnkey Combined Cycle Plant Budget Price Levels.” Fairfield, CT: PequotPub. Pgs 19-26.
Berger, Bill D. and Kenneth E. Anderson. 1978. Modern Petroleum: A Basic Primer of the Industry. Tulsa, OK: The Petroleum Publishing Co.
Cliburn, J.K. 2001. “Local Governments Turn to Municipal Aggregation.” Public Power Magazine. (January–February).
Conces, Elaine. 2000. “Hoover’s Online—Energy Industry Snapshot.” As obtained on April 18, 2000. <http://www.hoovers.com/industry/snapshot/0,2204,16,00.html>.
Dahl, Carol A., and Thomas E. Duggan. 1996. “U.S. Energy Product Supply Elasticities: A Survey andApplication to the U.S. Oil Market.” Resource and Application Economics 18:243-263.
Edison Electric Institute (EEI). 1998. Statistical Yearbook of the Electric Utility Industry 1997. November. Washington, DC.
Edison Electric Institute (EEI). 1999. “The Rise of the Power Marketer.”<http://www.eei.org/issues/comp-reg/6riseofp.htm>. As obtained on August 11, 1999.
General Electric Corporation. GE Power Plants. <www.ge.com>. As obtained on November 3, 1999.
Haltmaier, Susan. 1998. “Electricity Production and Sales.” In U.S. Industry & Trade Outlook ‘98,DRI/McGraw-Hill, Standard & Poor’s, and U.S. Department of Commerce/international TradeAdministration. New York: McGraw-Hill. pp. 5-1 to 5-9.
Hay, Nelson E., ed. 1988. Guide to Natural Gas Cogeneration. Lilburn, GA: The Fairmont Press, Inc.
Heil, Scott F., Ed. 1998. Ward’s Business Directory of U.S. Private and Public Companies 1998,Volume 5. Detroit, MI: Gale Research Inc.
Hoover’s Incorporated. 1998. Hoover’s Company Profiles. Austin, TX: Hoover’s Incorporated.<http://www.hoovers.com/>.
Industrial Combustion Coordinated Rulemaking (ICCR). 1998. Data/Information Submitted to theCoordinating Committee at the Final Meeting of the Industrial Combustion CoordinatedRulemaking Federal Advisory Committee. EPA Docket Numbers A-94-63, II-K-4b2 through -4b5. Research Triangle Park, North Carolina. September 16-17.

64
Lillis, Kevin. 1998. “Crude Petroleum and Natural Gas.” In U.S. Industry and Trade Outlook ‘98.New York: DRI/McGraw-Hill, Standard & Poor’s, and U.S. Department ofCommerce/International Trade Administration. pp. 3-1 to 3-8.
Natural Gas Supply Association (NGSA) et al. 2000a. “Transportation of Natural Gas.” <http://www.naturalgas.org/TRANS.htm>. As obtained on March 22, 2000.
Natural Gas Supply Association (NGSA) et al. 2000b. “Storage of Natural Gas.” <http://www.naturalgas.org/STOR2.htm>. As obtained on March 22, 2000.
Natural Gas Supply Association (NGSA) et al. 2000c. “Natural Gas Production.” <http://www.naturalgas.org/PRODUCT.HTM>. As obtained on March 22, 2000.
Office of Pipeline Safety (OPS), U.S. Department of Transportation. 2000. “Annual Mileage Totals: Transmission & Distribution.” <http://www.ops.dot.gov/gtannual.htm>. As obtained on March22, 2000.
Resource Data International. 1999. “PMA Online Top 25 Power Marketer Rankings.” PowerMarketers Online Magazine. <http://www.powermarketers.com/top25a.htm.> As obtained onAugust 11, 1999.
Reuters News Service. November 10, 1999. “EIA Sees Cheaper Power, Rising Carbon, Less Nukes.” Reuters News Service.
Taylor, Melanie. May 17, 2000. Memorandum: Cost-Effectiveness Strategies of Above-the-FloorMACT Options for Existing Stationary Combustion Turbines. To: Sinis Roy,EPA/OAQPS/ESD/Combustion Group.
Seimens Westinghouse. August 31, 1999. Presentation.
Siemens. Fossil Power Generation. <www.siemens.de/kwv/e/foa/f/products/gvd.htm>. As obtained onNovember 3, 1999.
Tussing, Arlon R., and Bob Tippee. 1995. The Natural Gas Industry: Evolution, Structure, andEconomics. 2nd Edition. Tulsa, OK: PennWell Publishing Company.
U.S. Department of Commerce, Bureau of the Census. 1995a. 1992 Census of Mineral Industries,
Industry Series: Crude Petroleum and Natural Gas. MIC92-I-13A. Washington, DC: U.S.Department of Commerce.
U.S. Department of Commerce, Bureau of the Census. 1995b. 1992 Census of Mineral Industries,
Industry Series: Natural Gas Liquids. MIC92-I-13B. Washington, DC: U.S. Department ofCommerce.

65
U.S. Department of Commerce, Bureau of the Census. 1995c. 1992 Census of Mineral Industries,
Industry Series: Oil and Gas Field Services. MIC92-I-13C. Washington, DC: U.S. Departmentof Commerce.
U.S. Department of Commerce, Bureau of the Census. 1999a. 1997 Economic Census, Mining,
Industry Series: Crude Petroleum and Natural Gas Extraction. EC97N-2111A. Washington,DC: U.S. Department of Commerce.
U.S. Department of Commerce, Bureau of the Census. 1999b. 1997 Economic Census, Mining,
Industry Series: Natural Gas Liquid Extraction. EC97N-2111b. Washington, DC: U.S.Department of Commerce.
U.S. Department of Commerce, Bureau of the Census. 1999c. 1997 Economic Census, Mining,
Industry Series: Drilling Oil and Gas Wells. EC97N-2131A. Washington, DC: U.S.Department of Commerce.
U.S. Department of Commerce, Bureau of the Census. 1999d. 1997 Economic Census, Mining,
Industry Series: Support Activities for Oil and Gas Operations. EC97N-2131B. Washington,DC: U.S. Department of Commerce.
U.S. Department of Commerce, Bureau of the Census. 2000. 1997 Economic Census, Transportation
and Warehousing: Geographic Area Series. EC97T48A-US. Washington, DC: GovernmentPrinting Office.
U.S. Department of Energy, Energy Information Administration (EIA). 1996a. The Changing Structure
of the Electric Power Industry: An Update. DOE/EIA-0562(96). Washington, DC: U.S.Department of Energy.
U.S. Department of Energy, Energy Information Administration (EIA). 1996b. Electric Power Annual
1995. Volumes I and II. DOE/EIA-0348(95)/1. Washington, DC: U.S. Department of Energy.
U.S. Department of Energy, Energy Information Administration (EIA). 1997. Financial Statistics ofMajor U.S. Investor-Owned Electric Utilities, 1996. Washington, DC: U.S. Department ofEnergy.
U.S. Department of Energy, Energy Information Administration (EIA). 1998a. Financial Statistics ofMajor Publicly Owned Electric Utilities, 1997. Washington, DC: U.S. Department of Energy.
U.S. Department of Energy, Energy Information Administration (EIA). 1998b. The Changing Structure
of the Electric Power Industry: Selected Issues, 1998. DOE/EIA-0562(98). Washington, DC: U.S. Department of Energy.
U.S. Department of Energy, Energy Information Administration (EIA). January 1998c. Model
Documentation Report: Industrial Sector Demand Module of the National Energy ModelingSystem. DOE/EIA-M064(98). Washington, DC: U.S. Department of Energy.

66
U.S. Department of Energy, Energy Information Administration (EIA). “Annual Energy Outlook1999—Market Trend—Electricity.” <http://www.eia.doe.gov/oiaf/aeo99/electricity.html>. Asaccessed November 15, 1999a.
U.S. Department of Energy, Energy Information Administration (EIA), Office of Integrated Analysisand Forecasting. “Competitive Electricity Price Projections.” <http://www.eia.doe.gov/oia/elepri97/chap3.html>. As obtained on November 15, 1999b.
U.S. Department of Energy, Energy Information Administration (EIA). 1999c. Electric Power Annual,
1998. Volumes I and II. Washington, DC: U.S. Department of Energy.
U.S. Department of Energy, Energy Information Administration (EIA). 1999d. Natural Gas 1998: Issues and Trends. Washington, DC: U.S. Department of Energy.
U.S. Department of Energy, Energy Information Administration (EIA). 1999e. Natural Gas Annual
1998. Washington, DC: U.S. Department of Energy.
U.S. Department of Energy, Energy Information Administration (EIA). 1999f. Petroleum SupplyAnnual 1998, Volume I. Washington DC: U.S. Department of Energy.
U.S. Department of Energy, Energy Information Administration (EIA). 1999g. The Changing Structure
of the Electric Power Industry 1999: Mergers and Other Corporate Combinations. Washington,DC: U.S. Department of Energy.
U.S. Department of Energy, Energy Information Administration (EIA). 1999h. U.S. Crude Oil, Natural
Gas, and Natural Gas Liquids Reserves 1998 Annual Report. Washington, DC: U.S.Department of Energy.
U.S. Department of Energy, Energy Information Administration (EIA). 2000. Electric Power Annual
1999, Volume II. Washington, DC: U.S. Department of Energy.
U.S. Department of Energy, Energy Information Administration (EIA). “Supplement Tables to theAEO 2000.” <http://www.eia.doe.gov/oiaf/aeo/supplement/index.html>. As obtained on June20, 2001.
U.S. Environmental Protection Agency. 1999a. Economic Analysis Resource Document. ResearchTriangle Park, NC: Office of Air Quality Planning and Standards.
U.S. Environmental Protection Agency. 1999b. EPA Office of Compliance Sector Notebook Project:
Profile of the Oil and Gas Extraction Industry. Washington, DC: U.S. EnvironmentalProtection Agency.
Whelan, Michael. 1998. “Improving Compressor Station Performance: Getting at the Heart of theMatter.” <http://www.gri.org/pub/content/sep/19990923/145119/wtcompressor12.html>.